
Half-year Financial Report
Summary by AI BETAClose X

27 October 2026
REVOLUTION BEAUTY GROUP PLC
("Revolution Beauty", the "Group" or the "Company")
HALF YEAR RESULTS FOR THE SIX MONTHS ENDED 31 AUGUST 2026
Revolution Beauty Group plc (AIM: REVB), the multi-channel mass beauty brand, today announces its unaudited Half Year Results for the six months ended 31 August 2026 (“H1 27” or the "Period").
A strong first half with the turnaround firmly on track: Adjusted EBITDA of £2.0m, a £14.5m improvement on the £12.5m loss in H1 26.
Higher-quality revenue: gross margin up 11.4 percentage points to 43.6%, with revenue broadly in line with the prior year at £48.4m, despite H1 26 being flattered by clearance sales and sales of discontinued brands. Underlying revenue grew 8.3%iii.
A lean, disciplined cost base: operating costs reduced by almost a third (32.7%) to £19.1m.
Online salesiv up 22%, reflecting growing consumer engagement with the brand.
Positive Adjusted EBITDA in every month for thirteen consecutive months to 30 September 2026.
Strong start to H2 27 – trading at the top end of current market expectations*.
|
H1 27 £ million |
H1 26 £ million |
Change |
Revenue |
48.4 |
49.4 |
-2.0% |
Gross profit |
21.1 |
15.9 |
+32.7% |
Gross margin |
43.6% |
32.2% |
+11.4ppts |
Operating costsi |
19.1 |
28.4 |
-32.7% |
Adjusted EBITDAii |
2.0 |
(12.5) |
+£14.5m |
% of revenue |
4.1% |
(25.3)% |
+29.4ppts |
Operating loss |
(0.9) |
(16.7) |
+£15.8m |
Loss before tax |
(1.9) |
(18.4) |
+£16.5m |
Cash and cash equivalents |
4.3 |
1.8 |
+£2.5m |
Net debt |
(25.7) |
(30.2) |
+£4.5m |
Gross inventory |
30.8 |
34.1 |
-£3.3m |
i Operating costs is defined as Distribution & Administrative costs excluding depreciation, amortisation, adjusting items set out in note 6 & share based payment charges.
ii Adjusted EBITDA is an alternative performance measure used by management to gauge the underlying performance of the business, and is defined as Operating Loss adjusted for depreciation and amortisation, impairments and reversals of impairment, profits and losses on the disposal of assets, share based charges and releases and operating adjusting items as disclosed in note 6 to the accounts.
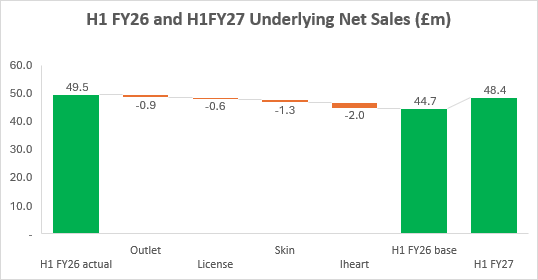
iii Underlying revenue is an alternative performance measure representing the base level of revenue after accounting for significant non-recurring items in the prior year. Underlying revenue for H1 26 was £44.7m and H1 27 revenue of £48.4m represents growth of 8.3%
iv Online sales is an alternative performance measure used by management to measure the revenues from key online platforms which is regarded as a future indicator of brand health and a leading indicator for bricks and mortar sales. The key online platforms are revolutionbeauty.com, TikTok shop and Amazon.
Financial highlights
Revenue of £48.4m (H1 26: £49.4m), broadly in line with the prior year. Excluding discontinued brands, outlet clearance sales and non-recurring licence income in the prior period, underlying revenue grew by 8.3%.
UK revenue returned to growth, up 1.7% to £15.6m, with the recovery of our UK digital channels more than offsetting the exit from the Relove and iHeart brands. US revenue was £10.2m (H1 26: £10.5m) and Rest of World revenue £22.6m (H1 26: £23.5m), down 2.8% and 4.0% respectively after the non-repeat of non-recurring licence sales and the exit from discontinued brands, with new customers won in both our international direct and distributor channels.
Gross margin of 43.6% (H1 26: 32.2%), an improvement of 11.4 percentage points, reflecting the absence of prior-year clearance activity, significantly lower gross-to-net charges and much improved range and inventory management.
Operating costs reduced by £9.3m (32.7%) to £19.1m (H1 26: £28.4m), with savings delivered across distribution, marketing and administration.
Adjusted EBITDA profit of £2.0m (H1 26: loss of £12.5m), representing 4.1% of revenue. Operating loss reduced by £15.8m to £0.9m and loss before tax reduced by £16.5m to £1.9m.
Cash adjusting items reduced by £1.4m (85%) to £0.3m (H1 FY26: £1.7m) as restructuring costs and legacy legal costs fell.
Net debt reduced by £4.5m year on year to £25.7m (31 August 2025: £30.2m) and broadly stable against the year-end position of £24.7m, despite the seasonal working capital build ahead of the second half. Cash of £4.3m was held (31 August 2025: £1.8m).
Gross inventory reduced by £3.3m to £30.8m year on year, with a fresher, more focused range supporting better availability for our retail partners.
Operational and strategic highlights
The first six months of the first full year under the founder-led management team, with Tom Allsworth as CEO and Adam Minto driving product strategy, re-focusing on the strengths that originally drove Revolution Beauty’s success: on-trend, affordable products, sharp pricing and speed to market, combined with tighter management control of costs and stock.
Rebuilt ranges and a refreshed new product development pipeline. Retailer order books show that product and range changes are beginning to have a positive impact with retail customers.
Strong digital momentum, with online salesiv up 22%, driven by TikTok Shop.
New licensing partnership with Debenhams Group, announced in June 2026, for fragrance and gifting under the PrettyLittleThing, Karen Millen and boohooMAN brands, with the first collections launching ahead of Christmas.
Over £9m of annualised cost savings delivered in FY26 now fully embedded, giving the Group a simpler, more agile and appropriately sized cost base.
A retail footprint of c.17,500 doors across leading retailers in the UK, US and international markets, supported by Revolution Beauty’s UK manufacturing facility.
Current trading and outlook
The momentum built in the first half has continued into the second. Trading in September and October has been in line with the Board's expectations and the Group has now delivered positive Adjusted EBITDA in every month for thirteen consecutive months to 30 September 2026.
The second half is seasonally the larger contributor to the Group's profitability. Sales and order books for the autumn/winter and Christmas trading period are encouraging, supported by refreshed ranges, continued growth online and the first collections under the Debenhams Group licensing partnership.
With a materially stronger gross margin, a lean cost base and a refreshed product pipeline, the Board remains confident that the Group is trading at the top end of the current range of market expectations* for the full year, which were upgraded following the Company’s trading update on 17 September 2026, and remains focused on delivering growth, improved profitability and cash generation beyond FY27.
Tom Allsworth, Chief Executive Officer, said:
“I am delighted with the progress we have made in the first half. When Adam and I came back to the business, we set out to get Revolution doing what it does best – bold, on-trend, affordable beauty, brought to market quickly – on a platform that is profitable and properly controlled. These results show we are doing exactly that: gross margin is up more than 11 percentage points, our cost base is a third lower, and we have turned a £12.5m EBITDA loss into a £2.0m profit.
Our customers are responding. Online sales are up 22%, our retail partners are backing our new ranges, and we are opening up exciting new opportunities such as our licensing partnership with Debenhams Group.
I would like to thank the whole Revolution team, whose energy and commitment have made this possible. We enter the all-important second half with real momentum, and I am very excited about the future of Revolution Beauty.”
Iain McDonald, Chairman, said:
“This is a very encouraging set of results which shows that the turnaround of Revolution Beauty is well under way. The Board’s first priority was to put the business on a sound and disciplined footing and that has been achieved, with the Group now EBITDA positive in every month for over a year.
Our focus now turns to growth. Revolution is a much-loved brand with a strong retail footprint and an engaged, digitally native customer base, and the Board believes it has the potential to be a very large business. I would like to thank Tom, Adam and the whole team, together with our shareholders, banking partners and retail customers, for their continued support.”
* The Board believes that current market expectations for the year ending 28 February 2027, based on the two analysts who publish forecasts on the Group, are revenue in the range of £92.0 to £95.0 million and adjusted EBITDA in the range of £6.0m to £6.6 million.
For further information please contact:
Investor Relations
Tom Allsworth, CEO
Neil Catto, CFO
Investor.Relations@revolutionbeautyplc.com
Nominated Adviser
Strand Hanson Limited: Christopher Raggett/Carl Holmes/Imogen Ellis
Tel: +44 (0) 207 409 3494
Broker
Zeus: Dominic King /Jordan Warburton
Tel: +44 (0) 161 831 1512
Media enquiries
Tavistock: Simon Hudson/Rebecca Hislaire/Saskia Sizen
Tel: +44 (0)20 7920 3150
About Revolution Beauty
Revolution Beauty is a global mass beauty and personal care business which operates a multi brand, multi category strategy and sells its products both direct-to-consumer (DTC) via its e-commerce operations, and in physical and digital retailers through wholesale relationships.
Today, the Group has a retail footprint of c.17,500 doors across leading retail chains in the UK, USA and other international markets. Revolution Beauty has access to a wide customer base, predominantly aged between 16 and 35, through its digital partners and own DTC platform. It has established and invested to streamline its supply chain with its own manufacturing facility in the UK, and third-party warehousing facilities across the UK, USA and Australia. Revolution Beauty currently employs 226 people.
Chief Executive Officer’s Review
Introduction
This marks the first reporting period delivered in full under the leadership of the current management team, and I am pleased with the progress we have made. While there remains much more to do, these results demonstrate the early impact of the actions taken to simplify the business, improve profitability and refocus the Group on its core strengths.
Compared with the half-year announcement last year, the business has made significant progress. Gross margin has improved materially, our cost base has been substantially reduced, and we have delivered a return to positive Adjusted EBITDA. Just as importantly, we have strengthened the quality of our revenue, improved inventory management and rebuilt momentum across our digital and retail channels.
These results represent an important milestone in the turnaround of Revolution Beauty and provide a solid foundation for further growth and profitability as we move through the second half of the year and beyond.
Performance Review
Although reported revenue was 2.0% lower year-on-year at £48.4 million (H1 2026: £49.4 million), we believe the business is in a significantly stronger position than the headline comparison suggests. The prior year included substantial clearance sales, discontinued brands and non-recurring licence revenue, whereas the current period reflects a much healthier and more sustainable sales mix. Excluding these factors, underlying revenue grew by 8.3%. The improved quality of revenue, together with substantial gross margin expansion and cost reductions, drove a significant improvement in profitability, with adjusted EBITDA improving from a loss of £12.5 million to a profit of £2.0 million. Gross profit for the period was £21.1 million (H1 2026: £15.9 million), resulting in a gross margin of approximately 43.6%, this increase was due to the prior year being affected by clearance sales undertaken to reduce inventory and generate cash. Administrative costs decreased to £9.7 million (H1 2026: £15.6 million), while marketing and distribution costs reduced to £12.1 million (H1 2026: £17.0 million) as the Group scaled back promotional activity.
Overall, the Group recorded a loss before tax of £1.9 million (H1 26: £18.4 million), demonstrating the significant progress made in the turnaround of the business over the past year. While encouraged by this improvement, we recognise that there remains considerable work to do as we continue to drive growth and profitability.
Reflection on the Period
The first half represents an important milestone for the business as the first reporting period delivered in full under the current management team. We are encouraged by the progress made to address many of the challenges that previously impacted performance, including improving product ranges, strengthening inventory management, simplifying operations and rebuilding customer engagement. While there remains significant opportunity ahead, the foundations are now in place to shift our focus increasingly towards sustainable growth and expanding the business over the longer term.
Looking Ahead
Our ambition for Revolution Beauty remains unchanged: to build a highly profitable, fast-growing global beauty business. We are pleased with the progress made over the past year and encouraged by the tangible improvements delivered across profitability, margins, operations and customer engagement. Through this process we have also developed a much clearer understanding of both the opportunities available to us and the challenges that remain to be addressed.
While it is satisfying to see how far the business has come, we view this as just the beginning. With stronger foundations now in place, we can increasingly focus our efforts on accelerating growth, expanding our market opportunity and unlocking the full potential of the Revolution Beauty brand.
Finally, I would like to thank the entire Revolution team. I continue to be equally impressed by and grateful for the talent, passion and commitment of our colleagues, whose hard work has been central to the progress achieved so far and will be critical to our future success.
Financial Review
Revenue
Group revenue for the first half of FY27 was £48.4m, a decline of 2.0% from £49.4m in H1 2026, reflecting the discontinuation of certain skincare brands, outlet clearance sales and non-recurring licence income in the prior period. Excluding these impacts, underlying revenue grew by 8.3%, as shown in the bridge below.
Digital revenue was stable at £7.0m, in line with the prior year.
Store Group revenue decreased by 2.3% to £41.4m from £42.4m, driven by the discontinuation of certain brands, categories and products.
From a geographic perspective, UK revenue increased by 1.7%, from £15.4m to £15.6m, impacted by the removal of the iHeart and Relove brands, offset by the recovery of our digital channels in the UK.
In the United States, revenue decreased by 2.8% to £10.2m, with some non-recurring licence sales in the prior year not being repeated in FY27, offset by space changes across our customers.
In the Rest of the World, revenue decreased by 4.0% to £22.6m. As in the UK, the removal of the Relove and iHeart brands had an impact on sales, as did the performance of the SKIN range. Both our International direct and distributor channels are showing promising signs of recovery under the current leadership, with new customers in both channels during H1.
Gross Margin
Gross margin for the Period was 43.6% (H1 2026: 32.2%). Margin performance has favourably improved due to last year’s performance being impacted by significant clearance activity in the first half, as well as substantial gross to net revenue charges in H1 2026 driven by underperforming licenses, the transition from Relove to Makeup Revolution at Walmart and other retailer markdowns in the US damaging the underlying product sales margin.
During the first half of this year, the business improved inventory and range management, whilst also supporting better availability to our customers and a reduction in excess stock.
Adjusted EBITDA and Operating Loss
Adjusted EBITDA for the Period was a profit of £2.0m (H1 2026: loss of £12.5m). This improvement reflects the higher gross margin and reduction in operating costs during the Period. Management are pleased to report cost savings across all cost areas as the management team have had the opportunity to control the business coming into FY27. This cost control is driving improved profitability, alongside the recovery of revenue performance.
Distribution, marketing and administrative costs excluding amortisation, depreciation and adjusting items for the period were as follows:
|
6 month period ended 31 August 2026 |
6 month period ended 31 August 2025 |
% change |
|
Unaudited |
Unaudited |
|
|
£m |
£m |
|
|
|
|
|
Distribution costs |
6.0 |
7.9 |
-24% |
Marketing costs |
6.1 |
9.1 |
-33% |
Administrative costs |
7.0 |
11.4 |
-39% |
Total operating costs |
19.1 |
28.4 |
-33% |
|
|
|
|
The operating loss for the Period was £0.9m, compared with a loss of £16.7m in H1 2026.
The loss before tax was £1.9m (H1 2026: loss of £18.4m), after finance income of £0.05m and finance costs of £1.1m during the Period.
The reported loss after tax was £2.0m, compared with a loss of £18.4m in H1 2026.
Cash
The Group ended the Period with a cash balance of £4.3m, and gross borrowing amounted to £30.0m.
The Group generated cash of £1.0m from operating activities during the Period. This reflected working capital movements, including a £6.3m increase in payables, partially offset by increases in inventories and receivables of £3.8m and £3.5m respectively. After capital expenditure of £1.2m, interest payments of £1.1m and payments of lease liabilities of £0.3m, cash and cash equivalents decreased by £1.6m during the Period before the effect of exchange rate changes.
The Group has sufficient cash resources and covenant headroom to finance its current organic growth plans.
CONSOLIDATED CONDENSED STATEMENT OF COMPREHENSIVE INCOME
FOR THE HALF-YEAR ENDED 31 AUGUST 2026
|
Note |
6 months ended 31 August 2026
|
6 months ended 31 August 2025
|
Year ended 28 February 2026 |
|
|
Unaudited |
Unaudited |
Audited |
|
|
£’000 |
£’000 |
£’000 |
|
|
|||
Revenue |
4 |
48,423 |
49,391 |
102,141 |
Cost of sales |
|
(27,275) |
(33,482) |
(64,469) |
|
|
|
|
|
Gross profit |
|
21,148 |
15,909 |
37,672 |
|
|
|
|
|
Marketing and distribution costs |
|
(12,331) |
(17,017) |
(27,216) |
|
|
|
|
|
Administrative expenses |
|
|
|
|
- General administrative expenses |
|
(9,671) |
(15,630) |
(27,997) |
- Impairment losses on financial assets |
|
- |
- |
(902) |
- Provision for onerous contracts |
|
- |
- |
(1,231) |
- Impairment of property, plant and equipment |
|
- |
- |
(3,771) |
- Reversal of Impairment of property, plant and equipment and right of use assets |
|
- |
- |
402 |
|
|
|
|
|
Total administrative expenses |
|
(9,671) |
(15,630) |
(33,499) |
|
|
|
|
|
Operating Loss |
|
(854) |
(16,738) |
(23,043) |
|
|
|
|
|
Finance income |
|
49 |
61 |
132 |
Finance costs |
|
(1,089) |
(1,745) |
(7,734) |
|
|
|
|
|
Loss before taxation |
|
(1,894) |
(18,422) |
(30,645) |
|
|
|
|
|
Income tax expense |
|
(133) |
- |
(241) |
|
|
|
|
|
Loss for the year/period |
|
(2,027) |
(18,422) |
(30,886) |
|
|
|
|
|
Other comprehensive expense for the period, net of tax |
|
|
|
|
|
|
|
|
|
Exchange differences |
|
753 |
1,574 |
1,131 |
|
|
|
|
|
Total Comprehensive Loss for the period |
|
(1,274) |
(16,848) |
(29,755) |
|
|
|
|
|
Loss per share (p) |
5 |
(0.2) |
(5.7) |
(5.6) |
Diluted loss per share (p) |
5 |
(0.2) |
(5.7) |
(5.6) |
Adjusted EBITDA |
6 |
2,032 |
(12,491) |
(8,174) |
*Adjusted EBITDA is a non-GAAP measure and is defined as Operating Loss adjusted for depreciation and amortisation, impairments and reversals of impairment, profits and losses on the disposal of assets, share based charges and releases and operating adjusting items as disclosed in note 6.
The total comprehensive loss for the period is entirely attributable to the owners of the parent company.
The above consolidated condensed statement of comprehensive income should be read in conjunction with the accompanying notes.
REVOLUTION BEAUTY GROUP PLC (Company Number: 11666025)
CONSOLIDATED CONDENSED STATEMENT OF FINANCIAL POSITION
AS AT 31 August 2026
|
Notes |
31 August 2026
|
31 August 2025
|
28 February 2026 |
|
|
Unaudited |
Unaudited |
Audited |
ASSETS |
|
£’000 |
£’000 |
£’000 |
Non-current assets |
|
|||
Intangible assets |
|
3,928 |
4,436 |
4,357 |
Property, plant and equipment |
|
7,772 |
9,585 |
7,867 |
Right-of-use assets |
|
449 |
624 |
851 |
Other receivables |
|
817 |
1,521 |
1,172 |
Deferred tax asset |
|
- |
13 |
- |
|
|
12,966 |
16,179 |
14,247 |
Current assets |
|
|
|
|
Inventories |
8 |
22,824 |
24,841 |
18,999 |
Trade and other receivables |
9 |
30,742 |
29,196 |
26,882 |
Cash and cash equivalents |
|
4,267 |
1,840 |
5,864 |
|
|
|
|
|
Total current assets |
|
57,833 |
55,877 |
51,745 |
|
|
|
|
|
Current liabilities |
|
|
|
|
Lease liabilities |
|
(442) |
(679) |
(679) |
Trade and other payables |
10 |
(59,041) |
(63,687) |
(52,168) |
Provisions |
|
(792) |
- |
(1,314) |
Borrowings |
7 |
(2,078) |
(32,000) |
(1,058) |
Deferred consideration |
|
(600) |
(600) |
(866) |
Corporation tax payable |
|
- |
145 |
(3) |
Deferred tax liability |
|
(154) |
- |
(162) |
|
|
|
|
|
Total current liabilities |
|
(63,107) |
(96,821) |
(56,250) |
|
|
|
|
|
Net current liabilities |
|
(5,274) |
(40,944) |
(4,505) |
|
|
|
|
|
Total assets less current liabilities |
|
7,692 |
(24,765) |
9,742 |
|
|
|
|
|
Non-current liabilities |
|
|
|
|
Lease liabilities |
|
(210) |
(104) |
(381) |
Borrowings |
|
(27,937) |
- |
(29,486) |
Deferred consideration |
|
(10,174) |
(8,757) |
(10,408) |
Provisions |
|
(1,394) |
(173) |
(540) |
|
|
|
|
|
Total non-current liabilities |
|
(39,715) |
(9,034) |
(40,815) |
|
|
|
|
|
Net liabilities |
|
(32,023) |
(33,799) |
(31,073) |
|
|
|
|
|
Equity |
|
|
|
|
Share capital |
|
8,697 |
3,201 |
8,697 |
Share premium |
|
113,520 |
103,487 |
113,520 |
Warrant reserve |
|
7,239 |
7,239 |
7,239 |
Merger reserve |
|
14,860 |
14,860 |
14,860 |
Translation reserve |
|
1,926 |
1,616 |
1,173 |
Retained earnings |
|
(178,265) |
(164,202) |
(176,562) |
|
|
|
|
|
Total deficit |
|
(32,023) |
(33,799) |
(31,073) |
|
|
|
|
|
CONSOLIDATED CONDENSED STATEMENT OF CHANGES IN EQUITY
FOR THE HALF-YEAR ENDED 31 AUGUST 2026
|
|
Share capital |
Share premium |
Warrant reserve |
Merger reserve |
Translation reserve |
Retained earnings |
Total equity |
|
|
£’000 |
£’000 |
£’000 |
£’000 |
£’000 |
£’000 |
£’000 |
|
|
|
|
|
|
|
|
|
Balance at 1 March 2025 |
|
3,199 |
103,487 |
7,239 |
14,860 |
42 |
(145,888) |
(17,061) |
|
|
|
|
|
|
|
|
|
Loss for the period |
|
- |
- |
- |
- |
- |
(18,422) |
(18,422) |
|
|
|
|
|
|
|
|
|
Other comprehensive expense net of taxation: |
|
|
|
|
|
|
|
|
Foreign operations – foreign currency translation differences |
|
- |
- |
- |
- |
1,574 |
- |
1,574 |
|
|
|
|
|
|
|
|
|
Total comprehensive loss for the period |
|
- |
- |
- |
- |
1,574 |
(18,422) |
(16,848) |
|
|
|
|
|
|
|
|
|
Transactions with owners in their capacity as owners: |
|
|
|
|
|
|
|
|
Issue of shares, net of transaction costs |
|
2 |
- |
- |
- |
- |
- |
2 |
Share-based payments |
|
- |
- |
- |
- |
- |
108 |
108 |
|
|
|
|
|
|
|
|
|
Total transactions with owners |
|
2 |
- |
- |
- |
- |
108 |
110 |
|
|
|
|
|
|
|
|
|
|
|
|
|
|
|
|
|
|
|
|
|
|
|
|
|
|
|
Balance at 31 August 2025 |
|
3,201 |
103,487 |
7,239 |
14,860 |
1,616 |
(164,202) |
(33,799) |
|
|
|
|
|
|
|
|
|
The above consolidated statement of changes in equity should be read in conjunction with the accompanying notes
CONSOLIDATED CONDENSED STATEMENT OF CHANGES IN EQUITY
FOR THE HALF-YEAR ENDED 31 August 2026
|
|
Share capital |
Share premium |
Warrant reserve |
Merger reserve |
Translation reserve |
Retained earnings |
Total equity |
|
|
£’000 |
£’000 |
£’000 |
£’000 |
£’000 |
£’000 |
£’000 |
|
|
|
|
|
|
|
|
|
Balance at 1 March 2026 |
|
8,697 |
113,520 |
7,239 |
14,860 |
1,173 |
(176,562) |
(31,073) |
|
|
|
|
|
|
|
|
|
Loss for the period |
|
- |
- |
- |
- |
- |
(2,027) |
(2,027) |
|
|
|
|
|
|
|
|
|
Other comprehensive expense net of taxation: |
|
|
|
|
|
|
|
|
Foreign operations – foreign currency translation differences |
|
- |
- |
- |
- |
753 |
- |
753 |
|
|
|
|
|
|
|
|
|
Total comprehensive loss for the period |
|
- |
- |
- |
- |
753 |
(2,027) |
(1,274) |
|
|
|
|
|
|
|
|
|
Transactions with owners in their capacity as owners: |
|
|
|
|
|
|
|
|
Share-based payments |
|
- |
- |
- |
- |
- |
324 |
324 |
|
|
|
|
|
|
|
|
|
Total transactions with owners |
|
- |
- |
- |
- |
- |
324 |
324 |
Balance at 31 August 2026 |
|
8,697 |
113,520 |
7,239 |
14,860 |
1,926 |
(178,265) |
(32,023) |
|
|
|
|
|
|
|
|
|
The above consolidated statement of changes in equity should be read in conjunction with the accompanying notes
CONSOLIDATED CONDENSED STATEMENT OF CASH FLOWS
FOR THE HALF-YEAR ENDED 31 August 2026
|
6 months ended 31 August 2026
|
6 months ended 31 August 2025
|
Year ended 28 February 2026 |
|
Unaudited |
Unaudited |
Audited |
|
£’000 |
£’000 |
£’000 |
Cash flows from operating activities |
|||
Profit/ (Loss) for the financial period |
(2,027) |
(18,422) |
(30,886) |
|
|
|
|
Adjustments for: |
|
|
|
Taxation |
8 |
- |
241 |
Finance costs |
1,089 |
1,745 |
7,734 |
Finance income |
(49) |
- |
(132) |
Depreciation of property, plant and equipment |
2,037 |
2,080 |
5,057 |
Net Impairment of property, plant and equipment |
- |
- |
3,369 |
Impairment losses on financial assets |
- |
- |
902 |
Amortisation of intangible assets |
267 |
330 |
672 |
Equity settled share-based payment expense |
324 |
108 |
212 |
Provisions movement |
332 |
(228) |
1,453 |
|
|
|
|
Movements in working capital: |
|
|
|
Movement in inventories |
(3,825) |
(3,406) |
2,436 |
Movement in receivables |
(3,505) |
2,237 |
9,573 |
Movement in payables |
6,319 |
14,923 |
(3,469) |
|
|
|
|
Cash generated from/(used in) operating activities |
970 |
(633) |
(2,838) |
|
|
|
|
Income tax paid |
- |
(111) |
- |
|
|
|
|
Net cash generated from/(used in) operating activities |
970 |
(744) |
(2,838) |
|
|
|
|
Cash flows from investing activities |
|
|
|
Purchase of intangible assets |
(23) |
(31) |
(491) |
Purchase of property, plant and equipment |
(1,181) |
(681) |
(5,704) |
|
|
|
|
Net cash used in investing activities |
(1,204) |
(712) |
(6,195) |
|
|
|
|
Cash flows from financing activities |
|
|
|
Interest paid |
(1,089) |
(1,745) |
(2,596) |
Proceeds from issue of shares, net of transaction costs |
- |
- |
15,531 |
Repayment of bank loans |
- |
- |
(4,000) |
Payment of lease liabilities |
(284) |
(523) |
(318) |
|
|
|
|
Net cash generated from financing activities |
(1,373) |
(2,268) |
8,617 |
|
|
|
|
|
|
|
|
Cash and cash equivalents |
|
|
|
Net decrease in the period |
(1,607) |
(3,724) |
(416) |
Cash and cash equivalents at the beginning of the period |
5,864 |
5,690 |
5,690 |
Effects of exchange rate changes |
10 |
(126) |
590 |
|
|
|
|
Cash and cash equivalents at the end of the period |
4,267 |
1,840 |
5,864 |
|
|
|
|
NOTES TO THE CONSOLIDATED CONDENSED INTERIM FINANCIAL STATEMENTS
FOR THE HALF-YEAR ENDED 31 August 2026
- General information
Revolution Beauty Group Plc (“the Company”) is a public company limited by shares and is registered and incorporated in England and Wales, with company number 11666025 and domiciled in the United Kingdom. The registered office is 2-3 Sheet Glass Road, Cullet Drive, Queenborough, Kent, ME11 5JS.
The group (“the Group”) consists of Revolution Beauty Group Plc and all of its subsidiaries.
The Board of Directors approved this unaudited interim financial information on 26 October 2026.
- Material accounting policies
The condensed consolidated unaudited interim financial statements (“interim financial statements”) for the period 1 March 2026 to 31 August 2026 are unaudited. The group has chosen not to adopt IAS 34 “Interim Financial Statements” in preparing the interim financial information. The condensed consolidated interim financial statements incorporate unaudited comparative figures for the interim period from 1 March 2025 to 31 August 2025 and the audited financial year ended 28 February 2026.
The Interim financial statements for the six months ended 31 August 2026 have been prepared on the basis of the accounting policies expected to be adopted for the year ended 28 February 2027. These are in accordance with the accounting policies as set out in the Group's last annual consolidated financial statements for the year ended 28 February 2026.
The comparative figures for the year ended 28 February 2026 do not constitute the Group’s statutory accounts for 2026 as defined in Section 434(3) of the Companies Act 2006. Statutory accounts for 2026 have been delivered to the Registrar of Companies. The Independent Auditor's report on the Annual Report and Financial Statements for 2026 contained a statement by way of emphasis in respect of going concern. The independent auditor’s report for 2026 filed with the Registrar of Companies contains information in respect of each matter that has contributed to an unqualified opinion.
These Condensed Consolidated Interim Financial Statements do not include all the information required for full Annual Financial Statements and should be read in conjunction with the Annual Financial Statements of the Group as at and for the year ended 28 February 2026.
Tax charged within the 6 months ended 31 August 2026 has been calculated by applying the effective rate of tax which is expected to apply to the Group for the year ending 28 February 2027.
The interim financial statements have been prepared on the historical cost basis except for, where disclosed in the accounting policies, certain financial instruments that are measured at fair value. The interim financial statements are prepared in Sterling, which is the functional currency and presentational currency of the parent Company and primary operating subsidiary. Monetary amounts in these interim financial statements are rounded to the nearest £1,000.
New Policies and Standards
At the date of authorisation of these Condensed Consolidated Interim Financial Statements, several new standards and amendments to existing standards have been issued, some of which are effective. None of these standards and amendments have a material impact on the Group, other than IFRS 18 Presentation and Disclosure in Financial Statements, which is effective for periods beginning on or after 1 January 2027 and will impact the presentation and disclosure of the Group's financial statements for HY28 results.
The preparation of the Condensed Consolidated Interim Financial Statements requires management to make judgments, estimates and assumptions that affect the application of accounting policies and the reported amounts of assets and liabilities, income and expense. The resulting accounting estimates will, by definition, seldom equal the related actual results. The Group's latest Annual Financial Statements for the year ended 28 February 2026, which are available via Revolution Beauty Group plc's website, set out the key sources of estimation uncertainty and the critical judgements that were made in preparing those Financial Statements.
Going concern
The Directors have considered the Group’s ability to continue as a going concern, taking into account available cash, current trading performance, forecast profitability and liquidity, forecast compliance with financial covenants and sensitivities, together with the mitigating actions available to management. Trading performance in the financial year to date has been ahead of the base case forecast underpinning the going concern assessment, providing additional headroom against the assumptions reflected in that forecast.
The Group continues to operate under its amended and extended Revolving Credit Facility (“RCF”), which matures on 31 July 2028. The key assumptions underpinning the going concern assessment include the delivery of cost reduction initiatives, management of discretionary expenditure, improvement in working capital and other liquidity preservation measures. The Directors recognise that the successful delivery of these actions, together with the assumptions underpinning the base case forecast, including the Board's current assessment of ongoing commercial matters and claims, is subject to inherent uncertainty and is not wholly within the Group's control. These assumptions are subject to uncertainty and, if not achieved, would adversely affect the Group's forecast profitability, and compliance with the liquidity covenant.
The Directors have also considered a severe but plausible downside scenario which assumes a reduction in the realisation of planned cost-saving initiatives and improvements in working capital. In the absence of further successful mitigating actions, this scenario would result in the Group breaching the financial covenants under its financing arrangements during the assessment period.
After considering the Group’s current liquidity position, the amended and extended RCF, forecast cash flows and the mitigating actions available to management, the Directors have concluded that it remains appropriate to prepare the Condensed Consolidated Interim Financial Statements on the going concern basis and have a reasonable expectation that the Group will have adequate resources to continue in operational existence and meet its liabilities as they fall due for at least twelve months from the date of approval of these financial statements. The financial statements have therefore been prepared on the going concern basis. They do not include any adjustments that would result if the Group were unable to continue as a going concern.
However, the Directors recognise that the Group's ability to maintain sufficient liquidity to comply with its financing covenants remains dependent on the successful delivery of the assumptions underpinning the base case forecast, including the outcome of ongoing commercial matters and claims, together with the successful implementation of management's planned mitigating actions. As these matters are subject to uncertainty and are not wholly within the Group's control, the Directors have concluded that a material uncertainty exists that may cast significant doubt on the Group's ability to continue as a going concern and therefore may be unable to realise its assets and discharge its liabilities in the normal course of business.
- Segmental reporting
IFRS 8 Operating Segments requires that operating segments be identified on the basis of internal reporting and decision-making. The Group identifies operating segments based on internal management reporting that is regularly reported to and reviewed by the board of directors, which is identified as the chief operating decision maker. Management information is reported as one operating segment, being revenue from sales of products.
- Revenue
An analysis of the Group’s revenue is as follows: |
6 month period ended 31 August 2026 |
6 month period ended 31 August 2025 |
Year ended 28 February 2026 |
|
Unaudited |
Unaudited |
Audited |
|
£’000 |
£’000 |
£’000 |
Revenue analysed by class of business |
|
|
|
Digital |
6,987 |
6,996 |
18,465 |
Store Groups |
41,436 |
42,395 |
83,676 |
|
|
|
|
|
48,423 |
49,391 |
102,141 |
|
|
|
|
|
|
|
|
|
|
|
|
Revenue analysed by geographical location |
|
|
|
United Kingdom |
15,620 |
15,354 |
33,649 |
United States of America |
10,236 |
10,532 |
22,190 |
Rest of World |
22,567 |
23,505 |
46,302 |
|
|
|
|
|
48,423 |
49,391 |
102,141 |
|
|
|
|
- Earnings per share
The Group reports basic and diluted earnings per common share. Basic earnings per share is calculated by dividing the profit attributable to common shareholders of the Company by the weighted average number of common shares outstanding during the period.
Diluted earnings per share is determined by adjusting the profit attributable to common shareholders by the weighted average number of common shares outstanding, taking into account the effects of all potential dilutive common shares, including options.
|
6 month period ended 31 August 2026 |
6 month period ended 31 August 2025 |
Year ended 28 February 2026 |
|
Unaudited |
Unaudited |
Audited |
|
|
|
|
Loss attributable to shareholders (£’000) |
(2,027) |
(18,422) |
(30,886) |
Weighted average number of shares (‘000) |
869,717 |
319,442 |
554,628 |
|
|
|
|
Basic loss per share (p) |
(0.2) |
(5.7) |
(5.6) |
|
|
|
|
|
|
|
|
|
|
|
|
Total comprehensive loss attributable to the owners of the company (£’000) |
(2,027) |
(18,422) |
(30,886) |
Weighted average number of shares (‘000) |
869,717 |
319,442 |
554,628 |
Dilutive effect of share options |
- |
- |
- |
|
|
|
|
Diluted loss per share (p) |
(0.2) |
(5.7) |
(5.6) |
|
|
|
|
Pursuant to IAS 33, options whose exercise price is higher than the value of the Company’s security were not taken into account in determining the effect of dilutive instruments. The calculation of diluted earnings per share does not assume conversion, exercise, or other issue of potential ordinary shares that would have an antidilutive effect on earnings per share.
- Adjusted performance measures
The Group uses a number of Alternative Performance Measures (“APMs”) in addition to those measures reported in accordance with IFRS. Such APMs are not defined terms under IFRS and are not intended to be a substitute for any IFRS measure. The Directors believe that the APMs are important when assessing the underlying financial and operating performance of the Group.
The APMs are used internally in the management of the Group’s business performance, budgeting and forecasting, and for determining Executive Directors’ remuneration and that of other management throughout the Group. The APMs are also presented externally to meet investors’ requirements for further clarity and transparency of the Group’s financial performance. Where items of profits or costs are being excluded in an APM, these are included elsewhere in our reported financial information as they represent actual income or costs of the Group.
The Group’s Alternative Performance Measures are set out below.
Adjusted EBITDA
Adjusted EBITDA is defined as Operating profit/(loss) adjusted for depreciation and amortisation, impairments and reversals of impairment, profits and losses on the disposal of assets, share based payment charges and releases and adjusting items.
|
6 month period ended 31 August 2026 |
6 month period ended 31 August 2025 |
Year ended 28 February 2026 |
|
Unaudited |
Unaudited |
Audited |
|
£’000 |
£’000 |
£’000 |
|
|
|
|
Operating loss |
(854) |
(16,738) |
(23,043) |
Amortisation of intangible assets |
267 |
330 |
672 |
Depreciation of property, plant and equipment |
2,037 |
2,080 |
5,057 |
Net Impairment of property, plant and equipment |
- |
- |
3,369 |
Share-based payments |
324 |
128 |
212 |
Operating items adjusted for: |
|
|
|
Restructuring costs |
114 |
235 |
1,552 |
Provision for settlement of legal cases |
- |
- |
- |
Adjusting legal fees |
144 |
1,474 |
1,736 |
Provision for onerous contract |
- |
- |
1,231 |
Inventory provision relating to transition to distribution model |
- |
- |
138 |
Expected credit loss on financial assets |
- |
- |
902 |
|
|
|
|
Adjusted EBITDA |
2,032 |
(12,491) |
(8,174) |
Depreciation, amortisation and impairments |
(2,304) |
(2,410) |
(9,098) |
Adjusted EBIT |
(272) |
(14,901) |
(17,272) |
Net finance income/ (costs) |
(1,040) |
(1,684) |
(7,734) |
Loss on loan modification |
- |
- |
2,819 |
Adjusted PBT |
(1,312) |
(16,585) |
(22,187) |
|
|
|
|
Operating adjusting items
During the period, the Group incurred legal fees associated with the following matters, each of which were determined to be exceptional and outside the normal course of business:
- £144k of professional fees associated with non-recurring legal cases undertaken during the period.
- £114k in restructuring and redundancy costs in relation to moving to a distribution model in New Zealand.
- Borrowings
|
31 August 2026 |
31 August 2025 |
28 February 2026 |
|
Unaudited |
Unaudited |
Audited |
|
£’000 |
£’000 |
£’000 |
|
|
|
|
Bank revolving credit facility |
30,015 |
32,000 |
30,544 |
|
|
|
|
|
30,015 |
32,000 |
30,544 |
|
|
|
|
|
|
|
|
Payable within one year |
2,078 |
32,000 |
1,058 |
Payable after one year |
27,937 |
- |
29,486 |
|
|
|
|
- Inventories
|
31 August 2026 |
31 August 2025 |
28 February 2026 |
|
Unaudited |
Unaudited |
Audited |
|
£’000 |
£’000 |
£’000 |
|
|
|
|
Net Raw materials and work in progress |
527 |
1,784 |
1,285 |
Net Finished goods and goods for resale |
22,297 |
23,057 |
17,714 |
|
|
|
|
|
22,824 |
24,841 |
18,999 |
|
|
|
|
Value of inventory provided for at period end |
(7,993) |
(8,941) |
(9,822) |
Value of inventory (written down)/written back during period |
(948) |
2,681 |
1,828 |
|
|
|
|
The total cost of inventories recognised as an expense in cost of sales in the period was £26,892,000 (Period ended August 2025: £31,795,000, full year ended February 2026: £61,840,000).
As set out in note 3 to the financial statements in the Group’s Annual Report. The Group’s inventory provision methodology is made up of a net realisable value (NRV) component and a slow-moving component. The slow-moving component includes a provision for inventory that has recently been launched and therefore has limited sales history and also for more mature inventory, which is assessed based on its sales cover, which gives rise to the key source of estimation uncertainty.
The NRV provision is determined by assessing the latest sales price of an SKU, less the cost of selling it, against the cost of purchasing it. There is judgment applied in assessing the costs included in selling each SKU. The Group determines cost to sell on an average basis across all SKUs. The cost to sell includes the incremental costs of selling, such as commissions, as well as non-incremental selling costs including expected marketing costs and expected costs to hold the inventory until the anticipated time of sale.
- Trade and Other Receivables
|
31 August 2026
|
31 August 2025
|
28 February 2026
|
|
Unaudited |
Unaudited |
Audited |
Current |
£’000 |
£’000 |
£’000 |
Trade Receivables |
28,725 |
27,264 |
24,152 |
Other Receivables |
569 |
667 |
220 |
Prepayments |
1,448 |
1,265 |
2,510 |
|
|
|
|
|
30,742 |
29,196 |
26,882 |
|
|
|
|
Non-Current |
|
|
|
Other Receivables |
817 |
1,521 |
1,172 |
|
|
|
|
|
817 |
1,521 |
1,172 |
|
|
|
|
- Trade and Other Payables
Trade and other payables are initially recognised at fair value less transaction costs and subsequently measured at amortised cost using the effective interest rate method, with all movements being recognised in the statement of comprehensive income. Cost is considered to approximate fair value.
|
31 August 2026
|
31 August 2025
|
28 February 2026
|
|
Unaudited |
Unaudited |
Audited |
|
£’000 |
£’000 |
£’000 |
Trade Payables |
35,586 |
29,898 |
30,008 |
Other Taxation and Social Security |
1,321 |
1,194 |
1,115 |
Other Payables |
156 |
157 |
124 |
Accruals and Contract Liabilities |
21,978 |
32,438 |
20,921 |
|
|
|
|
|
59,041 |
63,687 |
52,168 |
|
|
|
|
RNS may use your IP address to confirm compliance with the terms and conditions, to analyse how you engage with the information contained in this communication, and to share such analysis on an anonymised basis with others as part of our commercial services. For further information about how RNS and the London Stock Exchange use the personal data you provide us, please see our Privacy Policy.

Latest directors dealings
- 59 minutes ago IWG
- 59 minutes ago Porvair
- 13 hours ago Colefax Group
- 15 hours ago Hays
- 15 hours ago Aberdeen Group plc