
Half-year Financial Report
Summary by AI BETAClose X

POLAR CAPITAL GLOBAL HEALTHCARE TRUST PLC
(the "Company")
Unaudited Results Announcement for the Six Months to 31 March 2026
|
LEI: 549300YV7J2TWLE7PV84 |
29 May 2026 |
FINANCIAL HIGHLIGHTS
|
Performance |
For the six months to 31 March 2026 |
For the year to 30 September 2025 |
|
Net asset value per Ordinary share (total return) * |
2.94% |
-5.86% |
|
Share price total return* |
3.34% |
-4.94% |
|
Benchmark index MSCI ACWI Healthcare Index (total return in sterling with dividends reinvested) |
7.19% |
-7.81% |
|
Expenses (note 1) |
|
|
|
Ongoing charges* |
0.95% |
0.90% |
|
Financials |
(Unaudited) As at 31 March 2026 |
(Audited) As at 30 September 2025 |
Change |
|
Total net assets^ |
£377,054,000 |
£448,110,000 |
-15.86% |
|
Net asset value per Ordinary share |
379.46p |
369.51p |
2.69% |
|
Price per Ordinary share |
366.00p |
355.00p |
3.10% |
|
Discount per Ordinary share* |
3.55% |
3.93% |
|
|
Net gearing/(cash)* |
4.95% |
-1.83% |
|
|
Ordinary shares in issue (excluding those held in treasury) |
99,365,000 |
121,270,000 |
-18.06% |
|
Ordinary shares held in treasury |
24,784,256 |
2,879,256 |
760.79% |
|
Dividends paid and declared in the period: |
Pay Date |
Amount per Ordinary share |
Record Date |
Ex-Dividend Date |
Declared date |
|
The Company has paid the following dividend relating to the financial year ended 30 September 2025: |
27 February 2026 |
1.00p |
6 February 2026 |
5 February 2026 |
13 January 2026 |
|
Dividends for the current financial year ending 30 September 2026, if declared, will be paid in August 2026 and February 2027. . |
|||||
|
Note 1 |
Ongoing charges represent the total expenses of the Company, excluding finance costs, transaction costs, tax and non-recurring expenses expressed as a percentage of the average daily net asset value, in accordance with AIC guidance issued in July 2022. The ongoing charges figure as at 31 March 2026 is for the six month period from 30 September 2025 and is annualised for comparison with the full year's calculation as at 30 September 2025.
*See Alternative Performance Measures below. ^The change in net assets reflects the repurchase of 22.47% of the Company's shares pursuant to the tender offer completed on 28 November 2025, as well as the issuance of shares from treasury.
All data sourced from Polar Capital LLP/HSBC
|
|
For further information please contact: |
Tracey Lago FCG Company Secretary Polar Capital Global Healthcare Trust plc |
Tel: 020 7227 2700 |
INTERIM MANAGEMENT REPORT
CHAIR'S STATEMENT
On behalf of the Board, I am pleased to provide to you the Company's Half Year Report for the six-months to 31 March 2026.
PERFORMANCE AND OUTLOOK
The period under review has been very much a story of two parts. In the first few months the Company's performance benefited from the continued resurgence of interest in the healthcare sector which began in late summer 2025 as concerns over US tariffs and policies began to wane and more certainty over the detail and potential impact emerged.
During this period, as the Company was approaching the end of its fixed life, and following consultation with shareholders with respect to the strategy and structure, the Board put forward a proposal to shareholders for the restructuring of the Company, including a clause to extend the Company's life indefinitely. Alongside this, it proposed a 100% tender offer to allow an exit opportunity for those shareholders who did not wish to remain invested. The Board was delighted that the proposals were passed by over 90% of votes cast at the General Meeting held on 27th November 2025. The Board was pleased with the results of the tender offer with almost 80% of the share capital remaining invested. Following the completion of the tender offer the Company continued to see good demand with 6.3m shares issued from Treasury to date at a premium to NAV, representing 5.1% of the issued share capital.
Since late January the backdrop has changed dramatically and has been very challenging, initially driven by broader market fears of those companies whose business models were perceived to be potentially rendered obsolete by rapid developments in the use of AI. This was shortly followed by the heightened geopolitical uncertainty and associated market volatility in March 2026.
Whilst performance over the longer term has been positive, the challenging environment in the final two months of the period under review resulted in the Company underperforming its benchmark (MSCI ACWI Healthcare Index) in the six month period to 31st March 2026, delivering a Net Asset Value per share total return of 2.94% versus a benchmark return of 7.19%.
Whilst the geopolitical landscape has become much more challenging, creating increased uncertainty for investors, we remain very optimistic about the outlook for the healthcare sector and the investment opportunities that may arise. The innovation cycle remains strong and the demand for healthcare products and services continues to be robust, with emerging markets especially buoyant and we continue to see increasing M&A with several acquisitions announced during the period under review.
Further details are provided in the Investment Manager's report below.
THE BOARD
As reported in the Company's latest Annual Report, Neal Ransome stepped down as Chair of the Audit Committee at the Company's AGM on 26 February 2026 and was succeeded by Caroline Gulliver. Neal will remain on the Board until November 2026 as part of a smooth and orderly transition. There have been no other changes to the Board or its Committees in the six months to 31 March 2026. The Directors' biographical details are available on the Company's website and are provided in the Annual Report.
GEARING
Under the Articles of Association the Company may utilise an overall maximum gearing limit of 15 per cent. of NAV at the time of drawdown for tactical deployment when the Board believes that gearing will enhance returns to shareholders.
Following the successful completion of the 2025 tender offer, the Company put in place a three-year term-loan of £40m with RBS at a fixed all-in-rate of 4.88%. This loan is due to be repaid in February 2029 at which time the facility will be reviewed and may be replaced. The Board believes that the ability to utilise gearing actively (where market conditions are favourable), with the potential to enhance future returns, is a key attraction of the investment trust structure. At the period end, the term loan had been fully drawn down.
PRINCIPAL RISKS AND UNCERTAINTIES
A detailed explanation of the Company's principal risks and uncertainties, and how they are managed through mitigation and controls, can be found on pages 35 to 37 of the Annual Report for the year ended 30 September 2025. The principal risks and uncertainties are categorised into four main areas: Portfolio Management, Operational Risk, Regulatory Risk and Economic/Market Risk. The Directors consider that, overall, the principal risks and uncertainties faced by the Company for the remaining six months of the financial year have not materially changed from those outlined within the Annual Report.
Further detail on the Company's performance and portfolio can be found in the Investment Manager's Report.
GOING CONCERN
As detailed in the notes to the financial statements, the Board continually monitors the financial position of the Company and has undertaken an assessment in determining the appropriateness of preparing the Financial Statements on a going concern basis. Having carried out this assessment, the Directors are satisfied that it is appropriate to continue to adopt the going concern basis in preparing the financial results of the Company. In reaching this conclusion, the Board also considered the Company's performance and its assessment of any material uncertainties and events that might cast significant doubt upon the Company's ability to continue as a going concern.
RELATED PARTY TRANSACTIONS
In accordance with DTR 4.2.8R, there have been no new related party transactions during the six-month period to 31 March 2026. There have been no changes in any related party transaction described in the last Annual Report that could have a material effect on the financial position or performance of the Company in the first six months of the current financial year or to the date of this report.
STATEMENT OF DIRECTORS' RESPONSIBILITIES
The Directors of Polar Capital Global Healthcare Trust plc confirm to the best of their knowledge that:
· The condensed set of financial statements has been prepared in accordance with UK-adopted International Accounting Standard 34 and gives a true and fair view of the assets, liabilities, financial position and profit or loss of the Company as at 31 March 2026; and
· The Interim Management Report includes a fair review of the information required by the Disclosure Guidance and Transparency Rules 4.2.7R and 4.2.8R.
The half year financial report for the six-month period to 31 March 2026 has not been audited or reviewed by the Auditors. The half year financial report was approved by the Board on 29 May 2026.
On behalf of the Board
Lisa Arnold
Chair
INVESTMENT MANAGER'S REVIEW
Executive summary
Over the six-month period to the end of March 2026, the Company's net asset value (NAV) underperformed its benchmark, returning 2.94% compared to 7.19% for its benchmark, the MSCI All Country World Daily Total Return Health Care Index (both figures in sterling terms).
It has been a volatile first six months of the financial year, with the artificial intelligence (AI) 'super-cycle' the dominant theme at the beginning but, as the period drew to a close, the best performing sectors were an unusual mix of defensives such as staples and utilities alongside cyclicals such as energy, industrial and materials. With regards the healthcare sector, the mega-cap (>$100bn) and large-cap ($10-100bn) stocks posted positive returns, while mid-cap ($5-10bn) and small-cap (<US$5bn) stocks struggled.
Key drivers of the underperformance were not enough capital allocated to mega- capitalisation (cap) stocks, too much capital allocated to mid-cap stocks, coupled with subpar stock selection in life sciences tools and services, pharmaceuticals, healthcare services and facilities.
In terms of subsectors, pharmaceuticals, distributors and biotechnology performed well, with pharmaceuticals rerating following the agreements made by companies with the Trump administration to protect themselves from tariffs and worst-case drug pricing pressure. The biotechnology subsector continues to innovate and is experiencing a wave of M&A (mergers and acquisitions) whereas distributors are very defensive and have delivered a steady stream of positive earnings revisions. In contrast, healthcare technology, managed care and healthcare equipment struggled.
The near-term uncertainty and volatility being generated by the implications of geopolitical unrest in the Middle East and AI have been unsettling for investors, with fears of a repeat of the 2022 scenario of rising interest rates and slowing economic growth. If this does occur, it would be supportive for defensive sectors with high gross and operating margins, such as large-cap healthcare companies. Looking further out, there is a high level of confidence that the industry will continue to innovate and successfully launch new products and devices into large commercial markets. Further, there appears to be a concerted effort to improve access to care and to generate much-needed efficiencies which should ensure that the outlook for the industry, and investors, remains a positive and sustainable one.
Performance: 30 September 2025 to 31 March 2026
In dollar terms, global equity markets were largely unchanged in the first six months of the financial year.
The final quarter of calendar 2025 and the first couple of months of 2026 were characterised by a continuation of the solid momentum the broader market started to experience in mid-2025, driven by a de-escalation of the tariff-related trading tensions, ongoing excitement surrounding AI and the expectation of future Federal Reserve interest rate cuts. Deep cyclical sectors such as energy, industrials and materials performed strongly in this period, alongside emerging markets, smaller cap and value stocks.
However, the relatively upward trend of the market came to an abrupt end in March. Equity market performance during this month was shaped largely by developments in the Middle East. Following the 28 February US/Israeli strikes on Iran, the conflict continued throughout March and shipping flows through the Strait of Hormuz fell sharply, severely disrupting global energy markets. Brent crude rose by more than 60% over the month, while bond yields moved materially higher as investors reassessed their inflation outlook. Unsurprisingly, the energy sector performed especially well while sectors that historically correlate negatively to sudden rises in interest rates, such as consumer staples, industrials and healthcare, struggled. Geographically, emerging markets and European stocks lagged their US counterparts, partly due to a stronger dollar and the view that the American economy is more self-sufficient in terms of energy requirements.
Healthcare outperformed the broader market during the period under review. As a reminder, healthcare stocks had struggled in the previous financial year due to cyclical rotation and sector-specific policy concerns. These included Robert F Kennedy Jr's appointment as US Secretary of Health and Human Services, changes at the US Food and Drug Administration (FDA) and President Trump's threats to impose tariffs on pharmaceuticals and introduce 'most favoured nation' (MFN) drug pricing. However, the sector recovered strongly at the start of the new financial year, led mainly by pharmaceuticals and biotechnology, as many of these concerns began to ease.
First, in September 2025, Trump announced a 100% tariff on branded pharmaceutical imports. While the headline rate appeared severe, the tariff would not apply to companies building or expanding manufacturing facilities in the US, including projects already under construction. As most large pharmaceutical companies had announced significant investment in US manufacturing capacity, the market took this as helpful clarity on tariffs.
Second, the US government and several major pharmaceutical companies reached a series of agreements. In exchange for a moratorium on tariffs, the companies agreed to introduce MFN pricing for certain drugs, invest in the US and step up efforts to reduce prices in the direct-to-consumer market.
The sector's recovery stalled in March 2026, as heightened geopolitical tensions drove oil prices higher and pushed up bond yields. Healthcare's underperformance relative to the broader market during March may appear counterintuitive given its defensive reputation. In practice, however, investors often view healthcare as a bond proxy. When oil prices rise sharply and inflation expectations increase, bond yields tend to move higher, which can weigh on both bonds and other yield-sensitive sectors such as healthcare. That said, if the current inflation shock proves mainly supply-driven and begins to weaken growth and increasing stagflation concerns, sentiment could shift. In that environment, healthcare's resilient earnings and defensive characteristics may again become more attractive to investors.
Although healthcare as a whole outperformed the broader market in the first six months of the financial year, there was significant dispersion within healthcare's subsectors. Pharmaceuticals and biotechnology stocks were the strongest performers, thanks not only to the much-needed clarity around drug pricing and tariffs but also to them being perceived as immune to AI disruption. Similarly, facilities and distributors posted gains, with investors viewing these subsectors as possible long-term beneficiaries of AI-driven efficiencies.
On the opposite side of the coin, managed care, healthcare equipment, and life sciences tools and services struggled. While the former two had specific challenges (a less benign policy environment for healthcare insurers; slowing volumes growth; high valuations for equipment stocks), the latter's poor returns were caused by a conservative outlook for 2026 and, more importantly, the market's perception that this industry will likely be negatively affected by AI (see 'Artificial Intelligence' section below for our more in-depth comment).
|
Market cap at |
31 March 2026 |
30 September 2025 |
|
Mega-cap (>$100bn) |
28.3% |
25.9% |
|
Large cap ($10-100bn) |
48.3% |
48.8% |
|
Mid-cap ($5-10bn) |
13.1% |
18.0% |
|
Small cap (<$5bn) |
15.2% |
5.4% |
|
Other net assets |
-4.9% |
1.9% |
|
TOTAL |
100.0% |
100.0% |
Source: Polar Capital, 31 March 2026; past performance is not indicative or a guarantee of future results; average calculated over the reporting period
The Company's exposure to various market-cap ranges has remained largely unchanged, with the exception of small-cap stocks due to some companies drifting below the $5bn threshold and the addition of a number of biotechnology investments.
It should also be noted that a gearing facility was reintroduced in the portfolio in mid-February 2026, with the gearing standing at 4.9% of net assets at the end of the period under review.
Throughout the first half of the financial year, we maintained a significant underweight position in mega-cap stocks and a considerable overweight in small and mid-cap ones. Given the market dynamics described earlier, the allocation effect was negative across the market-cap spectrum but especially challenged in the mid and mega-cap bands. The selection effect was positive overall, with favourable stock-picking in the large and mid-cap segments more than offsetting the poor selection in mega and small-cap stocks.
From a geographical perspective, the positive contributors were the Middle East and Africa, Asia Pacific (ex-Japan), and US and Canada thanks to strong stock selection across these regions as well as favourable or negligible allocation. The largest detractors were Japan and Europe. Despite a positive allocation effect, suboptimal selection in both regions was a drag on performance, with Europe especially challenging. The Company's gearing had a modest negative impact on performance.
In terms of subsectors, the negative attribution was almost entirely due to selection, with allocation having only a relatively negative impact. The most favourable contributions came from biotechnology for which selection was especially strong, managed care where both allocation and selection were favourable, and healthcare equipment, with poor selection offset by positive allocation. The main cause of the weak performance in the period was below par stock-picking in life sciences tools and services, pharmaceuticals, healthcare services and facilities, with allocation also being a detractor across these subsectors.
Stocks that contributed positively to the relative performance over the period included Exact Sciences**, Avidity Biosciences**, Teva Pharmaceutical Industries, UnitedHealth Group*, and Vaxcyte.
Exact Sciences is a US-based specialty diagnostics company that offers a suite of non-invasive cancer tests for screening, therapy selection and disease monitoring. Although commercial execution had begun to improve and the market was starting to better appreciate the fundamentals of the equity story, it was a bid from Abbott Laboratories, valuing the business at more than $20bn, that drove the share price sharply higher in November. Similarly, Avidity Biosciences, a biotechnology company focused on developing treatments for neuromuscular disorders, made a positive contribution to performance in the first six months of the financial year, following Novartis's decision to acquire the company in a transaction valued at approximately $12bn. Following these takeover offers, the Company sold its holdings in both Exact Sciences and Avidity Biosciences.
We initiated a position in Teva Pharmaceutical Industries, historically known for generics but with a growing innovative pharmaceuticals business and pipeline, in September 2025. Although the stock came under pressure in February and March amid rising tensions in the Middle East, it performed well overall during the period under review. This reflected solid commercial execution, greater clarity around the near-term pricing outlook for one of its key drugs, Austedo XR, which is used to treat tardive dyskinesia (a neurological syndrome that results in involuntary repetitive body movements), and growing market appreciation of its expanding branded drug portfolio, particularly in schizophrenia.
The lack of exposure to US healthcare insurance group UnitedHealth Group was also a positive contributor. After an already difficult second quarter of calendar year 2025, driven by weak execution in challenging end markets and a significant cut to its earnings outlook, the stock fell substantially again in January this year following the release of the Medicare Advantage (MA) Advance Notice. This set out the proposed reimbursement rates for the following year for managed care organisations operating MA programmes. For 2027, the Centers for Medicare and Medicaid Services (CMS) recommended a de minimis increase. This was materially below market expectations for a mid- to single-digit increase, which had reflected higher utilisation trends, rising medical costs and assumptions of a more accommodative stance from the CMS under a Republican administration. As a result, managed care stocks with significant MA exposure, including UnitedHealth Group, sold off sharply.
Vaxcyte is a pre-commercial biotechnology company with a broad pipeline of vaccine candidates, including two more advanced pneumococcal vaccine programmes. During the first half of the financial year, the stock appreciated due to strong momentum in the execution of its clinical trial programmes and, perhaps more importantly, easing concerns about the potential impact on the vaccine industry of new leadership at the US Department of Health and Human Services and the FDA. In addition, we believe Vaxcyte benefited from the relatively strong performance of the biotechnology subsector, which was supported by an increase in M&A activity.
Stocks that impacted relative performance negatively over the period were Johnson & Johnson*, iRhythm Technologies, Merck*, ICON, and Encompass Health**.
The Company did not hold pharmaceutical and medical-device giant Johnson & Johnson. The stock started to perform strongly in mid-2025 and this rally extended into the new calendar year. There was no single data point to explain the relative strength in performance, but the company rerated considerably following the series of deals struck between bio-pharmaceutical companies and the US administration as well as benefiting from investors' increased understanding of the sustainability of growth in the Johnson & Johnson pharmaceutical franchise. Moreover, given the heightened macroeconomic uncertainty and challenging market conditions in March 2026, the stock benefited from being considered a safe haven due to its diversified business and defensive qualities.
IRhythm Technologies is a US-based medical device manufacturer of cardiac monitoring solutions. While the company delivered strong Q4 2025 results and guidance for 2026 in line with expectations, its share price was negatively impacted by the announcement of another delay to the potential US approval of its next-generation monitoring device, Zio MCT, denting investors' confidence regarding its growth in 2027 and beyond. Furthermore, the company was caught in the selloff of high-growth, high-value healthcare equipment stocks, stocks which suffered from a market rotation into more defensive areas of healthcare.
Not owning pharmaceuticals company Merck was a drag to performance in the period under review. Similarly to Johnson & Johnson, Merck rerated upwards following clarity around tariffs on pharmaceuticals and MFN pricing but was also helped by positive clinical updates on pipeline assets which should help it offset the loss of exclusivity of its biggest drug, Keytruda, before the end of this decade.
ICON is a contract research organisation (CRO) whose main function is to provide biopharma and medical device industries with support services for research (e.g. running clinical trials, preparing regulatory submissions etc). We initiated the position in ICON in January 2026, with the view that improving biotechnology funding and a less uncertain policy environment would create a tailwind for CROs. Unfortunately, the release of new AI tools in early 2026 raised investors' concerns that agentic AI could disintermediate many of the services the CROs provide. Additionally, ICON was also negatively affected by the news that the company has been undergoing an investigation into its accounting practices. We remain invested in ICON, waiting for a resolution of the above-mentioned investigation but also believing that, albeit difficult to disprove in the short term, fears around the impact of AI on CROs are overblown.
Encompass Health runs a network of inpatient rehabilitation hospitals in the US. The stock sold off heavily after its Q3 results failed to meet elevated expectations. Though the fundamentals of the story remain robust, we liquidated our holding in Encompass Health in December 2025 to invest in areas where the risk/reward profile was more compelling.
Relative Contributors (%): 30 September 2025 to 31 March 2026
|
Top 10 |
Average Stock Weight |
Active Weight |
Stock Return |
Stock Return vs Benchmark |
Total Attribution |
|
Exact Sciences |
0.95 |
0.95 |
89.86 |
82.67 |
1.56 |
|
Avidity Biosciences |
0.42 |
0.42 |
62.99 |
55.80 |
1.54 |
|
Teva Pharmaceutical Industries |
3.86 |
3.47 |
52.17 |
44.97 |
1.48 |
|
UnitedHealth Group |
0.00 |
-3.50 |
-18.87 |
-26.06 |
1.10 |
|
Vaxcyte |
2.08 |
2.08 |
64.64 |
57.44 |
0.99 |
|
Roivant Sciences |
1.74 |
1.74 |
86.83 |
79.64 |
0.90 |
|
AstraZeneca |
5.61 |
2.18 |
32.73 |
25.54 |
0.58 |
|
AbbVie |
0.00 |
-4.79 |
-2.67 |
-9.87 |
0.55 |
|
Abbott Laboratories |
0.39 |
-2.14 |
-21.03 |
-28.22 |
0.54 |
|
Boston Scientific |
1.28 |
-0.32 |
-34.41 |
-41.60 |
0.52 |
Source: Polar Capital; at 31 March 2026
|
Bottom 10 |
Average Stock Weight |
Active Weight |
Stock Return |
Stock Return vs Benchmark |
Total Attribution |
|
Johnson & Johnson |
0.00 |
-6.22 |
36.11 |
28.91 |
-1.70 |
|
iRhythm Technologies |
2.32 |
2.32 |
-29.97 |
-37.17 |
-1.16 |
|
Merck |
0.00 |
-3.14 |
48.60 |
41.41 |
-1.13 |
|
ICON |
0.55 |
0.55 |
-35.47 |
-42.66 |
-0.89 |
|
Encompass Health Corp |
1.02 |
1.02 |
-22.03 |
-29.22 |
-0.71 |
|
Zealand Pharma |
1.50 |
1.50 |
-36.05 |
-43.25 |
-0.68 |
|
Novo Nordisk |
2.80 |
0.88 |
-30.73 |
-37.92 |
-0.65 |
|
Ottobock |
1.95 |
1.95 |
-21.22 |
-28.41 |
-0.62 |
|
IQVIA Holdings |
0.95 |
0.53 |
-8.37 |
-15.57 |
-0.60 |
|
Novartis |
0.00 |
-3.24 |
25.74 |
18.54 |
-0.56 |
Source: Polar Capital; at 31 March 2026
Near-term considerations: Rising inflation and the mid-term elections
Predicting the near-term economic outlook is challenging, with rising oil prices the catalyst for a spike in US Treasury yields, expectations of higher-for-longer interest rates and concerns around inflation driven by the effective closure of the Strait of Hormuz during the conflict in Iran. If we do see rate hikes driven by inflation and economic growth slows, the outlook for large-cap healthcare on a relative basis becomes more and more appealing, much like it was in 2022.
Another reason for optimism with regards to investing in the healthcare sector is the mid-term elections in the US, especially if the Democrats claim a majority in the House of Representatives and the Republicans hold on to the Senate. That scenario would effectively create legislative gridlock, with any major healthcare reforms highly unlikely to be signed into law. If policy fears continue to ease, then investors' attention can be drawn to strong industry fundamentals, attractive valuations and the opportunity to generate returns.
Key themes: Access and affordability, AI and healthcare services in emerging markets
In last year's annual report, we outlined three key investment themes which offered the potential for significant returns. As a reminder, those themes were access and affordability, reimbursement of AI/machine learning-enabled technologies and healthcare services in emerging markets.
Access to affordable, high-quality medicines is crucial to reducing unnecessary pain and suffering, shortening the duration of an illness and addressing the ever-increasing financial burden of care. The widespread utilisation of low-cost medicines is an obvious driver of savings, but it is the successful adoption of cutting-edge technologies, including AI-enabled products and services, that will also be a critical component of driving cost savings and improving efficiency.
Many emerging markets, with India a classic example, are going through a structural transformation that includes a clear intent to expand hospital infrastructure, increase bed capacity and incentivise the workforce.
Access and affordability: Biosimilars hold the key
Accessibility and affordability are significant barriers that create pervasive health inequities. Nearly two billion people have no access to essential medicines, and these challenges of accessibility and affordability are not limited to low and middle-income countries. In the US, for example, many Medicare beneficiaries do not even fill their prescriptions or skip taking their medication because of the expense. Admittedly, the Inflation Reduction Act introduced in August 2022 included a bill specifically designed to address the issue by capping beneficiaries' annual out-of-pocket expenses for Part D prescription drugs at $2,000, but the solution is restricted to those over 65 and more needs to be done for the wider population.
According to the FDA, biologic medications in 2024 made up just 5% of prescriptions in the US but accounted for 51% of total drug spend. FDA-approved biosimilars are as safe and effective as the branded drugs they copy, yet their market share remains below 20%. While the FDA had approved 76 biosimilars by the end of October 2025, only 10% of biologic drugs expected to lose patent protection in the next decade currently have a biosimilar in development. To address this disconcerting shortfall, draft guidance was introduced late last year with the aim of simplifying biosimilar studies and reducing unnecessary clinical testing. The agency is also planning to make it easier for biosimilars to be developed as interchangeable with their branded counterparts, helping patients and pharmacists choose lower-cost options more easily. The objective is very simple - help more companies bring affordable, high-quality biosimilars to market and reduce costs for US consumers.
Artificial Intelligence: Moving at breakneck speed but needs careful consideration
February 2026 will forever be remembered as the month when the market tried to figure out who the AI 'winners and losers' will likely be. One of the catalysts for the rush to draw conclusions was Anthropic rolling out multiple updates to its Claude platform as well as an expanded suite of Claude Cowork plugins and enterprise connector tools that allow AI to integrate directly with business software systems. These releases renewed fears over AI's role in replacing traditional software-as-a-service (SaaS) workflows and contributed to sharp selloffs in software and professional services stocks as investors reassessed long-term value risks in user-based software and data-heavy research tools.
In the world of healthcare, the knee-jerk reaction was to hide in areas perceived to be either immune from disruption or indeed beneficiaries. Biopharmaceuticals, distributors and healthcare facilities fell into the 'winners' camp, whereas healthcare technology, CROs, and life sciences tools and services fell into the 'losers' group. With efficiency gains the operative phrase, the bio-pharmaceuticals industry is considered to be a beneficiary, with cost-savings and efficiency gains front and centre. AI is being deployed across research and development (R&D), manufacturing, commercial and patient engagement to improve productivity and accelerate innovation. In the world of distribution, AI is being used to advance and improve customer care, simplify supply chains and drive efficiencies.
Last but not least, healthcare facilities are advancing their tech agendas and investing in AI to improve administrative functions such as revenue cycle management as well as interactions with payers and vendors and their supply chains. On the operational side, areas of focus are scheduling, staffing and running operating rooms.
Switching gears to focus on potential 'losers', any businesses with a SaaS model have come under pressure as the market questions their terminal value. In the case of CROs, the comments by Pfizer's CEO on the company's 4Q25 earnings call rattled the market. As a reminder, the CEO stated that Pfizer is embedding AI across discovery, development, regulatory and medical areas to increase productivity and accelerate the pipeline and timelines. Further, the company announced it has identified $500m in savings in R&D, raising concerns that there will be less business heading the way of the CROs.
Finally, one of the more optimistic AI-based scenarios is that the technology will dramatically improve early-stage research by accelerating target identification, cutting development times and reducing failure rates. The consequence of this could be reduced demand for lab work and fewer molecules (drug candidates) in the clinic, both of which are potential headwinds for the life sciences tools and services sector.
In conclusion, AI is having a dramatic impact on many industries, including healthcare. However, a more balanced approach is warranted given healthcare is incredibly complex, is highly regulated and will continue to need human oversight by highly qualified investigators. Further, if the early-stage R&D process does become more efficient the saving will likely be reinvested, pushing more novel, potentially life-saving medicines into the R&D funnel. All of these are clear positives for the broader healthcare industry, including CROs and life sciences tools and services companies.
Emerging markets: A rapidly evolving ecosystem
Emerging markets demand for healthcare products and services is surging, driven by ageing populations, rising middle class incomes and increasing chronic disease prevalence. While spending is currently low (low to mid-single digit as a percentage of GDP (Gross Domestic Product[1])) compared to developed nations, demand for private, high-quality care is growing rapidly to fill significant infrastructure gaps and improve access to services.
For example, in India, where the recent Union Budget 2026-27 was very focused on the healthcare sector, aimed at accelerating what is already a comprehensive plan to transform India's healthcare ecosystem. The budget included allocation to areas such as blood transfusion services, biologic and biosimilar research, and access to drugs to treat cancers and rare diseases. However, one of the central pillars of the budget is a clear commitment to investing in hospitals, whether it be newly created facilities, upgrading existing buildings and/or investing in state-of-art information systems. Given the anticipated demand for healthcare products and services, this is a critical piece of legislation for the following two reasons.
First, emerging markets are witnessing rapid increases in disposable income and, as those incomes rise, the demand and the ability to pay for healthcare products and services will also rise. For context, by 2030 China and India are expected to have the biggest share of middle-class consumption globally at 22% and 17% respectively. Another way of trying to grasp the magnitude of the opportunity in India is to look at raw numbers. According to ICE 3600 Surveys, there will be an estimated 715 million middle-class Indians in 2031, a number that is forecast to grow to more than one billion by 2047.
Secondly, and admittedly coming off a very low base, emerging markets healthcare spend per capita is expected to increase as various economies increase their healthcare spend as a percentage of GDP. For example, China's rate of change, from 2014-40, is forecast to annualise at 7.7% per annum with India's predicted to be 5.5%. If investment in infrastructure can keep pace with demand, it stands to reason that emerging markets will be a strong source of growth for the healthcare industry for many years to come.
Strategy and positioning
As a reminder, the objective of the Company is to achieve long-term capital appreciation by investing in a portfolio of global healthcare companies to include, but not limited to, pharmaceutical, biotechnology, medical device and healthcare services companies.
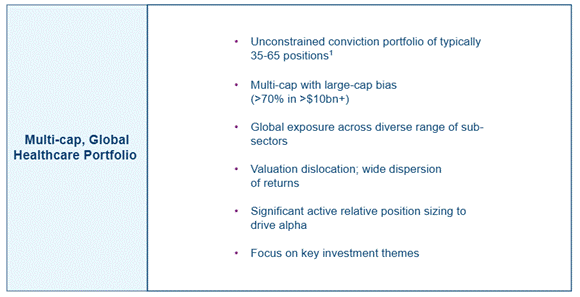
Our aim is to identify companies where there is a disconnect between valuations and intrinsic value. The Company is a high conviction (79.7% active share[2] at 31 March 2026), actively managed investment vehicle that gives investors exposure to a concentrated portfolio invested across the global healthcare universe. Stock-picking remains critical to the process, and there will be a continued focus on the key investment themes mentioned earlier, some of which appear to be accelerating in the near term while also having medium-term durability.
The Company's portfolio combines a 'growth at a reasonable price' (GARP) approach with the opportunity to invest in earlier-stage, more disruptive companies. The majority of the Company's investments (at least 70%) are in companies with a market cap above $10bn at the time of investment. This part of the portfolio consists of holdings where we see a disconnect between the current share price and intrinsic value. The positions also reflect, in part but not exclusively, the investment themes where we have the highest conviction. It also drives the lower volatility of the Company relative to other, more volatile areas of healthcare. The remainder of the portfolio (at most 30% in stocks with a market cap of <US$10bn) provides optionality through investments in the most exciting small-cap stocks we can find.
Source: Polar Capital, as at 31 March 2026 1. For illustrative purposes only.
Period end positioning: Diverse but with high conviction
From a subsector perspective, there were significant changes in positioning during the six-month period under review. The biggest change was moving from a high single-digit overweight relative to the benchmark in healthcare equipment to a high single-digit underweight. The subsector has experienced negative earnings revisions and seen its valuation multiples compress. Coming off the back of a wave of new product cycles and positive revisions, with atrial fibrillation and continuous glucose monitoring prime examples, the healthcare equipment sector is experiencing a lull in momentum. The commitment to and confidence in R&D remains, but the sector is also starting to use its balance sheet to acquire growth, a strategy that could dilute return profiles.
Exposure to healthcare services was significantly increased from a modest overweight relative to the benchmark to the biggest overweight. The primary driver behind the change was stock-specific, with the Company now having more exposure to diversified US services companies that have been heavily out of favour and have seen their valuations contract. The investments give exposure to a variety of attractive end markets including healthcare insurance, pharmacy benefit and physical pharmacy assets. The European services investments are unchanged, with German and Spanish hospitals and the provision of low-cost injectable drugs still interesting opportunities with attractive returns.
Subsector weightings relative to benchmark
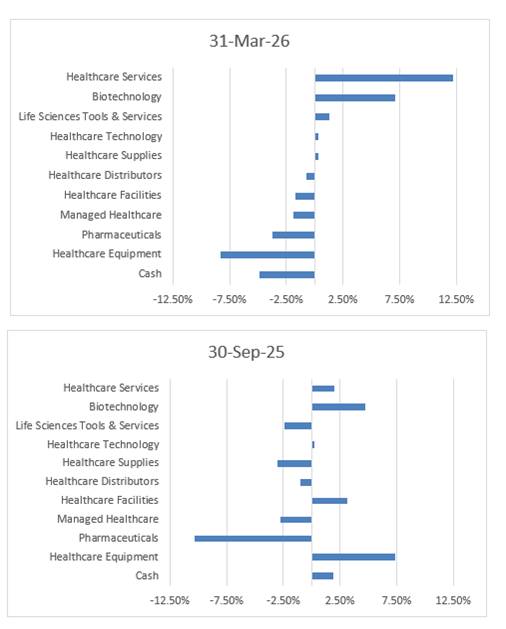
Source: Polar Capital. Note: Sector exposure refers to the extent to which the Company is overweight or underweight in each sector compared to the MSCI All Country World Health Care Index
The Company continues to have a significant overweight in biotechnology. The biotechnology industry continues to be extremely innovative, and it has successfully commercialised assets and delivered returns ahead of expectations. Further, it is worth noting that 2025 was another very strong year for new drug approvals, with the FDA (despite widespread fears and doubts at the beginning of the year) approving 46 new medicines.
Last, but not least, the pharmaceutical industry is facing significant headwinds over the next decade as some very profitable drugs lose patent protection. The industry will likely look for external sources of innovation to complement and bolster internal pipelines. Consolidation will continue to be a key theme.
As at 31 March 2026, the Company carried a modest underweight in pharmaceuticals, having been materially underweight just six months earlier. The rationale for a more constructive stance is pretty straightforward; following the flurry of agreements that pharmaceutical companies reached with the US government, the worst-case scenarios in terms of tariffs and drug prices were effectively removed, offering near and medium-term visibility and relief on compressed valuation multiples. As a reminder, the agreements basically ensured that certain US patients will pay lower prices for their prescription medicines. In return, companies gained certainty on tariffs and made commitments to invest in US R&D and manufacturing infrastructure.
Concerns around payment rates for MA plans, access to care and elevated levels of utilisation weighed on managed care stocks during the period under review. Back in January, the CMS released a preliminary rate notice for MA plans that was materially below expectations, putting significant pressure on those with high exposure to insurance plans for the over 65s as the market questioned the path to earnings recovery. Insurance companies with exposure to Affordable Care Act (ACA) plans also faced uncertainty following the expiration of enhanced premium subsidies, with the key question being: 'How many US citizens will drop out of the system and lose healthcare insurance?' Last, the sector has been impacted by above-trend medical volumes leading to a situation where more of the premium revenue has to be spent on care provision, which in turn puts pressure on earnings. The key question now is how the industry can restructure its product offerings to protect margins and return to a path of steady earnings growth.
The life sciences tools and services subsector underwhelmed during the first half of the fiscal year for a couple of reasons. First, expectations for a strong recovery in key end-markets at the end of 2025 were somewhat elevated heading into the reporting season only to be quashed by consistently conservative near-term guidance. Second, the subsector has been heavily impacted by AI-related fears whether it be reduced lab activity due to dramatically improved R&D efficiency, which would impact traditional life sciences tools and services companies, or reduced outsourcing to CROs.
The market has quickly taken the view that AI presents more risks of things going wrong than going right, without considering the possibility that the impact could be more balanced and maybe even positive. Surely there is a scenario where improved R&D efficiency and reduced early-stage failure rates could mean more lab activity and more drug candidates entering clinical development, both of which are tailwinds for the industry. Further, the power of AI could be used to ensure the clinical trial process is faster and more cost-effective, a scenario that could be beneficial for CRO margins.
Two of the worst performing subsectors during the period under review were healthcare technology and healthcare equipment. With Veeva Systems the primary driver of the underperformance, the technology subsector really struggled with AI-related fears the key concern. For context, Veeva Systems provides cloud-based software, data and analytics tailored for the global life sciences industry and there is concern that AI-native point solutions could disintermediate its business. Operational performance has been solid, with positive revenue and earnings revisions, but the valuation pulled back heavily as the market questions the company's terminal value.
Stock selection is a key driver
The table below displays the Company's top 10 relative overweight and underweights at the end of the reporting period, highlighting the highest conviction ideas in the portfolio. While conviction is the appropriate term to use when discussing positioning versus the benchmark, it is important to stress that valuation inefficiencies can be relatively short-lived, especially among well covered large-cap stocks. With opportunity cost also a key decision driver as we look to maximise returns, the Company's top 10 relative overweight and underweight positions are subject to change.
Overweight and underweight positions relative to the benchmark
|
Overweight |
Active (%) |
Underweight |
Active (%) |
|
Teva Pharmaceutical Industries |
4.1% |
Johnson & Johnson |
-7.4% |
|
CVS Health |
3.6% |
AbbVie |
-4.8% |
|
Cigna |
3.1% |
Merck |
-3.7% |
|
Fresenius |
3.1% |
Novartis |
-3.6% |
|
ConvaTec Group |
2.8% |
UnitedHealth Group |
-3.1% |
|
Roivant Sciences |
2.7% |
Amgen |
-2.4% |
|
AstraZeneca |
2.7% |
Abbott Laboratories |
-2.2% |
|
Thermo Fisher Scientific |
2.6% |
Gilead Sciences |
-2.2% |
|
Ionis Pharmaceuticals |
2.6% |
Intuitive Surgical |
-2.1% |
|
Torrent Pharmaceuticals |
2.6% |
Pfizer |
-2.0% |
|
Total |
29.9% |
Total |
-33.5% |
Source: Polar Capital as at 31 March 2026.
A number of the overweight positions relative to the benchmark have been in the portfolio for some time, while CVS Health, Cigna, ConvaTec Group, Roivant Sciences and Ionis Pharmaceuticals were added during the period under review. CVS Health, whose businesses span managed care, pharmacy benefit management and retail pharmacy, should, in our view, continue to deliver attractive operating income growth, driven by a focus on margins within its MA business and a continued turnaround on the retail pharmacy side.
We added a US healthcare services company, Cigna, due to an attractive valuation as well as it taking bold steps to reduce the political risk associated with its pharmacy benefit management business by settling a dispute with the Federal Trade Commission around insulin prices and by rolling out a new rebate-free commercial model. With the market appearing to model very conservative 2026 and 2027 earnings, the risk/reward felt compelling.
ConvaTec Group has been enjoying positive earnings revisions, is attractively valued given the potential growth on offer and could be the beneficiary of an easing regulatory landscape in the US.
US biotechnology company Roivant Sciences could benefit from several catalysts in the coming months, including potential product approvals and launch trajectories, all at an attractive valuation.
Similarly, we initiated the position in Ionis Pharmaceuticals on the view that the revenue opportunities from commercial assets are underappreciated and its rich pipeline offers additional upside optionality.
As for new additions further down the market-cap spectrum, we initiated positions in Hansa Biopharma, Savara, Medincell and Corvus Pharmaceuticals. These companies were added based on their respective pipelines, all with clinical-stage programmes in conditions with high-unmet medical need.
Hansa Biopharma's main asset is imlifidase which has received conditional approval in the EU for highly sensitised kidney transplant patients but is also being developed for additional desensitisation indications.
Savara focuses on rare respiratory diseases. The company's lead product, molgramostim, was successful in Phase III trials for a rare disorder called autoimmune pulmonary alveolar proteinosis that leads to a buildup of unwanted protein in the lungs.
Corvus Pharmaceuticals' pipeline consists of multiple clinical-stage programmes for immune diseases and cancer with an ITK inhibitor, soquelitinib.
Finally, we believe Medincell's long-acting injectable technology has broad applicability in numerous therapeutics areas, offering significant upside to current revenue expectations.
Given their size, stocks with smaller market caps have the potential to be more volatile than their larger peers. Companies further down the market-cap scale also tend to be less well researched, increasing the chances of valuation inefficiencies. It is that combination of volatility and valuation inefficiency that we hope will yield interesting ideas that could offer significant potential over the long term.
Outlook for healthcare: Disconnected from fundamentals
Two events during the period under review have created a great deal of uncertainty for healthcare investors, the first being the asymmetric fear that AI will disintermediate a number of healthcare subsectors and the second being geopolitical unrest in the Middle East and the inflationary implications of a spike in energy costs. Importantly, however, that uncertainty has created exciting investment opportunities, with current valuations disconnected from the strong fundamentals.
The innovation cycle remains very strong, with 10 novel drugs approved by the FDA already this calendar year, plus M&A is picking up steam with several multi-billion dollar deals announced since the turn of the year.
The demand for healthcare products and services continues to be robust, with emerging markets especially buoyant, and policy fears in the US appear to be easing which is a significant positive that should not be overlooked. Further, the recent earnings season has been broadly positive, pipeline newsflow continues to highlight the high levels of innovation and valuations have, once again, compressed to levels that could be the platform for highly attractive returns.
* not held
** no longer held
James Douglas and Gareth Powell
Co-Managers, Polar Capital Global Healthcare Trust
May 2026
PORTFOLIO AS AT 31 MARCH 2026
|
Stock |
Sector |
Country |
Market Value £'000 |
% of net assets |
|
Eli Lilly |
Pharmaceuticals |
United States |
32,355 |
8.6% |
|
AstraZeneca |
Pharmaceuticals |
United Kingdom |
24,288 |
6.4% |
|
Roche |
Pharmaceuticals |
Switzerland |
19,572 |
5.2% |
|
Thermo Fisher Scientific |
Life Sciences Tools & Services |
United States |
18,570 |
4.9% |
|
CVS Health |
Healthcare Services |
United States |
17,747 |
4.7% |
|
Teva Pharmaceutical Industries |
Pharmaceuticals |
Israel |
17,215 |
4.6% |
|
The Cigna Group |
Healthcare Services |
United States |
15,015 |
3.9% |
|
Fresenius SE |
Healthcare Services |
Germany |
12,640 |
3.4% |
|
Novo Nordisk |
Pharmaceuticals |
Denmark |
11,972 |
3.2% |
|
UCB |
Pharmaceuticals |
Belgium |
10,862 |
2.9% |
|
Top 10 investments |
|
180,236 |
47.8% |
|
|
ConvaTec Group |
Healthcare Supplies |
United Kingdom |
10,684 |
2.8% |
|
Roivant Sciences |
Pharmaceuticals |
United States |
10,268 |
2.7% |
|
Torrent Pharmaceuticals |
Pharmaceuticals |
India |
10,024 |
2.7% |
|
Argenx |
Biotechnology |
Netherlands |
9,838 |
2.6% |
|
Ionis Pharmaceuticals |
Biotechnology |
United States |
9,822 |
2.6% |
|
Nuvalent |
Biotechnology |
United States |
9,517 |
2.5% |
|
Centene |
Managed Healthcare |
United States |
9,344 |
2.5% |
|
Merck KGaA |
Pharmaceuticals |
Germany |
9,058 |
2.4% |
|
Innovent Biologics |
Biotechnology |
China |
8,903 |
2.4% |
|
Chugai Pharmaceutical |
Pharmaceuticals |
Japan |
8,805 |
2.3% |
|
Top 20 investments |
|
276,499 |
73.3% |
|
|
Agilent Technologies |
Life Sciences Tools & Services |
United States |
8,709 |
2.3% |
|
Ottobock SE |
Healthcare Equipment |
Germany |
8,703 |
2.3% |
|
Vaxcyte |
Biotechnology |
United States |
8,213 |
2.2% |
|
Bridgebio Pharma |
Biotechnology |
United States |
8,199 |
2.2% |
|
Uniphar |
Healthcare Distributors |
Ireland |
8,092 |
2.1% |
|
Guardant Health |
Healthcare Services |
United States |
7,821 |
2.1% |
|
Genmab |
Biotechnology |
Denmark |
7,768 |
2.1% |
|
Xenon Pharmaceuticals |
Biotechnology |
Canada |
7,384 |
2.0% |
|
iRhythm Technologies |
Healthcare Equipment |
United States |
7,294 |
1.9% |
|
Savara |
Biotechnology |
United States |
5,592 |
1.5% |
|
Top 30 investments |
|
354,274 |
94.0% |
|
|
Hansa Biopharma |
Biotechnology |
Sweden |
5,516 |
1.5% |
|
Medincell |
Pharmaceuticals |
France |
5,405 |
1.4% |
|
ICON |
Life Sciences Tools & Services |
Ireland |
4,983 |
1.3% |
|
Cytokinetics |
Biotechnology |
United States |
4,464 |
1.1% |
|
RadNet |
Healthcare Services |
United States |
4,204 |
1.1% |
|
NeuroPace |
Healthcare Equipment |
United States |
4,084 |
1.1% |
|
H Lundbeck |
Pharmaceuticals |
Denmark |
4,054 |
1.1% |
|
Medley |
Healthcare Technology |
Japan |
3,093 |
0.8% |
|
Zealand Pharma |
Biotechnology |
Denmark |
2,896 |
0.8% |
|
Corvus Pharmaceuticals |
Biotechnology |
United States |
2,389 |
0.7% |
|
Total Equities |
|
395,362 |
104.9% |
|
|
Other Net Liabilities |
|
(18,308) |
(4.9%) |
|
|
Net Assets |
|
377,054 |
100.0% |
|
PORTFOLIO REVIEW AS AT 31 MARCH 2026
|
Geographical Exposure at: |
31 March 2026 |
30 September 2025 |
|
United States |
48.6% |
53.3% |
|
United Kingdom |
9.2% |
6.1% |
|
Germany |
8.1% |
2.8% |
|
Denmark |
7.2% |
13.7% |
|
Switzerland |
5.2% |
5.2% |
|
Israel |
4.6% |
3.3% |
|
Ireland |
3.4% |
1.7% |
|
Japan |
3.1% |
1.1% |
|
Belgium |
2.9% |
3.8% |
|
India |
2.7% |
4.6% |
|
Netherlands |
2.6% |
2.5% |
|
China |
2.4% |
- |
|
Canada |
2.0% |
- |
|
Sweden |
1.5% |
- |
|
France |
1.4% |
- |
|
Other net (liabilities)/assets |
(4.9%) |
1.9% |
|
Total |
100.0% |
100.0% |
|
Sector Exposure at: |
31 March 2026 |
30 September 2025 |
|
Pharmaceuticals |
43.5% |
31.1% |
|
Biotechnology |
24.2% |
21.1% |
|
Healthcare Services |
15.2% |
5.4% |
|
Life Sciences Tools & Services |
8.5% |
5.3% |
|
Healthcare Equipment |
5.3% |
24.4% |
|
Healthcare Supplies |
2.8% |
- |
|
Managed Healthcare |
2.5% |
3.1% |
|
Healthcare Distributors |
2.1% |
1.7% |
|
Healthcare Technology |
0.8% |
1.1% |
|
Healthcare Facilities |
- |
4.9% |
|
Other net (liabilities)/assets |
(4.9%) |
1.9% |
|
Total |
100.0% |
100.0% |
|
Market Capitalisation breakdown at: |
31 March 2026 |
30 September 2025 |
|
Mega Cap (>US$100bn) |
28.3% |
25.9% |
|
Large Cap (US$10bn -US$100bn) |
48.3% |
48.8% |
|
Medium Cap (US$5bn - US$10bn) |
13.1% |
18.0% |
|
Small Cap (<US$5bn) |
15.2% |
5.4% |
|
Other net (liabilities)/assets |
(4.9%) |
1.9% |
|
Total |
100.0% |
100.0% |
STATEMENT OF COMPREHENSIVE INCOME
For the half year ended 31 March 2026
|
|
|
|
|
|||||||
|
|
(Unaudited) Half year ended 31 March 2026 |
(Unaudited) Half year ended 31 March 2025 |
(Audited) Year ended 30 September 2025 |
|||||||
|
|
|
Revenue |
Capital |
Total |
Revenue |
Capital |
Total |
Revenue |
Capital |
Total |
|
|
|
return |
return |
return |
return |
return |
return |
return |
return |
return |
|
|
Notes |
£'000 |
£'000 |
£'000 |
£'000 |
£'000 |
£'000 |
£'000 |
£'000 |
£'000 |
|
Gains/(losses) on investments held at fair value |
|
- |
26,897 |
26,897 |
- |
(48,161) |
(48,161) |
- |
(26,558) |
(26,558) |
|
Investment income |
2 |
2,382 |
- |
2,382 |
1,449 |
- |
1,449 |
3,388 |
- |
3,388 |
|
Other operating income |
2 |
90 |
- |
90 |
42 |
- |
42 |
83 |
- |
83 |
|
Other currency losses |
|
- |
(910) |
(910) |
- |
(142) |
(142) |
- |
(390) |
(390) |
|
Total income/(expense) |
|
2,472 |
25,987 |
28,459 |
1,491 |
(48,303) |
(46,812) |
3,471 |
(26,948) |
(23,477) |
|
Expenses |
|
|
|
|
|
|
|
|
|
|
|
Investment management fee |
|
(150) |
(1,353) |
(1,503) |
(329) |
(1,317) |
(1,646) |
(631) |
(2,522) |
(3,153) |
|
Other administrative expenses |
|
(498) |
- |
(498) |
(383) |
- |
(383) |
(855) |
(8) |
(863) |
|
Total expenses |
|
(648) |
(1,353) |
(2,001) |
(712) |
(1,317) |
(2,029) |
(1,486) |
(2,530) |
(4,016) |
|
Profit/(loss) before finance costs and tax |
|
1,824 |
24,634 |
26,458 |
779 |
(49,620) |
(48,841) |
1,985 |
(29,478) |
(27,493) |
|
Finance costs |
|
(36) |
(323) |
(359) |
(4) |
(12) |
(16) |
(7) |
(26) |
(33) |
|
Profit/(loss) before tax |
|
1,788 |
24,311 |
26,099 |
775 |
(49,632) |
(48,857) |
1,978 |
(29,504) |
(27,526) |
|
Tax |
|
(312) |
(237) |
(549) |
(213) |
- |
(213) |
(424) |
(103) |
(527) |
|
Net profit/(loss) for the period and total comprehensive income/(expense) |
|
1,476 |
24,074 |
25,550 |
562 |
(49,632) |
(49,070) |
1,554 |
(29,607) |
(28,053) |
|
Earnings/(losses) per Ordinary share (pence) |
3 |
1.41 |
23.01 |
24.42 |
0.46 |
(40.93) |
(40.47) |
1.28 |
(24.41) |
(23.13) |
The total column of this statement represents the Company's Statement of Comprehensive Income, prepared in accordance with UK-adopted International Accounting Standards.
The revenue return and capital return columns are supplementary to this and are prepared under guidance published by the Association of Investment Companies.
The Company does not have any other income or expense that is not included in net profit for the period/year. The net profit/(loss) for the period/year disclosed above represents the Company's total comprehensive income/expense.
There are no dilutive securities and therefore the Earnings per share and the Diluted Earnings per share are the same.
All revenue and capital items in the above statement derive from continuing operations. No operations were acquired or discontinued in the period/year.
The notes to follow form part of these financial statements.
.
BALANCE SHEET
For the half year ended 31 March 2026
|
|
Note |
|
||
|
(Unaudited) 31 March 2026 £'000 |
(Unaudited) 31 March 2025 £'000 |
(Audited) 30 September 2025 £'000 |
||
|
Non-current assets |
|
|
|
|
|
Investments held at fair value |
4 |
395,362 |
420,732 |
439,435 |
|
Current assets |
|
|
|
|
|
Cash and cash equivalents |
|
21,331 |
7,042 |
17,035 |
|
Overseas tax recoverable |
|
1,158 |
840 |
952 |
|
Receivables |
|
114 |
330 |
84 |
|
|
|
22,603 |
8,212 |
18,071 |
|
Total assets |
|
417,965 |
428,944 |
457,506 |
|
Current liabilities |
|
|
|
|
|
Bank overdraft |
|
- |
- |
(1) |
|
Payables |
|
(621) |
(396) |
(9,293) |
|
|
|
(621) |
(396) |
(9,294) |
|
Non-current liabilities |
|
|
|
|
|
Bank Loan |
|
(40,000) |
- |
- |
|
Indian capital gains tax provision |
|
(290) |
- |
(102) |
|
|
|
(40,290) |
- |
(102) |
|
Total liabilities |
|
(40,911) |
(396) |
(9,396) |
|
Net assets |
|
377,054 |
428,548 |
448,110 |
|
Equity attributable to equity shareholders |
|
|
|
|
|
Called up share capital |
|
31,037 |
31,037 |
31,037 |
|
Share premium reserve |
|
81,672 |
80,685 |
80,685 |
|
Capital redemption reserve |
|
6,575 |
6,575 |
6,575 |
|
Special distributable reserve |
|
3,672 |
3,672 |
3,672 |
|
Capital reserves |
|
252,151 |
304,668 |
324,693 |
|
Revenue reserve |
|
1,947 |
1,911 |
1,448 |
|
Total equity |
|
377,054 |
428,548 |
448,110 |
|
Net asset value per Ordinary share (pence) |
5 |
379.46 |
353.38 |
369.51 |
The financial statements were approved and authorised for issue by the Board of Directors on 29 May 2026 by: Lisa Arnold, Chair
The notes to follow form part of these financial statements.
STATEMENTS OF CHANGES IN EQUITY
For the half year ended 31 March 2026
|
|
|
Half year ended 31 March 2026 (Unaudited) |
||||||
|
|
|
Called up share capital
|
Capital redemption reserve |
Share premium reserve |
Special distributable reserve |
Capital reserves |
Revenue reserve |
Total Equity |
|
|
|
£'000 |
£'000 |
£'000 |
£'000 |
£'000 |
£'000 |
£'000 |
|
Total equity at 1 October 2025 |
|
31,037 |
6,575 |
80,685 |
3,672 |
324,693 |
1,448 |
448,110 |
|
Total comprehensive income: |
|
|
|
|
|
|
|
|
|
Profit for the half year ended 31 March 2026 |
|
- |
- |
- |
- |
24,074 |
1,476 |
25,550 |
|
Transactions with owners, recorded directly to equity: |
|
|
|
|
|
|
|
|
|
Shares bought back into treasury pursuant to tender offer (including costs) |
6 |
- |
- |
- |
- |
(118,018) |
- |
(118,018) |
|
Issue of shares out of treasury |
6 |
- |
- |
987 |
- |
21,402 |
- |
22,389 |
|
Equity dividends paid |
|
- |
- |
- |
- |
- |
(977) |
(977) |
|
Total equity at 31 March 2026 |
|
31,037 |
6,575 |
81,672 |
3,672 |
252,151 |
1,947 |
377,054 |
|
|
|
Half year ended 31 March 2025 (Unaudited) |
||||||
|
|
|
Called up share capital
|
Capital redemption reserve |
Share premium reserve |
Special distributable reserve |
Capital reserves |
Revenue reserve |
Total Equity |
|
|
|
£'000 |
£'000 |
£'000 |
£'000 |
£'000 |
£'000 |
£'000 |
|
Total equity at 1 October 2024 |
|
31,037 |
6,575 |
80,685 |
3,672 |
354,300 |
2,804 |
479,073 |
|
Total comprehensive (expense)/income: |
|
|
|
|
|
|
|
|
|
(Loss)/profit for the half year ended 31 March 2025 |
|
- |
- |
- |
- |
(49,632) |
562 |
(49,070) |
|
Transactions with owners, recorded directly to equity: |
|
|
|
|
|
|
|
|
|
Equity dividends paid |
|
- |
- |
- |
- |
- |
(1,455) |
(1,455) |
|
Total equity at 31 March 2025 |
|
31,037 |
6,575 |
80,685 |
3,672 |
304,668 |
1,911 |
428,548 |
|
|
|
Year ended 30 September 2025 (Audited) |
||||||
|
|
|
Called up share capital
|
Capital redemption reserve |
Share premium reserve |
Special distributable reserve |
Capital reserves |
Revenue reserve |
Total Equity |
|
|
|
£'000 |
£'000 |
£'000 |
£'000 |
£'000 |
£'000 |
£'000 |
|
Total equity at 1 October 2024 |
|
31,037 |
6,575 |
80,685 |
3,672 |
354,300 |
2,804 |
479,073 |
|
Total comprehensive (expense)/income: |
|
|
|
|
|
|
|
|
|
(Loss)/profit for the half year ended 30 September 2025 |
|
- |
- |
- |
- |
(29,607) |
1,554 |
(28,053) |
|
Equity dividends paid |
|
- |
- |
- |
- |
- |
(2,910) |
(2,910) |
|
Total equity at 31 March 2025 |
|
31,037 |
6,575 |
80,685 |
3,672 |
324,693 |
1,448 |
448,110 |
CASH FLOW STATEMENT
For the half year ended 31 March 2026
|
|
|
||
|
|
(Unaudited) Half year ended 31 March 2026 £'000 |
(Unaudited) Half year ended 31 March 2025 £'000 |
(Audited) Year ended 30 September 2025 £'000 |
|
Cash flows from operating activities |
|
|
|
|
Profit/(Loss) before tax |
26,099 |
(48,857)* |
(27,526)* |
|
Adjustment for non-cash items: |
|
|
|
|
(Gains)/losses on investments held at fair value through profit or loss |
(26,897) |
48,161 |
26,558 |
|
Adjusted loss before tax |
(798) |
(696) |
(968) |
|
Adjustments for: |
|
|
|
|
Purchases of investments, including transaction costs |
(426,648) |
(208,141) |
(485,249) |
|
Sales of investments, including transaction costs |
488,767 |
208,584 |
497,444 |
|
(Increase)/decrease in receivables |
(30) |
(150) |
96 |
|
Increase/(Decrease) in payables |
(85) |
(67) |
(22) |
|
Finance costs |
359 |
16* |
33* |
|
Indian capital gains tax |
(49) |
- |
(1) |
|
Overseas tax deducted at source |
(518) |
(211) |
(534) |
|
Net cash generated/(used in) from operating activities |
60,998 |
(665) |
10,799 |
|
Cash flows from financing activities |
|
|
|
|
Finance costs paid |
(95) |
(16) |
(33) |
|
Shares repurchased from tender offer into treasury (including costs) |
(118,018) |
- |
- |
|
Shares reissued from treasury |
22,389 |
- |
- |
|
Loan drawn |
40,000 |
- |
- |
|
Equity dividends paid |
(977) |
(1,455) |
(2,910) |
|
Net cash used in financing activities |
(56,701) |
(1,471) |
(2,943) |
|
Net increase/(decrease) in cash and cash equivalents |
4,297 |
(2,136) |
7,856 |
|
Cash and cash equivalents at the beginning of the period |
17,034 |
9,178 |
9,178 |
|
Cash and cash equivalents at the end of the period |
21,331 |
7,042 |
17,034 |
*For both the half year and year ended, the cash flow has been represented from "Profit/(Loss) before tax" (previously "Profit/(Loss) before finance costs and tax") to reflect finance costs within cash flows from operating activities, ensuring comparability with the current year.
NOTES TO THE FINANCIAL STATEMENTS
For the half year ended 31 March 2026
1. General Information
The financial statements comprise the unaudited results of the Company for the six month period to 31 March 2026.
The Company's unaudited financial statements to 31 March 2026 have been prepared using the accounting policies used in the Company's financial statements to 30 September 2025. These accounting policies are based on UK-adopted International Accounting Standards ("UK-adopted IAS").
The financial information in this half year financial report does not constitute statutory accounts as defined in section 434 of the Companies Act 2006.
The financial information for the periods ended 31 March 2026 and 31 March 2025 have not been audited. The figures and financial information for the year ended 30 September 2025 are an extract from the latest published accounts and do not constitute statutory accounts for that year. Full statutory accounts for the year ended 30 September 2025, prepared under UK-adopted IAS, including the report of the auditors which was unqualified, did not draw attention to any matters by way of emphasis and did not contain a statement under section 498 of the Companies Act 2006.
The Company's accounting policies have not varied from those described in the financial statements for the year ended 30 September 2025. However, the basis of allocation for investment management fees and finance costs has been revised to 90% capital and 10% revenue (31 March 2025 and 30 September 2025: 80% capital and 20% revenue), following the Directors' evaluation of the expected long-term allocation of revenue and capital returns from the Company's investment portfolio. Comparative figures have not been restated.
The Company's financial statements are presented in Pounds Sterling and all values are rounded to the nearest thousand pounds (£'000), except where otherwise stated.
The Board continually monitors the financial position of the Company. The Directors have considered an assessment of the Company's ability to meet its liabilities as they fall due. The assessment took account of the Company's current financial position, its cash flows and its liquidity position. In light of the results of these tests, the Company's cash balances, and the liquidity positions, the Directors consider that the Company has adequate financial resources to enable it to continue in operational existence. Accordingly, the Directors believe that it is appropriate to continue to adopt the going concern basis in preparing the Company's Financial Statements.
There were no new UK-adopted IAS or amendments to UK-adopted IAS applicable to the current year which had any significant impact on the Company's Financial Statements.
|
2. DIVIDENDS and OTHER Income |
(Unaudited) For the half year ended 31 March 2026 £'000 |
(Unaudited) For the half year ended 31 March 2025 £'000 |
(Audited) For the year ended 30 September 2025 £'000 |
|
Investment income |
|
|
|
|
Revenue: |
|
|
|
|
UK Dividend income |
264 |
- |
316 |
|
Overseas Dividend income |
2,118 |
1,449 |
3,072 |
|
Total investment income allocated to revenue |
2,382 |
1,449 |
3,388 |
|
Other operating income |
|
|
|
|
Bank interest |
90 |
42 |
83 |
|
Total other operating income |
90 |
42 |
83 |
There were no dividends allocated to capital as at 31 March 2026 (31 March 2025 and 30 September 2025: nil).
|
3. EARNINGS/(LOSSES) PER ORDINARY SHARE |
(Unaudited) For the half year ended 31 March 2026 £'000 |
(Unaudited) For the half year ended 31 March 2025 £'000 |
(Audited) For the year ended 30 September 2025 £'000 |
|
Basic earnings per Ordinary share: |
|
|
|
|
Net profit/(loss)for the period: |
|
|
|
|
Revenue |
1,476 |
562 |
1,554 |
|
Capital |
24,074 |
(49,632) |
(29,607) |
|
Total |
25,550 |
(49,070) |
(28,053) |
|
Weighted average number of shares in issue during the period |
104,613,647 |
121,270,000 |
121,270,000 |
|
Revenue |
1.41p |
0.46p |
1.28p |
|
Capital |
23.01p |
(40.93p) |
(24.41p) |
|
Total |
24.42p |
(40.47p) |
(23.13p) |
As at 31 March 2026 there were no potentially dilutive shares in issue (31 March 2025 and 30 September 2025: nil).
4. INVESTMENTS HELD AT FAIR VALUE
Under UK-adopted International Accounting Standards investments have been categorised into the following fair value hierarchy:
Level 1: Unadjusted prices quoted in active markets for identical assets and liabilities.
Level 2: Having inputs other than quoted prices included within Level 1 that are observable for the asset or liability, either directly (i.e. as prices) or indirectly (i.e. derived from prices).
Level 3: Having inputs for the asset or liability that are not based on observable market data.
The fair value hierarchy analysis for investments held at fair value at the period end is as follows:
|
Fair value hierarchy |
(Unaudited) For the half year ended 31 March 2026 £'000 |
(Unaudited) For the half year ended 31 March 2025 £'000 |
(Audited) For the year ended 30 September 2025 £'000 |
|
Level 1 assets |
395,362 |
420,732 |
439,435 |
|
Total value of investments |
395,362 |
420,732 |
439,435 |
All Level 1 assets are traded on a recognised Stock Exchange.
|
5. Net asset value per share |
(Unaudited) For the half year ended 31 March 2026 |
(Unaudited) For the half year ended 31 March 2025 |
(Audited) For the year ended 30 September 2025 |
|
Ordinary shares |
|
|
|
|
Net assets attributable to Ordinary shareholders (£'000) |
377,054 |
428,548 |
448,110 |
|
Ordinary shares in issue at end of period |
99,365,000 |
121,270,000 |
121,270,000 |
|
Net asset value per Ordinary share (pence) |
379.46 |
353.38 |
369.51 |
As at 31 March 2026 there were no potentially dilutive shares in issue (31 March 2025 and 30 September 2025: nil).
6. SHARE CAPITAL
During the six months ended 31 March 2026, as part of the tender offer on 28 November 2025, 27,253,026 Ordinary shares were repurchased into treasury (31 March 2025 and 30 September 2025: nil) for total consideration of £116,572,000 (31 March 2025 and 30 September 2025: nil), plus expenses of £1,446,000, of which £17,500 relates to non-audit services, as defined under IAS 32.
Following this, the Company reissued 5,348,026 Ordinary shares out of treasury (31 March 2025 and 30 September 2025: nil) for a total consideration of £22,389,000 (31 March 2025 and 30 September 2025: nil).
7. DIVIDENDS
Dividends for the current financial year ending 30 September 2026, if declared, will be paid in August 2026 and February 2027.
8. RELATED PARTY TRANSACTIONS
There have been no related party transactions that have materially affected the financial position or the performance of the Company during the six month period to 31 March 2026.
9. POST BALANCE SHEET EVENTS
Subsequent to the period end and to 28 May 2026 (the latest practicable date), 925,000 Ordinary shares were reissued out of treasury at an average price of 396.28p per share. Following this, the Company's issued share capital consists of 124,149,256 Ordinary shares of which 23,859,256 are held in treasury.
There are no other significant events that have occurred after the end of the reporting period to the date of this report which require disclosure.
ALTERNATIVE PERFORMANCE MEASURES (APMS)
In assessing the performance of the Company, the Investment Manager and the Directors use the following APMs which are not defined in accounting standards or law but are considered to be known industry metrics:
NAV Total Return
The NAV total return shows how the net asset value has performed over a period of time taking into account both capital returns and dividends paid to shareholders. NAV total return is calculated as the change in NAV from the start of the period, assuming that dividends paid to shareholders are reinvested on the payment date in Ordinary shares at their net asset value.
|
|
|
For the half year ended 31 March 2026 |
Year ended 30 September 2025 |
|
Opening NAV per share |
a |
369.51p |
395.05p |
|
Closing NAV per share |
b |
379.46p |
369.51p |
|
Dividend reinvestment factor |
c |
1.002407 |
1.006441 |
|
Adjusted closing NAV per share |
d=b*c |
380.37p |
371.89p |
|
NAV total return |
(d/a)-1 |
2.94% |
(5.86%) |
Share Price Total Return
Share price total return shows how the share price has performed over a period of time. It assumes that dividends paid to shareholders are reinvested in the shares at the time the shares are quoted ex-dividend.
|
|
|
For the half year ended 31 March 2026 |
Year ended 30 September 2025 |
|
Opening share price |
a |
355.00p |
376.00p |
|
Closing share price |
b |
366.00p |
355.00p |
|
Dividend reinvestment factor |
c |
1.002337 |
1.006885 |
|
Adjusted closing share price |
d = b*c |
366.86p |
357.44p |
|
Share price total return |
(d / a)-1 |
3.34% |
(4.94%) |
(Discount)/Premium
A description of the difference between the share price and the net asset value per share usually expressed as a percentage (%) of the net asset value per share. If the share price is higher than the NAV per share the result is a premium. If the share price is lower than the NAV per share, the shares are trading at a discount.
|
|
|
31 March 2026 |
30 September 2025 |
|
Closing share price |
b |
366.00p |
355.00p |
|
Closing NAV per share |
c |
379.46p |
369.51p |
|
Discount per Ordinary share |
(a / b)-1 |
(3.55%) |
(3.93%) |
Ongoing Charges
Ongoing charges are calculated in accordance with AIC guidance by taking the Company's annual ongoing charges, excluding performance fees and exceptional items, if any, and expressing them as a percentage of the average daily net asset value of the Company over the year.
Ongoing charges include all regular operating expenses of the Company. Transaction costs, interest payments, tax and non-recurring expenses are excluded from the calculation as are the costs incurred in relation to share issues and share buybacks.
The ongoing charges figure as at 31 March 2026 is for the six month period from 30 September 2025 and is annualised for comparison with the full year's calculation as at 30 September 2025.
|
|
|
For the half year ended 31 March 2026 £'000 |
Year ended 30 September 2025 £'000 |
|
Investment Management fee |
|
1,503 |
3,153 |
|
Other Administrative Expenses |
|
498 |
855 |
|
|
a |
2,001 |
4,008 |
|
Average daily net assets value |
b |
423,609 |
443,517 |
|
Ongoing Charges |
(a/182*365) / bx100 |
0.95% |
0.90% |
|
|
|
|
|
Net Gearing or (Net Cash)
Gearing is calculated in line with AIC guidelines and represents net gearing, i.e. borrowings less cash and cash equivalents divided by net assets. If the amount calculated is negative, this is shown as a 'net cash' position. Cash and cash equivalents are cash, purchases and sales for future settlement outstanding at the period/year end.
|
|
|
31 March 2026 £'000 |
30 September 2025 £'000 |
|
Borrowings |
a |
40,000 |
- |
|
Less Cash and cash equivalents (including amounts awaiting settlement) |
b |
21,331 |
8,182 |
|
|
c=(a-b) |
18,669 |
(8,182) |
|
Net assets |
d |
377,054 |
448,110 |
|
Net gearing/(cash) |
(c/d)*100 |
4.95% |
(1.83%) |
FORWARD LOOKING STATEMENTS
Certain statements included in this half-year financial report incorporating the interim management report contain forward-looking information concerning the Company's strategy, operations, financial performance or condition, outlook, growth opportunities or circumstances in the countries, sectors or markets in which the Company operates. By their nature, forward-looking statements involve uncertainty because they depend on future circumstances, and relate to events, not all of which are within the Company's control or can be predicted by the Company. Although the Company believes that the expectations reflected in such forward-looking statements are reasonable, no assurance can be given that such expectations will prove to have been correct. Actual results could differ materially from those set out in the forward-looking statements. For a detailed analysis of the factors that may affect our business, financial performance or results of operations, we urge you to look at the principal risks and uncertainties included in the Strategic Report section of the Annual Report for the year ended 30 September 2025. No part of these results constitutes, or shall be taken to constitute, an invitation or inducement to invest in Polar Capital Global Healthcare Trust plc or any other entity and must not be relied upon in any way in connection with any investment decision. The Company undertakes no obligation to update any forward-looking statements.
HALF YEAR REPORT
The Company has opted not to post half year reports to shareholders. Copies of this announcement will be available from the Company Secretary at the Registered Office, 16 Palace Street, London, SW1E 5JD and from the Company's website at www.polarcapitalglobalhealthcaretrust.co.uk
Neither the contents of the Company's website nor the contents of any website accessible from the hyperlinks on the Company's website (or any other website) is incorporated into or forms part of this announcement.
RNS may use your IP address to confirm compliance with the terms and conditions, to analyse how you engage with the information contained in this communication, and to share such analysis on an anonymised basis with others as part of our commercial services. For further information about how RNS and the London Stock Exchange use the personal data you provide us, please see our Privacy Policy.

Latest directors dealings
- 8 hours ago DCC Energy PLC
- 9 hours ago On The Beach Group
- 10 hours ago Canal+ SA
- 11 hours ago Galliford Try
- 11 hours ago SSE