
Half-year Financial Report
Summary by AI BETAClose X

The information contained within this announcement is deemed by the Company to constitute inside information pursuant to Article 7 of EU Regulation 596/2014 as it forms part of UK domestic law by virtue of the European Union (Withdrawal) Act 2018 as amended. Upon the publication of this announcement via a Regulatory Information Service, this inside information is now considered to be in the public domain.
Onward Opportunities Limited
("Onward Opportunities" or the "Company")
Interim Results
Onward Opportunities Limited (LSE: ONWD), the investment company targeting opportunities in UK smaller companies, today reports its unaudited interim results for the six-month period ended 30 June 2026.
Highlights
Highlights in the reporting period to 30 June 2026 include:
Company Update
HY26 NAV performance
§ Net Asset Value ("NAV") of 123.5 pence per share at 30 June 2026, equating to a NAV decrease of 14.1% from the all-time highs at the end of 2025, causing the Company's first period of NAV underperformance.
§ The share prices of the Company's mark to market portfolio of under-owned investments suffered materially during Q1 in response to global market volatility, in similar fashion to Q1 2025. The fund's top 10 holdings saw an average share price decline of 28.6% during the first quarter - but only two went on to issue profit warnings.
§ Share prices of all portfolio investments then lagged the global recovery in risk assets, again a repeat of the trend seen in 2025. Micro caps typically require company specific updates to trigger price recoveries. Many of these were due after the reporting period in H2 and have since started to come through with NAV subsequently fully recovering to pre-crisis levels. The majority of investments still currently offer higher profits at lower share prices.
§ Consistent long-term outperformance since inception was maintained despite persistent headwinds - NAV performance of +29.1% since inception in March 2023 to 30 June 2026, outperforming both AIC UK Smaller Companies sector by +12.3% and the IA UK Smaller Companies sector by +10.0%.
Continued inflows as the Company capitalises on its recent main market listing
§ To date this year, the Company has issued 4.4m shares, raising £6.2m and once again ranking among the top 10 London-listed investment companies by capital raised relative to market capitalisation.
§ The Company successfully completed its move to the Main Market from AIM on 16 April 2026, when its ordinary shares were admitted to the closed-ended investment funds segment of the Official List and the trading in the Company's shares on AIM was cancelled. Daily trading liquidity has more than quadrupled since.
Post period end highlights (1 July 2026 - 2 September 2026)
Pronounced NAV recovery to a new record post-period end
§ Reassuring completion of the recovery in Q3, with the NAV closing September 2nd at 160.3p, a +45.4% rally from the 31 March lows to a new record high for the Company.
§ However, many holdings remain well below 12-month highs despite good updates, so further NAV growth is expected throughout the remainder of the year with line of sight on a number of material catalysts. Therefore the Company hopes to deliver its absolute return targets of 15% per annum for the year versus the 143.5p closing NAV of 2025.
§ A number of significant earnings upgrades at RentGuarantor have enabled the Investment Committee to capture significantly profitable realisations. It has been agreed by both the Investment Committee and the independent Board to realise profits in order to reduce the weighting. Therefore an initial c.20% of the original investment has been sold for a value of £2.9m, more than fully recouping the Company's invested capital.
Portfolio Update
§ A number of investee companies have announced profits that are either higher, or ahead of expectations, in recent weeks with notable examples including: Audioboom, Rent Guarantor, Mincon, Likewise, Pebble Beach Systems, The Mission Group and Fintel. Notwithstanding this strong operating performance, all ended June with share prices materially lower than their 52-week highs, creating opportunities for future portfolio returns.
§ Setbacks included Alumasc and Light Science Technologies, as construction sector weakness and building safety regulator delays combined to trigger profit warnings from both. Similarly, Synectics struggled with Middle East disruption; a key geography for some energy and hospitality customers.
§ New core holdings of Fintel and Mincon added, two new nursery holdings initiated but not yet disclosed.
Laurence Hulse, Lead Fund Manager, said:
"Ah, the Ides of March. In each of 2023, 2025 and 2026 it has proven to be a torrid month for investors in UK smaller companies with a large wake that disproportionately affects unloved, small, illiquid investments such as those held by Onward Opportunities. It is fitting that in the year of the Fire Horse, we have had our worst month of investment performance in March, followed by our best ever in August as our portfolio successfully weathered another global crisis, and came back stronger. We have recently crossed the £50m threshold for the first time and it is expected that the company will grow further, delivering clear liquidity and cost benefits for all shareholders, allowing us to do more for less in our fourth year and beyond.
Post period end, a number of our investee companies have announced strong updates which has initiated a recovery in their share prices toward levels seen 'pre-crisis'. We have a number of investments where despite profits growing by double digits, share prices have declined by double digits. In one extreme example, profits are doubling but the shares had almost halved in value. This is why we are looking onward; there are value opportunities abound for the long-term investor as our +22.6% recovery in July and August has started to demonstrate.
Riding the crisis out and then the conviction required during the typically delayed micro-cap recoveries has been the biggest test yet of the strategy and team in these foundational years. We are sanguine as to what might follow for shareholders in the second half and beyond as the NAV is at a record high despite two thirds of the portfolio trading significantly below their 52-week highs, often despite strong trading. Supplementing this is an attractive nursery pipeline that anticipated inflows and realisations will be deployed. Onwards."
Andrew Henton, Chairman, added:
"The dangers of hubris and complacency will always risk bedevilling successful investors, and it can occasionally be the role of a Chair to remind "star" managers that they are mortal. To date, the ONWD journey has been one strewn with obstacles and challenges, and there has been no room for any hubris or complacency. This reality has served to condition and season the culture and outlook of the investment team; I hope to its enduring benefit. To that end, I celebrate another half year that has been very challenging, but which has yielded more positive progress."
[ENDS]
For further information, please contact:
|
Onward Opportunities Limited Andrew Henton, Chairman
Dowgate Wealth Limited (Portfolio Manager) Laurence Hulse, Founder & Lead Fund Manager
|
Via Houston
|
|
Cavendish Capital Markets Limited (Corporate Broker) Ben Jeynes / Robert Peel / Seamus Fricker - Corporate Finance Chris West / Justin Zawoda-Martin - Sales |
Tel: +44 (0)20 7220 0500 |
|
|
|
|
Houston (PR advisers) Charlie Barker / Nick Jackman
NSM Funds Limited (Secretary)
|
Tel: +44 (0)77 3303 2695 Onward@houston.co.uk
Tel: +44 (0)1481 743030 onwardopportunities@nsm.group
|
Interim Report and Unaudited Condensed Interim Financial Statements
For the period ended 30 June 2026
Highlights in the reporting period to 30 June 2026 include:
Company Update
HY26 NAV performance
§ Net Asset Value ("NAV") of 123.5 pence per share at 30 June 2026, equating to a NAV decrease of 14.1% from the all-time highs at the end of 2025, causing the Company's first period of NAV underperformance.
§ The share prices of the Company's mark to market portfolio of under-owned investments suffered materially during Q1 in response to global market volatility, in similar fashion to Q1 2025. The fund's top 10 holdings saw an average share price decline of 28.6% during the first quarter - but only two went on to issue profit warnings.
§ Share prices of all portfolio investments then lagged the global recovery in risk assets, again a repeat of the trend seen in 2025. Micro caps typically require company specific updates to trigger price recoveries. Many of these were due after the reporting period in H2 and have since started to come through with NAV subsequently fully recovering to pre-crisis levels. The majority of investments still currently offer higher profits at lower share prices.
§ Consistent long-term outperformance since inception was maintained despite persistent headwinds - NAV performance of +29.1% since inception in March 2023 to 30 June 2026, outperforming both AIC UK Smaller Companies sector by +12.3% and the IA UK Smaller Companies sector by +10.0%.
Continued inflows as the Company capitalises on its recent main market listing
§ To date this year, the Company has issued 4.4m shares, raising £6.2m and once again ranking among the top 10 London-listed investment companies by capital raised relative to market capitalisation.
§ The Company successfully completed its move to the Main Market from AIM on 16 April 2026, when its ordinary shares were admitted to the closed-ended investment funds segment of the Official List and the trading in the Company's shares on AIM was cancelled. Daily trading liquidity has more than quadrupled since.
Post period end highlights (1 July 2026 - 2 September 2026)
Pronounced NAV recovery to a new record post-period end
§ Reassuring completion of the recovery in Q3, with the NAV closing September 2nd at 160.3p, a +45.4% rally from the 31 March lows to a new record high for the Company.
§ However, many holdings remain well below 12-month highs despite good updates, so further NAV growth is expected throughout the remainder of the year with line of sight on a number of material catalysts. Therefore the Company hopes to deliver its absolute return targets of 15% per annum for the year versus the 143.5p closing NAV of 2025.
§ A number of significant earnings upgrades at RentGuarantor have enabled the Investment Committee to capture significantly profitable realisations. It has been agreed by both the Investment Committee and the independent Board to realise profits in order to reduce the weighting. Therefore an initial c.20% of the original investment has been sold for a value of £2.9m, more than fully recouping the Company's invested capital.
Portfolio Update
§ A number of investee companies have announced profits that are either higher, or ahead of expectations, in recent weeks with notable examples including: Audioboom, Rent Guarantor, Mincon, Likewise, Pebble Beach Systems, The Mission Group and Fintel. Notwithstanding this strong operating performance, all ended June with share prices materially lower than their 52-week highs, creating opportunities for future portfolio returns.
§ Setbacks included Alumasc and Light Science Technologies, as construction sector weakness and building safety regulator delays combined to trigger profit warnings from both. Similarly, Synectics struggled with Middle East disruption; a key geography for some energy and hospitality customers.
§ New core holdings of Fintel and Mincon added, two new nursery holdings initiated but not yet disclosed.
Laurence Hulse, Lead Fund Manager, said:
"Ah, the Ides of March. In each of 2023, 2025 and 2026 it has proven to be a torrid month for investors in UK smaller companies with a large wake that disproportionately affects unloved, small, illiquid investments such as those held by Onward Opportunities. It is fitting that in the year of the Fire Horse, we have had our worst month of investment performance in March, followed by our best ever in August as our portfolio successfully weathered another global crisis, and came back stronger. We have recently crossed the £50m threshold for the first time and it is expected that the company will grow further, delivering clear liquidity and cost benefits for all shareholders, allowing us to do more for less in our fourth year and beyond.
Post period end, a number of our investee companies have announced strong updates which has initiated a recovery in their share prices toward levels seen 'pre-crisis'. We have a number of investments where despite profits growing by double digits, share prices have declined by double digits. In one extreme example, profits are doubling but the shares had almost halved in value. This is why we are looking onward; there are value opportunities abound for the long-term investor as our +22.6% recovery in July and August has started to demonstrate.
Riding the crisis out and then the conviction required during the typically delayed micro-cap recoveries has been the biggest test yet of the strategy and team in these foundational years. We are sanguine as to what might follow for shareholders in the second half and beyond as the NAV is at a record high despite two thirds of the portfolio trading significantly below their 52-week highs, often despite strong trading. Supplementing this is an attractive nursery pipeline that anticipated inflows and realisations will be deployed. Onwards."
Andrew Henton, Chairman, added:
"The dangers of hubris and complacency will always risk bedevilling successful investors, and it can occasionally be the role of a Chair to remind "star" managers that they are mortal. To date, the ONWD journey has been one strewn with obstacles and challenges, and there has been no room for any hubris or complacency. This reality has served to condition and season the culture and outlook of the investment team; I hope to its enduring benefit. To that end, I celebrate another half year that has been very challenging, but which has yielded more positive progress."
Chairman's Statement
Onward Opportunities Limited ("ONWD" or "the Company") listed on the AIM market on 30 March 2023. As at 2 September 2026 (the latest practicable date prior to the publication of this report) the net asset value ("NAV")[1] per share was 160.33p and the share price 151.50p, representing a discount to NAV of 5.2% and a NAV performance of 67.6% since inception.
Portfolio development
As at 2 September 2026, the Fund was 96% invested into equities, and the NAV was up by 67.6% since inception compared to the AIM market total return performance of 4.3% and AIC peer group NAV performance of 25.8%.
The Company finished the calendar year in 2025 on something of a high having delivered NAV appreciation of just over 50% since inception. At the time we were approaching ONWD's three-year anniversary on a wave of excited anticipation; with a track record that proved the existence both of a structural market opportunity and processes capable of exploiting it, we were planning the transfer of the Company's listing to the main market in London followed by a more deliberate marketing roadshow to new prospective investors. Donald Trump's attack on Iran surely counts as one of those "events" so bemoaned by Harold Macmillan for upsetting the best laid plans, and its timing duly coincided with our corporate action timetable. The three-year anniversary coincided precisely with the market sell off low and the nadir of the Company's NAV this year. The impact of that attack on global asset prices, and the ongoing rollercoaster gyrations in response to every piece of news flow, reflect how difficult it is to assess whether the global economy is facing a potential paradigm shift. Some or all of higher for longer oil prices and interest rates, global stagflation, US Treasury Bills losing their status as "risk free" instruments and further pressure to onshore in order to protect trade and other vital interests, all have the potential to fundamentally undermine valuation models.
The ONWD portfolio was never going to be immune to an idiosyncratic shock of such magnitude, and our companies were caught up in the general "risk off" investor response. The portfolio NAV fell 19.5% in March during the heights of the volatility. That the portfolio has since bounced back reflects the strength and resilience of the identified valuation catalysts in the names within it, itself a reflection of the diligence and effort put in by our Stakhanovite investment management team. The Portfolio Manager's review highlights a number of case study exemplars, but the focus on quality and value should continue to underpin performance even in the face of tumultuous macro events. Your board remains enthused by the investment cases supporting individual names and reassured by the more limited downside associated with entry price multiples far removed from those associated with the NASDAQ and S&P - both of which weigh heavily on global equity indices. The Portfolio Manager has a pipeline of further identified attractive opportunities, into which new liquidity can be deployed. Despite world events therefore, we remain positive about ONWD's prospects.
Corporate actions
Notwithstanding market conditions, your Board decided to press ahead with the transfer of ONWD's shares from the AIM to a Main Market listing in London, which took place on 16 April 2026. The fundamental motivation of increasing market access for our shares remained and, although we were not then in a position contemporaneously to raise new money, we were confident that the longer-term merits of the move remained. This faith has been borne out and, as the portfolio NAV has bounced back, the Company has successfully raised in aggregate £6.2m of new money year to date and daily trading liquidity has quadrupled. We will continue opportunistically to do so, and as our NAV grows (a function both of capital raising and performance) we will increasingly be able to target new investors.
Investor engagement
We intend to hold the next investor event on 25th November in London and hope to see as many of you as possible in person then. This will present another opportunity to provide an update on portfolio performance, and for my fellow board members and me to meet with shareholders to discuss the Fund.
Conclusion
The dangers of hubris and complacency will always risk bedevilling successful investors, and it can occasionally be the role of a Chair to remind "star" managers that they are mortal. To date, the ONWD journey has been one strewn with obstacles and challenges, and there has been no room for any hubris or complacency. This reality has served to condition and season the culture and outlook of the investment team, I hope to its enduring benefit. To that end, I celebrate another half year that has been very challenging, but which has yielded more positive progress.
I look forward to updating you further when I write again to report on the full year ending 31 December 2026.
Andrew Henton
Chairman
7 September 2026
Portfolio Manager's Report
Introduction
At the full year, we noted that 2026 was the Year of the Fire Horse, symbolising bold action, perseverance and success. Let us see, we said. Well, we have seen. By the end of March crucial energy infrastructure were ablaze, the stable door was washing away somewhere near the Strait of Hormuz and UK smaller-company investors had been left holding empty reins. Perseverance was going to be required if there was to be any hope of success and this management team was in for its biggest test yet.
The year had begun rather more sedately. The UK 100 Index had finally broken through 10,000, inflation appeared to be heading in the right direction, three interest-rate reductions were expected and there were encouraging signs that investors were beginning to rediscover the value available in UK equities. Onward entered the year at all-time highs and completed its largest capital raise since launch, raising £4.5m in January at 146.13p per share - a premium to NAV - from new and existing shareholders. The capital provided an opportunity to invest in a strong pipeline of identified holdings, including new core investments Fintel and Mincon. There was a sense that the tracks had been laid for another productive year. For several weeks, the train even remained on them.
Then the Middle East conflict erupted, the Strait of Hormuz closed and a geopolitical crisis became an immediate energy, inflation and interest-rate shock. The global equity-market response was sharp, but its effects were particularly severe in the neglected and less liquid end of the UK market in which Onward operates. Liquidity again became an investment theme in its own right. Companies with healthy balance sheets, growing profits and no obvious direct exposure to the conflict were marked down relentlessly alongside businesses with genuine earnings risk, and the market substituted a sledgehammer for a valuation model. Across our top ten holdings the average share price decline was 28.3% in March alone.
This distinction does not make the loss less real. Shareholders don't benefit from a "behaviourally adjusted NAV", and neither does the Manager. But it matters greatly when assessing what happens next. A portfolio of deteriorating businesses requires repair. A portfolio in which earnings are rising while valuations contract requires catalysts, communication and patience. So the Board and Fund Manager all took the opportunity to add to their personal holdings in the Company and battened down the hatches.
The Company itself continued to grow despite the investment drawdown. Shares in issue increased from 29.7m at the end of 2025 to 33.7m at 30 June 2026, an increase of approximately 13.4%. Period-end net assets were approximately £41.6m, only modestly below the £42.7m at the end of 2025 despite the 14.1% fall in NAV per share, reflecting continued capital inflows. By 6 August 2026, the Company had issued 4.4m shares and raised £6.2m during 2026 to date, once again placing it among the top ten London-listed investment companies for capital raised relative to market capitalisation.
This is a considerable show of confidence. Capital continued to arrive during the Company's most difficult reporting period ever, and not just only after strong performance. The distinction matters. It suggests that shareholders increasingly understand not merely the returns delivered to date but the investment philosophy, structure and long-term opportunity which underpin them.
An important feature of the growth has been the Company's migration from AIM to the Main Market on 16 April 2026, which has quadrupled daily trading values. This was an important milestone only three years after launch and should broaden the potential shareholder base, improve the Company's corporate profile and give it access to larger pools of capital over time. It does not make the underlying investments more liquid, but it strengthens the vessel through which shareholders gain access to them.
The key highlights for the period have been:
1. The portfolio showing a meaningful recovery, demonstrating the resilience of the strategy: NAV per share rose 12.0% in Q2 and a further 22.6% across July & August to a new all-time high of 151.43p, producing a 37.3% recovery from the 31 March low.
2. Long-term relative outperformance being maintained: at 30 June the NAV per share was up 29.1% since inception, remaining ahead of both the AIC and IA UK Smaller Companies peer groups. This outperformance spread over the two peer groups has expanded materially post period end to over 30% by the end of august.
3. Continued scalable demand for the strategy: the Company had raised £6.2m during the year by 31 August and again ranked among the leading London-listed investment companies for capital raised relative to its size.
4. A successful move to the Main Market, broadening the Company's potential investor base and establishing an appropriate platform for its next stage of growth. Daily liquidity has increased fourfold since the move.
Market Commentary
We wrote at the full year that 2025 might ultimately be remembered as the year viewers began returning to the theatre, initially to catch the trailer for The Odyssey, due for release in 2026. As it transpired, the feature presentation began rather earlier than scheduled. Poseidon kicked open the doors, scattered the popcorn and sent a burning oil tanker through the orchestra stalls.
The opening weeks had offered a fleeting glimpse of normality. The UK 100 Index had finally crossed 10,000, inflation appeared to be descending towards target and, at the Bank of England's February meeting, four of the nine members of the Monetary Policy Committee voted for an interest-rate cut. UK equities had begun to outperform overseas markets, international investors were rediscovering the attractions of inexpensive cash flows, and the customary January promises of a great rotation out of expensive US technology into cheaper international markets sounded marginally less fictitious than usual. For perhaps eight weeks, the audience even remained seated.
Then, on 28 February, Israel and the United States began military strikes against Iran. Iran retaliated against Israel, US bases and targets across the region, while disruption to the Strait of Hormuz transformed a geopolitical crisis into an immediate global economic shock. Before translating such events into oil prices, bond yields and basis points, it is right to acknowledge that their human consequences dwarf the market movements discussed here. Financial markets reduce tragedy to red and green numbers because that is their function; it does not mean they are of equal importance.
The economic transmission was nevertheless unusually direct. The Strait of Hormuz is the world's most important energy artery, carrying approximately 20 million barrels of oil and oil products per day before the conflict. By mid-March, the International Energy Agency reported that flows had been reduced to a trickle and that Gulf producers had cut output by at least 10 million barrels per day. The global economy had not merely developed indigestion; one of its principal arteries had acquired a clot.
Oil, gas and shipping costs rose sharply. Inflation expectations followed, the expected path of interest-rate cuts was rapidly erased and investors were reminded that the UK remains exceptionally efficient at importing inflation. Thus the market reaction exposed the peculiar anatomy of UK indices. During March, the UK 100 fell 6.7%, but the more domestically exposed UK 250 declined 10.8%, the UK Small Cap Index lost 10.4% and the AIM 100 fell 14.0%. Onward Opportunities fell 20%. The index containing the businesses least directly exposed to Iranian oil production therefore fell more than twice as much as the index containing the oil majors. This was not an earnings forecast; it was a liquidity event. Investors sold what they could, then what they could not, and finally whatever was left on the screen.
The UK market followed a similar course to 2025. On a total-return basis, the UK 250 rose 9.8% in the second quarter and the UK Small Cap Index gained 11.1%. AIM recovered 8.3%. Those rebounds left the UK 100 up 7.6% for the first half, the UK Small Cap Index up 7.0%, the UK 250 up 4.3%, but the AIM All-Share up only 1.6%. The scoreboard therefore portrayed a respectable half-year for London while disguising the fact that many of the players had spent March receiving treatment behind the goal.
The first half also extended the great UK capital-markets paradox. Prices recovered, valuations remained inexpensive and corporate buyers continued to identify value. Yet domestic savers kept withdrawing capital from equity funds. Calastone recorded £2.67bn of net outflows from equity funds during the first six months, while bond funds attracted £2.29bn and multi-asset products received a record £11.9bn. It is difficult to hold a public-market revival when the home supporters are still queueing for the exit.
International and corporate buyers remained rather less inhibited. Approximately 68% of UK public-market offers in the first half involved overseas bidders. Activity slowed sharply after the Middle East conflict began, before a cluster of firm offers towards the end of June indicated that appetite had not disappeared- it had merely gone to the back of the room to redo its financing assumptions. This is important. The repeated purchase of UK-listed companies by strategic and financial buyers is not evidence that UK public markets are functioning perfectly. It is evidence that they are setting clearing prices sufficiently low for someone else to remove the entirety of the assets. The discount between public and private valuations remains one of the most dependable sources of opportunity in our market, but every acquisition also removes another company, another pool of liquidity and creates one less reason for an institution to maintain a dedicated UK smaller-company team.
We remain firm believers that public markets are a public good. They allow ordinary savers to own productive businesses, founders to access permanent growth capital and successful companies to remain independent without surrendering control to private pools of money. That ecosystem cannot survive indefinitely if every undervalued company is purchased, every new business remains private and every domestic investor allocates their pension to an overseas index. But neither can it be revived by speeches alone. It requires returns and a policy framework to match. We can make gains from those catalysing events that removed pieces from the board, and will continue to do so, but the UK's population of high growth SMEs deserves so much better from its capital markets and government. Less TikTok and more slick stocks are required from the Prime Minister.
Top Holdings Table as at 30 June 2026
At 30 June 2026, the Company had 33,675,094 shares in issue and an unaudited NAV of 123.50p per share, equating to net assets of approximately £41.6m.
|
Holding |
Approx. £ Value |
% of Net Assets |
Thesis Summary |
Principal Catalysts |
Aggregate Total Return % |
|
Likewise Group plc |
c.£3.93m |
9.5% |
Market-share gains and operating leverage in UK flooring distribution |
Continued gains from distressed competitors, capacity expansion, margin conversion and improved cash generation |
+50.6% |
|
Angling Direct plc |
c.£3.47m |
8.3% |
Dominant UK position, margin recovery and strategic optionality |
Store rollout, MyAD growth, share buybacks, further UK upgrades and resolution of European losses |
+41.6% |
|
Audioboom Group plc |
c.£3.42m |
8.2% |
Structural podcast growth, platform operating leverage and strategic value |
Showcase growth, video monetisation, H2 advertising seasonality, cash conversion and capital allocation following the strategic review |
+49.8% |
|
Fintel plc |
c.£3.26m |
7.8% |
High-margin financial data and software embedded in adviser workflows |
SaaS and subscription growth, margin expansion, acquisition integration and deleveraging |
(8.4)% |
|
Pebble Beach Systems Group plc |
c.£3.08m |
7.4% |
Mission-critical broadcasting software with recurring revenue and increasing margins |
Tier 1 streaming rollout, recurring-revenue growth, net-cash transition and potential capital returns |
+105.3% |
|
RentGuarantor Holdings plc |
c.£2.85m |
6.9% |
Scalable platform benefiting from structural change in UK residential lettings |
Renters' Rights Act implementation, partner adoption, AI-enabled processing capacity and operating leverage |
+117.1% |
|
Synectics plc |
c.£2.55m |
6.1% |
Proprietary security software, strong balance sheet and strategic asset optionality |
Contract conversion, recurring revenues, capital deployment and normalisation of Middle Eastern project activity |
(16.4)% |
|
Light Science Technologies plc |
c.£2.15m |
5.2% |
Ownership of a differentiated cladding-remediation technology with a large addressable market |
Inject clad integration, regulatory approvals, contract conversion, installation capacity and cash generation |
+10.3% |
|
The Mission Group plc |
c.£2.06m |
4.9% |
Agency simplification, balance-sheet repair and sum-of-the-parts discount |
Margin recovery, cost savings, debt reduction and further strategic or disposal activity |
(11.4)% |
|
Alumasc Group plc |
c.£2.05m |
4.9% |
High-quality specified building-product brands with pricing power |
Conversion of the higher order book, Water Management recovery, cost action and leadership stability |
+8.1% |
Note: "Other holdings & cash" is the residual derived from Net Assets (£42.7m) less disclosed top-10 values; weights are from the top-10 disclosure.
Performance
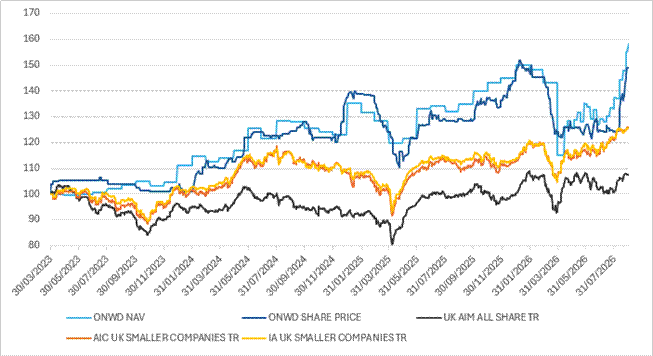
Portfolio performance - Chart depicted to 31 August, the last practicable date
|
Performance to 30th June 2026 |
1Y |
2Y |
3Y |
Since inception |
|
ONWD SP |
(5.7)% |
+0.8% |
+18.5% |
+25.0% |
|
ONWD NAV |
(3.8)% |
+6.2% |
+26.0% |
+29.1% |
|
UK AIM All-Share TR |
+1.9% |
+4.8% |
+8.4% |
+2.0% |
|
IA UK Smaller Co TR |
+2.5% |
+4.7% |
+19.5% |
+19.1% |
|
AIC UK Smaller Co NAV |
+3.0% |
+4.3% |
+18.6% |
+16.8% |
|
Performance to 31st August 2026 - the last practicable date |
1Y |
2Y |
3Y |
Since inception |
|
ONWD SP |
+15.5% |
+19.7% |
+43.3% |
+49.0% |
|
ONWD NAV |
+17.2% |
+23.6% |
+52.7% |
+58.3% |
|
UK AIM All-Share TR |
+8.0% |
+9.0% |
+15.7% |
+7.4% |
|
IA UK Smaller Co TR |
+11.4% |
+8.0% |
+28.3% |
+27.0% |
|
AIC UK Smaller Co NAV |
+14.2% |
+8.4% |
+31.7% |
+27.2% |
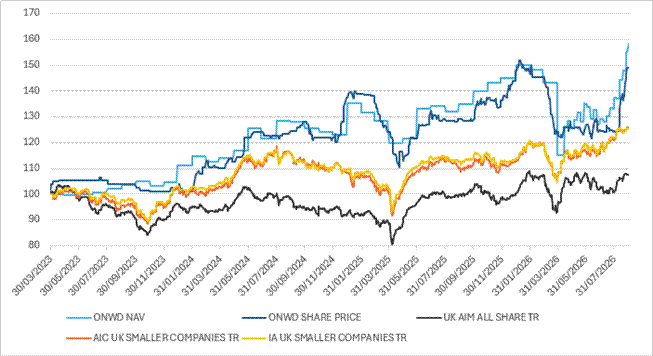
The Company recorded its first negative reporting period since launch in 2023. The NAV declined from the audited 31 December 2025 level of 143.69p to 123.50p at 30 June 2026, producing a six-month NAV total return of -14.1%. The shares closed the period at approximately 125.00p, compared with 148.00p at the end of 2025, producing a Total Shareholder Return of approximately negative 15.5%. The share price therefore ended June at a modest premium of approximately 1.2% to NAV.
March was the capitulation point. The NAV declined 19.5% during the month and 23.3% for the quarter. The top ten holdings fell by an average of 28.6%, despite only two subsequently issuing profit warnings. Put another way, the market behaved as though almost the entire portfolio was directly exposed to the same deterioration in earnings, when the evidence which followed showed that it was not.
This is the uncomfortable feature of investing in less liquid securities: during periods of stress, correlations move towards one because price discovery temporarily stops functioning. Audioboom sells advertising around podcasts, Likewise distributes flooring, Angling Direct sells fishing tackle and Fintel supplies financial data. None produces or is reliant upon a barrel of oil, but in March the market priced them all with the same geopolitical blunt instrument. The purpose of a concentrated portfolio is not to avoid volatility. It is to ensure that conviction is concentrated where the expected return justifies it. The danger is that concentration can amplify periods when the market temporarily refuses to discriminate between businesses. March was one such period, just as it was in 2025 and 2023 and in each of these UK small and micro-cap companies, particularly those listed on AIM, were particularly affected due to their lower liquidity.
The operating performance of the portfolio was considerably better than its mark-to-market performance and so the majority of investments ended the half with higher profits but lower share prices. Readers will go on to hear how Audioboom, RentGuarantor, Mincon, Likewise, Pebble Beach Systems, The Mission Group, Angling Direct and Fintel all subsequently delivered results or trading updates which were either ahead of expectations or demonstrated continued material progress and higher year on year profits. The principal operational setbacks were concentrated in Alumasc and Light Science Technologies and Synectics.
The largest source of weakness was broad-based de-rating rather than a single investment failure. Audioboom fell materially from its year-end level despite continuing to significantly grow revenue and profit, and even as it rejected three cash bids for the company that many shareholders had been holding out for. Synectics was affected by delays to projects in the Middle East, a genuinely relevant geography for its energy and gaming customers. Light Science Technologies and Alumasc both encountered more direct operating difficulties related to UK construction and building-safety regulator delays. Fintel's shares also de-rated following our initial investment, notwithstanding progress in shifting its revenue mix towards higher-margin software and proprietary data.
These declines were only partially offset by the more resilient performance of RentGuarantor, where implementation of the Renters' Rights Act was accelerating adoption; Pebble Beach Systems, where higher margins and debt reduction continued; Likewise, which was gaining market share from larger competitors; and Angling Direct, which maintained exceptional UK trading momentum. Mincon also began to contribute positively after being introduced as a new core investment in February.
The closed-ended structure of the fund was again crucial. An open-ended fund suffering redemptions during the quarter might have been required to sell its smallest or least liquid investments at precisely the prices that reflected the least information. Onward had no such requirement. We did not need to convert temporary mark-to-market pressure into permanent losses merely to provide liquidity to departing investors.
During this period of volatility the Investment Committee reviewed each holding on the basis of balance sheet, earnings expectations, direct exposure to the crisis and the probability of its identified catalysts still occurring. Exposure was not retained simply because prices had fallen. Nor was every decline treated as an opportunity to average down. Where investment cases remained intact, we retained conviction; where operating evidence deteriorated, we engaged with management and reassessed position sizing.
The second quarter began with a powerful recovery. NAV per share rose 9.3% in April and 7.0% in May. Global risk appetite improved, but Onward's recovery remained dependent on the return of buyers to individual companies rather than simply the reopening of the wider market. This is typical of UK micro-caps: the tide can turn offshore several weeks before water reaches the neglected ponds in which we fish.
During this period, several holdings began to demonstrate that share-price declines had materially overstated changes to their operating prospects. Angling Direct reported continued double-digit UK growth and substantial profit progression. Likewise continued to take share in a weak flooring market. Pebble Beach delivered strong margins and cash generation. RentGuarantor experienced accelerating demand ahead of implementation of the new rental legislation. Fintel continued to improve the quality and margin of its revenue, and Mission's restructuring began to produce higher profits from a smaller revenue base.
June interrupted the recovery, with NAV per share declining 4.2%. Some of this reflected ordinary profit-taking following the April and May rebound. There was also stock-specific volatility around the conclusion of Audioboom's strategic review, after its Board rejected three indicative approaches which it believed materially undervalued the business. Investors had briefly been offered the possibility of an immediate cash catalyst but were then asked to return to the longer-duration operating thesis. Markets are not always patient when handed coats back at the door.
The profits warnings from Light Science Technologies and Alumasc also weighed on confidence. At Light Science, regulatory and building-owner decision-making delayed the conversion of an attractive Injectaclad pipeline. At Alumasc, weak construction conditions and delays to Middle Eastern Water Management projects reduced profit expectations. Synectics continued to be affected by the timing of energy and hospitality projects in the region.
The NAV per share nevertheless finished the first half 12.0% above its March low. That was a meaningful recovery, but it did not disguise the fact that only around 40% of the first-quarter fall had been recovered by the reporting date.
Post period end, the flow of company information became much more supportive. Audioboom reported first-half revenue growth of 30% and adjusted EBITDA growth of 80%. RentGuarantor subsequently reported revenue growth of approximately 250% and moved into profitability. Likewise reported year-to-date revenue growth of approximately 17%, materially ahead of the wider flooring market. Pebble Beach reported revenue growth of approximately 10%, a 37% EBITDA margin and further substantial debt reduction. Fintel delivered 11% organic EBITDA growth, while Mission reported higher operating profit despite lower revenue.
These updates contributed to a further 6.5% NAV per share recovery during July, taking NAV to 131.53p. At that point the NAV per share was 19.3% above the March low and only 8.5% below the beginning of the year. August saw an even greater increase in NAV per share from July of 15.1% to 151.3p.
This is not to suggest that the work is complete. Many holdings remained materially below their 52-week highs even after reporting higher profits or better prospects. Audioboom, Fintel, Pebble Beach, Likewise and RentGuarantor had all provided reassuring updates, but valuation recovery remained incomplete at the end of June. A portfolio where profits rise while share prices fall is not a successful one. Valuation can remain detached from fundamentals for longer than investors expect, but, provided the earnings are real, the balance sheets sound and the catalysts executable, that divergence increases prospective returns. This is what the portfolio has been demonstrating so pointedly in the first 8 weeks of the second half.
The first half also offers an important lesson about the nursery and core structure. In 2025, the nursery produced several unusually strong contributors which graduated into larger core positions. In early 2026, the same structure enabled the introduction of Fintel and Mincon without immediately requiring maximum concentration. Both businesses entered the portfolio with identifiable operating and valuation catalysts, while two further nursery holdings were established and remain undisclosed. RentGuarantor, which entered as a nursery position in 2025 has muscled its way firstly into the top ten holdings, and now our largest purely through exceptional operational performance.
The first-half result has reduced the Company's since-inception absolute return to below its annualised objective. We make no attempt to turn that into a virtue. The 15% target is an absolute one, not "15% unless the Strait of Hormuz closes", and shareholders are entitled to judge the Manager against it.
Nevertheless, the relative record provides important evidence that the investment process has created value through a period of unusually difficult conditions for UK smaller companies. At 30 June, NAV total return since inception was 29.1%, 12.3% percentage points ahead of the AIC UK Smaller Companies sector and 10.0% percentage points ahead of the IA UK Smaller Companies sector. At 31 August, the NAV total return since inception had recovered to 58.3%, compared with 27.2% for the AIC sector and 27.0% for the IA UK Smaller Companies sector.
The task for the second half and beyond is therefore straightforward, if not easy: convert the portfolio's operating progress into realised and mark-to-market returns. The companies must deliver their catalysts, and the Manager must ensure that position sizes, engagement and capital allocation reflect the evidence as it develops.
Markets sometimes weigh businesses. In March, they merely counted the number of people trying to leave the counting room.
Top 10 Holdings Updates
Likewise Group plc (LIKE LN)
Date of first investment October 2024 - 42.1% IRR as at 30 June 2026
Likewise was the largest holding at 30 June 2026, representing 9.5% of the portfolio and having generated an aggregate total return of 48.1% since the Company's first purchase.
Likewise is a major UK trade flooring distributor, supplying everything from high-end residential carpets to commercial flooring solutions - vinyl, laminate, adhesive, underlay, tiles and matting. It supports trade professionals through credit accounts, ordering platforms, technical assistance and rapid logistics from regional distribution hubs.
Likewise has been outperforming competitors in UK flooring distribution through a combination of strategic, operational and cultural advantages. This has delivered a purple patch of market-share gains which has coincided with the business passing through its breakeven point. Our initial nursery position was acquired at approximately 14p in 2024 and was upweighted in August 2025 at 25p.
We believe Likewise's competitive advantages can continue to drive top-line outperformance, married with control of costs, to produce a material increase in profits. Chief Executive Tony Brewer and several directors are industry veterans with decades of experience, particularly from Headlam, where Tony played an important role in building the former market leader to a half billion pound company. It remains notable that Headlam's fortunes have deteriorated since that team departed, while Likewise has elbowed its way into the market against its larger and more financially constrained competitors.
As a relatively new company, Likewise also benefits from modern logistics infrastructure: a nationwide network of regional depots providing fast, next-day service, supported by recent investment in warehousing and cutting capacity. Much of this infrastructure was funded before Onward became a shareholder and can now support higher volumes without an equivalent increase in central costs. Tony's desk remains overlooking the cutting-room floor of the Birmingham distribution centre, an arrangement which perhaps explains why overhead has remained leaner than at competitors whose executives sit rather further away from the carpet.
Trading has accelerated through 2026, with sales approximately 15% higher during the first four months and group revenue up 16.5% in the five months to May. By mid-June, year-to-date growth was approximately 17%, with the June run rate above 20%.
This performance is particularly significant because direct competitors have been reporting substantial sales contractions. Likewise is therefore not waiting for a flooring-market recovery; it is taking share while the market remains weak. Our competitive dynamics thesis first shared in our accounts 18 months ago is playing out ahead of even our modelling, with Likewise' largest competitor firing off distress flares over the past few months.
Until now, it has been one of many contrarian investment theses, where Onward was the only UK fund manager in the top 10 shareholders. Post period end, the company announced a large and popular equity fundraising, to accelerate growth capital expenditure. We did not need to take part having bought our shares earlier and cheaper. The strategic rationale is intelligible: Corby would become the fifth national distribution hub, increase capacity materially and support an ambition to build group revenue towards £300m and we think beyond. The terms are more challenging for existing shareholders. The proposed issue represents a material expansion of the share count and transfers a portion of future upside to the new capital being introduced. We are keenly watching deployment and associated payback results.
The Board must now demonstrate that the returns generated on this enlarged capital base justify that dilution. Warehouses do not create value merely by being large; they create value when filled with profitable volume. Likewise has earned credibility through exceptional market-share gains and disciplined execution. The next stage is to show that infrastructure expansion can turn those gains into higher margins, cash generation and per-share value rather than growth for growth's sake, in turn providing a killer blow to its, for now larger, competitors. We remain confident that Tony Brewer is capable of pulling this off.
Angling Direct plc (ANG LN)
Date of first investment May 2023 - 18.4% IRR as at 30 June 2026
Angling Direct remained a top-tier holding at 30 June 2026, representing 8.3% of the portfolio and having delivered a total return of 41.6%.
Angling Direct is the UK's leading retailer of fishing equipment and tackle. Our returns are underpinned by the dual optionality associated with investing at a valuation which offered both a growth and value outcome, depending on the strategic decisions taken by the business.
The company has a dominant position in the UK, where it is profitable and cash generative with a highly engaged, repeat customer base of anglers. Those economics have improved materially under Chief Executive Steve Crowe and should benefit from continued store rollout, better purchasing, stronger customer engagement and, eventually, a recovery in UK discretionary spending.
The previous management team attempted to enter the much larger European market to provide an additional source of growth. That strategy has yet to match the success of the UK business, having generated several years of losses which remain material in the context of group profit. Our thesis has been that either Europe begins to contribute profitable growth or it should be reshaped to remove the opportunity cost to management and capital.
The FY26 results provided further evidence of substantial progress. Group revenue increased 13.8% to £103.9m, with UK revenue rising 14.8% to £99.2m. UK online sales grew 20%, adjusted group EBITDA increased 42.9% to £4.8m and adjusted profit before tax rose 44% to £2.9m. UK adjusted EBITDA advanced 25.5% to £5.3m, while the European loss narrowed from £0.8m to £0.5m. The group ended January with £10.9m of cash.
The MyAD loyalty programme has now attracted more than 600,000 members, an increase of approximately 47% during the year. Six new stores opened, the "shop the range" technology continued to extend the product catalogue available from smaller locations, and Angling Direct's online content remained an unusually effective and inexpensive customer-acquisition tool. There are very few UK retailers capable of delivering double-digit like-for-like growth, expanding margins and buying back shares at the same time; fewer still sell maggots.
Fishing is a sport of probability maximisation and therefore has more in common with investment management than either profession might like to admit. The company continues to put more lines in productive water, while the buyback reduces the number of shareholders sharing the eventual catch.
Audioboom Group plc (BOOM LN)
Date of first investment November 2024 - 56.1% IRR as at 30 June 2026
Audioboom represented 8.7% of the portfolio at 30 June 2026, with a total return of 43.9%.
Following market volatility of 2025, we were able to build an increased investment into Audioboom because:
1. the valuation on offer was more attractive relative to a substantially higher earnings base;
2. the company was exiting the last of its onerous legacy contracts, unlocking cash generation;
3. acquisition activity across podcasting and digital audio had accelerated at valuations materially above Audioboom's; and (most importantly)
4. our understanding of the scalability and strategic value of the platform had increased.
Audioboom helps podcasters produce, distribute and monetise their content. The end-market is in structural growth: listener numbers continue to rise, while advertising budgets are following audiences from traditional media towards digital audio and video. Podcasts also enjoy an extraordinary cost advantage. An hour of high-quality podcast content can be produced by several people in a room with recording equipment, rather than actors, sets, camera crews and the wider production apparatus required for television.
That cost differential allows podcast publishers to offer advertisers high-quality audiences at lower prices while still generating attractive margins. As the platform scales, incremental advertising revenue should therefore carry strong operational leverage. So it is now proving, and the first half of 2026 provided convincing evidence of that leverage. Post period end, Audioboom reported H1 revenue of $45.7m, 30% higher year on year, adjusted EBITDA of $3.2m, up 80%, and gross profit of $9.9m. Its Showcase advertising marketplace generated $18.6m of revenue, an increase of 60%, and more than $81m of 2026 revenue had already been booked by 14 July - exceeding total revenue for the whole of 2025 before the seasonally strongest trading period. In our proprietary model, we estimate the company will deliver as much as $10m of EBITDA this year and $13m next, and crucially this all becomes cash generated for the first time. The company has also agreed in principle a revolving credit facility of up to $10m with HSBC, providing greater flexibility for growth and selective acquisitions which would add to these numbers and provide a new lever to the equity story.
Operationally, therefore, Audioboom has rarely appeared stronger. The complication has been the strategic review.
During the second quarter, the Board received and rejected three non-binding indicative cash proposals which it concluded materially undervalued the company. Each represented a premium to the undisturbed share price of approximately 540p. The market took the rejection less philosophically: the shares fell 14.8% during June and ended the quarter at approximately 450p, making Audioboom one of the most significant detractors from the Company's second-quarter recovery, despite having one of the highest profit growth expectations for the this year.
The Board may ultimately be proven correct. Audioboom's profit growth, developing cash generation, strategic position in US and UK podcasting, and opportunity in video could justify a valuation materially above the proposals received. Our central investment thesis is more intact than ever as the company expects to deliver another record year: a structurally growing market is meeting a platform capable of significant operating leverage. We estimate that adjusted EBITDA can grow materially during 2026 and again in 2027 as legacy contractual drag falls away and higher-margin advertising revenue expands. The strategic-review outcome has deferred one possible catalyst, but it has not removed the underlying economic one. The Board must now convert the value it believes bidders failed to recognise into results that public-market investors can see.
Fintel plc (FNTL LN)
Date of first investment February 2026 - (-19.7%) IRR as at 30 June 2026
Fintel was introduced as a core holding during the first quarter and represented 8.3% of the portfolio at 30 June 2026. Its disclosed aggregate total return at that date was negative 10.9%.
Fintel provides software, proprietary data and support services to the UK retail financial-services market. Its principal businesses include Defaqto, whose ratings and data are embedded across financial-product manufacturing and distribution, and SimplyBiz, which supplies compliance, technology and business services to financial advisers and mortgage intermediaries.
The attraction is not merely that Fintel participates in financial-services activity, but that it increasingly owns the data, workflow and software through which that activity takes place. These products can become deeply embedded in clients' operations, generating recurring revenues, attractive retention and high incremental margins.
We established the position at approximately 11x prospective earnings and 6.7x EV/EBITDA, despite group margins already approaching 30% and having scope to move towards the mid-30s as the business mix shifts further towards software, subscriptions and proprietary data. More than £0.5m of director purchases following the full-year results provided additional evidence of alignment.
The company continued to simplify its portfolio in the first half, disposing of lower-margin operations and investing in data and technology capabilities. Matrix360, its institutional insurance-pricing and product-analysis platform, expanded its customer base; Fintel launched the AI-enabled Trust platform and the Omnicore technology proposition; and the acquisition of Pearson Ham's market-pricing business added further proprietary datasets.
Post period end, the H1 trading update showed organic adjusted EBITDA increasing 11.2% to £11.8m on organic revenue growth of only 2.0% to £37.4m. Continuing revenue was £38.6m, while SaaS and subscription revenue grew 7.9% to £26.1m. This is the important part of the story: modest top-line growth is being converted into much stronger profit growth because the quality and margin of revenue are improving.
The company now needs to demonstrate that the portfolio of acquired datasets and software products can be integrated without losing focus and return to organic growth. If management succeeds, the increasing proportion of recurring, high-margin revenue should become more visible in both cash generation and the valuation framework applied by the market.
Pebble Beach Systems Group plc (PEB LN)
Date of first investment September 2024 - 87.8% IRR as at 30 June 2026
Pebble Beach represented 7.8% of the portfolio at 30 June 2026 and had generated a total return of 105.0%.
Pebble Beach is a specialist broadcast and streaming software company focused on playout automation and integrated channel solutions. In layperson's terms it allows multiple sources of content to be spliced together into a seamless continuous feed for viewers. Think how the tens of cameras filming a game of rugby are stitched together into one thread. It is a good example of how Onward seeks asymmetric upside by purchasing durable, annuity-like recurring revenue at a valuation which already discounts substantial bad news, before engaging on strategy, capital allocation and shareholder returns.
When we first invested, the company screened at a free-cash-flow yield above 20% and approximately 3.4x EBITDA, despite EBITDA margins around 30% and longstanding relationships with major media and technology customers. The business's core performance had been obscured by its investment in the PRIMA technology platform, an elevated cost base and a balance sheet carrying more debt than shareholders wanted.
The decisive development during 2025 was the strategic pivot away from heavy PRIMA expenditure towards a simpler, lower-capital and lower-cost model. The Board responded constructively to our questions around cash deployment and adopted a more explicit focus on debt reduction and shareholder returns.
Execution has followed. FY25 revenue increased 7% to £12.2m, adjusted EBITDA rose 27% to £4.2m and adjusted profit before tax reached £3.0m. EBITDA margin expanded to approximately 34%, while year-end net debt fell 49% to £1.9m. Order intake was £13.9m and annual recurring revenue increased to £6.6m.
The company also secured an initial contract worth £1.3m with a Tier 1 US streaming platform entering live sports. This followed a rigorous customer selection process and validates Pebble's positioning as a configurable, best-of-breed provider rather than a commoditised software vendor. The initial contract is important in its own right; the opportunity to expand into additional workflows and channels may prove more important still.
Post period end, Pebble reported approximately 10% revenue growth for the six months to June, to £6.5m. Project revenue increased 19% to £3.1m, recurring revenue advanced 6% to £3.4m and adjusted EBITDA reached approximately £2.4m, representing a margin of 37%. Strong cash generation produced a further material reduction in net debt. Excitingly, growth is forecast to step up further into double digits in 2027 providing a lucrative period of profit growth over the next 18 months which will further compress the valuation the company trades on, which is already under 10x price to earnings.
What began as something resembling a "cigar-butt" investment is developing software teeth. The balance sheet is approaching net cash, margins are substantially higher, and the Tier 1 streaming win provides evidence that the technology can participate in the changing architecture of global broadcasting. The next task is to prove that the customer win is a beachhead rather than a postcard.
RentGuarantor Holdings plc (RGG LN)
Date of first investment November 2025 - 360.6% IRR as at 30 June 2026
RentGuarantor represented 7.2% of the portfolio at 30 June 2026 and had delivered a total return of 114.3%.
RentGuarantor operates a UK professional rent-guarantee platform, supported by an underwriting relationship with City & Commercial and a rapidly expanding distribution network of letting agents, universities, charities, councils and institutional landlords. The model is established in the United States and parts of Europe but has historically remained underdeveloped in the UK. Until now. This is what our due diligence had spotted in the summer of 2025 and investigated, culminating in a nursery investment in the autumn that year.
Our investment case was driven by a specific structural catalyst: the Renters' Rights Act 2025, key provisions of which took effect from 1 May 2026. The legislation changes how landlords and agents manage tenant risk, including restrictions around large upfront rent payments and changes to eviction economics. Regulation can sometimes destroy a market; in this instance, it has created one. RentGuarantor thus crucially offers investors access to virgin territory in a very large and well established market. There are 3 million tenants in the UK and professional guarantees are a tried and tested business model in the US and Europe, often attracting large institutional investment interest. Warburg Pincus recently invested in TheGuarantors in the USA.
RentGuarantor entered the year with strong momentum following revenue growth of 88% during 2025. Following our direct investment, it accelerated investment in sales, marketing and systems ahead of the legislative change and expanded its partner network across the lettings ecosystem. The strategy has been to make the product a standard option within agents' workflows rather than requiring each tenant to discover it independently.
The operating response during the first half was exceptional. Post period end, the company reported H1 revenue of £3.39m, 250% higher than the comparable period. Applications increased 110% to 8,936, completed contracts rose 179% to 3,703 and the average contract value grew 37% to approximately £1,001. Adjusted EBITDA was approximately £110,000 and adjusted net profit approximately £250,000, compared with losses in the prior period. June revenue alone increased more than sevenfold year on year. The Company went on to release material upgrades in early September, increasing EBITDA forecasts to £4m whereas they had started the year at a loss of £600k.
The move into profitability is important because it demonstrates that the model can begin to fund its own growth much earlier than initially anticipated. The company raised a further £1m during June and ended the half with approximately £2.4m of cash after repaying outstanding loan facilities. This has since grown to £7.5m by the end of August. Management now expects full-year revenue and profit materially ahead of previous expectations. Our model is some way ahead of both for this year and next.
RentGuarantor is also developing AI-assisted infrastructure intended to increase processing capacity from approximately 20,000 contracts annually towards 100,000 over time. That scale will be necessary if the company is to convert regulatory tailwinds into a national product rather than a promising niche.
The thesis has therefore progressed from "can regulation create demand?" to "can RentGuarantor process, underwrite and service that demand without losing control of risk or customer experience?" The first question is being answered emphatically. The second will determine how valuable the platform ultimately becomes.
At scale, the economics can be extremely attractive: distribution becomes embedded, insurance risk is transferred, revenue is largely generated upfront and incremental contracts require relatively little additional central cost. Most attractive of all is the extremely low market share that is already delivering such attractive returns for shareholders. If the company can get close to 5% penetration, then this evolves from a special investment to game-changing for Onward - The company is already sat on an unrealised profit of over £10m as at the end of August.
Synectics plc (SNX LN)
Date of first investment September 2024 - (-13.9%) IRR as at 30 June 2026
Synectics represented 6.4% of the portfolio at 30 June 2026. The disclosed aggregate total return was negative 21.4%, making it one of the more significant detractors from performance despite continued operational progress.
Synectics is a leader in advanced security and surveillance systems for markets where security is critical to operations. Its core intellectual property comprises the proprietary Synergy command-and-control software platform, combined with specialist COEX cameras and systems integration capabilities. It serves blue-chip customers across gaming, oil and gas, transport, infrastructure and public-space surveillance.
The business used the pandemic to refocus its strategy and operations. Over the past 15 years, it has evolved from a predominantly hardware company into a much more software-led organisation. Synergy is central to winning and retaining customers because it becomes embedded within mission-critical operations, while also generating a higher blended margin than a conventional hardware-only surveillance business.
We acquired this world-leading, customer-retentive and high-margin technology on a sub-10x earnings multiple during 2024. The business subsequently generated substantial excess cash, creating optionality around capital returns, acquisitions and the future of the lower-margin hardware activities.
FY25 was a record year. Revenue increased 22% to £68.1m, EBITDA rose 36% to £8.5m, earnings per share reached 28p and year-end cash was £14.1m with no debt. The order book stood at £26.5m and the dividend was increased to 5p. A major £12m casino project provided further validation of Synectics' standing in global gaming surveillance.
However, it appears the business is starting to miss its former CEO after his sudden death in late 2024 and recent geopolitical events have compounded the challenges further. The Middle East conflict was directly relevant because the region represents both an important energy market and a future source of major gaming opportunities. Project timing slowed as customers reassessed capital expenditure and logistics. This is frustrating but does not alter the underlying need for security systems in critical infrastructure, nor the strategic value of software certified for demanding environments. It also unfortunately coincides with the business attempt to invest heavily in a new sales and marketing strategy.
Mission-critical products do not necessarily produce a smooth quarterly earnings chart. The opportunity is to ensure the valuation reflects the quality and strategic relevance of the platform rather than the lumpiness of individual projects. This is why we believe Synectics is a strategic asset with options to call upon in a period of challenge such as this. Following the Saaspocalypse, businesses that own both software and the hardware means to deploy it are of increasing interest to long-term investors.
Light Science Technologies Holdings plc (LST LN)
Date of first investment May 2025 - 15.7% IRR as at 30 June 2026
Light Science Technologies represented 5.4% of the portfolio at 30 June 2026 and had generated a disclosed aggregate total return of 7.5%.
Light Science entered the nursery as our confidence grew in the potential of its passive fire-protection division and, specifically, the Injectaclad fire-barrier system.
Injectaclad is designed to remediate missing or defective cavity barriers using a pumped graphite system, avoiding the cost and disruption of removing an entire façade. The value proposition is unusually compelling: a materially cheaper and less invasive solution for building owners, while still producing attractive installation margins for Light Science.
The product has also completed independent testing supporting a 50-year lifespan, compared with a much shorter average life for conventional barrier systems. Given the scale of the UK's unresolved building-safety problem, the addressable market is substantial.
The crucial development during the first half was the decision to acquire RLUK Injection, securing ownership of the Injectaclad intellectual property and supply chain, alongside the remaining minority interest in UK Circuits and an associated property. The company raised up to £6.6m at 1p per share to fund those transactions and provide working capital.
Completing an acquisition financing during the most volatile stage of the Middle East crisis was no small achievement, but the terms were painful for existing shareholders. The equity raise was materially dilutive. In return, Light Science moved from being an installer of someone else's product to controlling a greater portion of the value chain, including the intellectual property, supply economics and potential international opportunity.
The product opportunity is increasingly well established. The investment case has moved beyond whether Injectaclad solves a genuine and expensive problem; it clearly does. The burden of proof now rests on the speed at which building owners approve remediation, the capacity with which Light Science can deliver it and the amount of cash retained after doing so.
The Mission Group plc (TMG LN)
Date of first investment July 2024 - (-8.4%) IRR as at 30 June 2026
The Mission Group represented 4.9% of the portfolio at 30 June 2026, with a disclosed aggregate total return of negative 11.9%.
Mission is a classic special situation: a collection of creative, marketing, sports and technology agencies trading at a material discount to the value of its constituent businesses. The group became overleveraged when a cyclical slowdown collided with a cost base and corporate structure built for more buoyant conditions.
Founder David Morgan returned as Chair to oversee cost reduction, disposals and balance-sheet repair. The sale of April Six demonstrated the value embedded within the group: an agency representing only a minority of profits was sold for a consideration that was significant relative to the market capitalisation of the whole company. The proceeds reduced debt and materially lowered interest costs.
The next phase has been to simplify what remained. During the first half, Mission combined its business-to-consumer and business-to-business advertising operations into a unified agency, removing duplicated costs and creating a more coherent offering. The objective is not merely to shrink the business but to make it easier to operate, value and, ultimately, sell.
Post period end, Mission reported that H1 revenue was expected to be £32.5m, down from £34.1m, but headline operating profit increased 10% to £2.4m and headline profit before tax rose 27% to £1.4m. Less revenue produced more profit - a sentence shareholders have waited some time to read.
Mongoose Sports & Entertainment performed strongly, while the ThinkBDW property-marketing operation remained resilient. New mandates included work for Westminster City Council, Puma, Amaala Yacht Club, PwC, the International Tennis Federation and Volleyball World.
The group continues to target full-year revenue of approximately £70m and headline operating profit of £8.1m, compared with £5.1m in 2025. Delivery would provide compelling evidence that the simplification programme is working and expose the degree of operational gearing within the remaining agencies, and leave the shares materially undervalued on a multiple or break-up business we believe.
Alumasc Group plc (ALU LN)
Date of first investment May 2023 - 2.9% IRR as at 30 June 2026
Alumasc represented 5.2% of the portfolio at 30 June 2026 and had delivered a disclosed aggregate total return of 3.1%.
Alumasc is a premium building-products group divided across Water Management, Housebuilding Products and Building Envelope. Timloc and Water Management are designers and manufacturers, while Building Envelope has more distribution and assembly characteristics. The divisions vary in terms of margin and quality of earnings, with Timloc and parts of Water Management possessing especially attractive market positions.
Our screening identified that Alumasc had produced improving, sector-leading margins since the pandemic and generated an attractive cash-flow return on assets. This was partly the result of disposing of weaker businesses, but more importantly reflected the pricing power of specified products. When an architect has specified a particular drainage or building product, price becomes only one consideration among compliance, performance and the cost of changing the design.
Having disposed of six operating businesses over eight years, Alumasc has a more focused portfolio and an opportunity to consolidate its strongest positions through product development, exports and selective bolt-on acquisitions. Brands including Gatic, Timloc, Harmer and Wade would also be strategically attractive to industrial buyers if public-market valuations remain depressed.
The operating environment became substantially more difficult during FY26. The third-quarter update reported group revenue growth of approximately 2% and an order book 28% higher year on year, but delays to Middle Eastern Water Management projects, input-cost inflation and weak UK construction activity reduced near-term profit expectations. Housebuilding Products and Building Envelope performed more resiliently, while Water Management absorbed most of the disappointment.
Post period end, Alumasc reported FY26 revenue of approximately £107m and underlying profit before tax of around £10m, compared with £113m and £14m respectively in the prior year. The year-end order book was nevertheless 49% higher. Housebuilding Products revenue increased approximately 16%, Building Envelope was broadly flat, while Water Management declined 16%, or around 3% excluding the prior-year contribution from the disposed CLK business. Net debt remained modest at approximately £7m, equivalent to around 0.5x EBITDA.
Timloc increasingly appears to be an exceptional business. Its operating margins remain in the mid-20s and its revenue performance implies substantial market-share gains before any meaningful recovery in UK housebuilding. Water Management retains excellent brands and long-term exposure to climate adaptation, drainage and infrastructure, but requires improved project conversion and operational self-help.
The market has returned Alumasc to the single-digit P/E club, where entry is easy but the drinks are rarely free. The attractions of Timloc and the wider brand portfolio remain significant; the task is to ensure their value is not diluted by weaker execution elsewhere and have spades in the ground for when the UK construction market does recover.
Outlook
The first half did not provide the returns we target. NAV per share declined from 143.69p at 31 December 2025 to 123.50p at 30 June 2026. The second-quarter rebound of around 12% was encouraging but only partially recovered the earlier drawdown. What has been encouraging is that the recovery we had been predicting in various monthly factsheets accelerated over the summer months, and the NAV ended August at a new all-time high of 151.43p. Onward has maintained its outperformance of the peer group averages through both the highs and lows and this margin of outperformance has expanded to over 30% again
The pattern of performance is important. The Q1 decline was amplified by a liquidity shock, a rapid reassessment of interest rates and direct concerns around several companies' Middle Eastern opportunities. It was not principally caused by a widespread collapse in portfolio earnings. Following the volatility, Angling Direct, Fintel, Pebble Beach, RentGuarantor, Springfield, Likewise and Mincon produced results or trading updates which met or exceeded expectations.
There has already been a substantial amount of news flow early in the second half and the portfolio has delivered gains to match. There is another four months of the year to go and already Audioboom has reported record interim revenue and profit, with video monetisation and a much larger revenue book entering the seasonally strongest period. Fintel is generating double-digit EBITDA growth as the mix shifts towards software and data. Pebble Beach has produced 10% revenue growth and a 37% H1 EBITDA margin. RentGuarantor's revenue has increased 250% and is accelerating further month to month, throwing off growing amounts of cash for the first time in its history. Mission is producing more profit from less revenue, Angling Direct continues to take market share, and Springfield has eliminated bank debt.
These are company-specific catalysts rather than expressions of macroeconomic optimism. That is deliberate. We have no edge in forecasting the next military communiqué, oil-price spike or MPC vote. We have though shown we can identify under-researched businesses where operational change will eventually make the existing valuation untenable, and that we can ride out material market volatility and not waver on our convictions. For the second year in a row the strategy has had to weather a material drawdown, only to remain ahead of the peer group and then bounce back stronger.
Corporate activity should remain another important closing mechanism. Overseas buyers were responsible for approximately two-thirds of firm UK public-market offers during the first half, and the widening gap between strategic value and small-cap public valuations has not been resolved. Audioboom's receipt of three proposals, all of which were rejected, demonstrated that external buyers recognise value in our portfolio too and this area has the potential to extenuate the recovery in our second half and beyond.
We also enter the second half with a Company better positioned structurally. Onward's migration to the Main Market in April broadens the potential shareholder base, improves eligibility for some investors and reflects the fund's growth since launch. It does not immunise the NAV from market volatility, but it strengthens the vehicle through which we seek to exploit it. It has also enabled the company to grow to in excess of £50m for the first time.
Risks remain obvious. A renewed escalation in the Middle East could raise energy prices, delay rate reductions and further weaken domestic confidence. UK institutions continue to withdraw money from equities, and liquidity at the smaller end of the market remains particularly vulnerable to all of the themes we have written about. Yet the valuation backdrop remains unusually forgiving for investors able to tolerate that volatility.
We had started the year talking of how 2026 was 'the Year of the Fire Horse'. Well it has been in that order so far. Oil fields, shipping lanes, inflation forecasts and government turmoil. Yet again our portfolio has not only tolerated the resultant volatility, but investments are starting to gallop out of it and pull the portfolio to new highs. Last year provided what were the portfolio's worst and then best half year periods of performance. The first of half of 2026 made light work of taking the NAV from all-time highs to its knees. The second half is now looking like it may trump them all, so far recording a record rebound in the two months to a new all-time high by end of August.
Ever Onwards,
Laurence Hulse
Lead Fund Manager, Founder
Board Members
The Board is responsible for the determination of the Company's investment objective and investing policy and has overall responsibility for the Company's activities including the review of investment activity and performance and the control and supervision of the AIFM, the Portfolio Manager and the other service providers.
The Directors meet at least four times a year, and at such other times as may be required. The Directors (including the Chairman) are all independent non-executive directors.
The Board has been assembled to ensure that the Company has the appropriate breadth of skills and experience in order to ensure that it can be governed effectively and comprises the following persons:
The Directors of the Company who served during the period are:
· Andrew Henton (Independent Non-Executive Chairman)
· Susan Norman (Independent Non-Executive Director, Senior Independent Director)
· Henry Freeman (Independent Non-Executive Director, Chair of Management Engagement Committee)
· Luke Allen (Independent Non-Executive Director, Chair of Audit and Risk Committee)
All Directors also served during the year ended 31 December 2025 and their brief biographies are available in the annual report as at that date.
Investment Committee
The Investment Committee of the Company who served during the period are:
· Laurence Hulse (Lead Fund Manager and Founder)
· Tom Teichman (Investment Committee Chair)
· Jeremy McKeown (Investment Committee Member)
· Mark Wharrier (Investment Committee Member)
All committee members also served during the year ended 31 December 2025, and their brief biographies are available in the annual report as at that date.
Interim Management Report
Investment Objective
The Company will seek to generate risk-adjusted absolute returns for Shareholders through investments in UK smaller companies.
Investment Policy
The Company will seek to achieve its investment objective by investing primarily in equity and equity-related securities of UK smaller companies that are predominantly listed or admitted to trading on markets operated by the London Stock Exchange, and where it is considered that there is a material potential valuation upside that can be delivered from catalysing strategic, operational or management initiatives.
In order to ensure that the Company is able to maintain its approach of active engagement with investee companies, and to encourage and support value creation, the Company will target meaningful minority stakes in investee companies of between 3 per cent. and 29.9 per cent. of investee companies' issued share capital.
Whilst the Company has no limitation on the size of the companies in which it can invest, the Company will typically invest in companies with market capitalisations of no more than £250 million (with a particular focus on those below £100 million) at the time of investment. The Company will therefore focus on investments in the 'micro' smaller companies' sector and on companies admitted to trading on AIM.
Investee companies will typically have certain of the following characteristics:
· balance sheet asset backing;
· a competitive advantage and/or strong management track record;
· attractive cash flow potential;
· visibility of earnings/future earnings improvement;
· potential for liquidity and/or exit in line with the Company's targeted hold period;
· scope for an active shareholder to trigger value creation; and/or
· foreseeable events and catalysts to unlock intrinsic value.
Investments may be either direct investments made by the Company, or indirect investments made by the Company through similar funds or investment vehicles. The Company may make its investments for cash or for share consideration.
Although investments will not be restricted to specific sectors, the Company does not expect to pursue or make investments into companies in the biotechnology sector or in companies directly involved in the upstream extraction of natural resources (such as owners of mining or oil and gas assets).
Whilst the Company will initially seek to take minority stakes in investee companies of between 3 per cent. and 29.9 per cent. and will not typically seek to take majority positions in investee companies, it will not be restricted from taking a majority position if considered appropriate by the Portfolio Manager.
Whilst the Company will typically target an investment holding period of three to five years, actual holding periods and exit strategies will depend on the underlying investment, the availability of exit opportunities and the size of the Company's investment. The Company may therefore dispose of investments outside of the target timeframe should an appropriate opportunity arise.
The Company may hold meaningful cash balances in its portfolio from time to time to maintain investment flexibility. There is no limit on the amount of cash which may be held by the Company at any time.
Principal Risks and Uncertainties
The Directors have reconsidered the principal risks and uncertainties affecting the Company. The Directors consider that the principal risks and uncertainties have not significantly changed since the publication of the Audited Financial Statements for the year ended 31 December 2025. The risks and associated risk management processes, including financial risks, can be found in the Audited Financial Statements for the financial year ended 31 December 2025, https://onwardopportunities.co.uk/document-centre/.
The risks referred to, and which could have a material impact on the Company's performance for the remainder of the current financial period, relate to:
· Market risk
· Credit risk
· Liquidity risk
· Investee company failure
· Portfolio concentration risk
· Key person risk
· Share price risk / trading at discount to NAV
· Conflicts of interest
Emerging Risks
Emerging risks, along with all other risks the Directors have identified the Company as being exposed to, are monitored via the Company's Business Risk Assessment. During the period, as part of their regular review and assessment of risk, the Directors have continued to consider the impact of the emerging risks of usage of artificial intelligence, "protectionism", the disruption of global supply chains (including oil supply), and the potentially changing fiscal environment in the UK on the Company's business model and viability, but do not consider these to be material risks at this time.
ESG and Climate Change Risks and Considerations
The Investment Manager seeks to identify externalities (positive and negative) that are not reflected in the share price of (prospective) investee companies. The costs of ESG remediation and compliance are in this context but one type of externality, and the assessment of ESG risks specifically are embedded in the investment process. As ESG processes are further embedded within the wider investment sector the expectation is that improving environmental outcomes will be realised as compliant companies find it easier to access capital via the public markets and to grow relative to their less or non-compliant peers.
With respect to climate change risk specifically, the Directors consider that the pricing of the underlying portfolio of the Company's investments reflects market participants' views of climate change risk and that there are no further climate related influences on the NAV of the Company at this point in time.
AIC Code Provision 34 Preparations
The Directors have continued preparations to meet the requirements of Provision 34 of the AIC Code, which will apply to the Company's Annual Report and Audited Financial Statements for the year ending 31 December 2026.
The Board's future declaration on the effectiveness of material controls will build on the Company's existing risk management and internal control framework. The Board is strengthening its processes and documentation to support a robust and meaningful declaration under Provision 34 of the AIC Code.
Going Concern
The Directors have adopted the going concern basis in preparing the Unaudited Condensed Interim Financial Statements.
In assessing the going concern basis of accounting, the Directors have assessed the guidance issued by the Financial Reporting Council and considered the Company's own financial position, market volatility, the on-going impact of conflict in Ukraine and the Middle East, the imposition of tariffs and other uncertainties impacting on the financial position and liquidity requirements of the Company's investments.
At period end the Company had a net asset position of £41,588,000 including cash of £2,330,000, loan notes of £278,000, derivative investments of £1,262,000 and listed investments of £37,914,000.
The Company generates liquidity by raising capital and exiting investments. It uses liquidity by making new and follow-on investments and paying company expenses. The Directors ensure it has adequate liquidity by regularly reviewing its financial position and forward-looking liquidity requirements. In assessing its going concern status, the Directors have considered the level of operating expenses relative to net assets, such expenses approximating to 2.9% of net assets as at 30 June 2026.
Important events and financial performance
On 16 April 2026, the ordinary shares of the Company were admitted to the closed-ended investment funds segment of the Financial Conduct Authority's ("FCA") Official List and to trading on the Main Market of the London Stock Exchange. At this point, the Company's admission to trading on AIM was cancelled.
Highlights as at 30 June 2026 are as follows:
|
|
Ordinary Shares |
|
|
30 June 2026 |
|
Highlights |
|
|
Net Asset Value per share[2] |
123.5p |
|
Share Price |
125.0p |
|
% of capital deployed into AIM listed equities (investments) |
94.9% |
|
% of capital deployed into cash and cash equivalents |
5.6% |
The table below provides performance information:
|
Date |
NAV per share |
% change in NAV |
|
30 March 2023 |
95.7p |
|
|
30 June 2023 |
96.4p |
0.8% increase |
|
31 December 2023 |
106.5p |
10.5% increase |
|
30 June 2024 |
116.3p |
9.2% increase |
|
31 December 2024 |
129.4p |
11.3% increase |
|
30 June 2025 |
128.4p |
0.8% decrease |
|
31 December 2025 |
143.7p |
11.9% increase |
|
30 June 2026 |
123.5p |
14.1% decrease |
The net loss for the period ended 30 June 2026 amounted to £6,466,000. Further details of the Company's performance for the period are included in the Portfolio Manager's Report, which includes a review of investment activity and adherence to investment restrictions.
Premium
As at 30 June 2026, the share price was trading at a premium of 1.2% to the last published NAV per share.
Related party transactions
Details of related party transactions are given in note 15 to the Unaudited Condensed Interim Financial Statements.
Andrew Henton
Director
7 September 2026
Responsibility Statement
To the best of their knowledge, the Directors confirm that:
- the Unaudited Condensed Interim Financial Statements have been prepared in accordance with IAS 34, "Interim Financial Reporting"; and
- the Interim Report, comprising the Chairman's Statement, the Investment Manager's Interim Report and the Interim Management Report includes a fair review of information required by:
(i) DTR 4.2.7R of the Disclosure Guidance and Transparency Rules, being an indication of important events which have occurred during the first six months of the financial year, and their impact on the Unaudited Condensed Interim Financial Statements, and a description of the principal risks and uncertainties for the remaining six months of the year; and
(ii) DTR 4.2.8R of the Disclosure Guidance and Transparency Rules, being related party transactions which have taken place in the first six months of the current financial year and that have materially affected the financial position or performance of the Company during that period, and any material changes in the related party transactions disclosed in the Company's 2025 Annual Report.
Signed on behalf of the Board by:
Andrew Henton
Director
7 September 2026
Unaudited Condensed Statement of Comprehensive Income
For the six month period ended 30 June 2026
|
|
|
Period from |
|
Period from |
||||
|
|
|
1 January 2026 to |
|
1 January 2025 to |
||||
|
|
|
30 June 2026 |
|
30 June 2025 |
||||
|
|
|
(unaudited) |
|
(unaudited) |
||||
|
|
|
|
|
|
|
|
|
|
|
|
Notes |
Revenue |
Capital |
Total |
|
Revenue |
Capital |
Total |
|
|
|
£'000 |
£'000 |
£'000 |
|
£'000 |
£'000 |
£'000 |
|
Investments |
|
|
|
|
|
|
|
|
|
Net (losses) / gains on investments held at fair value through profit or loss |
|
- |
(5,379) |
(5,379) |
|
- |
217 |
217 |
|
Net investment (losses) / gains |
|
- |
(5,379) |
(5,379) |
|
- |
217 |
217 |
|
|
|
|
|
|
|
|
|
|
|
Interest income |
|
1 |
- |
1 |
|
2 |
20 |
22 |
|
Dividend income |
|
188 |
- |
188 |
|
- |
148 |
148 |
|
Total income |
|
189 |
- |
189 |
|
2 |
168 |
170 |
|
|
|
|
|
|
|
|
|
|
|
Portfolio management and performance fees |
5 |
(314) |
- |
(314) |
|
(231) |
- |
(231) |
|
Other expenses |
6 |
(291) |
- |
(291) |
|
(261) |
- |
(261) |
|
Main listing expenses |
|
(671) |
- |
(671) |
|
- |
- |
- |
|
Total (loss) / gain and comprehensive (loss) / income for the period |
|
(1,087) |
(5,379) |
(6,466) |
|
(490) |
385 |
(105) |
|
|
|
|
|
|
|
|
|
|
|
(Loss) / Gain per Ordinary Share (pence) |
7 |
(3.32) |
(16.42) |
(19.74) |
|
(1.96) |
1.54 |
(0.42) |
The total column of this statement represents the Unaudited Condensed Statement of Comprehensive Income of the Company prepared under IAS 34.
The supplementary revenue and capital return columns are prepared under guidance published by the Association of Investment Companies ("AIC").
All items in the above statement derive from continuing operations.
The notes on pages 34 to 45 form an integral part of these Unaudited Condensed Interim Financial Statements.
Unaudited Condensed Statement of Financial Position
As at 30 June 2026
|
|
|
30 June |
|
31 December |
|
|
|
2026 |
|
2025 |
|
|
|
£'000 |
|
£'000 |
|
|
Notes |
(unaudited) |
|
(audited) |
|
Non-current assets |
|
|
|
|
|
Investments held at fair value through profit or loss |
9 |
37,914 |
|
41,404 |
|
|
|
|
|
|
|
Current assets |
|
|
|
|
|
Investments held at fair value through profit or loss |
9 |
1,540 |
|
1,607 |
|
Dividend receivable |
|
51 |
|
- |
|
Cash and cash equivalents |
|
2,330 |
|
249 |
|
Unsettled trades |
10 |
27 |
|
- |
|
Other receivables |
|
26 |
|
22 |
|
|
|
|
|
|
|
|
|
3,974 |
|
1,878 |
|
|
|
|
|
|
|
Total assets |
|
41,888 |
|
43,282 |
|
|
|
|
|
|
|
Current liabilities |
|
|
|
|
|
Management fee payable |
5 |
(51) |
|
(55) |
|
Performance fee payable |
5 |
- |
|
(476) |
|
Other payables |
|
(249) |
|
(68) |
|
Unsettled trades |
10 |
- |
|
(21) |
|
|
|
|
|
|
|
Total liabilities |
|
(300) |
|
(620) |
|
|
|
|
|
|
|
Net assets |
|
41,588 |
|
42,662 |
|
|
|
|
|
|
|
Equity |
|
|
|
|
|
Share Capital |
11 |
37,356 |
|
31,964 |
|
Capital reserve |
|
6,717 |
|
12,096 |
|
Revenue reserve |
|
(2,485) |
|
(1,398) |
|
|
|
|
|
|
|
Total equity |
|
41,588 |
|
42,662 |
|
|
|
|
|
|
|
Net Asset Value per Ordinary Share (pence) |
12 |
123.50 |
|
143.69 |
|
|
|
|
|
|
|
Number of Ordinary Shares in issue |
11 |
33,675,094 |
|
29,691,188 |
Approved by the Board of Directors and authorised for issue on 8 September 2026 and signed on their behalf:
_______________________
Director
The notes on pages 34 to 45 form an integral part of these Unaudited Condensed Interim Financial Statements.
Unaudited Condensed Statement of Changes in Equity
For the six month period ended 30 June 2026
|
|
Share Capital |
|
Revenue reserve |
|
Capital reserve |
|
Total |
|
|
|||||||
|
|
£'000 |
|
£'000 |
|
£'000 |
|
£'000 |
|
For the period 1 January 2026 |
|
|
|
|
|
|
|
|
to 30 June 2026 (unaudited) |
|
|
|
|
|
|
|
|
At 1 January 2026 |
31,964 |
|
(1,398) |
|
12,096 |
|
42,662 |
|
Share issue |
5,621 |
|
- |
|
- |
|
5,621 |
|
Share issue costs |
(229) |
|
- |
|
- |
|
(229) |
|
Total loss and comprehensive loss for the period |
- |
|
(1,087) |
|
(5,379) |
|
(6,466) |
|
|
|
|
|
|
|
|
|
|
At 30 June 2026 |
37,356 |
|
(2,485) |
|
6,717 |
|
41,588 |
|
|
|
|
|
|
|
|
|
|
|
Share Capital |
|
Revenue reserve |
|
Capital reserve |
|
Total |
|
|
£'000 |
|
£'000 |
|
£'000 |
|
£'000 |
|
For the period 1 January 2025 |
|
|
|
|
|
|
|
|
to 30 June 2025 (unaudited) |
|
|
|
|
|
|
|
|
At 1 January 2025 |
24,661 |
|
(1,112) |
|
7,472 |
|
31,021 |
|
Share issue |
2,124 |
|
- |
|
- |
|
2,124 |
|
Share issue costs |
(63) |
|
- |
|
- |
|
(63) |
|
Total (loss) / gain and comprehensive (loss) / income for the period |
- |
|
(490) |
|
385 |
|
(105) |
|
|
|
|
|
|
|
|
|
|
At 30 June 2025 |
26,722 |
|
(1,602) |
|
7,857 |
|
32,977 |
The notes on pages 34 to 45 form an integral part of these Unaudited Condensed Interim Financial Statements.
Unaudited Condensed Statement of Cash Flows
For the six month period ended 30 June 2026
|
|
|
Period from |
|
Period from |
|
|
|
1 January 2026 |
|
1 January 2025 |
|
|
|
to 30 June 2026 |
|
to 30 June 2025 |
|
|
|
£'000 |
|
£'000 |
|
|
Notes |
(unaudited) |
|
(unaudited) |
|
Cash flows from operating activities |
|
|
|
|
|
Other expense payments |
13 |
(1,627) |
|
(1,078) |
|
Interest income |
|
1 |
|
2 |
|
Dividend income |
|
137 |
|
111 |
|
Purchase of equity investments |
9 |
(10,060) |
|
(10,357) |
|
Sale of equity investments |
9 |
8,238 |
|
10,879 |
|
|
|
|
|
|
|
Net cash outflow from operating activities |
|
(3,311) |
|
(443) |
|
|
|
|
|
|
|
Cash flows from financing activities |
|
|
|
|
|
Issue of Ordinary Shares |
11 |
5,621 |
|
2,124 |
|
Share issue costs |
11 |
(229) |
|
(63) |
|
|
|
|
|
|
|
Net cash inflow from financing activities |
|
5,392 |
|
2,061 |
|
|
|
|
|
|
|
|
|
|
|
|
|
Net increase in cash and cash equivalents |
|
2,081 |
|
1,618 |
|
Cash and cash equivalents at beginning of period |
|
249 |
|
362 |
|
|
|
|
|
|
|
Cash and cash equivalents at end of period |
|
2,330 |
|
1,980 |
|
|
|
|
|
|
|
Cash and cash equivalents comprise of the following: |
|
|
|
|
|
Cash at bank |
|
2,330 |
|
1,980 |
|
|
|
|
|
|
|
|
|
2,330 |
|
1,980 |
The notes on pages 34 to 45 form an integral part of these Unaudited Condensed Interim Financial Statements.
Notes to the Unaudited Condensed Interim Financial Statements
For the six month period ended 30 June 2026
1. Reporting Entity
Onward Opportunities Limited (the "Company") is registered in Guernsey and was incorporated on 31 January 2023, with registered number 71526. The Company's registered office is Les Echelons Court, Les Echelons, St Peter Port, Guernsey, GY1 1AR.
The Company is a Registered Closed-ended Collective Investment Scheme regulated by the Guernsey Financial Services Commission ("GFSC"), with reference number 2804577, pursuant to the Protection of Investors (Bailiwick of Guernsey) Law 2020, as amended and the Registered Collective Investment Scheme Rules and Guidance, 2021.
The Company had 29,691,188 shares in issue under ticker ONWD, SEDOL BMZR151 and ISIN GG00BMZR1514 on 31 December 2025.
On 16 April 2026, the ordinary shares of the Company were admitted to the closed-ended investment funds segment of the Financial Conduct Authority's ("FCA") Official List and to trading on the Main Market of the London Stock Exchange. At this point, the Company's admission to trading on AIM was cancelled.
During the current period, the Company issued a further 3,983,906 ordinary shares for a gross consideration of £5,621,000.
The Unaudited Condensed Interim Financial Statements of the Company are presented for the period ended 30 June 2026.
The Company and its Alternative Investment Fund Manager received discretionary portfolio management services directly from Dowgate Wealth Limited ("DWL") during the six-month period ended 30 June 2026.
The Company's administration is delegated to NSM Funds Limited ("NSMF"), and its Alternative Investment Fund Manager is Global Fund Management Services Limited ("GFM").
2. Material accounting policies
(a) Basis of accounting
The Unaudited Condensed Interim Financial Statements have been prepared on a going concern basis in accordance with IAS 34 Interim Financial Reporting as adopted by the European Union, and applicable Guernsey law. These Unaudited Condensed Interim Financial Statements do not comprise statutory Financial Statements within the meaning of the Companies (Guernsey) Law, 2008, they do not include all of the information required for full annual financial statements and should be read in conjunction with the financial statements of the Company as at 31 December 2025, which were prepared in accordance with International Financial Reporting Standards as adopted by the European Union ("IFRS").
The accounting policies adopted in these Unaudited Condensed Interim Financial Statements are consistent with those applied in the Audited Financial Statements for the year ended 31 December 2025.
Where presentational guidance set out in the Statement of Recommended Practice ("SORP") for investment companies issued by the Association of Investment Companies ("AIC") updated in July 2022 is consistent with the requirements of IFRS, the Directors have sought to prepare the Unaudited Condensed Interim Financial Statements on a basis compliant with the recommendations of the SORP.
(b) Going concern
The Directors have adopted the going concern basis in preparing the Unaudited Condensed Interim Financial Statements.
In assessing the going concern basis of accounting, the Directors have assessed the guidance issued by the Financial Reporting Council and considered the Company's own financial position, market volatility, the ongoing impact of conflict in Ukraine and the Middle East, the imposition of tariffs and other uncertainties impacting on the financial position and liquidity requirements of the Company's investments.
At period end the Company had a net asset position of £41,588,000 including cash of £2,330,000, loan notes of £278,000, derivative investments of £1,262,000 and listed investments of £37,914,000.
The Company generates liquidity by raising capital and exiting investments. It uses liquidity by making new and follow-on investments and paying company expenses. The Directors ensure it has adequate liquidity by regularly reviewing its financial position and forward-looking liquidity requirements. In assessing its going concern status, the Directors have considered the level of ongoing operating expenses relative to net assets, such expenses approximating to 2.9% of net assets as at 30 June 2026.
(c) Segmental reporting
The chief operating decision maker is the Board of Directors. The Directors are of the opinion that the Company is engaged in a single segment of business with the primary objective of investing in securities to generate capital growth for shareholders. Consequently, no business segmental analysis is provided.
The key measure of performance used by the Board is the Net Asset Value of the Company (which is calculated under IFRS). Therefore, no reconciliation is required between the measure of profit or loss used by the Board and that contained in these Unaudited Condensed Interim Financial Statements.
(d) Taxation
The Company has been granted exemption from liability to income tax in Guernsey under the Income Tax (Exempt Bodies) (Guernsey) Ordinance, 1989, as amended by the Director of Income Tax in Guernsey for the current period. Exemption is applied for and granted annually and is subject to the payment of a fee which was £1,600 for the period.
(e) Investment entities
In accordance with IFRS 10 an investment entity is an entity that:
· Obtains funds from one or more investors for the purpose of providing those investor(s) with investment management services;
· commits to its investor(s) that its business purpose is to invest funds solely for returns from capital appreciation, investment income, or both; and
· measures and evaluates the performance of substantially all of its investments on a fair value basis.
The Directors are satisfied that the Company meets each of these criteria and hence is an investment entity in accordance with IFRS 10.
3. Use of estimates and critical judgements
The preparation of Unaudited Condensed Interim Financial Statements in accordance with IFRS requires management to make estimates and assumptions that affect the reported amounts of assets and liabilities and the disclosure of contingent assets and liabilities at the date of the Unaudited Condensed Interim Financial Statements and the reported amounts of income and expenses during the period. Actual results could differ from those estimates and assumptions.
The estimates and underlying assumptions are reviewed on an ongoing basis. The significant estimates and judgements applied are consistent with those disclosed in the Audited Financial Statements for the year ended 31 December 2025, particularly in respect of the fair value measurement and levelling of investments, derivative financial instruments and loan notes, where applicable.
4. New and revised standards
The accounting policies applied in these Unaudited Condensed Interim Financial Statements are consistent with those applied in the Company's Audited Financial Statements for the year ended 31 December 2025.
New standards, amendments and interpretations which became effective for accounting periods beginning on or after 1 January 2026 have been adopted where required. Their adoption has not had a material impact on the financial position, performance or disclosures of the Company.
Standards, amendments and interpretations which have been issued but are not yet effective are not expected to have a material impact on the Company's financial statements.
5. Portfolio management and performance fees
|
|
1 January 2026 to 30 June 2026 |
|
1 January 2025 to 30 June 2025 |
|
|
£'000 |
|
£'000 |
|
|
|
|
|
|
Portfolio management fees |
314 |
|
231 |
|
|
|
|
|
|
Total portfolio management fees |
314 |
|
231 |
The Company procures portfolio management services directly from DWL, under the Portfolio Management Agreement.
Management fee
The monthly management fee is equal to 1.5% of the Net Asset Value that is up to and including £50 million, and 1% of the Net Asset Value that is above £50 million (the "Management Fee"). The management fee is calculated and paid monthly in arrears.
As at 30 June 2026, an amount of £51,000 (31 December 2025: £55,000) was outstanding in respect of management fees.
Performance fee
For the year ending 31 December 2026 a performance fee may be payable to DWL, the sum of which would be equal to 12.5% of the amount by which the Adjusted Net Asset Value at the end of a Calculation Period exceeds the higher of: (i) the Performance Hurdle; and (ii) the High Water Mark (the "Performance Fee"). The calculation period for the current year will be the period commencing on 1 January 2026 and ending on 31 December 2026 (the "Calculation Period").
As at 30 June 2026, the Company had not reached the end of the Calculation period so an accrual of £Nil (31 December 2025: £476,000) for performance fees payable to DWL has been reflected within these Unaudited Condensed Interim Financial Statements.
6. Other expenses
|
|
1 January 2026 to 30 June 2026 |
|
1 January 2025 to 30 June 2025 |
|
|
£'000 |
|
£'000 |
|
|
|
|
|
|
Directors' fees |
71 |
|
63 |
|
Administration fees |
63 |
|
53 |
|
AIFM fees |
28 |
|
- |
|
Auditor's remuneration for: |
|
|
|
|
- audit fees |
14 |
|
10 |
|
Custodian fees |
12 |
|
7 |
|
Broker fees |
33 |
|
38 |
|
Registrars' fees |
4 |
|
8 |
|
Listing fees |
11 |
|
9 |
|
Regulatory fees |
20 |
|
3 |
|
Legal and professional fees: |
|
|
|
|
- ongoing operations |
4 |
|
23 |
|
Directors' liability insurance |
2 |
|
2 |
|
Tax advice |
- |
|
6 |
|
Marketing expenses |
- |
|
22 |
|
Sundry expenses |
29 |
|
17 |
|
|
|
|
|
|
Total other expenses |
291 |
|
261 |
7. (Deficit) / Earnings per Ordinary Share
|
|
30 June 2026 |
|
30 June 2025 |
||||
|
|
Net return |
|
Per share |
|
Net return |
|
Per share |
|
|
£'000 |
|
pence |
|
£'000 |
|
pence |
|
|
|
|
|
|
|
|
|
|
Revenue return |
(1,087) |
|
(3.32) |
|
(490) |
|
(1.96) |
|
Capital return |
(5,379) |
|
(16.42) |
|
385 |
|
1.54 |
|
|
|
|
|
|
|
|
|
|
At 30 June |
(6,466) |
|
(19.74) |
|
(105) |
|
(0.42) |
|
|
|
|
|
|
|
|
|
|
Weighted average number of Ordinary Shares |
|
|
32,761,257 |
|
|
|
24,937,195 |
The return per share is calculated using the weighted average number of Ordinary Shares.
8. Dividends
The Board has not declared an interim dividend (2025: £Nil).
9. Investments held at fair value through profit or loss
|
|
30 June 2026 |
||||||
|
|
Loan notes |
|
Derivative instruments |
|
Equity instruments |
|
Total |
|
|
£'000 |
|
£'000 |
|
£'000 |
|
£'000 |
|
|
|
|
|
|
|
|
|
|
Opening book cost |
500 |
|
- |
|
32,911 |
|
33,411 |
|
Opening investment holding unrealised (losses) / gains |
(250) |
|
1,357 |
|
8,493 |
|
9,600 |
|
|
|
|
|
|
|
|
|
|
Opening valuation |
250 |
|
1,357 |
|
41,404 |
|
43,011 |
|
|
|
|
|
|
|
|
|
|
Movements in the period |
|
|
|
|
|
|
|
|
Purchases at cost |
28 |
|
- |
|
10,032 |
|
10,060 |
|
Sales - proceeds |
- |
|
- |
|
(8,238) |
|
(8,238) |
|
Net losses on investments held at fair value through profit or loss |
- |
|
(95) |
|
(5,284) |
|
(5,379) |
|
|
|
|
|
|
|
|
|
|
Closing valuation |
278 |
|
1,262 |
|
37,914 |
|
39,454 |
|
|
|
|
|
|
|
|
|
|
Closing book cost |
528 |
|
- |
|
33,791 |
|
34,319 |
|
Closing investment holding unrealised (losses) / gains |
(250) |
|
1,262 |
|
4,123 |
|
5,135 |
|
|
|
|
|
|
|
|
|
|
Closing valuation |
278 |
|
1,262 |
|
37,914 |
|
39,454 |
|
|
|
|
|
|
|
|
|
|
Movement in unrealised losses during the period |
- |
|
(95) |
|
(4,870) |
|
(4,965) |
|
Realised losses on sale of investments |
- |
|
- |
|
(414) |
|
(414) |
|
|
|
|
|
|
|
|
|
|
Net loss on investments held at fair value through profit or loss |
- |
|
(95) |
|
(5,284) |
|
(5,379) |
|
Total net loss on investments held at fair value through profit or loss |
- |
|
(95) |
|
(5,284) |
|
(5,379) |
|
|
|
|
|
|
|
|
|
|
Non-current assets |
- |
|
- |
|
37,914 |
|
37,914 |
|
Current assets |
278 |
|
1,262 |
|
- |
|
1,540 |
|
|
|
|
|
|
|
|
|
|
Closing valuation |
278 |
|
1,262 |
|
37,914 |
|
39,454 |
|
|
31 December 2025 |
||||||
|
|
Loan notes |
|
Derivative instruments |
|
Equity instruments |
|
Total |
|
|
£'000 |
|
£'000 |
|
£'000 |
|
£'000 |
|
|
|
|
|
|
|
|
|
|
Opening book cost |
500 |
|
- |
|
23,381 |
|
23,881 |
|
Opening investment holding unrealised gains |
- |
|
- |
|
7,408 |
|
7,408 |
|
|
|
|
|
|
|
|
|
|
Opening valuation |
500 |
|
- |
|
30,789 |
|
31,289 |
|
|
|
|
|
|
|
|
|
|
Movements in the year |
|
|
|
|
|
|
|
|
Purchases at cost |
- |
|
- |
|
25,185 |
|
25,185 |
|
Sales - proceeds |
- |
|
- |
|
(18,935) |
|
(18,935) |
|
Net gains on investments held at fair value through profit or loss |
(250) |
|
1,357 |
|
4,365 |
|
5,472 |
|
|
|
|
|
|
|
|
|
|
Closing valuation |
250 |
|
1,357 |
|
41,404 |
|
43,011 |
|
|
|
|
|
|
|
|
|
|
Closing book cost |
500 |
|
- |
|
32,911 |
|
33,411 |
|
Closing investment holding unrealised (losses) / gains |
(250) |
|
1,357 |
|
8,493 |
|
9,600 |
|
|
|
|
|
|
|
|
|
|
Closing valuation |
250 |
|
1,357 |
|
41,404 |
|
43,011 |
|
|
|
|
|
|
|
|
|
|
Movement in unrealised (losses) / gains during the year |
(250) |
|
1,357 |
|
1,409 |
|
2,516 |
|
Realised gains on sale of investments |
- |
|
- |
|
2,956 |
|
2,956 |
|
|
|
|
|
|
|
|
|
|
Net (loss) / gain on investments held at fair value through profit or loss |
(250) |
|
1,357 |
|
4,365 |
|
5,472 |
|
Total net (loss) / gain on investments held at fair value through profit or loss |
(250) |
|
1,357 |
|
4,365 |
|
5,472 |
|
|
|
|
|
|
|
|
|
|
Non-current assets |
- |
|
- |
|
41,404 |
|
41,404 |
|
Current assets |
250 |
|
1,357 |
|
- |
|
1,607 |
|
|
|
|
|
|
|
|
|
|
Closing valuation |
250 |
|
1,357 |
|
41,404 |
|
43,011 |
Derivative instruments
On 28 November 2025, as part of an equity fund raising by RentGuarantor Holdings Plc ("RGG"), the Company was issued with 9,133,334 warrants to subscribe for one new ordinary share in RGG at a price of 17.5 pence, exercisable at any time for a one-year period.
The warrants contain an accelerator clause such that RGG may serve notice on the warrant holders to exercise their warrants in the event that the closing mid-market share price of RGG's ordinary shares reaches 35p or more over a consecutive 14-day trading period.
As at period end, the warrants had not been exercised and the Company has valued the warrants using the Black Scholes methodology at a price of 13.8164 pence.
Key inputs at 30 June 2026 were:
|
Underlying share price |
31.0p |
|
Exercise price |
17.5p |
|
Volatility of the shares |
60.48% |
|
Risk-free interest rate over the expected life of the warrants |
3.820% |
|
Time to maturity |
150 days |
|
Expected dividends |
0p |
Loan notes
On 12 July 2024, the Company purchased a convertible loan note in OTAQ plc for a consideration of £500,000. The loan note accrues interest at 10% per annum for the first three years and 12.5% for the next two years if the loan has not yet converted. Interest is payable quarterly in arrears based on calendar quarters. The conversion price on the loan note is £0.03 per share with an option to receive the principal loan amount if the conversion rate is unfavourable.
On 10 June 2025 OTAQ plc appointed voluntary liquidators to wind up the company. This course of action triggered all loan note holders including Onward Opportunities to call in their security on the assets, opting to transfer them into a NewCo, ringfenced from OTAQ plc and its other creditors. This process is now advanced with key terms and structures agreed, including an asset realisation plan. The Loan Notes are held at 50% of cost which is considered to be a reasonable approximation of fair value as at 31 December 2025. This fair value represents a significant discount to the potential realisable value of assets underpinning the loan notes and the fair valuation methodology will be monitored on an ongoing basis.
NewCo successfully disposed of some initial assets at a material premium to the original and revised fair value carrying value in early 2026.
10. Unsettled trades
At the period end, the net amount in relation to trades that were settled post period end was £27,000 (31 December 2025: (£21,000)).
11. Share capital
|
|
No of |
|
|
|
|
shares |
|
£'000 |
|
Ordinary Shares at no par value |
|
|
|
|
|
|
|
|
|
Opening balance as at 1 January 2025 |
23,979,754 |
|
24,661 |
|
Issue of shares |
5,711,434 |
|
7,464 |
|
Issue costs |
- |
|
(161) |
|
|
|
|
|
|
At 31 December 2025 |
29,691,188 |
|
31,964 |
|
|
|
|
|
|
Issue of shares |
3,983,906 |
|
5,621 |
|
Issue costs |
- |
|
(229) |
|
|
|
|
|
|
At 30 June 2026 |
33,675,094 |
|
37,356 |
The holders of Ordinary Shares have the right to receive notice of and attend, speak and vote in general meetings of the Company. They are also entitled to participate in any dividends and other distributions of the Company.
12. Net Asset Value per Ordinary Share
The Net Asset Value per Ordinary Share and the Net Asset Value at the period end calculated in accordance with the Articles of Incorporation were as follows:
|
|
30 June 2026 |
|
31 December 2025 |
||||
|
|
NAV |
|
NAV |
|
NAV |
|
NAV |
|
|
per share |
|
attributable |
|
per share |
|
attributable |
|
|
pence |
|
£'000 |
|
pence |
|
£'000 |
|
|
|
|
|
|
|
|
|
|
Ordinary Shares: basic and diluted |
123.50 |
|
41,588 |
|
143.69 |
|
42,662 |
|
|
|
|
|
|
|
|
|
The Net Asset Value per Ordinary Share is based on 33,675,094 Ordinary Shares, being the number of Ordinary Shares in issue at the period end.
13. Other expense payments
|
|
1 January 2026 to 30 June 2026 |
|
1 January 2025 to 30 June 2025 |
|
|
£'000 |
|
£'000 |
|
|
|
|
|
|
Total losses for the period |
(6,466) |
|
(105) |
|
Net losses / (gains) on investments held at fair value |
|
|
|
|
through profit or loss |
5,379 |
|
(217) |
|
Interest income |
(1) |
|
(22) |
|
Dividend income |
(188) |
|
(148) |
|
Movement in working capital |
|
|
|
|
Increase in other receivables |
(31) |
|
(35) |
|
Decrease in payables |
(320) |
|
(551) |
|
|
|
|
|
|
Total other expense payments |
(1,627) |
|
(1,078) |
14. Financial instruments and capital disclosures
The Company's activities expose it to a variety of financial risks; market risk (which includes price risk, foreign currency risk and interest rate risk), credit risk and liquidity risk. The Unaudited Condensed Interim Financial Statements do not include all financial risk management information and disclosures required in the annual financial statements; they should be read in conjunction with the Company's Audited Financial Statements for the year ended 31 December 2025.
The Company measures fair values using the following hierarchy that reflects the significance of the inputs used in making the measurements. Categorisation within the hierarchy has been determined on the basis of the lowest level input that is significant to the fair value measurement of the relevant assets as follows:
Level 1 - Quoted prices (unadjusted) in active markets for identical assets or liabilities.
An active market is a market in which transactions for the asset or liability occur with sufficient frequency and volume on an ongoing basis such that quoted prices reflect prices at which an orderly transaction would take place between market participants at the measurement date. Quoted prices provided by external pricing services, brokers and vendors are included in Level 1, if they reflect actual and regularly occurring market transactions on an arm's-length basis.
Level 2 - Inputs other than quoted prices included within Level 1 that are observable for the asset or liability, either directly (that is, as prices) or indirectly (that is, derived from prices).
Level 2 inputs include the following:
· quoted prices for similar (i.e., not identical) assets in active markets;
· quoted prices for identical or similar assets or liabilities in markets that are not active. Characteristics of an inactive market include a significant decline in the volume and level of trading activity, the available prices vary significantly over time or among market participants or the prices are not current;
· inputs other than quoted prices that are observable for the asset (for example, interest rates and yield curves observable at commonly quoted intervals); and
· inputs that are derived principally from, or corroborated by, observable market data by correlation or other means (market-corroborated inputs).
Level 3 - Inputs for the asset or liability that are not based on observable market data (unobservable inputs).
The level in the fair value hierarchy within which the fair value measurement is categorised is determined on the basis of the lowest level input that is significant to the fair value measurement as a whole. If a fair value measurement uses observable inputs that require significant adjustment based on unobservable inputs, that measurement is a Level 3 measurement.
Assessing the significance of a particular input to the fair value measurement in its entirety requires judgement, considering factors specific to the asset or liability.
|
At 30 June 2026 |
Level 1 |
|
Level 2 |
|
Level 3 |
|
Total |
|
|
£'000 |
|
£'000 |
|
£'000 |
|
£'000 |
|
|
|
|
|
|
|
|
|
|
Equity instruments |
37,364 |
|
550 |
|
- |
|
37,914 |
|
Derivative instruments |
- |
|
1,262 |
|
- |
|
1,262 |
|
Loan notes |
- |
|
- |
|
278 |
|
278 |
|
|
|
|
|
|
|
|
|
|
|
37,364 |
|
1,812 |
|
278 |
|
39,454 |
|
|
|
|
|
|
|
|
|
|
At 31 December 2025 |
Level 1 |
|
Level 2 |
|
Level 3 |
|
Total |
|
|
£'000 |
|
£'000 |
|
£'000 |
|
£'000 |
|
|
|
|
|
|
|
|
|
|
Equity instruments |
40,782 |
|
622 |
|
- |
|
41,404 |
|
Derivative instruments |
- |
|
1,357 |
|
- |
|
1,357 |
|
Loan notes |
- |
|
- |
|
250 |
|
250 |
|
|
|
|
|
|
|
|
|
|
|
40,782 |
|
1,979 |
|
250 |
|
43,011 |
The Company has exposure to level 1, level 2 and level 3 instruments in the current period.
The following table shows a reconciliation of the opening balance to the closing balance for fair values:
|
|
30 June 2026 |
||||
|
|
Level 1 |
|
Level 2 |
|
Level 3 |
|
|
£'000 |
|
£'000 |
|
£'000 |
|
|
|
|
|
|
|
|
Opening balance |
40,782 |
|
1,979 |
|
250 |
|
Purchases at cost |
9,792 |
|
240 |
|
28 |
|
Sales at cost |
(8,231) |
|
(7) |
|
- |
|
Total losses included in net (losses) / gains on investments in the Unaudited Condensed Statement of Comprehensive Income |
|
|
|
|
|
|
- on assets sold |
(408) |
|
- |
|
- |
|
- on assets held at period end |
(4,571) |
|
(400) |
|
- |
|
|
|
|
|
|
|
|
|
37,364 |
|
1,812 |
|
278 |
|
|
31 December 2025 |
||||
|
|
Level 1 |
|
Level 2 |
|
Level 3 |
|
|
£'000 |
|
£'000 |
|
£'000 |
|
|
|
|
|
|
|
|
Opening balance |
30,789 |
|
- |
|
500 |
|
Purchases at cost |
25,185 |
|
- |
|
- |
|
Sales at cost |
(18,935) |
|
- |
|
- |
|
Reclassification |
(622) |
|
622 |
|
- |
|
Total gains included in net gains on investments in the Unaudited Condensed Statement of Comprehensive Income |
|
|
|
|
|
|
- on assets sold |
2,956 |
|
- |
|
- |
|
- on assets held at year end |
1,409 |
|
1,357 |
|
(250) |
|
|
|
|
|
|
|
|
|
40,782 |
|
1,979 |
|
250 |
Capital management objectives, policies and procedures
The Company's capital management objectives remain unchanged from those disclosed in the Audited Financial Statements for the year ended 31 December 2025.
15. Related parties
DWL provides portfolio management services to the Company.
|
|
1 January 2026 |
|
1 January 2025 to |
|
1 January 2025 |
|
|
to 30 June 2026 |
|
31 December 2025 |
|
to 30 June 2025 |
|
|
£'000 |
|
£'000 |
|
£'000 |
|
Fees charged / (recharged) by DWL: |
|
|
|
|
|
|
Management fees |
|
|
|
|
|
|
Total management fee charged |
314 |
|
521 |
|
231 |
|
Management fee outstanding |
51 |
|
55 |
|
41 |
|
AIFM recharge |
|
|
|
|
|
|
Total AIFM fee recharged |
- |
|
(56) |
|
(28) |
|
AIFM fee recharge outstanding |
- |
|
(9) |
|
(14) |
|
Performance fees |
|
|
|
|
|
|
Total Performance fees charged |
- |
|
476 |
|
- |
|
Performance fees outstanding |
- |
|
476 |
|
- |
|
|
|
|
|
|
|
|
AIFM fee charged: |
|
|
|
|
|
|
Total AIFM fee charged by FundRock |
- |
|
19 |
|
19 |
|
Total AIFM fee charged by GFM |
28 |
|
42 |
|
14 |
|
AIFM fee outstanding |
7 |
|
5 |
|
19 |
|
|
|
|
|
|
|
|
Directors' fees: |
|
|
|
|
|
|
Total Directors' fees charged |
71 |
|
125 |
|
63 |
|
Directors' fees outstanding |
- |
|
- |
|
- |
As at 30 June 2026 the following Directors have holdings in the Company:
|
Director |
Number of Ordinary Shares |
% Ordinary Shares in issue as at 30 June 2026 |
|
|
|
|
|
Andrew Henton |
106,000 |
0.3148 |
|
Susan Norman |
49,249 |
0.1462 |
|
Luke Allen |
29,590 |
0.0879 |
|
Henry Freeman |
24,250 |
0.0720 |
|
Maria Jose Freeman (spouse of Henry Freeman) |
5,500 |
0.0163 |
|
Adrian Norman (spouse of Susan Norman) |
4,878 |
0.0145 |
16. Post Statement of Financial Position events
Subsequent to the period end the Company has raised a further £0.6m by way of additional subscription for 441,500 new ordinary shares. The Company now has a total of 34,116,594 ordinary shares in issue.
There has not been any other matter or circumstance occurring subsequent to the end of the interim financial period that has significantly affected, or may significantly affect, the operations of the Company, the results of those operations, or the state of affairs of the Company in future financial periods.
Corporate Information
Directors
Andrew Henton, Chairman
Henry Freeman
Luke Allen
Susan Norman
Registered office
Les Echelons Court
Les Echelons
St Peter Port
Guernsey
GY1 1AR
Portfolio Manager
Dowgate Wealth Limited ("DWL")
15 Fetter Lane
London
EC4A 1BW
AIFM
Global Fund Management Services Limited ("GFM")
Les Echelons Court
Les Echelons
St Peter Port
Guernsey
GY1 1AR
Sponsor, Broker and Placing Agent
Cavendish Capital Markets Limited
1 Bartholomew Close
London
EC1A 7BL
Administrator and Company Secretary
NSM Funds Limited ("NSMF")
Les Echelons Court
Les Echelons
St Peter Port
Guernsey
GY1 1AR
Registrar
MUFG Corporate Markets
Mont Crevelt House
Bulwer Avenue
St Sampson
Guernsey
GY2 4LH
Custodian
Butterfield Bank (Channel Islands) Limited
PO Box 25
Martello Court
Admiral Park
St Peter Port
Guernsey
GY1 3AP
English Legal Adviser to the Company
Gowling WLG (UK) LLP
4 More London Riverside
London
SE1 2AU
Guernsey Legal Advisers to the Company
Walkers (Guernsey) LLP
Block B
Helvetia Court
Les Echelons
St Peter Port
Guernsey
GY1 1AR
Independent Auditor
Grant Thornton Limited
St James Place
St James Street
St Peter Port
Guernsey
GY1 2NZ
RNS may use your IP address to confirm compliance with the terms and conditions, to analyse how you engage with the information contained in this communication, and to share such analysis on an anonymised basis with others as part of our commercial services. For further information about how RNS and the London Stock Exchange use the personal data you provide us, please see our Privacy Policy.

Latest directors dealings
- 25 minutes ago CloudCoco Group
- 1 hour ago Derwent London
- 2 hours ago Standard Life plc
- 4 hours ago Cora Gold Limited (DI)
- 17 hours ago Bunzl