Full Year Results
Summary by AI BETAClose X
18 May 2026
Kainos Group plc ('Kainos' or the 'Group')
Full year results for the year ended 31 March 2026
Kainos Group plc (KNOS), a UK-headquartered IT provider with expertise across three divisions - Digital Services, Workday Services and Workday Products - is pleased to announce its results for the year ended 31 March 2026.
Financial highlights
|
|
|
|
|
|
|
2026 |
2025 |
Change |
|
Revenue |
£431.1m |
£367.2m |
+17% |
|
Statutory profit before tax |
£58.1m |
£48.6m |
+19% |
|
Adjusted pre-tax profit([1]) |
£67.1m |
£65.6m |
+2% |
|
Diluted earnings per share |
35.1p |
28.2p |
+24% |
|
Adjusted diluted earnings per share |
41.1p |
38.3p |
+7% |
|
Total dividend per share |
29.6p |
28.4p |
+4% |
|
Bookings |
£505.3m |
£382.4m |
+32% |
|
Product Annual Recurring Revenue (ARR) |
£89.0m |
£72.6m |
+23% |
|
Contracted backlog |
£433.9m |
£368.2m |
+18% |
|
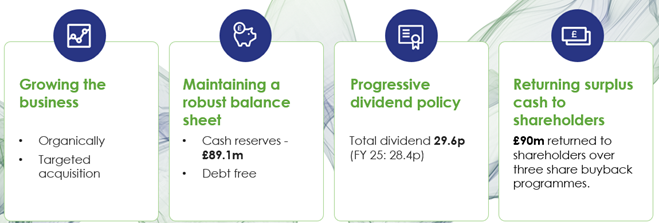
Cash([2]) |
£89.1m |
£133.7m |
-33% |
Strong sales execution has driven revenue growth across the Group, with profit slightly ahead of expectations despite anticipated cost increases
|
= |
Revenue increased by 17% (16% organic, 19% ccy) to £431.1 million (2025: £367.2 million). |
|
= |
Adjusted pre-tax profit was 2% higher (5% ccy) at £67.1 million, with an adjusted profit margin of 16% (2025: 18%). · Following a series of large contract awards during the year, we significantly increased the use of contractors and third-party suppliers to support growth and provide delivery capacity. Contractor costs increased to £18.5 million (2025: £4.5 million), while third-party supplier costs increased to £30.1 million (2025: £14.7 million), including both short-term capacity support and strategic supplier arrangements. · In addition, the period included the first full year of investment in our Built on Workday partnership, together with higher employee costs relating to increased National Insurance contributions and elevated bonus payments reflecting stronger business performance. |
|
= |
Bookings grew by 32% to £505.3 million (2025: £382.4 million) and the year-end contracted backlog rose 18% to £433.9 million (31 March 2025: £368.2 million). |
|
= |
Cash conversion of 99% (2025: 112%) contributed to a robust year-end cash position(2) of £89.1 million (2025: £133.7 million), after returning £55.7 million through share buybacks, acquiring Davis Pierrynowski Limited (Davis Pier), progressing construction of our Belfast HQ and paying restructuring costs provided for in FY25. |
|
= |
The current share buyback programme completed on 15 May 2026, with a total of 3,729,068 shares bought back for consideration of £30.0 million. |
Operational highlights
Workday Products continued its rapid growth and is on track to reach our ARR targets of £100 million by the end of 2026 and £200 million by the end of 2030
|
= |
Revenue rose 15% (19% ccy) to £81.7 million (2025: £71.3 million), with ARR increasing by 23% (24% ccy) to £89.0 million (2025: £72.6 million). |
|
= |
Reaching £100 million ARR will represent a significant milestone for the business and one achieved by very few UK software companies. This progress reflects the strength of the founding team and colleagues across the division, led by Malachy Smith, whose vision, drive and leadership have been central to building one of the UK's most scaled and successful software businesses. |
|
|
o As we build towards our £200 million ARR target, we have invested in the leadership team within the division, adding additional expertise and experience to the team across several senior roles. o These appointments include a Chief Marketing Officer (ex-Google, Microsoft), Chief Product Officer (ex-UiPath, Optimizely), Chief Customer Officer (ex-Mimecast, Veeva), and a Chief Revenue Officer (ex-Splunk, VMware). o Derek Brown (ex-Quantexa, BAE) will join in June to lead this expanded team, with Malachy transitioning to an advisory role in the Group focused on new areas with significant growth potential. |
|
= |
Workday Products now has nearly 700 customers (31 March 2025: more than 560) with around 41% taking two or more products (31 March 2025: around 35%). |
|
= |
We continued to invest in our products, with R&D expenditure rising by 11% to £18.7 million (2025: £16.8 million), all of which was expensed in the year. Sales and marketing spend increased by 21% to £18.7 million (2025: £15.5 million), including £2.3 million of additional costs associated with the first full year of our Workday partnership. |
|
= |
Through an exclusive arrangement, Workday is reselling our new Pay Transparency product to its customers, to help them meet the requirements of the European Pay Transparency Directive which comes into force from next month. |
Digital Services returned to growth with significant contract wins in healthcare and the public sector and continued expansion in North America
|
= |
Revenue increased by 23% (20% organic, 23% ccy) to £241.7 million (2025: £197.2 million). |
|
= |
Bookings were 29% higher at £261.3 million (2025: £202.0 million), contributing to a year-end contracted backlog of £180.3 million (31 March 2025: £160.1 million). |
|
= |
Public sector revenue rose by 11% to £136.0 million (2025: £122.1 million)([3]) and healthcare revenue was 55% up at £74.9 million (2025: £48.2 million), with both sectors benefiting from large new contract wins including programmes with the Home Office, Department for Transport, Driver and Vehicle Standards Agency and NHS England. |
|
= |
During the year, we deprioritised acquiring new commercial customers to invest in growth opportunities in other parts of Digital Services. As a result, commercial sector revenue was 41% lower at £10.7 million (2025: £18.0 million). |
|
= |
Revenue in North America was 127% higher at £20.2 million (2025: £8.9 million), with strong organic growth (75%) and a six-month contribution from Davis Pier, a consultancy specialising in addressing complex challenges for public sector and community organisations. |
Workday Services also returned to growth in FY26, due to a strong sales performance and our focus on more complex deployments where we have deep expertise
|
= |
We are a leading Workday consulting specialist, the seventh([4]) largest globally by certified consultant numbers. |
|
= |
Revenue increased by 9% (12% ccy) to £107.6 million (2025: £98.7 million), with 12% growth in the Americas. EMEA revenue was down 1% but the trend is improving, with sequential growth each half year since H2 2025. |
|
= |
We continued to make good progress in new markets, with revenue in Australia and New Zealand growing quickly and opportunities emerging in Latin America. |
|
= |
Bookings increased by 44% to £121.8 million (2025: £84.6 million), with a contracted backlog of £74.9 million at the year end (31 March 2025: £59.3 million). |
We continue to benefit from our geographical breadth, with international markets generating 41% of Group revenue (2025: 41%)
|
= |
International revenue rose by 18% to £177.2 million (2025: £149.9 million). |
|
= |
Workday Services and Workday Products have particularly strong international customer bases, which generate 83% of their aggregate revenues (2025: 81%). |
Excellent service drives customer satisfaction and retention
|
= |
Our customers continued to rate our services as 'excellent', with a Net Promoter Score of 61 (2025: 70). |
|
= |
Existing customers generated revenue of £370.0 million (2025: £299.4 million), up 24%, representing 86% of Group revenue (2025: 82%). |
|
= |
Customer numbers increased to 1,253 at the year end (31 March 2025: 1,094). |
Engaged and committed colleagues underpin our business performance
|
= |
We have 3,475 people (31 March 2025: 2,865) across 17 countries, with the increase reflecting organic growth and the 120 colleagues who joined us with Davis Pier. |
|
= |
The number of employed staff rose from 2,796 at 31 March 2025 to 3,216 at the year end. |
|
= |
Employee retention remains strong at 90% (2025: 93%), supported by high engagement of 77% (2025: 75%) in our internal surveys. |
Continued growth in our AI business, as we help customers responsibly harness its potential
|
= |
Revenues for AI- and data-related projects increased 11% to £45.8 million (2025: £41.1 million) and now represent 19% of Digital Services' revenue (2025: 21%). |
|
= |
To date, we have delivered over 400 AI and data projects, including 158 in FY26. |
|
= |
Since 2018, Kainos has been the seventh largest supplier of AI to the UK public sector, with over £66 million in awarded contracts. |
|
= |
We continue to invest in our Responsible AI capabilities and are doubling the size of the Kainos Responsible AI team to support safe, responsible, and scalable adoption of AI by our customers. |
|
= |
We launched a Workday AI Centre of Excellence, building on our founding membership of Workday's Agent Partner Network and deep expertise across Workday Services and Products. |
Current trading and outlook
|
= |
We operate in markets with clear long-term structural drivers, as organisations increasingly seek to harness technology to improve their service quality and productivity, and reduce cost. |
|
= |
Our near-term performance is supported by a healthy pipeline, a significant contracted backlog and a strong balance sheet. |
|
= |
In FY27, we expect: - Continued momentum in Workday Products, including achieving our initial ARR targetof £100 million by the end of 2026. - Further growth in Digital Services, led by our public sector and healthcare segments in the UK and our strengthened position in North America. - Another positive year for Workday Services, as we continue to focus on complex deployments for customers and consulting activities linked to our own products, coupled with further progress in our newer international markets. |
Commenting on the results, CEO Brendan Mooney said:
"This was a positive year for Kainos, with excellent revenue growth. Our strong customer relationships and significant contracted backlog position us well for further progress in the year ahead.
"Workday Products remains a key growth driver. We are on track to surpass £100 million of ARR by the end of 2026 and reach £200 million of ARR by 2030. Our investment in product development is delivering results and we have further strengthened our relationship with Workday through our exclusive arrangement for it to resell our new Pay Transparency product to its customers.
"Technology remains the cornerstone of the UK Government's plans to make public services better, more efficient and easier to access. Our major contract wins in the year reflect our expertise and track record in the public and healthcare sectors. We are also excited about the potential in North America, bolstered by the addition of Davis Pier in Canada.
"Workday Services has regained momentum, as we have focused on the more complex deployments where we have deep expertise and can add real value for customers. We delivered strong growth in North America, a stable performance in Europe and continued to expand in our other international markets.
"Our achievements are based on enduring customer relationships and our engaged and talented workforce. We are grateful for our customers' continued trust in us and our colleagues' dedication and energy."
For further information, please contact:
Kainos via FTI Consulting LLP
Brendan Mooney, Chief Executive Officer
Richard McCann, Chief Financial Officer
Investec Bank plc +44 20 7597 5970
Patrick Robb / Nick Prowting / Arnav Kapoor
FTI Consulting LLP +44 20 3727 1000
Dwight Burden / Kwaku Aning
About Kainos Group plc
Kainos Group plc is a UK-headquartered provider of sophisticated IT services to major public sector, commercial and healthcare customers and a developer of software applications. Our shares are listed on the London Stock Exchange (LSE: KNOS).
Our expertise spans three divisions:
|
= |
Digital Services develops and supports custom digital service platforms, which help customers solve key business problems such as the need to improve their service, reduce costs and increase productivity. |
|
= |
Workday Services is a respected Workday partner, providing a comprehensive range of services to support customers deploying Workday's Finance, HR and Planning products. |
|
= |
Workday Products develops proprietary software products that complement Workday, by enhancing our customers' system security and compliance and improving their document generation and storage. |
Our purpose
Our purpose is to help our customers with their most challenging projects and, together with our partners, help them build the capability to succeed in the digital age.
Find out more
You can discover more about us at www.kainos.com.
Definition of terms
We use the following definitions for our key metrics and other terms:
Active customer: a customer who has signed a contract with us within the last three months or has generated revenue in the last six months.
Adjusted earnings per share (basic and diluted): adjusted profit after tax divided by the weighted average number of ordinary shares outstanding (basic) or weighted average number of ordinary shares outstanding after adjustment for the effects of all dilutive potential ordinary shares (diluted).
Adjusted EBITDA: adjusted pre-tax profit excluding interest, tax, depreciation of property, plant and equipment, and right-of-use assets, and amortisation of intangible assets.
Adjusted pre-tax profit: profit before tax excluding the effect of share-based payment expense, acquisition-related expenses including amortisation of acquired intangible assets, deferred consideration (including post combination remuneration expense) and restructuring costs incurred.
Adjusted profit margin: adjusted profit as a percentage of revenue for the period.
Agentic AI: refers to intelligent systems that can autonomously plan, decide and act to achieve defined goals, working across multiple steps and systems with minimal human intervention. These agents combine reasoning, learning and action capabilities to deliver outcomes, not just insights, while operating within clear ethical, governance and organisational boundaries.
Annual recurring revenue (ARR): the total of the annualised committed subscription value contracted at the end of the reporting period.
Bookings: the total value of sales contracted during the period.
Carbon net zero: any CO2 released into the atmosphere from a company's entire value chain is reduced as much as possible and the rest is removed.
Carbon neutral: any CO2 released into the atmosphere from a company's entire value chain activities is balanced by an equivalent amount being removed.
Cash conversion: cash generated from operating activities as a percentage of adjusted EBITDA.
Constant currency (ccy): excludes the effect of foreign currency exchange rate fluctuations on period-on-period performance by translating the relevant prior period figure at current period average exchange rates.
Contracted backlog: the value of contracted revenue that has yet to be recognised.
Compound annual growth rate (CAGR): annual growth rate over a specified period of time.
Existing customer revenue: total revenue recognised from customers in the current period who were also customers in the preceding year.
International revenue: total revenue derived from locations outside of UK and Ireland.
Near-term net zero: making science-based cuts to our day-to-day emissions in the short term, prioritising real reductions that set us on a credible path to full carbon net zero across our business.
Net promoter score (NPS): a metric that organisations use to measure customer loyalty towards their brand, product or service, which can range from -100 to +100. Bain & Co, the creators of the metric, held that a score above 0 is good; 20+ is favourable; 50+ is excellent and 80+ is world-class.
Net revenue retention (NRR): a metric that measures the percentage of revenue retained from existing customers over a period of 12 months, including upsells, downgrades and churn.
Organic revenue: our revenue excluding revenue from acquisitions completed in the current and comparative reporting periods.
Software as a service (SaaS): a software distribution model that delivers application programmes over the internet, with users typically accessing the programme through a web browser. Users pay an ongoing subscription to use the software rather than purchasing it once and installing it.
Science Based Targets initiative (SBTi): a target for reducing greenhouse gases and CO2 emissions which is aligned with the global effort to limit global warming to 1.5°C.
Kainos at a glance
Our three divisions give us significant diversification by business type, sector, geography and customers. This exposes us to a broad range of growth opportunities, while helping to reduce risk.
Our operating divisions
Digital Services
Digital Services addresses customers' business challenges by developing and supporting customised digital services for them. We deliver large, complex projects that focus on improving customer service and productivity, while ensuring the platforms are secure, accessible and cost effective.
Our public sector projects are often part of the UK's national IT infrastructure, helping more than 60 million users while saving customers hundreds of millions of pounds. In healthcare, our solutions enable faster, more cost-effective and patient-focused services.
We serve over 120 customers, including the Home Office, the government of Ontario, Rolls-Royce, the Crown Prosecution Service, DEFRA, NHS England and the UK Health Security Agency. In the UK public healthcare system, we work for more than 45 national, regional and local bodies, and clinical research institutes.
Workday Services
As one of Workday Inc's most-respected partners, we deploy its Finance, HR and Planning products to our clients in Europe and North America, with a growing presence in Asia Pacific. Our experience in complex deployment and integrations means customers trust us to launch, test and extend their Workday systems.
Since becoming a Workday partner in 2011, we have grown into one of the largest globally, with teams in 17 countries and more than 600 customers worldwide.
We are proud to work with organisations such as Glencore (Canada), Daniel J. Edelman Holdings (USA), Natura (Brazil), City of Helsinki (Finland), Perth Airport (Australia) and Miller Insurance (UK).
Workday Products
We develop SaaS products that complement Workday's platform and are part of its Built on Workday program. We have two areas of focus.
First, our market-leading suite of Smart products solves key operational challenges for Workday customers around Governance, Risk and Compliance (GRC) management and controls:
|
= |
Smart Test (launched in 2014): Creates automated, customised tests for a customer's unique Workday configuration. |
|
= |
Smart Audit (2021): Delivers automated, always-on security and compliance controls and monitoring for Workday customers. |
|
= |
Smart Shield (2022): Patented solution which ensures privacy and control of sensitive data to deliver effective Workday reports. |
Second, we have two software solutions that extend the functionality of Workday to address important use cases for HR teams:
|
= |
Employee Document Management (2024): Delivers a compliant, automated, digital employee document solution, reducing administration and accelerating employee onboarding. |
|
= |
Pay Transparency Analyzer (2025): Enables customers to comply with the new EU Pay Transparency Directive. This was built by Kainos for Workday as part of our key strategic partnership and is sold directly by Workday to their global customer base. |
Almost 700 customers use at least one of our products, including: State of Georgia (USA), Genesys (USA), Bupa (UK), Skyscanner (UK) and Julius Baer (Switzerland).
Revenue by division
Workday Products: FY26 revenue: £81.7 million, 19% of Group total, five-year growth: 26% CAGR.
Digital Services: FY26 revenue: £241.7 million, 56% of Group total, five-year growth: 5% CAGR.
Workday Services: FY26 revenue: £107.6 million, 25% of Group total, five-year growth: 11% CAGR.
Our people and customers
People
• Number of staff and contractors: 3,475 (2025: 2,865).
· Number of employed staff: 3,216 (2025: 2,796).
• Employee retention: 90% (2025: 93%).
• People by region:
· UK & Ireland (66%)
· Central Europe (12%)
· Americas (18%)
· Rest of World (4%)
• People by division:
· Digital Services (52%)
· Workday Services (21%)
· Workday Products (21%)
· Central Services (6%)
Customers
• Active customers: 1,253 (2025: 1,094).
• Net Promoter Score: 61 (2025: 70).
• Revenue from existing customers: 86% (2025: 82%).
• Our customers by sector (revenue):
· Commercial sector: 47% (2025: 52%)
· Public sector: 35% (2025: 34%)
· Healthcare: 18% (2025: 14%)
• Our customers by region (revenue):
· UK & Ireland: 59% (2025: 59%)
· North America: 32% (2025: 31%)
· Central Europe: 8% (2025: 9%)
· Rest of World: 1% (2025: 1%)
CEO statement
"The Group performed strongly in FY26, giving us momentum as we enter our new financial year. We see great opportunities ahead for each of our divisions, as we help our customers deploy technology to solve their critical business issues."
Brendan Mooney
Chief Executive Officer
A positive year
This was a good year for Kainos, with our excellent sales performance driving strong revenue growth of 17%, to £431.1 million. Overall bookings increased by 32% to £505.3 million and our backlog at the year end was £433.9 million, up 18%, which gives us confidence and momentum going into FY27.
Workday Products continued its excellent growth, with revenue increasing by 15% to £81.7 million. We passed the industry milestone of $100 million of ARR (approximately £75 million), which only around 1% of SaaS companies achieve. At 31 March 2026, ARR was £89.0 million and we are making strong progress towards our targets of £100 million by the end of 2026 and £200 million by the end of 2030. We have continued to deepen our partnership with Workday, which is reselling our newly developed Pay Transparency product to its customers. We have also significantly strengthened the divisional leadership team, recruiting senior talent to support the next phase of growth.
Digital Services' revenue rose by 23% to £241.7 million. The healthcare sector was particularly strong (up 55%), with public sector revenue growing by 11%. Both sectors benefited from substantial contract wins in the year. Digital Services also continued to grow rapidly in North America, supported by the acquisition of Davis Pier, a specialist consultancy in Canada that significantly enhances our position.
Workday Services increased revenue by 9% to £107.6 million, with growth in North America and good progress with newer markets including Australia, New Zealand and Latin America. Revenue in EMEA was 1% lower but the trend is improving, with sequential growth each half year since H2 2025.
The level of growth has required us to employ contractors and third-party consultants to provide capacity, which reduced margins in the year. We have also seen additional costs from higher employers' National Insurance, increased bonuses as a result of our better results, and the first full year of investment to support our Workday partnership. As a consequence, adjusted pre-tax profit was 2% higher at £67.1 million. As we replace temporary contractors with full-time employees over the course of the year, we anticipate clear margin improvement.
We have continued to invest in the business, including in our product portfolio, acquiring Davis Pier and also starting construction of our new Belfast headquarters. Our financial strength and cash generation also allowed us to return £56.2 million to shareholders through two buyback programmes, while retaining £89.1 million of net cash at the year end.
Supporting our customers
At the end of FY26, we had 1,253 active customers across the Group, up from 1,094 at 31 March 2025. This success reflects our excellent service delivery, as shown by our Net Promoter Score of 61 (2025: 70). We support our customers best when we focus on the areas where we can add most value: large-scale digital transformation projects in the public sector and healthcare, complex Workday implementations and new software products that enable our customers to do more with their Workday platforms. We greatly appreciate our customer loyalty, with 86% of Group revenue in the year coming from existing customers, demonstrating the strength of our relationships.
The application of AI-enabled solutions is becoming integral to digital transformation and we are committed to using it responsibly for our customers. We have strengthened our AI-related governance and expanded our Responsible AI team, which helps us to manage AI risks and support customers to adopt AI safely.
As new technologies, such as AI, create opportunities for us and our customers, we have refocused our innovation team. We identify emerging trends with long-term potential and combine these with customer challenges, translating both into solutions with our divisions and validating their impact directly with customers. This brings innovation closer to our customers and enables faster identification of the highest potential opportunities.
People
The Group ended the year with around 3,475 people, up from 2,865 at the end of FY25. This reflects both our organic growth and the 120 colleagues we welcomed from Davis Pier. The number of people employed increased from around 2,800 to 3,216 and we continue to recruit talented people, as we reduce our reliance on contractors to provide capacity.
Kainos has a positive culture, which is one of our greatest strengths. Our employee engagement remains high at 77% (2025: 75%) and retention is strong at 90% (2025: 93%). We are investing in development, promoting from within and strengthening our teams with key hires, ensuring the Group has the next generation of leadership in place.
Being a responsible business
Creating social value is inherent to our business. Our work to improve public and healthcare services makes life better for citizens and reduces the cost to taxpayers. At the same time, we help our public sector and healthcare customers to tackle economic, social and environmental issues that are important to them, throughout the life of our contracts. As well as being the right thing to do, creating measurable social value is a key criterion on which our bids are judged, and we perform consistently well in this area.
We have continued our initiatives to inspire the next generation of technology leaders through our educational outreach, with more than 1,900 young people taking part this year. One of our goals is to encourage people from under-represented groups to consider a technology career, including continuing to attract young women into the industry. Women currently make up 37% of our workforce (2025: 36%), which is ahead of the average of 21% in UK tech team roles but shows we still have more to do.
Kainos' commitment to climate action remains strong. We achieved our near‑term, science‑based net zero targets as planned in FY26, delivering a 75% reduction in Scope 1 and Scope 2 emissions and a 45% reduction in Scope 3 emissions (intensity‑based) from our FY20 base year. This progress was delivered despite the acquisition of Davis Pier, the start of construction of our new headquarters building and continued business growth during the year. Building on this momentum, we intend to set new science-based targets to drive further emissions reductions. This year, we also maintained our Carbon Disclosure Project (CDP) B‑rating (2025: B‑rating).
Board changes
We were delighted to welcome Shruthi Chindalur as a Non-Executive Director in September 2025. She has more than 20 years' experience in the technology, SaaS and AdTech sectors, giving her invaluable expertise in software and global markets. She is already making a valuable contribution to our Board discussions and we look forward to working with her in the years ahead.
Since the year end, Katie Davis has informed us that she will step down as a Non-Executive Director following the Annual General Meeting in September 2026. We are very grateful for her energy, insight and guidance during the nearly seven years she has been on the Board.
Outlook
While the macroeconomic and geopolitical environment remains uncertain, we are encouraged by the momentum in the business, which is underpinned by our substantial contracted backlog as we enter our new financial year. We expect further strong growth in Workday Products and continued progress in Digital Services and Workday Services, resulting in another positive year for Kainos.
Looking further ahead, we see great opportunities for all our divisions. There are powerful structural drivers in our markets, as organisations seek the benefits of deploying technology to solve their critical business issues.
AI is reshaping enterprise technology. We believe the next decade will not be defined by AI replacing people or compressing services, but by organisations needing partners they can trust to deploy AI responsibly inside their most important systems: those that deliver public services, treat patients and serve customers. That work rewards depth, judgement and accountability rather than scale alone, and it is the work Kainos has built its reputation on.
We see AI as the most significant opportunity in our markets since the move to cloud. We expect a growing share of our work to involve embedding AI capabilities into the platforms our customers already rely on and building software products in which AI is a defining feature rather than an add‑on.
Our Digital Services, Workday Products and Workday Services businesses, together with our AI Centres of Excellence, position us to advise and assist our customers on their AI. While Microsoft and Workday remain core to our delivery, we are actively building partnerships with other leading AI providers to ensure our customers benefit from the best, most appropriate, technology as the AI landscape continues to evolve. The strength of our customer relationships, our domain expertise and our track record of responsible delivery mean we are well placed to play a central role for our customers.
Thank you
As always, I would like to express my appreciation to our customers and colleagues. We are grateful for the trust and confidence our customers continue to place in Kainos, and for the continued engagement and commitment our colleagues have shown throughout the year.
Brendan Mooney
Chief Executive Officer
Our Strategy
Our ambition is to be a global, independent company operating towards the disruptive end of technology, that will thrive today and for generations. By pursuing this ambition, we believe we can achieve long-term growth in revenue, adjusted pre-tax profit and cash flow.
The Group strategy has three key pillars: our people, the markets we operate in and our customers. Our priorities within each pillar are set out below, along with the key metrics we use to measure our progress.
People
People are the fundamental component of our strategy. Our long-term success depends on their talent, skill and motivation, and having the capacity to deliver our customer contracts.
| Strategic priorities | How we measure progress | |
|
• Maintain a positive culture and high employee engagement. • Ensure effective talent acquisition, development and succession planning. • Continue to establish Kainos as a global company, by ensuring consistency of standards and processes. |
Our key metrics include: • Total headcount: 3,475 (+610) • Number of employed staff: 3,216 (+420) • Employee engagement: 77% (+2 pts) • Employee retention: 90% (-3 pts) |
|
Markets
We focus on dynamic, higher-growth markets where the talents of our people shine brightest. In building for the long term, we:
|
= |
expect to continue to grow our international presence; |
|
= |
prefer organic growth and only acquire businesses in exceptional circumstances, such as when we need to obtain unique skills; and |
|
= |
aim to have a well-balanced business, which is not overly reliant on any one market, region or sector. |
Workday Products
| Strategic priorities | How we measure progress | |
|
• Increase the number of Workday customers who use our software. • Ensure high levels of customer satisfaction, driving strong NRR. • Invest in our existing products and develop additional products within the Workday ecosystem. • Continue to work with Workday to increase the scope and impact of our Built on Workday partnership. |
Our key metrics include: • Workday Products revenue growth: 15% • ARR: £89.0 million (+23%) • Number of Workday Products customers: 696 (+130) • Investment in Products R&D: £18.7 million (+11%) • Investment in Products sales and marketing: £18.7 million (+21%) |
|
Digital Services
| Strategic priorities | How we measure progress | |
|
• Grow within the public and healthcare sectors, by engaging in transformation projects across UK Government and the NHS. • Expand internationally, focused initially on Canada. |
Our key metrics include: • Digital Services revenue growth: +23% • Public sector revenue growth: +11% • Healthcare revenue growth: +55% • North America revenue growth: +127%, +138% ccy, +75% organic • Backlog: £180.3 million (+13%)
|
|
Workday Services
| Strategic priorities | How we measure progress | |
|
• Grow in our established markets, as Workday continues to expand within these markets. • Grow internationally, establishing operations in countries with large and growing numbers of Workday customers. |
Our key metrics include: • Workday Services revenue growth: +9% • North America revenue growth: +12%, +17% ccy • EMEA revenue growth: -1%, -1% ccy • Backlog: £74.9 million (+26%) |
|
New opportunities
| Strategic priorities | How we measure progress | |
|
• Develop opportunities, using our structured innovation process to identify and promote ideas that have the potential to become sizeable revenue streams. |
Our key metrics include: • 27 opportunities identified across North America, EMEA, and the UK. • Associated pipeline value of £4.7 million. • 35+ concepts and accelerators validated with customers, with 7 developed into reusable patterns that can be redeployed across engagements. • Launched the Workday AI Centre of Excellence.
|
|
Customers
Consistently delivering for our customers helps us to build long-lasting, mutually beneficial relationships that will see us thrive as a business.
| Strategic priorities | How we measure progress | |
|
• Ensure we understand customers' evolving needs, so we can continue to provide the exemplary service that underpins our repeat revenue. • Invest in innovation, so we can deliver new Workday Products and deploy the latest technologies in our Digital Services engagements. |
Our key metrics include: • Total revenue: £431.1 million (+17%) • Customer Net Promoter Score: 61 (-9 pts) • Percentage of revenue from existing customers: 86% (+4 pts) • Number of active customers: 1,253 (+159)
|
|
Operational Review
Our overall performance
The Group had a positive year in FY26, with revenue up 17% driven by strong sales performances in all divisions.
Workday Products continued its rapid expansion, with revenue up 15% and ARR increasing by 23% (+24% ccy) to £89.0 million. We remain on track for our ARR targets of £100 million by the end of 2026 and £200 million by the end of 2030.
Digital Services' revenue grew 23% (23% ccy, 20% organic), with an excellent performance in healthcare and the public sector returning to growth. North America continued its momentum and benefited from the acquisition of Davis Pier in September 2025.
Workday Services' revenue was 9% higher, driven by strong growth in North America more than offsetting a 1% revenue decline in EMEA. We continue to make progress in our new markets in Australia, New Zealand and Latin America.
Adjusted pre-tax profit increased by 2% (+5% ccy) to £67.1 million, resulting in a 16% margin (2025: 18%). The reduced margin reflected several factors, including:
|
= |
our short-term use of contractors (+£14.0 million) and third-party suppliers (+£15.4 million), to give us additional capacity. We are recruiting to fill these positions and expect to displace many of these contractor-related costs during FY27 as we hire permanent staff members; |
|
= |
a full year of investment to support our Workday partnership (+£2.3 million); |
|
= |
increased employer National Insurance costs (+£3.0 million); and |
|
= |
higher bonuses, due to our better performance in the year (+£11.5 million). |
We also continued to invest to support the growth of our software products. See Workday Products performance below for details.
Bookings rose 32% to £505.3 million (2025: £382.4 million) and we ended the year with a record contracted backlog of £433.9 million, up 18% (31 March 2025: £368.2 million). As discussed in the Digital Services section below, customers are increasingly awarding larger multi-year contracts.
The Group is highly cash generative with cash conversion remaining high at 99% (2025: 112%) despite payment of restructuring costs provided for in FY25, and higher working capital due to our revenue growth.
At 31 March 2026, we had cash (including treasury deposits) of £89.1 million (31 March 2025: £133.7 million). During the year, our strong balance sheet enabled us to return £56.2 million to shareholders through share buybacks, invest £5.9 million in constructing our new Belfast office and acquire Davis Pier. In total, we have returned £90.0 million via share buybacks over the last 18 months.
Workday Products performance
Good sales execution and strong growth in newer products resulted in a 15% increase in revenue (19% ccy) to £81.7 million (2025: £71.3 million), and the 23% growth in ARR described above. Revenue from consulting services related to our EDM product is now reported within Workday Services, who are better placed to deliver implementation services as the product scales. For comparison purposes, the growth rate excluding EDM services would have been 18%.
Almost 700 customers now use our products, with around 41% taking more than one. The year-end backlog increased 20% to £178.7 million (31 March 2025: £148.7 million).
Workday Products generates a high gross margin, giving us capacity to invest for further growth. Our R&D investment rose by 11% to £18.7 million (2025: £16.8 million) and our product-related sales and marketing investment (including £7.5 million of Built on Workday partnership costs) was £18.7 million, up 21% (2025: £15.5 million). The total investment in our software products was therefore £37.4 million (2025: £32.3 million), an increase of 16%. This investment was fully expensed.
Our investment has enabled us to increase the pace of new product introduction in recent years and to develop a deeper relationship with Workday, through the strategic partnership we formed in FY25. In October 2025 Workday announced a new customer solution called "Pay Transparency Analyzer powered by Kainos". Workday is exclusively selling our new Pay Transparency product through its salesforce, making it a highly cost-effective route to the broadest possible market for us. The launch has gone well, with more than 30 customers signed up by the year end.
To ensure we have the leadership capacity and capability to support Workday Products' growth, we have added significantly to the senior team during the year. This has included hiring new leaders for the product, marketing, risk and technology functions.
We currently charge for our software products based on user numbers. While this has worked well to date our market is evolving, for example as AI enables customers to reduce headcount or slow its growth. We have numerous options to adapt our pricing, such as usage-based or consumption models, to ensure it continues to reflect the value our customers receive. We continue to review our approach and do not expect any change to the overall level of our pricing.
Digital Services performance
Digital Services had a strong year, with revenue increasing by 23% (20% organic, 23% ccy) to £241.7 million (2025: £197.2 million). Bookings rose by 29% to £261.3 million (2025: £202.0 million) and the contracted backlog at the year end was £180.3 million, up 13% (31 March 2025: £160.1 million).
In both the public and healthcare sectors, customers are increasingly awarding larger and longer contracts. Our success in FY26 reflects our strategic focus on these high-value opportunities, which deliver greater returns relative to the effort required to win them. At the same time, we remain selective about pursuing smaller contracts when they provide an entry point with new customers, enabling us to establish relationships and expand our engagement over time.
Public sector
Public sector revenue grew 11% to £136.0 million (2025: £122.1 million), as we secured significant new multi-year programmes in FY26. These included contracts with:
|
= |
the Home Office, to support the digital infrastructure for managing people and goods at the UK border; |
|
= |
the Department for Transport, to run, maintain and improve its bus data services; and |
|
= |
the Driver and Vehicle Standards Agency (DVSA), to deliver a platform making it easier to schedule driving tests. |
We also continued to win new work with other central government departments, including the Ministry of Defence.
We were pleased that the quality of our work was recognised in the year. In partnership with the Department for Environment, Food and Rural Affairs, we won the Digital Transformation Project of the Year at the 2025 Digital Revolution Awards. The project created a robust new digital inspection system, to protect the UK's biosecurity while maintaining the flow of vital agricultural and food imports into the UK.
Healthcare sector
Revenue was up 55% to £74.9 million (2025: £48.2 million). While the Government is working through its plan to bring NHS England (NHSE) back into its direct control, we have not seen any disruption to contract awards and the overall direction is for even greater use of technology in the health service, as described below.
During the year we won significant contracts with NHSE, including a Digital Health Checks project through NHS England's Digital Prevention Service Portfolio (DPSP). The project will improve access to vaccinations and screenings through the NHS App and accelerate the delivery of personalised, preventative healthcare in line with the Government's 10 Year Health Plan for England.
The 10 Year Health Plan includes a commitment to make the NHS "the most digitally accessible health system in the world". This has led to renewed focus and investment in a number of areas, as the Government looks to shift the NHS focus from treatment to prevention, and from analogue to digital. Kainos is well positioned to win work in these areas of investment, such as preventative healthcare, genomics, health data and AI.
Commercial sector
The commercial sector is the smallest in Digital Services and the market has been subdued for several years. We therefore deprioritised the sector for growth in FY26, which has benefited our performance in healthcare and the public sector by allowing us to redeploy our people to focus on those opportunities. We continue to support our existing commercial customers.
Revenue in the year was £10.7 million (2025: £18.0 million) representing 4% of divisional revenue.
North America
Our international Digital Services business is primarily in North America, in particular Canada. Revenue continued to grow rapidly, with a 127% increase (138% ccy) to £20.2 million (2025: £8.9 million). This included an initial contribution from Davis Pier, which we acquired in September 2025. On an organic basis, revenue growth was 75%.
Davis Pier is a high-growth Canadian consultancy that specialises in addressing complex challenges for public sector and community organisations across Canada. We knew the business well, having partnered with Davis Pier since 2022. We have strong shared values and cultures that prioritise customers, people and impact, and we were delighted to welcome its team of 120 people to our Digital Services division. The integration has gone well and the business has performed in line with our expectations since we acquired it.
We see continuing strong growth potential in Canada, which needs to invest in digital government, where it currently ranks 47th globally versus seventh for the UK. Our focus to date has mainly been in Nova Scotia, which has a population of around 1 million. We are now also targeting Alberta (5 million) and Ontario (16 million), giving us significant scope to grow. In the medium term, our ambition is to achieve annual revenue of £50 million.
Workday Services performance
We are a leading Workday partner in Europe and a full services partner in the US, which is Workday's biggest market. At the year end we had 944 accredited Workday consultants (31 March 2025: 809).
Workday Services' revenue was 9% higher (12% ccy) at £107.6 million (2025: £98.7 million). Excluding the EDM-related services revenue previously reported within Workday Products, revenue was 6% higher. Revenue in North America grew strongly, with a 12% increase, and the region generated 52% of divisional revenue (2025: 51%). EMEA revenue was 1% lower and accounted for 44% of divisional revenue (2025: 49%).
Sales bookings increased by 44% to £121.8 million (2025: £84.6 million) and the contracted backlog at the year end was £74.9 million (31 March 2025: £59.3 million). The strong sales performance in the year reflected our focus on our core strengths in complex deployments, which helped us to win more large consulting contracts.
In December 2025, we announced that we are expanding our Workday Services operations in Poland to support Workday's growing customer base and its investment in that market. We have been operating in Poland since 2008 and see it as a key part of our European growth story.
In newer markets, our businesses in Australia and New Zealand continue to grow rapidly from a small base and are exceeding our initial expectations. We are also exploring opportunities in Latin America.
We continue to add complementary services that enhance our customers' experience with Workday. In March 2026, we created a strategic partnership with Retain, which offers a best-in-class resource and skills management platform. Combined with Workday's strength in human capital management, this will enable organisations to improve their employee utilisation and assign the right people to the right work, at the right time.
Our customers
The tables below show that our business is well diversified, by customer type and geographically:
|
Revenue by sector |
2026 |
2025 |
|
Commercial customers |
47% |
52% |
|
Public sector customers |
35% |
34% |
|
Healthcare customers |
18% |
14% |
|
Revenue by region |
2026 |
2025 |
|
UK & Ireland |
59% |
59% |
|
North America |
32% |
31% |
|
Central Europe |
8% |
9% |
|
Rest of the World |
1% |
1% |
Artificial intelligence
Revenue from AI and data-related projects grew by 11% to £45.8 million (2025: £41.1 million), representing 19% of Digital Services' revenue.
During FY26 we increasingly moved from proof-of-concept projects to deploying AI in real-world applications for customers. For example, we built an assistant for the Department for Transport's street works team, which can answer questions from the internal team and the public on a wide range of legislation and guidance.
Our Microsoft AI Centre of Excellence continues to grow and helped us to secure several wins, including building a regulatory intelligence agent for a financial services customer. We are also one of the first organisations to launch an AI agent on the Microsoft marketplace. Day One is an onboarding agent for new employees and large organisations which was downloaded more than 300 times within a few days of launch, without any promotion.
We have also created a Workday AI Centre of Excellence, to formalise our approach to capitalising on the agentic AI opportunity within Workday Services. Our goal is to work with customers to help them get the most from AI and the Workday platform. We also have several AI agents available for Workday, such as the Help Agent, which simplifies navigation of Workday's knowledge base with conversational search.
We continue to scale up our use of AI internally, to help our people improve their productivity. Everyone in Kainos now has a Microsoft 365 Copilot licence that gives them access to AI tools that are appropriate to their role, such as coding for developers. We have supported this rollout with training.
Ensuring responsible use of AI
Deploying AI solutions safely and responsibly is vital, both for our customers and for us. We recognise this in our 'unsafe use of AI' principal risk. We are currently doubling the size of our Responsible AI team in Kainos, to enhance our assessment of AI-related risks and support our business development, with the team enabling us to work with customers so they can move forward safely with AI adoption.
Our AI Governance Committee also plays a key role, regularly considering projects where we have identified higher AI-related risks for us and our customers. In addition to ensuring we are effectively mitigating these risks, the Committee assesses whether projects align to our culture and values, and will turn them down if necessary.
Innovation, research and development
We continue to focus our innovation function on the areas where we see the greatest potential for customer impact, aligning it more closely with our businesses.
We identify emerging technologies with long-term strategic potential, focusing on areas such as Agentic AI, quantum technologies, enterprise digital twins and near-Earth observation. These insights guide where we invest and experiment.
We then translate these insights, alongside specific customer challenges, into practical solutions in partnership with our businesses. These are tested with customers to determine whether there is a scalable opportunity, with successful solutions being rolled out more widely. The Workday AI Centre of Excellence is one such example, originating from patterns identified in customer demand.
Financial Review
Revenue
FY26 was a positive year for the Group, with growth across all three divisions.
Revenue for the year increased by 17% (19% ccy, 16% organic) to £431.1 million (2025: £367.2 million). Within this:
|
= |
Workday Products' revenue grew by 15% (19% ccy) to £81.7 million (2025: £71.3 million). As described in the Workday Products' operational review, services related to our EDM product are now delivered by our Workday Services division. For comparison purposes, if the services element of EDM had been delivered by Workday Services last year, the like-for-like growth rate for Workday Products would have been 18%. |
|
= |
Digital Services increased revenue by 23% (23% ccy, 20% organic) to £241.7 million (2025: £197.2 million), with excellent growth in healthcare, a strong performance in the public sector and an initial six months of revenue from Davis Pier, which added £4.6 million to the total. |
|
= |
Workday Services revenue was 9% higher at £107.6 million (12% ccy) (2025: £98.7 million), driven by North America. Our newer geographies in Australia and New Zealand also grew rapidly, while revenue in EMEA was 1% lower. Excluding EDM-related services, revenue growth in Workday Services was 6%. |
The Group Operational Review provides more information on our revenue performance.
Gross margin
Our overall gross margin decreased to 46.1% (2025: 47.9%). This was a combination of:
|
= |
A stable underlying margin in Workday Products. The current year margin of 77.8% is in line with the FY25 margin excluding EDM services (77.5%). |
|
= |
Digital Services achieving a gross margin of 35.6% (2025: 36.4%), reflecting an increased proportion of engagements where we partnered with other organisations to deliver for customers, which is typically at a lower margin, greater use of contractors to provide short-term capacity and increased employers' national insurance contributions. |
|
= |
Workday Services' gross margin decreasing by 6 percentage points to 45.8% (2025: 51.7%), as a result of higher staff costs, following wage growth in recent years which has now moderated, and the inclusion of EDM-related services, which are at a lower margin. Excluding EDM-related services, the current year margin would have been 47.7%. |
Operating expenses
Operating expenses rose from £134.1 million in FY25 to £144.3 million in FY26. Operating expenses in FY25 included restructuring costs of £8.4 million. Excluding restructuring costs from the FY25 total, operating expenses increased by 15% in FY26.
Under the terms of our strategic partnership with Workday announced in July 2024, we pay annual fees of approximately £7.8 million. FY26 included the first full year of these costs, compared with the £5.2 million recorded in FY25, which covered a period of around eight months.
Our investment in product development increased to £18.7 million (2025: £16.8 million), all of which was expensed during the year. We recognised £6.0 million of Research & Development Expenditure Credit (RDEC) income during the year (2025: £5.1 million).
Alternative performance measures
We use alternative performance measures to monitor day-to-day performance and to assist management's financial, strategic and operating decisions.
We believe these adjusted measures provide a clearer view of trading performance, enable meaningful period-to-period comparisons and offer useful insight for users of our financial statements. The items we adjust are consistent with those used by comparable companies.
Specifically we exclude the following:
Costs directly attributable to acquisitions. This includes amortisation of acquired intangible assets, deferred consideration including compensation for post-combination services and acquisition-related expenses such as legal and professional costs incurred mainly in the period of acquisition. These costs are unique to each acquisition and can vary significantly between periods depending on the timing and size of acquisitions, the nature of intangible assets acquired and the structure of consideration. We therefore consider that these costs do not reflect underlying operations.
Share-based payment costs. Share-based payment is an important aspect of employee compensation. However, we believe it is useful to exclude this expense to better understand our core business performance and facilitate comparison of our results to those of peer companies. Our arrangements consist of both equity-settled and cash-settled schemes and the expense incurred will be influenced by factors including the market value of our shares, forfeiture rates and volatility, which are generally beyond our control and may not correlate to the operation of the business.
Significant and non-recurring items. In the prior period we excluded restructuring costs incurred. We consider adjusting these costs provides more meaningful period-to-period comparisons.
We adjust for the above items consistently across all our adjusted measures, namely 'adjusted profit before tax', 'adjusted EBITDA', 'cash conversion' and 'adjusted diluted and basic earnings per share'.
The adjusted profit measures we use are not defined in UK-adopted International Accounting Standards and our definitions may not be comparable with similarly-titled performance measures and disclosures by other entities. As such, these measures should not be considered in isolation but as supplementary information to the financial statements.
The adjusted profit measures reconcile to the reported numbers as follows:
Adjusted profit measures
|
|
2026 (£000s) |
2025 (£000s) |
|
Profit before tax |
58,111 |
48,640 |
|
Share-based payment expense and related costs |
5,373 |
5,930 |
|
Amortisation of acquired intangible assets |
1,302 |
836 |
|
Restructuring costs |
- |
8,411 |
|
Compensation for post-combination services |
2,132 |
877 |
|
Acquisition-related expenses |
145 |
948 |
|
Adjusted profit before tax |
67,063 |
65,642 |
|
|
2026 (£000s) |
2025 (£000s) |
|
Profit after tax |
42,500 |
35,560 |
|
After tax impact of: |
|
|
|
Share-based payment expense and related costs |
3,930 |
4,335 |
|
Amortisation of acquired intangible assets |
1,116 |
645 |
|
Restructuring costs |
- |
6,194 |
|
Compensation for post-combination services |
2,132 |
877 |
|
Acquisition-related expenses |
145 |
693 |
|
Adjusted profit after tax |
49,823 |
48,304 |
Adjusted EBITDA
|
|
2026 (£000s) |
2025 (£000s) |
|
Adjusted profit before tax |
67,063 |
65,642 |
|
Depreciation of property, plant and equipment |
3,278 |
3,381 |
|
Depreciation of right-of-use assets |
1,287 |
1,277 |
|
Finance expense |
383 |
333 |
|
Finance income |
(3,722) |
(6,440) |
|
Adjusted EBITDA |
68,289 |
64,193 |
Adjusted pre-tax profit increased by 2% to £67.1 million (2025: £65.6 million). Profit before tax increased by 19% to £58.1 million (2025: £48.6 million).
Corporation tax charge
The effective tax rate for the year was 27% (2025: 27%),which is higher than the UK corporation tax rate, mainly due to the impact of higher tax rates in the United States and non- deductible acquisition expenses in Canada.
We envisage our future effective tax rates to be broadly in line with this rate.
Earnings per share
Adjusted diluted earnings per share increased by 7% to 41.1p (2025: 38.3p) while diluted earnings per share increased by 24% to 35.1p (2025: 28.2p). The weighted average number of shares in issue decreased by 3% in FY26, due to the share buyback programmes, increasing our earnings per share measures by 3%. Further information is provided in note 7.
Financial position
We continue to have a strong financial position, with a substantial cash balance (see below), no debt and net assets of £100.5 million (31 March 2025: £138.0 million).
The acquisition of Davis Pier resulted in goodwill increasing to £44.3 million (31 March 2025: £37.3 million) and intangible assets rising from £4.2 million at 31 March 2025 to £8.9 million at the year end.
The combined net trade receivables and accrued income balance increased by 54% to £83.4 million (31 March 2025: £54.2 million), reflecting substantial revenue growth in the final quarter of the year. Trade payables and accruals rose to £76.5 million (31 March 2025: £54.3 million), due mainly to increased bonus (driven by the strong financial performance) and contractor accruals.
Cash and cash conversion
The Group is highly cash generative, with our Workday Products business in particular having an attractive cash profile, as we receive payment from customers annually in advance. Cash conversion, which is cash generated by operating activities as a percentage of adjusted EBITDA, was 99% (2025: 112%).
At the year end, we held cash and treasury deposits of £89.1 million (31 March 2025: £133.7 million), with the movement in the year including:
|
= |
£55.7 million returned to shareholders through two share buyback programmes (see Capital allocation policy below); |
|
= |
£5.9 million of cash outflows relating to the construction of our new Belfast office, which is due to open in 2027; and |
|
= |
£7.9 million in relation to the acquisition of Davis Pier. |
Dividend
Our progressive dividend policy provides shareholder returns, while ensuring we have sufficient funds to invest in long-term growth. The Directors have recommended a final dividend of 19.8p which, if approved by shareholders, will be paid on 23 October 2026 to shareholders on the register on 2 October 2026, with an ex-dividend date of 1 October 2026. This will make the total dividend for the year 29.6p (2025: 28.4p) which will represent a distribution of 70% of adjusted profit after tax (2025: 73%).
Capital allocation policy
Kainos has a strong unlevered balance sheet and continues to generate significant operating cash flow. The diagram below shows the Board's priorities for deploying our cash.
Where we have more cash than we need to fund growth, the Board will consider one-off returns of capital to shareholders.
On 9 May 2025, we completed the share buyback programme announced on 11 November 2024. As part of this programme, a total of 3,993,382 shares (including 1,054,544 purchased during the current year) were bought back for consideration of £30.0 million.
In May 2025, we launched another share buyback programme, which completed on 18 November 2025. This resulted in 3,706,558 shares being bought back for consideration of £30.0 million.
In November 2025, we renewed our share buyback programme, with the intention to return up to a further £30.0 million, excluding expenses. At the year end, we had acquired 2,292,044 shares under this programme, at a cost of £18.5 million, including transaction costs of £0.1 million. Since year end, we purchased a further 1,437,024 shares for £11.6 million. This programme completed on 15 May 2026, with a total of 3,729,068 shares purchased for consideration of £30.2 million, including transaction costs of £0.2 million.
At the year end, we had cancelled 6,894,781 shares acquired during the year and held 361,544 shares we had purchased but not cancelled.
The total amount returned to shareholders to date through the three programmes is £90.0 million.
The Board has no current plans to launch a further share buyback programme but will keep future capital returns, including share buybacks, under review alongside other uses of capital, in light of market conditions and the Group's strategic priorities, to maximise shareholder value.
Consolidated income statement for the year ended 31 March 2026
|
|
|
|
|
|||
|
Continuing operations |
Note |
2026 (£000s) |
2025 (£000s) |
|||
|
Revenue |
2 |
431,098 |
367,246 |
|||
|
Cost of sales |
2 |
(232,190) |
(191,337) |
|||
|
Gross profit |
2 |
198,908 |
175,909 |
|||
|
Operating expenses |
|
|
|
|||
|
Restructuring costs |
|
- |
(8,411) |
|||
|
Other operating expenses |
|
(144,291) |
(125,643) |
|||
|
Total operating expenses |
|
(144,291) |
(134,054) |
|||
|
Impairment gain (including amounts recovered) on trade receivables and accrued income |
|
155 |
678 |
|||
|
Operating profit |
3 |
54,772 |
42,533 |
|||
|
Finance income |
|
3,722 |
6,440 |
|||
|
Finance expense |
|
(383) |
(333) |
|||
|
Profit before tax |
|
58,111 |
48,640 |
|||
|
Income tax expense |
5 |
(15,611) |
(13,080) |
|||
|
Profit for the year |
|
42,500 |
35,560 |
|||
|
Earnings per share |
|
|
|
||
|
|
|
|
|
||
|
Basic |
7 |
35.5p |
28.4p |
||
|
Diluted |
7 |
35.1p |
28.2p |
||
Consolidated statement of comprehensive income for the year ended 31 March
2026
|
|
|
2026 (£000s) |
2025 (£000s) |
|
|
Profit for the year |
42,500 |
35,560 |
||
|
Items that may be reclassified subsequently to profit or loss: |
|
|
|
|
|
Foreign operations - foreign currency translation differences |
|
869 |
(1,595) |
|
|
Total comprehensive income for the year |
|
43,369 |
33,965 |
|
Consolidated statement of financial position as at 31 March 2026
|
|
|
|
|
|
|
|
|
|
|
|
|
|
Note |
2026 (£000s) |
2025 (£000s) |
|
|
Non-current assets |
|
|
|
|
|
Goodwill |
|
44,255 |
37,313 |
|
|
Other intangible assets |
|
8,869 |
4,239 |
|
|
Investment property |
|
3,904 |
- |
|
|
Property, plant and equipment |
|
13,139 |
12,145 |
|
|
Right-of-use assets |
|
5,182 |
4,718 |
|
|
Investments in equity instruments |
|
1,299 |
1,299 |
|
|
Deferred tax asset |
|
4,890 |
4,911 |
|
|
|
|
81,538 |
64,625 |
|
|
Current assets |
|
|
|
|
|
Trade and other receivables |
8 |
55,732 |
38,520 |
|
|
Prepayments |
8 |
7,660 |
7,553 |
|
|
Accrued income |
8 |
39,530 |
22,673 |
|
|
Cash and cash equivalents |
|
82,806 |
128,288 |
|
|
Treasury deposits |
|
6,247 |
5,399 |
|
|
|
|
191,975 |
202,433 |
|
|
Total assets |
|
273,513 |
267,058 |
|
|
Current liabilities |
|
|
|
|
|
Trade payables and accruals |
9 |
(76,495) |
(54,269) |
|
|
Deferred income |
9 |
(60,793) |
(46,358) |
|
|
Share buyback liability |
|
(761) |
- |
|
|
Current tax liabilities |
9 |
(8,706) |
(2,526) |
|
|
Other tax and social security |
9 |
(15,456) |
(11,452) |
|
|
Lease liabilities |
|
(1,239) |
(1,246) |
|
|
Provisions |
|
- |
(5,388) |
|
|
|
|
(163,450) |
(121,239) |
|
|
Non-current liabilities |
|
|
|
|
|
Provisions |
|
(1,582) |
(1,546) |
|
|
Deferred tax liability |
|
(3,125) |
(1,976) |
|
|
Lease liabilities |
|
(4,897) |
(4,312) |
|
|
|
|
(9,604) |
(7,834) |
|
|
Total liabilities |
|
(173,054) |
(129,073) |
|
|
Net assets |
|
100,459 |
137,985 |
|
|
Equity |
|
|
|
|
|
Share capital |
|
589 |
618 |
|
|
Share premium account |
|
10,647 |
9,481 3,5623 |
|
|
Other reserves |
|
7,372 |
3,562 |
|
|
Share-based payment reserve |
|
41,823 |
36,907 |
|
|
Shares held to be cancelled |
|
(2,612) |
(1,431) |
|
|
Translation reserve |
|
(761) |
(1,630) |
|
|
Retained earnings |
|
43,401 |
90,478 |
|
|
Total equity |
|
100,459 |
137,985 |
|
These financial statements were approved by the Board of Directors and authorised for issue on 15 May 2026. They were signed on its behalf by:
Richard McCann
Director
15 May 2026
Consolidated statement of changes in equity for the year ended 31 March 2026
|
|
|
|
|
|
|
|
|
|
|
||||||||
|
|
Share capital
(£000s) |
Shares held to be cancelled([5])
(£000s) |
Share premium
(£000s) |
Other reserves
(£000s) |
Share-based payment reserve
(£000s) |
Translation reserve
(£000s) |
Retained earnings
(£000s) |
Total equity
(£000s) |
|||||||||
|
Balance at 31 March 2024 |
629 |
- |
9,419 |
3,548 |
31,228 |
(35) |
112,024 |
156,813 |
|||||||||
|
Profit for the year |
- |
- |
- |
- |
- |
- |
35,560 |
35,560 |
|||||||||
|
Other comprehensive income |
- |
- |
- |
- |
- |
(1,595) |
- |
(1,595) |
|||||||||
|
Total comprehensive income for the year |
- |
- |
- |
- |
- |
(1,595) |
35,560 |
33,965 |
|||||||||
|
Equity-settled share-based payment |
- |
- |
- |
- |
5,679 |
- |
- |
5,679 |
|||||||||
|
Current tax for equity-settled share-based payments |
- |
- |
- |
- |
- |
- |
21 |
21 |
|||||||||
|
Deferred tax for equity-settled share-based payments |
- |
- |
- |
- |
- |
- |
(25) |
(25) |
|||||||||
|
Issue of share capital - share options exercised |
3 |
- |
62 |
- |
- |
- |
- |
65 |
|||||||||
|
Share buyback programme |
- |
(22,785) |
- |
- |
- |
- |
- |
(22,785) |
|||||||||
|
Shares cancelled |
(14) |
21,354 |
- |
14 |
- |
- |
(21,354) |
- |
|||||||||
|
Dividends |
- |
- |
- |
- |
- |
- |
(35,748) |
(35,748) |
|||||||||
|
Balance at 31 March 2025 |
618 |
(1,431) |
9,481 |
3,562 |
36,907 |
(1,630) |
90,478 |
137,985 |
|||||||||
|
Profit for the year |
- |
- |
- |
- |
- |
- |
42,500 |
42,500 |
|||||||||
|
Other comprehensive income |
- |
- |
- |
- |
- |
869 |
- |
869 |
|||||||||
|
Total comprehensive income for the year |
- |
- |
- |
- |
- |
869 |
42,500 |
43,369 |
|||||||||
|
Equity-settled share-based payment |
- |
- |
- |
- |
4,916 |
- |
- |
4,916 |
|||||||||
|
Current tax for equity-settled share-based payments |
- |
- |
- |
- |
- |
- |
84 |
84 |
|||||||||
|
Issue of share capital - share options exercised |
3 |
- |
1,166 |
- |
- |
- |
- |
1,169 |
|||||||||
|
Issue of shares as purchase consideration |
2 |
- |
- |
3,776 |
- |
- |
- |
3,778 |
|||||||||
|
Share buyback programme |
- |
(56,210) |
- |
- |
- |
- |
- |
(56,210) |
|||||||||
|
Shares cancelled |
(34) |
55,029 |
- |
34 |
- |
- |
(55,029) |
- |
|||||||||
|
Dividends |
- |
- |
- |
- |
- |
- |
(34,632) |
(34,632) |
|||||||||
|
Balance at 31 March 2026 |
589 |
(2,612) |
10,647 |
7,372 |
41,823([6]) |
(761) |
43,401 |
100,459 |
|||||||||
Consolidated statement of cash flows for the year ended 31 March 2026
|
|
Note |
2026 (£'000s) |
2025 (Restated)([7]) (£000s) |
|
|
Cash flows from operating activities |
|
|
|
|
|
Profit for the year |
|
42,500 |
35,560 |
|
|
Adjustments for: |
|
|
|
|
|
Finance income |
|
(3,722) |
(6,440) |
|
|
Finance expense |
|
383 |
333 |
|
|
Tax expense |
5 |
15,611 |
13,080 |
|
|
Research & Development Expenditure Credit |
|
(6,032) |
(5,073) |
|
|
Share-based payment expense |
|
5,373 |
5,930 |
|
|
Depreciation of property, plant and equipment |
|
3,278 |
3,381 |
|
|
Depreciation of right-of-use assets |
|
1,287 |
1,277 |
|
|
Amortisation of intangible assets |
|
1,302 |
836 |
|
|
Gain on disposal of property, plant and equipment |
|
(121) |
- |
|
|
Post-acquisition remuneration settled by shares |
|
445 |
- |
|
|
(Decrease)/increase in provisions
ions |
|
(5,379) |
5,392 |
|
|
Operating cash flows before movements in working capital |
|
54,925 |
54,276 |
|
|
(Increase)/decrease in trade and other receivables |
|
(26,316) |
11,795 |
|
|
Increase in trade and other payables |
|
38,818 |
5,703 |
|
|
Cash generated from operating activities |
|
67,427 |
71,774 |
|
|
Income taxes paid |
|
(9,684) |
(12,967) |
|
|
Net cash from operating activities |
|
57,743 |
58,807 |
|
|
Cash flows from investing activities |
|
|
|
|
|
Interest received |
|
3,455 |
6,027 |
|
|
Purchases of property, plant and equipment |
|
(8,041) |
(3,369) |
|
|
Proceeds from sale of property, plant and equipment |
|
125 |
- |
|
|
Proceeds from sale of investment property |
|
- |
6,200 |
|
|
Amounts placed on treasury deposit |
|
(848) |
(996) |
|
|
Acquisition of subsidiaries net of cash acquired |
|
(7,859) |
- |
|
|
Net cash (used)/from in investing activities |
|
(13,168) |
7,862 |
|
|
Cash flows from financing activities |
|
|
|
|
|
Dividends paid |
6 |
(34,632) |
(35,748) |
|
|
Share buyback programme |
|
(55,682) |
(22,552) |
|
|
Interest paid |
|
(383) |
(333) |
|
|
Repayment of lease liabilities |
|
(1,183) |
(1,121) |
|
|
Proceeds on issue of shares |
|
1,169 |
65 |
|
|
Net cash used in financing activities |
|
(90,711) |
(59,689) |
|
|
Net (decrease)/increase in cash and cash equivalents |
|
(46,136) |
6,980 |
|
|
Cash and cash equivalents at beginning of year |
|
128,288 |
121,558 |
|
|
Effect of exchange rate fluctuations on cash held |
|
654 |
(250) |
|
|
Cash and cash equivalents at end of year |
|
82,806 |
128,288 |
|
Notes to the consolidated financial information
1. General information and basis of preparation
Kainos Group plc ('the Company') is a public company limited by shares incorporated in the United Kingdom under the Companies Act 2006 and is registered in England and Wales (company registration number 09579188), having its registered office at 21 Farringdon Road, 2nd Floor, London EC1M 3HA. The Company is listed on the London Stock Exchange.
The Group financial statements consolidate those of the Company and its subsidiaries (together referred to as the 'Group').
The Group financial statements have been prepared and approved by the Directors in accordance with UK-adopted International Accounting Standards ('UK-Adopted IFRS'). The financial statements are presented in Pounds Sterling, generally rounded to the nearest thousand.
The financial information set out in this document does not constitute the statutory accounts of the Group for the years ended 31 March 2026 or 31 March 2025 but is derived from those accounts. Statutory accounts for the year ended 31 March 2025 have been delivered to the registrar of companies, and those for 2026 will be delivered in due course. The auditor has reported on those accounts; their reports were (i) unqualified, (ii) did not include a reference to any matters to which the auditor drew attention by way of emphasis without qualifying their report and (iii) did not contain a statement under section 498 (2) or (3) of the Companies Act 2006.
This financial information was authorised for issue by the Directors on 15 May 2026.
2. Segment reporting
The following is an analysis of the Group's revenue and results by reportable segment:
|
|
|
|
|
|
|||||
|
2026 12 months to 31 March |
Digital Services (£000s) |
Workday Services (£000s) |
Workday Products (£000s) |
Consolidated
(£000s) |
|||||
|
Revenue |
241,737 |
107,612 |
81,749 |
431,098 |
|||||
|
Cost of sales |
(155,732) |
(58,313) |
(18,145) |
(232,190) |
|||||
|
Gross profit |
86,005 |
49,299 |
63,604 |
198,908 |
|||||
|
Direct expenses([8]) |
(30,403) |
(36,490) |
(39,968) |
(106,861) |
|||||
|
Contribution |
55,602 |
12,809 |
23,636 |
92,047 |
|||||
|
Depreciation of property, plant and equipment |
|
|
|
(3,278) |
|||||
|
Central overheads(8) |
|
|
|
(25,045) |
|||||
|
Net finance income |
|
|
|
3,339 |
|||||
|
Adjusted pre-tax profit |
|
|
|
67,063 |
|||||
|
|
Share-based payments expense and related costs |
|
|
|
(5,373) |
||||
|
|
Amortisation of acquired intangible assets |
|
|
|
(1,302) |
||||
|
|
Compensation for post-combination remuneration |
|
|
|
(2,132) |
||||
|
|
Acquisition-related expenses |
|
|
|
(145) |
||||
|
|
Profit before tax |
|
|
|
58,111 |
||||
|
to 31 March
|
|
|
|
|
|||
|
2025 12 months to 31 March |
Digital Services (£000s) |
Workday Services (£000s) |
Workday Products (£000s) |
Consolidated
(£000s) |
|||
|
Revenue |
197,173 |
98,725 |
71,348 |
367,246 |
|||
|
Cost of sales |
(125,438) |
(47,647) |
(18,252) |
(191,337) |
|||
|
Gross profit |
71,735 |
51,078 |
53,096 |
175,909 |
|||
|
Direct expenses(8) |
(21,546) |
(33,491) |
(33,615) |
(88,652) |
|||
|
Contribution |
50,189 |
17,587 |
19,481 |
87,257 |
|||
|
Depreciation of property, plant and equipment |
|
|
(3,381) |
||||
|
Central overheads(8) |
|
|
|
(24,341) |
|||
|
Net finance income |
|
|
|
6,107 |
|||
|
Adjusted pre-tax profit |
|
|
|
65,642 |
|||
|
Share-based payments expense and related costs |
|
(5,930) |
|||||
|
Amortisation of acquired intangible assets |
|
|
|
(836) |
|||
|
Compensation for post-combination remuneration |
(877) |
||||||
|
Acquisition-related expenses |
|
|
|
(948) |
|||
|
Restructuring costs |
|
|
|
(8,411) |
|||
|
Profit before tax |
|
|
|
48,640 |
|||
The Group's revenue from external customers by primary geographic region is detailed below:
|
|
2026 (£000s) |
2025 (£000s) |
|
|
United Kingdom |
243,551 |
202,014 |
|
|
Republic of Ireland |
10,387 |
15,360 |
|
|
Total United Kingdom & Ireland |
253,938 |
217,374 |
|
|
|
|
|
|
|
United States of America |
112,568 |
97,102 |
|
|
Canada |
25,168 |
17,290 |
|
|
Total Americas |
137,736 |
114,392 |
|
|
|
|
|
|
|
Central Europe |
34,055 |
33,710 |
|
|
Rest of world |
5,369 |
1,770 |
|
|
|
431,098 |
367,246 |
|
Disaggregation of revenue by type
|
|
Digital Services 2026 |
Workday Services 2026 |
Workday Products 2026 |
Total 2026 |
|||||
|
|
(£000s) |
(£000s) |
(£000s) |
(£000s) |
|||||
|
Type of revenue |
|
|
|
|
|||||
|
Services |
234,390 |
103,575 |
2,222 |
340,187 |
|||||
|
Subscriptions |
- |
- |
79,527 |
79,527 |
|||||
|
Third party and other |
7,347 |
4,037 |
- |
11,384 |
|||||
|
|
241,737 |
107,612 |
81,749 |
431,098 |
|||||
|
|
Digital Services 2025 |
Workday Services 2025 |
Workday Products 2025 |
Total 2025 |
|
||||
|
|
(£000s) |
(£000s) |
(£000s) |
(£000s) |
|
||||
|
Type of revenue |
|
|
|
|
|
||||
|
Services |
188,451 |
95,047 |
4,061 |
287,559 |
|
||||
|
Subscriptions |
- |
- |
67,287 |
67,287 |
|
||||
|
Third party and other |
8,722 |
3,678 |
- |
12,400 |
|
||||
|
|
197,173 |
98,725 |
71,348 |
367,246 |
|
||||
|
Disaggregation of revenue by sector
|
|
|
|
|
|||||
|
Group |
2026 (£000s) |
2025 (£000s) |
|
||||||
|
Public |
150,378 |
125,537 |
|
||||||
|
Commercial |
201,554 |
190,872 |
|
||||||
|
Healthcare |
79,166 |
50,837 |
|
||||||
|
Total |
431,098 |
367,246 |
|
||||||
Revenue for Digital Services is now shown separately for the North America region, reflecting its increasing strategic and operational importance:
|
|
2026
(£000s) |
2025 (unaudited) (£000s) |
|
|
Digital Services |
|
|
|
|
Public |
136,046 |
122,145 |
|
|
Commercial |
10,656 |
17,965 |
|
|
Healthcare |
74,881 |
48,210 |
|
|
North America |
20,154 |
8,853 |
|
|
|
241,737 |
197,173 |
|
3. Profit for the year
Profit for the year has been arrived at after charging/(crediting):
|
|
2026 (£000s) |
2025 (£000s) |
|
|
Total staff costs |
273,861 |
259,119 |
|
|
Government grants |
(131) |
(793) |
|
|
Research and development expensed as incurred |
18,722 |
16,818 |
|
|
Research and Development Expenditure Credit |
(6,032) |
(5,073) |
|
|
Depreciation of property, plant and equipment |
3,278 |
3,381 |
|
|
Depreciation of right-of-use assets |
1,287 |
1,277 |
|
|
Gain on disposal of property, plant and equipment |
121 |
- |
|
|
Net foreign exchange loss |
953 |
461 |
|
|
Amortisation of acquired intangibles |
1,302 |
836 |
|
4. Staff numbers
The average number of employees during the year was:
|
|
2026 Number |
2025 Number |
|
|
Technical |
2,429 |
2,410 |
|
|
Administration |
278 |
310 |
|
|
Sales |
240 |
233 |
|
|
|
2,947 |
2,953 |
|
5. Tax expense
The following tax was recognised in recognised in the income statement:
|
|
2026 (£000s) |
2025 (£000s) |
||
|
Current tax expense: |
|
|
||
|
Current year (UK) |
10,829 |
9,909 |
||
|
Current year (overseas) |
5,055 |
4,070 |
||
|
Adjustments in respect of prior years |
386 |
(635) |
||
|
|
16,270 |
13,344 |
||
|
Deferred tax |
|
|
||
|
Origination and reversal of temporary differences |
(578) |
(1,277) |
||
|
Adjustments in respect of prior years |
(81) |
1,013 |
||
|
|
(659) |
(264) |
||
|
Total tax expense |
15,611 |
13,080 |
||
In addition to the amount charged to the statement of comprehensive income, the following amounts relating to tax have been recognised directly in equity in relation to share-based payments:
|
|
|
2026 (£000s) |
2025 (£000s) |
|
Current tax |
|
|
|
|
Permanent element of share-based payment deduction |
84 |
21 |
|
|
Deferred tax |
|
|
|
|
Deferred tax on share-based payments |
- |
(25) |
|
|
|
|
|
|
|
Total tax recognised directly in equity |
84 |
(4) |
|
The Group's tax charge can be reconciled to the profit in the income statement and effective tax rate as follows:
|
|
2026 (£000s) |
2025 (£000s) |
|
|
Profit before tax on continuing operations |
58,111 |
48,640 |
|
|
Tax at the UK corporation tax rate of 25% (2025: 25%) |
14,528 |
12,160 |
|
|
Expenses not deductible for tax purposes |
657 |
662 |
|
|
Tax exempt income |
- |
(357) |
|
|
Effect of tax rates in foreign jurisdictions |
121 |
237 |
|
|
Adjustments to tax charge in respect of prior years |
305 |
378 |
|
|
Tax expense for the year |
15,611 |
13,080 |
|
|
Effective tax rate |
27% |
27% |
|
6. Dividend
|
|
2026 (£000s) |
2025 (£000s) |
|||
|
Amounts recognised as distributions to equity holders in the period: |
|
|
|||
|
Interim dividend for 2026 of 9.8p per share |
11,697 |
- |
|||
|
Final dividend for 2025 of 19.1p per share |
22,935 |
- |
|||
|
Interim dividend for 2025 of 9.3p per share |
- |
11,721 |
|||
|
Final dividend for 2024 of 19.1p per share |
- |
24,027 |
|||
|
|
34,632 |
35,748 |
|||
7. Earnings per share
Basic
The calculation of basic earnings per share (EPS) has been based on the following profit attributable to ordinary shareholders and weighted average number of ordinary shares outstanding.
|
|
2026 (£000s) |
2025 (£000s) |
||
|
Profit attributable to ordinary shareholders |
42,500 |
35,560 |
||
|
|
Thousands |
Thousands |
||
|
Issued ordinary shares at 1 April |
123,620 |
125,788 |
||
|
Effect of shares held in trust |
(983) |
(882) |
||
|
Effect of share options vested and exercised |
428 |
418 |
||
|
Effect of shares issued related to a business combination |
210 |
58 |
||
|
Effect of shares issued related to free share awards |
121 |
122 |
||
|
Effect of share buyback programme |
(3,635) |
(468) |
||
|
Weighted average number of ordinary shares at 31 March |
119,761 |
125,036 |
||
|
Basic earnings per share |
35.5p |
28.4p |
||
Diluted
The calculation of diluted EPS has been based on the following profit attributable to ordinary shareholders and weighted-average number of ordinary shares outstanding after adjustment for the effects of all dilutive potential ordinary shares.
|
|
2026 (£000s) |
2025 (£000s) |
|
|
Profit attributable to ordinary shareholders |
42,500 |
35,560 |
|
|
|
Thousands |
Thousands |
|
|
Weighted average number of ordinary shares (basic) |
119,761 |
125,036 |
|
|
Effect of share options in issue |
248 |
228 |
|
|
Effect of shares held in trust |
983 |
882 |
|
|
Effect of potential shares to be issued related to a business combination |
99 |
- |
|
|
Weighted average number of ordinary shares (diluted) at 31 March |
121,091 |
126,146 |
|
|
Diluted earnings per share |
35.1p |
28.2p |
|
Adjusted (unaudited)
Adjusted basic and adjusted diluted earnings per share is calculated using the adjusted profit for the year measure. The calculation of adjusted profit for the year is detailed in the Financial Review section of this Report.
|
|
2026 (£000s) |
2025 (£000s) |
|
|
Adjusted profit for the year |
49,823 |
48,304 |
|
|
|
Thousands |
Thousands |
|
|
Weighted average number of ordinary shares for the purposes of basic earnings per share |
119,761 |
125,036 |
|
|
Weighted average number of ordinary shares for the purposes of diluted earnings per share |
121,091 |
126,146 |
|
|
Adjusted basic earnings per share |
41.6p |
38.6p |
|
|
Adjusted diluted earnings per share |
41.1p |
38.3p |
|
8. Trade and other receivables
|
|
|
||
|
|
|
2026 (£000s) |
2025 (£000s) |
|
Trade receivables |
43,820 |
31,481 |
|
|
Other receivables |
11,912 |
7,039 |
|
|
|
55,732 |
38,520 |
|
|
Prepayments |
7,660 |
7,553 |
|
|
Accrued income |
39,530 |
22,673 |
|
|
|
102,922 |
68,746 |
|
9. Trade and other payables
|
|
2026 (£000s) |
2025 (£000s) |
|
|
Trade payables and accruals |
76,495 |
54,269 |
|
|
Deferred income |
60,793 |
46,358 |
|
|
Current tax liabilities |
8,706 |
2,526 |
|
|
Other tax and social security |
15,456 |
11,452 |
|
|
|
161,450 |
114,605 |
|
10. Subsequent events
The Company bought back, for cancellation, 1,437,024 ordinary shares at a cost of £11.6 million between 1 April 2026 and 15 May 2026.
There have been no other material events subsequent to year end that would require adjustment or disclosure in these consolidated financial statements.
([1]) The Financial Review section reconciles adjusted and statutory profit measures. See also the Definition of terms section for more information on adjusted measures and other key terms and metrics used in this report.
([2]) Includes £6.2 million (31 March 2025: £5.4 million) of treasury deposits which do not meet the definition of cash and cash equivalents.
([3]) Digital Services' sectoral revenues for FY25 have been re-presented to exclude North America, which we now report separately.
([4]) According to partner metrics sourced from Workday, October 2025.
(5) Shares purchased as part of the share buyback programme due to be cancelled.
([6]) £32.3 million relates to exercised or lapsed options or fully vested free share awards and is considered distributable.
([7]) The consolidated statement of cash flows for FY25 did not correctly include research & development expenditure credit of £5.1 million as an adjustment (add back) to profit to arrive at operating cash flows before movements in working capital. Previously this amount was presented within movements in working capital. The impact is to increase operating cash flows before movements in working capital by £5.1 million, increase movement in trade and other receivables by £0.9 million and increase movement in trade and other payables by £4.2 million. These have been corrected and the consolidated statement of cash flows has been restated.
([8]) Direct expenses plus central overheads (including depreciation) plus balances below adjusted profit equals the sum of operating expenses plus impairment gain/(loss) and reversals on trade receivables and accrued income. Direct expenses are expenses that are directly attributable to each division.
RNS may use your IP address to confirm compliance with the terms and conditions, to analyse how you engage with the information contained in this communication, and to share such analysis on an anonymised basis with others as part of our commercial services. For further information about how RNS and the London Stock Exchange use the personal data you provide us, please see our Privacy Policy.

Latest directors dealings
- 20 minutes ago Supreme
- 2 hours ago PureTech Health
- 2 hours ago Tinybuild Inc. (DI) (Reg s, CAT 3)
- 2 hours ago Insig AI
- 2 hours ago Sunbelt Rentals Holdings, Inc.