
Exploration Target Highlights Potential in Germany
Summary by AI BETAClose X


NEWS RELEASE 28 MAY 2026
EXPLORATION TARGET HIGHLIGHTS POTENTIAL FOR LARGE-SCALE COPPER-SILVER PROJECT IN GERMANY
HIGHLIGHTS
· Exploration Target demonstrates potential for globally significant copper endowment at Tannenberg Copper Project, Germany.
· Exploration Target captures hanging wall and footwall mineralisation above and below the Kupferschiefer shale: a modern view of the deposit that the 1940 historical estimate did not contemplate.
· Validated by Kupferschiefer mining in Poland, where up to 95% of mineable copper at KGHM Polska Miedź S.A's operations is hosted in the same footwall sandstone and hanging wall limestone units that host the Tannenberg Exploration Target.
· Built on validated historical foundations: Exploration Target builds on the 1940 National Socialist historical estimate area; the 1984 St Joe historical estimate; validation via resampling and logging of 1980's core by GreenX and digitised archive material collected since August 2024.
· An inflection point for the Project: With the Exploration Target estimated, GreenX now transitions from archive synthesis to active exploration, including accessing historical underground mines for Scoping Study-level metallurgical test work, seismic survey evaluation and commencement of an initial drill program.
GreenX Metals Limited (ASX:GRX, LSE:GRX, GPW:GRX, Germany-FSE:A3C9JR) (GreenX or the Company) is pleased to announce an Exploration Target at the Tannenberg Copper Project (Tannenberg or the Project), in Germany. The estimated range of potential mineralisation in the Exploration Target is: 144 - 279 Mt at 0.9% - 1.4% Cu and 15 - 21 g/t Ag for 1.3 - 3.9 Mt Cu and 69 - 188 Moz Ag.
Cautionary Statement: The Exploration Target has been reported in accordance with the 2012 edition of the JORC Code (JORC Code). The potential quantity and grade of the Exploration Target is conceptual in nature. There has been insufficient exploration to estimate a Mineral Resource for the reported target areas. It is uncertain if further exploration will result in the estimation of a Mineral Resource.
|
Table 1: Exploration Target for Tannenberg |
|||||
|
Prospect |
Tonnes Range |
Cu Grade Range |
Ag Grade Range |
Contained Cu Range |
Contained Ag Range |
|
Zone 1 |
8 to 16 Mt |
0.9 to 1.4% Cu |
15 to 21 g/t Ag |
0.1 to 0.2 Mt Cu |
3.9 to 10.8 Moz Ag |
|
Zone 2 |
40 to 78 Mt |
0.4 to 1.1 Mt Cu |
19.3 to 52.7 Moz Ag |
||
|
Zone 3 |
96 to 186 Mt |
0.9 to 2.6 Mt Cu |
46.3 to 125.6 Moz Ag |
||
|
Total |
144 to 279 Mt |
1.3 to 3.9 Mt Cu |
69.4 to 188.4 Moz Ag |
||
GreenX's Chief Executive Officer, Mr Ben Stoikovich, commented: "Today's Exploration Target at Tannenberg is a result of 18 months of archive data search and synthesis. It also marks an inflection point where we transition from searching for archive data to ramping up our own exploration programs. The modern understanding of the Kupferschiefer system, demonstrated by the scale of Kupferschiefer mining operations in Poland today, shows that economic copper mineralisation extends well beyond the thin shale horizon that historical German exploration focused on. The size of the potential copper endowment at Tannenberg in Hessen, Germany, in the same geological formation of the world-class Polish deposits, justifies continued investment and exploration".
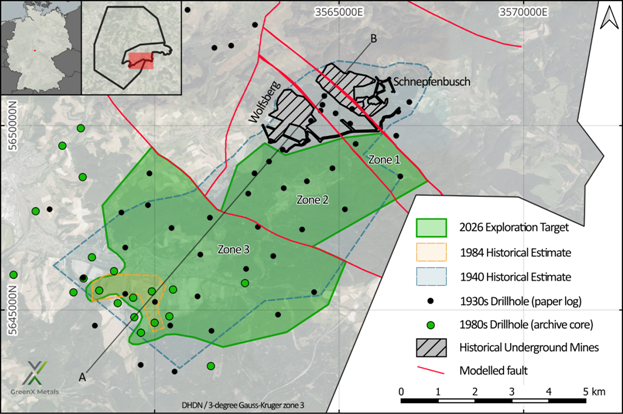
Figure 1: Outline of the Exploration target and its relationship to previous historical estimates and historical underground mining operations at Tannenberg. Section A-B is shown in Figure 4.
EXPLORATION TARGET
The Exploration Target provides a modern view of the copper potential at Tannenberg. Unlike the 1940 Historical Estimate, which assessed only the thin Kupferschiefer shale horizon (refer to announcement dated 20 October 2025), the Exploration Target captures mineralisation in the hanging wall above and footwall below the shale. This is consistent with the modern understanding of Kupferschiefer deposits as evidenced at KGHM Polska Miedź S.A's (KGHM) mining operations in Poland. The sections below set out the historical foundations, the modern thickness model and the supporting work that underpin the Exploration Target.
Cautionary Statement: The Exploration Target has been reported in accordance with the JORC Code. The potential quantity and grade of the Exploration Target is conceptual in nature. There has been insufficient exploration to estimate a Mineral Resource for the reported target areas. It is uncertain if further exploration will result in the estimation of a Mineral Resource.
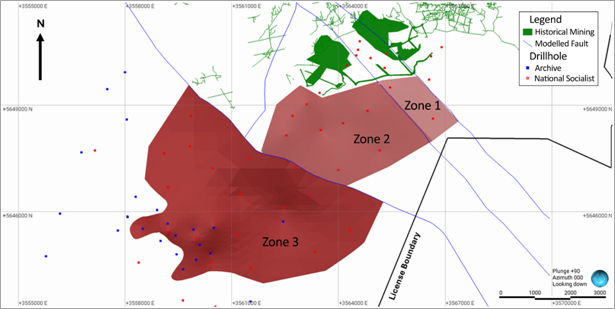
Figure 2: Top-down view of the Exploration Target wireframe at Tannenberg.
From historical mining district to Exploration Target
The Tannenberg Project has a long-documented history of drilling, mining, and estimation work, providing well-defined and historically validated copper-silver mineralisation that underpins today's Exploration Target.
A 95-hole drilling campaign was completed by the National Socialist Government between 1935 and 1938 across the Richelsdorf Mining District. This dataset formed the geological basis for the construction of three Kupferschiefer copper mines within the Tannenberg licence area, Reichenberg, Wolfsberg and Schnepfenbusch. These mines operated between the late 1930's and in some cases up to the mid 1950's. GreenX has digitised and integrated this drillhole database into its geological models (refer to announcement dated 11 September 2025).
The 1940 historical estimate, produced by Mansfeldsche Kupferschieferbergbau AG (Mansfeld AG), is based on a spatially relevant subset of 18 holes from the 95-hole database and established 728,000 tonnes of contained copper* at an average grade of 2.6% copper (in the narrow Kupferschiefer shale only) between the Wolfsberg and Schnepfenbusch mines in the north and the Ronshausen area in the south (see Figure 1). The historical estimate covers mineralisation from a depth of 100 m in the north to 400 m in the southern end area near Ronshausen (refer to announcement dated 20 October 2025).
A later historical estimate from 1984 was produced by St Joe Explorations GmbH (St Joe), based on limited drilling between 1980 and 1984 (refer to announcements dated 2 August 2024 and 28 April 2025). The St Joe historical work estimated (20 October 2025) 169,000 tonnes of contained copper and 6.5 million ounces of contained silver within the small section of zone 3. St Joe assayed wider intersections and found that the mineralisation was up to 3.45 m thick. This is considerably thicker than the narrow Kupferschiefer shale assayed and estimated by Mansfeld AG in 1940. St Joe provided the first modern indication that economic mineralisation extends beyond the Kupferschiefer shale itself.
Cautionary statement for historical estimates: The historical estimates referenced in this announcement are not reported in accordance with the JORC Code. A competent person has not done sufficient work to classify the historical estimates as a mineral resource or ore reserve in accordance with the JORC Code. It is uncertain that following evaluation and/or further exploration work that the historical estimates will be able to be reported as a mineral resource or ore reserve in accordance with the JORC Code.
Modern thickness model
The modern understanding of the Kupferschiefer deposit model, as evidenced at KGHM's Polish mining operations on the same geological setting as Tannenberg, shows that up to 95% of mineable copper can be hosted in the footwall sandstone and hanging wall limestone, with mineralisation often occurring up to 30 m above and 60 m below the Kupferschiefer shale horizon.
Applying the thick mineralisation concept to the historically defined Tannenberg footprint produces a statistically-derived mineralised thickness of 1.7 m - 3.3 m, compared with the 20 cm - 60 cm (shale-only) thickness used in the 1940 historical estimate. The 1.7 m - 3.3 m thickness is consistent with the wider intercepts confirmed by St Joe in the 1980s and has now been independently validated by GreenX's resampling of available archived core.
COMPLETION OF ARCHIVE CORE logging and sampling
After relogging a total of 4,389 m of archived core and taking 2,368 new samples, GreenX has now brought its work on the archived core to a close. This program was initiated after the discovery that drill core had been retained in the archives of the Hessisches Landesamt für Naturschutz, Umwelt und Geologie (HLNUG) for over 40 years since drilling. This new logging and sampling has been conducted in accordance with industry standard practices and has facilitated the estimation of the Exploration Target ranges. In addition to the validation of the historical copper and silver grades around the historical mining areas (see announcement date 20 November 2025), the data has demonstrated that the copper and silver mineralisation persists many kilometres away from the historical copper mines (Wolfsberg, Schnepfenbusch, and Reichenberg).
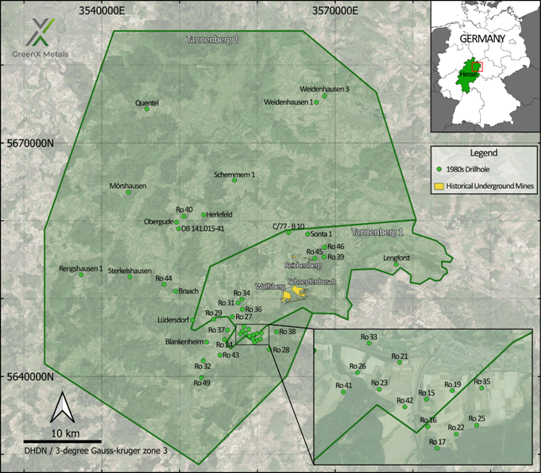
Figure 3: Location map of 1980s Archive drillholes recently logged and assayed by GreenX.
Upcoming and ONGOING Work Programs
GreenX is advancing a coordinated suite of exploration activities which will test the validity of the Exploration Target identified at Tannenberg, including:
· Mineralogical and desktop metallurgical analysis of material collected from archive core - Q2 2026;
· Accessing historical underground mines for scoping study-level metallurgical test work, chip sampling, as well as mapping and surveying for 3D modelling - 2H 2026;
· Collation and digitisation of historical geological, mine development, and production data - ongoing;
· Analysis of the use of seismic surveys to aid future drilling campaigns including collecting petrophysical measurements for seismic forward modelling - Q2 2026;
· Seismic survey, if appropriate - commencement H2 2026; and
· Initial drill program - commencement late 2026.
Exploration target: Drillhole database audit and verification
GreenX logged, sampled, and assayed available archive core at Tannenberg (Archive). The work was done by Palsatech in a specialist logging facility in Sweden. MSA Mining Consulting UK Ltd's (MSA-UK) independent competent person visited the facility while Archive core was being processed. All intercepts with significant Cu-Ag mineralisation were drilled by St Joe's during their 1980s exploration drilling.
The 1930s National Socialist drillhole database was compiled by GreenX geologists, transcribed from hard copy, historical records. An independent audit and verification of the data against these records was not undertaken by MSA-UK. Given that the intention is to declare an Exploration Target, this is not considered a material risk by MSA-UK.
Data validation was undertaken during the import routine in the form of correcting issues such as from/to errors and preparing the data in a format that can readily be imported into three-dimensional modelling software.
Exploration target: Geological Modelling
A geological model was constructed in Leapfrog Geo. Although a number of mapped faults cross the area, only five, relevant fault structures were considered in the model (Figure 1). Four stratigraphic units, namely the Basement, Rotliegend, Zechstein and Buntsandstein were modelled. Due its narrowness and the lateral scale of the model, which spans several kilometres, the Kupferschiefer layer was modelled only as the contact between the Rotliegend and Zechstein. Displacement by faulting is data driven, where the relative position of the stratigraphic units on either side of the fault determines the vertical displacement (Figure 4).
A conceptual mineralisation model was constructed from the drillhole data using a threshold value of 0.30 % Cu. This value was based on the log-probability plot for the combined dataset (Figure 5), which shows a break in the grade population around this threshold. This is a reasonable value, as it incorporates mineralisation in the footwall Rotliegend, the Kupferschiefer and the hanging wall Zechstein.
In addition to the grade threshold, a minimum thickness of 1.5 m was applied during the modelling process, based on regulation and practise at copper mines in Poland Where necessary, low-grade samples falling below the threshold were incorporated into the mineralised zone to achieve the minimum thickness, provided the full composite grade satisfied the threshold value. Due to the sampling bias in the National Socialist dataset, only data generated from 1980s era drilling was used to constrain the thickness of the mineralisation model.
However, the National Socialist data was used to infer lateral continuity of the mineralisation. In order to not overstate tonnages, the mineralisation was truncated against the modelled faults, extrapolated no more than 500 metres beyond the data and limited within the Tannenberg license boundary. Furthermore, mined out areas where discounted from the mineralisation model.
Three areas were considered, a larger area to the southwest, Zone 3, where the model is informed by a combination of Archive and National Socialist data and two smaller areas across fault boundaries towards the northeast, Zone 1 and Zone 2, as shown in Figures 1 and 2.
Zone 3 has an areal extent of approximately 6 km by 3.5 km. The mineralisation thins out towards the southwest and northwest where drillholes tend to have low-grade copper intercepts that do not meet the minimum thickness criteria, therefore being excluded from the model. Towards the northeast, the mineralisation terminates against a northwest-southeast running fault. Zone 2 is located adjacent to Zone 3 on the northeast side of the bounding fault, with an extent of 3.1 km in the northwest to southeast direction and 2.8 km in the northeast direction. Zone 1 is narrow, bound by two parallel faults and has an areal extent of 1.8 km by 900 m. Both Zones 1 and 2 have been restricted in extent from known mined out areas to the north.
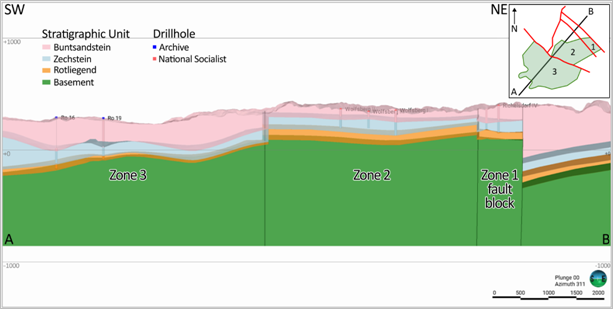
Figure 4: Pseudo 3D cross section of modelled stratigraphic units and zones of the Exploration Target estimate. Section (A-B) is also shown in Figure 1. Modified from MSA-UK.
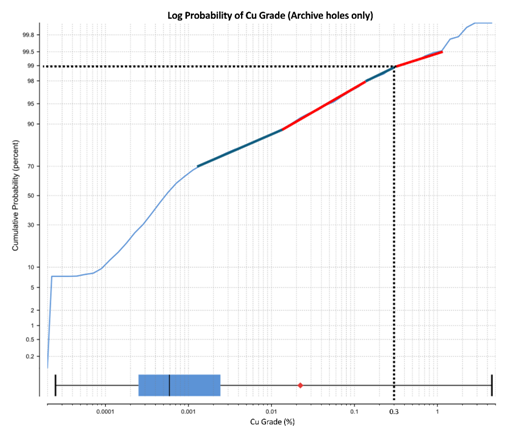
Figure 5: Log probability plot of the copper grades from Archive database. Modified from MSA-UK
Exploration target: GRADE AND THICKNESS ESTIMATION
As per the requirements for declaring an Exploration Target, grade and tonnages need to be expressed in ranges. The lateral extent of the mineralised zones is restricted by structural features and the license boundary, with little room for extrapolation. Therefore, tonnage ranges are given by assuming a variable thickness of the mineralised zones, which is supported by the dataset. Only the Archive data was used to derive grade and thickness ranges as it provides a complete vertical profile through the mineralised zone. Samples captured within the Zone 3 mineralised area were selected and composited to full thickness, resulting in ten composite samples. Full thickness composites were used to derive both grade and thickness ranges for the Exploration Target because this approach minimises the variability of the smaller sample intervals, thus reducing sampling bias and avoiding artificially inflated grades when estimating grade ranges. An additional drillhole, Ro 45, located to the north outside of the area of interest was also used to supplement the data. This hole was included as it is the only Archive drillhole outside of the modelled area that meets the minimum criteria and was incorporated to support the statistical analysis given the limited number of available data points. The remaining Archive holes were not considered as they fall outside the modelled extents of the mineralisation.
The list of drillholes, copper and silver grades and accumulated grades are shown in Table 2 below.
|
Table 2: List of full thickness composites for grade and thickness estimation |
|||||||
|
Hole ID |
From |
To |
Thickness (m) |
Cu (%) |
Ag (g/t) |
Accumulated Copper Grade Cu % per metre |
Accumulated Silver Grade Ag g/t per metre |
|
Ro 15 |
285.6 |
289.3 |
3.7 |
1.19 |
16.6 |
4.41 |
61.5 |
|
Ro 17 |
481.25 |
483 |
1.75 |
0.89 |
18.2 |
1.56 |
31.9 |
|
Ro 18 |
209 |
210.76 |
1.76 |
3.00 |
28.7 |
5.28 |
50.6 |
|
Ro 19 |
339 |
342 |
3 |
1.38 |
16.2 |
4.13 |
48.5 |
|
Ro 20 |
377 |
378.68 |
1.68 |
1.33 |
14.6 |
2.24 |
24.5 |
|
Ro 22 |
435.76 |
439.4 |
3.64 |
0.94 |
16.0 |
3.43 |
58.1 |
|
Ro 23 |
366 |
367.5 |
1.5 |
2.69 |
55.3 |
4.04 |
83.0 |
|
Ro 25 |
533.38 |
534.89 |
1.51 |
1.32 |
27.9 |
2.00 |
42.2 |
|
Ro 35 |
379.15 |
381 |
1.85 |
0.35 |
10.5 |
0.65 |
19.5 |
|
Ro 38 |
536.25 |
539.5 |
3.25 |
0.56 |
11.4 |
1.83 |
37.2 |
|
Ro 45 |
268.34 |
270.37 |
2.03 |
1.62 |
20.5 |
3.29 |
41.7 |
|
Source: MSA-UK |
|||||||
Statistics were derived for the length-weighted copper and silver grades and composite sample lengths as shown in Table 3.
|
Table 3: Summary statistics of mineralised drillhole composites |
|||||||
|
Variable |
Minimum |
Maximum |
Mean |
Median |
Lower Quartile |
Upper Quartile |
Coefficient of Variation |
|
Thickness (m) |
1.50 |
3.70 |
2.33 |
3.00 |
1.68 |
3.25 |
0.37 |
|
Cu grade (%) |
0.35 |
3.00 |
1.28 |
1.19 |
0.89 |
1.38 |
0.63 |
|
Ag grade (g/t) |
10.5 |
55.3 |
19.4 |
16.2 |
14.6 |
20.5 |
0.65 |
|
Source: MSA-UK |
|||||||
An attempt was made to derive grade and thickness ranges using a two-sided confidence interval method on the dataset however this statistical approach resulted in very narrow ranges which are not representative of the inherent variability of the data. Therefore, the interquartile range (IQR) was used instead to define the lower and upper grade and thickness ranges. In this case, the IQR is considered appropriate for this small dataset, as it provides a measure of dispersion around the median, thus reducing the influence of grade and thickness outliers. The resultant ranges are therefore a more realistic representation of the dataset (Table 4).
|
Table 4: Exploration Target lower and upper ranges for grade and thickness |
||
|
Variable |
Lower Range |
Upper Range |
|
Thickness (m) |
1.7 |
3.3 |
|
Cu (%) |
0.9 |
1.4 |
|
Ag (g/t) |
15 |
21 |
|
Source: MSA-UK Note: Grade and thickness ranges rounded to one decimal place to reflect this is an estimate |
||
Density data is not currently available for the project, therefore average densities were sourced from available literature (Taylor, R.D and Anderson, E.D., 2010). An assumption was made for a three metre thick mineable width with the Kupferschiefer shale representing 0.40 m of the total thickness, while the Zechstein and Rotliegend have assumed thicknesses of 1.30 m. Average densities were assigned as shown in Table 5.
|
Table 5: Assumed average densities per stratigraphic unit |
|||
|
Stratigraphic Unit |
Rock Type |
Thickness (m) |
Density (t/m3) |
|
Zechstein |
Limestone |
1.30 |
2.75 |
|
Kupferschiefer |
Shale |
0.40 |
2.40 |
|
Rotliegend |
Sandstone |
1.30 |
2.55 |
|
Source: Taylor, R.D and Anderson, E.D., 2010 |
|||
A weighted, average relative density for the three-metre-thick mineralised zone is calculated as 2.62 t/m3.
Exploration target: ESTIMATION
According to the JORC Code, an Exploration Target is "a statement or estimate of the exploration potential of a mineral deposit in a defined geological setting where the statement or estimate, quoted as a range of tonnes and a range of grade (or quality), relates to mineralisation for which there has been insufficient exploration to estimate a Mineral Resource". The code states that the terms "Resource" and "Reserves" must not be used in this context to refer to the potential quantity and grade of the target.
The base case for the mineralisation is based on the areal extent of copper mineralisation, above a threshold of 0.30 % Cu, that meets a minimum thickness criteria of 1.50 m. Surfaces created in Leapfrog Geo were used to model lateral continuity of the mineralised zones and derive areas for three zones. Thickness ranges were derived from the Archive data and using an assumed average density of 2.62 t/m3, lower and upper ranges of tonnages were calculated as shown in Table 6.
|
Table 6: Tonnage ranges for each zone |
||||||
|
Zone |
Area (m2) |
Thickness (m) |
Density (t/m3) |
Tonnage (Mt) |
||
|
Lower |
Upper |
Lower |
Upper |
|||
|
Zone 1 |
1,800,000 |
1.7 |
3.3 |
2.62 |
8 |
16 |
|
Zone 2 |
9,000,000 |
40 |
78 |
|||
|
Zone 3 |
21,500,000 |
96 |
186 |
|||
|
Total |
43,000,000 |
144 |
279 |
|||
|
Source: MSA-UK. Note: m2 = square metres; m = metres; t/m3 = tonnes per cubed metre; Mt = Million Tonnes Areas are rounded to the nearest 100,000 m2 to reflect this is an estimate Tonnages are rounded to the nearest 1,000,000 tonne to reflect this is an estimate Grade and thickness ranges rounded to one decimal place to reflect this is an estimate |
||||||
Full thickness composite grade data was used to derive grade ranges for copper, with the estimated contained copper ranges shown in Table 7.
|
Table 7: Copper grade and contained metal ranges for each Zone |
||||||
|
Zone |
Tonnage (Mt) |
Cu Grade (%) |
Contained Cu (Mt) |
|||
|
Lower |
Upper |
Lower |
Upper |
Lower |
Upper |
|
|
Zone 1 |
8 |
16 |
0.9 |
1.4 |
0.1 |
0.2 |
|
Zone 2 |
40 |
78 |
0.4 |
1.1 |
||
|
Zone 3 |
96 |
186 |
0.9 |
2.6 |
||
|
Total |
144 |
279 |
1.3 |
3.9 |
||
|
Source: MSA-UK Note: Mt = Million Tonnes. Tonnages are rounded to the nearest 1,000,000 tonne to reflect this is an estimate Grade and thickness ranges rounded to one decimal place to reflect this is an estimate |
||||||
Similarly, silver grade ranges were used to derive contained silver lower and upper scenarios for each zone as shown in Table 8.
|
Table 8: Silver grade and contained metal ranges for each Zone |
||||||
|
Zone |
Tonnage (Mt) |
Ag Grade (g/t) |
Contained Ag (Moz) |
|||
|
Lower |
Upper |
Lower |
Upper |
Lower |
Upper |
|
|
Zone 1 |
8 |
16 |
15 |
21 |
3.9 |
10.8 |
|
Zone 2 |
40 |
78 |
19.3 |
52.7 |
||
|
Zone 3 |
96 |
186 |
46.3 |
125.6 |
||
|
Total |
144 |
279 |
69.4 |
188.4 |
||
|
Source: MSA-UK Note: Mt = Million Tonnes; Moz - million troy ounces g/t - gram per metric tonne; Tonnages are rounded to the nearest 1,000,000 tonne to reflect this is an estimate Ounces are rounded to the nearest 100,000 troy ounce to reflect this is an estimate Grade and thickness ranges rounded to one decimal place to reflect this is an estimate 1 troy ounce (oz) = 31.1034768 grams |
||||||
The Exploration Target for the combined Tannenberg mineralisation is shown in Table 9. As per the JORC Code, it must be stated that the potential quantity and grade of the Exploration Targets are conceptual in nature, that there has been insufficient exploration to estimate Mineral Resources and that it is uncertain if further exploration will result in the estimation of Mineral Resources.
|
Table 9: Tannenberg Combined Exploration Target |
|||||||||
|
Tonnages (Mt) |
Cu (%) |
Ag (g/t) |
Contained Cu (Mt) |
Contained Ag (Moz) |
|||||
|
Lower |
Upper |
Lower |
Upper |
Lower |
Upper |
Lower |
Upper |
Lower |
Upper |
|
144 |
279 |
0.9 |
1.4 |
15 |
21 |
1.3 |
3.9 |
69.4 |
188.4 |
|
Source: MSA-UK. Note: Mt = Million Tonnes; Moz - million troy ounces; g/t - gram per metric tonne; Tonnages are rounded to the nearest 1,000,000 tonne to reflect this is an estimate Contained copper and silver ounces are rounded to the nearest 100,000 troy ounce to reflect this is an estimate Grade and thickness ranges rounded to one decimal place to reflect this is an estimate 1 troy ounce (oz) = 31.1034768 grams |
|||||||||
INCENTIVE SECURITIES
In order to incentivise management and align their interests with shareholders, the Company will issue incentive options which will only vest if the following project milestone at Tannenberg is achieved:
· Class C: the public announcement by GreenX of an independently assessed JORC Code inferred resource of at least 1,500,000 tonnes of contained copper equivalent at a minimum resource grade of 1% Cu Equivalent** (or equivalent, with a cut-off grade of 0.3% Cu equivalent).
|
Holder |
Class C |
|
Mr Benjamin Stoikovich (subject to shareholder approval) |
1,500,000 |
|
Mr Mark Pearce (subject to shareholder approval) |
600,000 |
|
Other key employees and consultants (to be issued under the Company's shareholder approved equity incentive plan) |
5,600,000 |
**Cu Equivalent means any combination of Cu, Ag, Ni, Co, Cr, Pt, Pd, Au, Rh, Ru, Ir, Os, Zn and/or Pb.
ENQUIRIES
|
Ben Stoikovich Chief Executive Officer |
Kazimierz Chojna Investor Relations - Poland
|
|
+44 207 478 3900 ir@greenxmetals.com |
Kim Eckhof Investor Relations - UK/Germany
|
Competent Persons Statement - EXPLORATION TARGET
The information in this announcement that relates to the Exploration Target is based on information compiled by Mr Rui Goncalves, a Competent Person who is registered with the South African Council of Natural Scientific Professions, a Recognised Professional Organisation' included in a list promulgated by ASX from time to time. Mr Goncalves is a full-time employee of MSA Mining Consulting UK Ltd, an independent consulting company. Mr Goncalves has sufficient experience that is relevant to the style of mineralisation and type of deposit under consideration and to the activity being undertaken, to qualify as a Competent Person as defined in the 2012 Edition of the 'Australasian Code for Reporting of Exploration Results, Mineral Resources and Ore Reserves'. Mr Goncalves consents to the inclusion in this announcement of the matters based on his information in the form and context in which it appears.
Competent Persons Statement - Historical Estimate
The information in this announcement that relates to the historical estimates were extracted from the ASX announcement dated 20 October 2025, titled 'GreenX Uncovers Historical Estimate at Tannenberg Copper Project' (original announcement) which is available to view at www.greenxmetals.com. GreenX confirms that (a) it is not in possession of any new information or data relating to the historical estimate that materially impacts on the reliability of the estimates or GreenX's to verify the historical estimates as mineral resources or ore reserves in accordance with the JORC Code; (b) that the supporting information provided in the original announcement referred to in ASX Listing Rule 5.12 continues to apply and has not materially changed; and (c) the form and context in which the Competent Person's findings are presented have not been materially modified from the original announcement.
Competent Persons Statement - EXploration results
The information in this announcement that relates to Exploration Results is based on information compiled by Dr Matthew Jackson, a Competent Person who is a Member of the Australasian Institute of Mining and Metallurgy. Dr Jackson is a Technical Consultant for GreenX and is a holder of unlisted options in the Company. Dr Jackson has sufficient experience that is relevant to the style of mineralisation and type of deposit under consideration and to the activity being undertaken, to qualify as a Competent Person as defined in the 2012 Edition of the 'Australasian Code for Reporting of Exploration Results, Mineral Resources and Ore Reserves'. Dr Jackson consents to the inclusion in this announcement of the matters based on his information in the form and context in which it appears.
Forward Looking Statements
This release may include forward-looking statements, which may be identified by words such as "expects", "anticipates", "believes", "projects", "plans", and similar expressions. These forward-looking statements are based on GreenX's expectations and beliefs concerning future events. Forward looking statements are necessarily subject to risks, uncertainties and other factors, many of which are outside the control of GreenX, which could cause actual results to differ materially from such statements. There can be no assurance that forward-looking statements will prove to be correct. GreenX makes no undertaking to subsequently update or revise the forward-looking statements made in this release, to reflect the circumstances or events after the date of that release.
The information contained within this announcement is deemed to constitute inside information as stipulated under the Regulation 2014/596/EU which is part of domestic law pursuant to the Market Abuse (Amendment) (EU Exit) Regulations (SI 2019/310) ("UK MAR"). By the publication of this announcement via a Regulatory Information Service, this inside information (as defined in UK MAR) is now considered to be in the public domain.
APPENDIX 1: EXPLORATION RESULTS AND JORC TABLES
Table 1: Historical drill hole information (1980's Drilling Campaign)
|
Hole ID |
Easting |
Northing |
Elevation (m MSL) |
Dip (°) |
Depth (m) |
|
Blankenheim |
3553456 |
5644396 |
311 |
90 |
485 |
|
Braach |
3548010 |
5651830 |
248 |
90 |
155 |
|
C/77 - B 10 |
3564020 |
5658490 |
236 |
90 |
49 |
|
DB 141.015-42 |
3549869 |
5658977 |
288 |
90 |
270 |
|
Herlefeld 1 |
3553100 |
5660760 |
360 |
90 |
150 |
|
Lengforst |
3577840 |
5654380 |
283 |
90 |
100 |
|
Lüdersdorf |
3551660 |
5647250 |
309 |
90 |
489 |
|
Mörshausen |
3543400 |
5663670 |
257 |
90 |
412 |
|
Obergude |
3549600 |
5659800 |
313 |
90 |
200 |
|
Quentel |
3545790 |
5674350 |
373 |
90 |
445 |
|
Rengshausen 1 |
3537330 |
5653060 |
321 |
90 |
402 |
|
Ro 15 |
3559420 |
5645330 |
271 |
90 |
351 |
|
Ro 16 |
3559450 |
5644800 |
289 |
90 |
461 |
|
Ro 17 |
3559630 |
5644380 |
304 |
90 |
551 |
|
Ro 19 |
3559925 |
5645500 |
283 |
90 |
361 |
|
Ro 21 |
3558900 |
5646050 |
227 |
90 |
211 |
|
Ro 22 |
3560000 |
5644650 |
273 |
90 |
460 |
|
Ro 23 |
3558500 |
5645524 |
300 |
90 |
380 |
|
Ro 24 |
3555775 |
5644750 |
207 |
90 |
443 |
|
Ro 25 |
3560400 |
5644825 |
322 |
90 |
553 |
|
Ro 26 |
3558075 |
5645850 |
270 |
90 |
400 |
|
Ro 27 |
3556775 |
5647675 |
217 |
90 |
432 |
|
Ro 28 |
3561525 |
5643475 |
351 |
90 |
770 |
|
Ro 29 |
3554400 |
5647350 |
215 |
90 |
459 |
|
Ro 31 |
3557500 |
5649450 |
214 |
90 |
159 |
|
Ro 32 |
3553025 |
5642025 |
195 |
90 |
504 |
|
Ro 33 |
3558300 |
5646425 |
207 |
90 |
249 |
|
Ro 34 |
3558000 |
5649925 |
223 |
90 |
207 |
|
Ro 35 |
3560500 |
5645550 |
349 |
90 |
397 |
|
Ro 36 |
3558050 |
5648600 |
314 |
90 |
320 |
|
Ro 37 |
3556175 |
5645950 |
274 |
90 |
530 |
|
Ro 38 |
3562450 |
5645725 |
251 |
90 |
559 |
|
Ro 39 |
3568575 |
5655350 |
317 |
90 |
196 |
|
Ro 40 |
3550525 |
5660550 |
418 |
90 |
359 |
|
Ro 41 |
3557800 |
5645475 |
418 |
90 |
422 |
|
Ro 42 |
3559000 |
5645182 |
248 |
90 |
307 |
|
Ro 43 |
3555175 |
5642725 |
216 |
90 |
492 |
|
Ro 44 |
3549500 |
5650950 |
287 |
90 |
257 |
|
Ro 45 |
3567375 |
5655175 |
413 |
90 |
289 |
|
Ro 46 |
3568650 |
5656600 |
371 |
90 |
228 |
|
Ro 49 |
3552810 |
5639850 |
291 |
90 |
553 |
|
Schemmern 1 |
3557050 |
5665190 |
300 |
90 |
120 |
|
Sontra 1 |
3566470 |
5658290 |
291 |
90 |
15 |
|
Sterkelshausen |
3543600 |
5652800 |
310 |
90 |
272 |
|
Weidenhausen 1 |
3567580 |
5675220 |
263 |
90 |
159 |
|
Weidenhausen 3 |
3568640 |
5676040 |
181 |
90 |
97 |
Note: Coordinates are DHDN / 3-degree Gauss-Kruger zone 3.
Table 2: Archive drill hole assays (2025 Logging and Resampling Program)
|
Hole ID |
Intersect (m) |
Cu (%) |
Ag (g/t) |
||
|
From |
To |
Interval |
|||
|
Ro 15 |
285.6 |
286.24 |
0.64 |
0.44 |
6 |
|
Ro 15 |
286.24 |
287 |
0.76 |
0.71 |
11 |
|
Ro 15 |
287 |
287.56 |
0.56 |
0.73 |
10 |
|
Ro 15 |
288.2 |
288.76 |
0.56 |
3.09 |
39 |
|
Ro 15 |
288.76 |
289.3 |
0.54 |
2.39 |
37 |
|
Ro 17 |
481.25 |
481.6 |
0.35 |
0.32 |
5 |
|
Ro 17 |
481.6 |
481.96 |
0.36 |
1.43 |
17 |
|
Ro 17 |
481.96 |
482.3 |
0.34 |
1.54 |
31 |
|
Ro 17 |
482.3 |
482.55 |
0.25 |
1.60 |
52 |
|
Ro 19 |
339 |
339.5 |
0.5 |
2.00 |
26 |
|
Ro 19 |
339.5 |
340.5 |
1 |
1.58 |
19 |
|
Ro 19 |
340.5 |
341.5 |
1 |
1.36 |
15 |
|
Ro 19 |
341.5 |
342 |
0.5 |
0.38 |
3 |
|
Ro 21 |
199 |
199.25 |
0.25 |
1.10 |
13 |
|
Ro 21 |
202 |
202.5 |
0.5 |
0.33 |
3 |
|
Ro 22 |
435.76 |
436.26 |
0.5 |
0.54 |
8 |
|
Ro 22 |
436.26 |
436.76 |
0.5 |
0.55 |
1 |
|
Ro 22 |
436.76 |
437.26 |
0.5 |
0.73 |
16 |
|
Ro 22 |
437.26 |
437.76 |
0.5 |
0.57 |
9 |
|
Ro 22 |
437.76 |
438.26 |
0.5 |
0.92 |
15 |
|
Ro 22 |
438.26 |
438.63 |
0.37 |
0.30 |
3 |
|
Ro 22 |
438.63 |
438.95 |
0.32 |
4.53 |
89 |
|
Ro 22 |
438.95 |
439.4 |
0.45 |
0.47 |
9 |
|
Ro 23 |
366 |
366.5 |
0.5 |
0.85 |
17 |
|
Ro 23 |
366.5 |
367 |
0.5 |
2.83 |
75 |
|
Ro 23 |
367 |
367.5 |
0.5 |
4.40 |
74 |
|
Ro 23 |
367.5 |
268.5 |
1 |
0.27 |
4 |
|
Ro 25 |
533.38 |
533.89 |
0.51 |
3.15 |
66 |
|
Ro 25 |
533.89 |
534.39 |
0.5 |
0.73 |
15 |
|
Ro 26 |
388.47 |
388.75 |
0.28 |
0.24 |
21 |
|
Ro 26 |
388.75 |
389 |
0.25 |
0.67 |
16 |
|
Ro 32 |
486.6 |
487 |
0.4 |
0.38 |
6 |
|
Ro 33 |
242.7 |
243.08 |
0.38 |
1.27 |
39 |
|
Ro 35 |
379.15 |
379.5 |
0.35 |
0.63 |
18 |
|
Ro 35 |
379.5 |
380 |
0.5 |
0.33 |
10 |
|
Ro 35 |
380 |
380.5 |
0.5 |
0.31 |
10 |
|
Ro 38 |
536.25 |
536.66 |
0.41 |
0.91 |
15 |
|
Ro 38 |
536.66 |
537 |
0.34 |
1.70 |
35 |
|
Ro 38 |
537 |
537.5 |
0.5 |
0.34 |
7 |
|
Ro 38 |
537.5 |
538 |
0.5 |
0.30 |
8 |
|
Ro 38 |
538.35 |
538.7 |
0.35 |
0.30 |
6 |
|
Ro 38 |
538.7 |
539 |
0.3 |
0.39 |
7 |
|
Ro 38 |
539 |
539.5 |
0.5 |
0.48 |
10 |
|
Ro 41 |
414 |
414.53 |
0.53 |
0.83 |
20 |
|
Ro 41 |
414.53 |
414.85 |
0.32 |
0.30 |
3 |
|
Ro 45 |
268.34 |
269 |
0.66 |
2.10 |
33 |
|
Ro 45 |
269 |
269.63 |
0.63 |
1.53 |
21 |
|
Ro 45 |
269.63 |
270 |
0.37 |
1.48 |
10 |
|
Ro 45 |
270 |
270.37 |
0.37 |
1.06 |
8 |
Note: Only assay results equal to or greater than 0.3% copper are included in this table.
JORC Code, 2012 Edition - Table 1 Report
Section 1 Sampling Techniques and Data
(Criteria in this section apply to all succeeding sections.)
|
Criteria |
JORC Code explanation |
Commentary |
|
Sampling techniques |
· Nature and quality of sampling (e.g. cut channels, random chips, or specific specialised industry standard measurement tools appropriate to the minerals under investigation, such as down hole gamma sondes, or handheld XRF instruments, etc). These examples should not be taken as limiting the broad meaning of sampling. · Include reference to measures taken to ensure sample representivity and the appropriate calibration of any measurement tools or systems used. · Aspects of the determination of mineralisation that are Material to the Public Report. · In cases where 'industry standard' work has been done this would be relatively simple (e.g. 'reverse circulation drilling was used to obtain 1 m samples from which 3 kg was pulverised to produce a 30 g charge for fire assay'). In other cases more explanation may be required, such as where there is coarse gold that has inherent sampling problems. Unusual commodities or mineralisation types (e.g. submarine nodules) may warrant disclosure of detailed information. |
1980's Drilling Campaign · All 1980's analyses reported in this announcement were from diamond drill core. The core for the holes was 47 mm diameter in all cases, except Ro 17 and Ro 15 where core was 60 mm in diameter. Due to the historical nature of the drilling results reported herein, it is not possible to comment on the quality of the drilling used to produce the results described. · Sampling of ¼ core was conducted during multiple exploration phases between 1980 and 1987 within the licence area by St Joe. · The 1980's information was collated from original hard copy reports from that era and a State Survey Database. Assays, geological logging and gamma ray logs were conducted by St Joe Explorations and Mansfeld AG. No other information is available for the exploration drilling. · No details covering the representivity of the samples for 1980's assays were reported by the authors. 2025 Logging and Resampling Program · The core used for the program had been sampled to varying degrees during the 40 years in storage. Sampling restrictions were placed on the program by the owners. As such, two sampling protocols were used: ¼ core sampling and sliver sampling. · Where ¼ core sampling was employed, the program used industry standard methods to take 25% of the core which was originally extracted from the hole. · Sliver sampling was employed where only 25% of the core was available in order to leave core in the box to maintain the archive correctly. In this case 20% of the remaining 25% was sampled using a specialist saw. Where this resulted in low sample mass, the interval lengths were increased in order to maintain suitable representivity. · For the intervals from most holes (Ro 38, Ro 17, Ro 25 and Ro 45), ¼ core was sampled for the majority of the samples and sliver sampling for the remaining narrow intervals. · For the hole Ro 23, 79% of the sampling was conducted using the sliver method and the remaining using ¼ core. · For the intervals from Ro 15 only sliver sampling was used. · A handheld XRF was used to assist with confirming the representivity of the sliver sampling and determining sample. · Due to the extremely fine-grained mineralisation and matrix of Kupferschiefer Mineralisation (e.g. Rahfeld, 2018), the heterogeneity of the sampled materials is known to be extremely low. By comparison with other deposits, fundamental sampling error (FSE) is likely to be between 2-5% coefficient of variation (Absalov, 2011). This means that the introduction of error from sub-sampling of the core and samples will be negligible and very low sample sizes are suitable for assessing grade. · In order to further validate the low FSE, in the sliver samples. pXRF measurements were made at spacings of 5-10cm where sliver samples were taken. The results of the pXRF measurements confirmed that a very low error was found and that the use of sliver samples is suitable for assessing grade. · A handheld XRF was used only for validation of sliver samples and assisting with selection of sample intervals. The Olympus Vanta (V2MR) configured with the GeoChem(3) calibration. A reading time of 40 seconds was used. A blank standard or CRM was analysed daily before the start of work. Procedures were in place to ensure correct operation. · Sampling ¼ core followed industry standard procedures. The same side of the core was sampled throughout each hole. The samples were cut using an automated saw designed for core cutting in order to eliminate any sample loss. · The use of sliver sampling is uncommon in many deposits, although known to be used in some sedimentary hosted copper deposits similar to the Kupferschiefer. Due to the extremely fine-grained mineralisation and matrix of Kupferschiefer Mineralisation (e.g. Rahfeld, 2018), the heterogeneity of the sampled materials is known to be extremely low. By comparison with other deposits, FSE is likely to be between 2-5% coefficient of variation (Absalov, 2011). This means that the introduction of error from sub-sampling of the core and samples will be negligible and very low sample sizes are suitable. |
|
Drilling techniques |
· Drill type (e.g. core, reverse circulation, open-hole hammer, rotary air blast, auger, Bangka, sonic, etc) and details (e.g. core diameter, triple or standard tube, depth of diamond tails, face-sampling bit or other type, whether core is oriented and if so, by what method, etc). |
1980's Drilling Campaign The samples were all taken from core and the core for the holes was 47 mm diameter in all cases, except Ro 17 and Ro 15 where core was 60 mm in diameter. No other details of the drilling are available. |
|
Drill sample recovery |
· Method of recording and assessing core and chip sample recoveries and results assessed. · Measures taken to maximise sample recovery and ensure representative nature of the samples. · Whether a relationship exists between sample recovery and grade and whether sample bias may have occurred due to preferential loss/gain of fine/coarse material. |
· Core recoveries were in most cases 100%. In the cases of two holes, recovery in the mineralised zone dropped to below 90% (75 and 86%). · The recoveries reported here are measured from the core available for sampling in 2025. · It is believed that low core recoveries in some cases may have been caused by researchers removing small sections of the core that contained elevated copper. For that reason, a core recovery limit of 90% was used to select which holes to report. · Due to the same possibility of past researchers removing copper enriched parts, it is possible that the intervals announced here may under-report copper. The addition of the 90% core recovery selection criteria has limited that effect. |
|
Logging |
· Whether core and chip samples have been geologically and geotechnically logged to a level of detail to support appropriate Mineral Resource estimation, mining studies and metallurgical studies. · Whether logging is qualitative or quantitative in nature. Core (or costean, channel, etc) photography. · The total length and percentage of the relevant intersections logged. |
· Geological and geotechnical logging has been completed according to industry best practice and would be suitable to support Mineral Resource Estimation. Note that JORC Mineral Resources not reported in this announcement. · Geological and geotechnical logging is qualitative. Wet and dry core photos have been taken. 1980's Drilling Campaign · The entire hole was logged, the target zone is typically 2 m thick. 2025 Logging and Resampling Program · All available core was logged. The amount of available core always included the mineralised T1 stratigraphic horizon and was a minimum of 10m above and below that unit. In most cases at least 90m of core was logged and some cases the entire hole. |
|
Sub-sampling techniques and sample preparation |
· If core, whether cut or sawn and whether quarter, half or all core taken. · If non-core, whether riffled, tube sampled, rotary split, etc and whether sampled wet or dry. · For all sample types, the nature, quality and appropriateness of the sample preparation technique. · Quality control procedures adopted for all sub-sampling stages to maximise representivity of samples. · Measures taken to ensure that the sampling is representative of the in situ material collected, including for instance results for field duplicate/second-half sampling. · Whether sample sizes are appropriate to the grain size of the material being sampled. |
1980's Drilling Campaign · Samples were sawn using ¼ core. · Sample preparation techniques unknown. · QAQC procedures are unknown. · Sample representativity measures are unknown. · Sample size collection likely to have been quarte-core based on remaining drill cores. 2025 Logging and Resampling Program · Where ¼ core was sampled, industry standard sampling methods were used. · Where sliver samples were taken, a small rock saw was used to take 20% of the ¼ core that was available. · In all cases the same side of the core was sampled from top to bottom. · Industry standard and accredited techniques were used in all cases. Samples were weighed, then crushed in a jaw crusher to 75% passing 2 mm. The crushed sample was then split using a rotary splitter to 250 g. The sub sample was then pulverised to 85% passing a 75 µm. · All procedures were accredited to ISO/IEC 17025 standard. · Screen tests were performed and reported for both crushing and pulverising stages. The results showed that comminution met and exceeded the standards above. · Industry standard quality control methods were used. GRX used coarse and pulp duplicates were inserted at a frequency of 1/50 each. Field duplicates were not used due to restrictions on the proportion of core available for sampling. · The maximum error between crush duplicates was found to be 2.0% and 0% for Cu and Ag respectively, which supports the view the FSE is low and that sliver sampling was representative of the mineralisation. · For the ¼ core samples masses were between 0.19 kg and 7.89 kg. This is appropriate. · For the sliver samples, masses were between 0.1 kg and 0.84 Kg. This is appropriate given the low FSE, validation by pXRF and low error seen in coarse duplicates.
|
|
Quality of assay data and laboratory tests |
· The nature, quality and appropriateness of the assaying and laboratory procedures used and whether the technique is considered partial or total. · For geophysical tools, spectrometers, handheld XRF instruments, etc, the parameters used in determining the analysis including instrument make and model, reading times, calibrations factors applied and their derivation, etc. · Nature of quality control procedures adopted (e.g. standards, blanks, duplicates, external laboratory checks) and whether acceptable levels of accuracy (i.e. lack of bias) and precision have been established. |
1980's Drilling Campaign · Geochemical analysis was carried out by Robertson Research Ltd, Wales, however the precise nature quality and appropriateness of the assaying is unknown. The precise nature quality and appropriateness of the assaying is unknown. 2025 Logging and Resampling Program · Industry standard and accredited procedures were used. All samples were analysed using a four-acid digestion with an Inductively Coupled Plasma - Atomic Emission Spectroscopy (ICP-AES) finish. Where analyses were found to be above detection limits, an Atomic Absorption Spectroscopy (AAS) finish was used. · All procedures were accredited to ISO/IEC 17025 standard. · A handheld XRF was used only for validation of sliver samples and assisting with selection of sample intervals. The Olympus Vanta (V2MR) configured with the GeoChem(3) calibration. A reading time of 40s was used. A blank standard or CRM was analysed daily before the start of work. Procedures were in place to ensure correct operation. · Quality Control samples were added at a rate of 10%. For every 100 samples, 4 Certified Reference Materials were used, two Pulp duplicates, two crush duplicate and two blanks were inserted. · Certified reference materials were matrix matched where possible and included ore and cut-off grade materials for copper and silver. |
|
Verification of sampling and assaying |
· The verification of significant intersections by either independent or alternative company personnel. · The use of twinned holes. · Documentation of primary data, data entry procedures, data verification, data storage (physical and electronic) protocols. · Discuss any adjustment to assay data. |
1980's Drilling Campaign · The 1980's drilling significant intersections were verified using the 2025 logging and sampling program. 2025 Logging and Resampling Program · No verification completed. · No twinned holes reported. · 10% Electronic data records were verified against paper records, focussing on ore grades. · No adjustments made. |
|
Location of data points |
· Accuracy and quality of surveys used to locate drill holes (collar and down-hole surveys), trenches, mine workings and other locations used in Mineral Resource estimation. · Specification of the grid system used. · Quality and adequacy of topographic control. |
· Location accuracy is unknown. The location of holes drilled by St Joe Explorations comes from collar tables in historical reports. All other collar locations come from State/Federal databases. · Latitude and Longitude in degree, minutes and seconds were provided by St Joe Explorations. · Unknown |
|
Data spacing and distribution |
· Data spacing for reporting of Exploration Results. · Whether the data spacing and distribution is sufficient to establish the degree of geological and grade continuity appropriate for the Mineral Resource and Ore Reserve estimation procedure(s) and classifications applied. · Whether sample compositing has been applied. |
· Between 400 m to 700 m · Mineral Resources are not being reported. · Sample compositing was not undertaken. |
|
Orientation of data in relation to geological structure |
· Whether the orientation of sampling achieves unbiased sampling of possible structures and the extent to which this is known, considering the deposit type. · If the relationship between the drilling orientation and the orientation of key mineralised structures is considered to have introduced a sampling bias, this should be assessed and reported if material. |
· The target Kupferschiefer layer is flat to slightly dipping, vertical drilling therefore intercepts at right angles and is appropriate. · No sampling bias introduced by intersection angles. |
|
Sample security |
· The measures taken to ensure sample security. |
1980's Drilling Campaign · Methods not known. · Drill cores have been stored in a safe location in Germany. 2025 Logging and Resampling Program · Full chain of custody tracking was completed for all transportation of core and samples |
|
Audits or reviews |
· The results of any audits or reviews of sampling techniques and data. |
· No audits completed |
Section 2 Reporting of Exploration Results
(Criteria in the preceding section also apply to this section.)
|
Criteria |
JORC Code explanation |
Commentary |
|
Mineral tenement and land tenure status |
· Type, reference name/number, location and ownership including agreements or material issues with third parties such as joint ventures, partnerships, overriding royalties, native title interests, historical sites, wilderness or national park and environmental settings. · The security of the tenure held at the time of reporting along with any known impediments to obtaining a licence to operate in the area. |
· The Tannenberg 1 licence is held 100% by Group 11 Exploration GmbH (Group 11) a subsidiary of GreenX. The licences were awarded on the 6 June 2025 for a period of three years to 6 June 2028. The licence is free from overriding royalties and native titles interests. There are historical mine workings within the licence area, but no known historical sites of cultural significance outside of mining. · The Tannenberg 2 exploration licence is also held 100% by Group 11. The licence was granted effective 22 April 2025 and is valid for three years also until 6 June 2028. · Within and surrounding both licence areas, there are environmental protections zones with differing levels of protections. There are small areas identified as Natura 2000 Fauna Flora Habitat Areas and Bird Sanctuaries. Other environmental protection designated areas include Nature Reserves, National Natural Monuments, Landscape Protection Area, and Natural Parks. Based on due diligence and discussions with various stakeholders and consultants, the presence of environmental protection areas does not preclude exploration or eventual mining if conducted in accordance with applicable standards and regulations. · The landform across the license area comprises mostly of farmland, forested areas, and small towns and villages. · The licences are in good standing. |
|
Exploration done by other parties |
· Acknowledgment and appraisal of exploration by other parties. |
· Exploration in the 1930's was carried out by Mansfeld AG and resulted in 95 drill holes which were used to establish 3 mines in the area, with recommendations for the opening of a further 2 which never materialised. · Exploration was carried out by St Joe Explorations (in JV with the Broken Hill Pty Co Ltd later BHP-Utah) between 1980 and 1987. Two projects were undertaken. The Richelsdorf project within the licence area as well as the Spessart-Rhoen project 85 km to the south. Hole IDs starting with 'Ro' were drilled by St Joe Explorations. · Historical mining took place within the licence area. Mining activities ceased in the 1950's. |
|
Geology |
· Deposit type, geological setting and style of mineralisation. |
· Mineralisation is of the classic Kupferschiefer type (copper slate) within the Permian Zechstein Basin of Germany and Poland. · The Zechstein Basin is hosted within the Southern Permian Basin (SPB) of Europe. The SPB is an intracontinental basin that developed on the northern foreland of the Variscan Orogen. · Very high-grade copper mineralisation is generally associated with the Kupferschiefer shale unit. However, minable copper mineralisation also occurs in the footwall sandstone and hanging wall limestone units in Poland. Mineralisation can be offset from the shale by up to 30 m above and 60 m below. |
|
Drill hole Information |
· A summary of all information material to the understanding of the exploration results including a tabulation of the following information for all Material drill holes: o easting and northing of the drill hole collar o elevation or RL (Reduced Level - elevation above sea level in metres) of the drill hole collar o dip and azimuth of the hole o down hole length and interception depth o hole length. · If the exclusion of this information is justified on the basis that the information is not Material and this exclusion does not detract from the understanding of the report, the Competent Person should clearly explain why this is the case. |
· All drill hole collar information has been provided in Table 1 and 2 of Appendix 1.
|
|
Data aggregation methods |
· In reporting Exploration Results, weighting averaging techniques, maximum and/or minimum grade truncations (e.g. cutting of high grades) and cut-off grades are usually Material and should be stated. · Where aggregate intercepts incorporate short lengths of high grade results and longer lengths of low grade results, the procedure used for such aggregation should be stated and some typical examples of such aggregations should be shown in detail. · The assumptions used for any reporting of metal equivalent values should be clearly stated. |
· Mineralised samples above a threshold of 0.30% Cu where selected to define a mineralised zone. · Samples were composited to full thickness, length weighted composites derived from individual assay intervals. · Not top cuts or grade caps were applied to the dataset. · No metal equivalents reported. |
|
Relationship between mineralisation widths and intercept lengths |
· These relationships are particularly important in the reporting of Exploration Results. · If the geometry of the mineralisation with respect to the drill hole angle is known, its nature should be reported. · If it is not known and only the down hole lengths are reported, there should be a clear statement to this effect (e.g. 'down hole length, true width not known'). |
· Drilling was perpendicular to mineralisation and therefore intercept thicknesses are the same as mineralisation thicknesses. |
|
Diagrams |
· Appropriate maps and sections (with scales) and tabulations of intercepts should be included for any significant discovery being reported These should include, but not be limited to a plan view of drill hole collar locations and appropriate sectional views. |
· Relevant maps and sections are included at Figures 1, 2, 3, and 4. Also refer to maps included in announcements dated 2 August 2024 and 28 April 2025, 11 September 2025 and 20 November 2025. |
|
Balanced reporting |
· Where comprehensive reporting of all Exploration Results is not practicable, representative reporting of both low and high grades and/or widths should be practiced to avoid misleading reporting of Exploration Results. |
· All data was considered when defining mineralisation and geological continuity. · Drillholes with grade intercepts below a modelling threshold of 0.30% Cu where not considered when calculating grade and thickness ranges. · A minimum thickness of 1.50 m was imposed when defining the mineralised zone. Sub-threshold intervals were incorporated only where the overall composite grade remained above 0.30% Cu and the minimum thickness had not yet been achieved. · When defining grade ranges, one drillhole outside of the Exploration Target was considered. The remaining holes did not meet the minimum threshold and thickness criteria. |
|
Other substantive exploration data |
· Other exploration data, if meaningful and material, should be reported including (but not limited to): geological observations; geophysical survey results; geochemical survey results; bulk samples - size and method of treatment; metallurgical test results; bulk density, groundwater, geotechnical and rock characteristics; potential deleterious or contaminating substances. |
· All substantive results are reported. Geological logs and downhole gamma logs are not reported here. |
|
Further work |
· The nature and scale of planned further work (e.g. tests for lateral extensions or depth extensions or large-scale step-out drilling). · Diagrams clearly highlighting the areas of possible extensions, including the main geological interpretations and future drilling areas, provided this information is not commercially sensitive. |
· Historical mine access and underground work planned for H2 2026 to support scoping-level metallurgical test work, chip sampling, mapping and 3D model refinement. · Ongoing collation and digitisation of historical geological maps, mine development and production data from hard copies. · If appropriate, undertake a seismic survey to assist with future drilling campaigns (commencement H2 2026). · Commencement of initial drilling campaign (late 2026). |
RNS may use your IP address to confirm compliance with the terms and conditions, to analyse how you engage with the information contained in this communication, and to share such analysis on an anonymised basis with others as part of our commercial services. For further information about how RNS and the London Stock Exchange use the personal data you provide us, please see our Privacy Policy.

Latest directors dealings
- 10 hours ago Mortgage Advice Bureau (Holdings)
- 10 hours ago Close Brothers Group
- 11 hours ago Galliford Try
- 11 hours ago Eagle Eye Solutions Group
- 11 hours ago Volution Group