
September 2026 Quarterly Activities Report
Summary by AI BETAClose X


Greatland Resources Limited
E: info@greatland.com.au
NEWS RELEASE | 26 October 2026
September 2026 Quarterly Activities Report
THIS ANNOUNCEMENT CONTAINS INSIDE INFORMATION AS STIPULATED UNDER THE UK MARKET ABUSE REGULATIONS. ON PUBLICATION OF THIS ANNOUNCEMENT VIA A REGULATORY INFORMATION SERVICE, THIS INFORMATION IS CONSIDERED TO BE IN THE PUBLIC DOMAIN.
Strong start to FY27 operations; Havieron development underway
Quarterly production of 70,131 ounces of gold at AISC of $2,925/oz
Highlights
Operations
- September quarter production of 70,131oz Au and 2,927t Cu at an AISC of $2,925/oz Au.
- On track for FY27 full year production guidance of 260,000 – 300,000oz Au at an AISC of $2,900 – $3,330/oz Au.
- Strong processing throughput and successful completion of the planned 15-day maintenance shutdown underpinned a solid operational performance during the quarter. Record open pit material movements and ore mined were achieved, while gold recoveries remained high at 85.1%.
- Zero lost time injuries occurred during the quarter, resulting in a 12-month moving average Lost Time Injury Frequency Rate (LTIFR) of 0.2. The overall safety statistics have continued to improve, and Total Recordable Injury Frequency Rate (TRIFR) is 3.7.
Financial & Corporate
- Sales of 71,901oz Au and 2,714t Cu at weighted average realised prices of $5,980/oz gold and $16,653/t copper, generating net revenue of $485 million for the quarter.
- Cash flow from operations of $289 million and cash build of $25 million for the quarter, after $100 million of tax instalments, comprising the June 2026 quarterly tax instalment and the July and August 2026 monthly tax instalments (effectively five months of tax instalments), and increased Havieron growth capital. This delivered a debt free, closing cash balance of $1,314 million at 30 September 2026 ($1,289 million at 30 June 2026).
- Full upside exposure to the gold price with partial downside protection provided from gold put options at a strike price of $4,200/oz (CY26), $5,000/oz (Q1 CY27), $5,200/oz (Q2 CY27) and $5,000/oz (Q3 CY27).
Growth and drilling
- $37.2 million in Telfer growth capex invested across tailings storage expansion, open pit fleet renewal, open pit pre-stripping and underground development during the quarter.
- $45.2 million in Havieron development capex with project commencement during September 2026 following the receipt of all secondary approvals required to commence construction.
- The Telfer geology team completed a total of 51km of growth and 22km of conversion drilling for the quarter, with six underground, three reverse circulation and three surface diamond drill rigs in operation. An additional surface diamond drill rig has been approved for the Pinnacles Prospect to continue testing of the highly prospective extension to the West Dome geological structure and stratigraphy.
Greatland Managing Director, Shaun Day, commented:
“We are pleased to have started the 2027 financial year with a well-executed operational performance and good cost control in the first quarter, which included successful completion of the year’s major planned maintenance of the process plant.
“During the quarter, we achieved excellent process plant throughput, improved open pit productivity, increased underground ore output and record copper recoveries which culminated in both gold production and AISC performing better than plan.
“Greatland completed the quarter with a closing cash balance of $1,314 million and no drawn debt. An increase in cash build was achieved, notwithstanding significant investment in Telfer and Havieron growth capex, the ongoing surge in exploration and elevated tax payments. This balance sheet strength provides a robust platform to deliver our organic growth objectives through the development of Havieron and ongoing investment to grow and extend Telfer.
“We are particularly pleased to have commenced the construction stage of our world-class Havieron project, while continuing to make good progress at Telfer’s high-grade West Dome Underground. The investments we make in FY27 will lay the foundations for a period of sustained production growth towards a higher-quality, longer-life gold-copper production centre at an integrated Telfer-Haverion.”
Conference Call
Greatland will present the Quarterly Activities Report via a webcast for shareholders, research analysts, media and other interested stakeholders on Monday, 26 October 2026 at 7:30am AWST / 10:30am AEDT (11:30pm GMT on Sunday, 25 October 2026), followed by a Q&A session. To listen in live, please click on this link and register your details: https://webcast.openbriefing.com/ggp-qtr1-2027/
It is recommended to log on at least five minutes before the scheduled commencement time to ensure you are registered in time for the start of the call. A recording of the call will be available on the same link after the conclusion of the webcast.
Overview
Greatland Resources Limited (Greatland) is pleased to report operating (unaudited) results for the 3-month period from 1 July 2026 to 30 September 2026 (September quarter).
Greatland produced 70,131oz Au and 2,927t Cu at an AISC of $2,925/oz Au in the September quarter, with both metrics better than plan primarily due to strong processing throughput.
Greatland remains on track for FY27 full year production guidance of 260,000 – 300,000oz Au at an AISC of $2,900 – $3,330/oz Au.
As previously outlined, production is anticipated to be modestly second half weighted due to open pit scheduling, and the successfully completed major planned 15-day process plant maintenance shut in the September quarter.
Table 1: September quarter, with prior quarter results for comparison
Operations |
|
Unit |
Sep Q 2026 |
Jun Q |
Mar Q 2026 |
Dec Q 2025 |
Sep Q 2025 |
Mill production | |||||||
Ore milled |
|
kt |
4,888 |
5,186 |
4,815 |
4,513 |
4,680 |
Mill head grade |
Au |
g/t Au |
0.50 |
0.53 |
0.59 |
0.65 |
0.58 |
Cu |
% Cu |
0.07% |
0.08% |
0.10% |
0.10% |
0.09% | |
Recovery |
Au |
% |
85.1% |
86.8% |
88.4% |
88.4% |
88.6% |
Cu |
% |
82.5% |
81.5% |
82.6% |
78.7% |
81.3% | |
Metal produced 1 |
Au |
oz |
70,131 |
79,100 |
82,723 |
86,273 |
80,890 |
Cu |
t |
2,927 |
3,573 |
4,128 |
3,528 |
3,366 | |
Sales | |||||||
Sales 2 |
Au |
oz |
71,901 |
74,648 |
97,800 |
72,212 |
82,199 |
Cu |
t |
2,714 |
3,531 |
4,620 |
3,301 |
3,277 | |
Ag |
oz |
27,937 |
43,068 |
50,957 |
42,235 |
46,534 | |
Average price received 2, 3 |
Au |
A$/oz |
5,980 |
6,468 |
6,773 |
6,301 |
5,277 |
Cu |
A$/t |
16,653 |
16,107 |
15,803 |
14,652 |
12,552 | |
Ag |
A$/oz |
77 |
116 |
98 |
69 |
64 | |
Net revenue 2, 3 |
Au |
A$m |
430 |
483 |
662 |
452 |
431 |
Cu |
A$m |
45 |
57 |
74 |
48 |
41 | |
Ag |
A$m |
2 |
5 |
5 |
3 |
3 | |
Total |
A$m |
485 |
545 |
742 |
507 |
476 | |
Open pit mining | |||||||
Total material mined |
kt |
7,859 |
7,005 |
6,761 |
6,571 |
5,915 | |
Ore mined |
kt |
4,045 |
3,528 |
3,630 |
2,363 |
1,789 | |
Mined grade |
Au |
g/t Au |
0.45 |
0.44 |
0.49 |
0.58 |
0.60 |
Cu |
% Cu |
0.04% |
0.05% |
0.07% |
0.06% |
0.07% | |
Contained metal |
Au |
oz |
57,924 |
50,401 |
57,196 |
43,712 |
34,303 |
Cu |
t |
1,416 |
1,789 |
1,833 |
1,518 |
1,174 | |
Ore mined (dump leach) |
kt |
172 |
112 |
167 |
411 |
274 | |
Underground mining | |||||||
Ore mined |
kt |
378 |
318 |
315 |
243 |
283 | |
Mined grade |
Au |
g/t Au |
1.33 |
1.74 |
2.08 |
1.65 |
1.89 |
Cu |
% Cu |
0.32% |
0.49% |
0.80% |
0.64% |
0.58% | |
Contained metal |
Au |
oz |
16,165 |
17,945 |
18,815 |
12,912 |
17,138 |
Cu |
t |
1,215 |
1,569 |
2,521 |
1,565 |
1,648 | |
Costs | |||||||
Mining |
A$m |
88.1 |
90.7 |
82.2 |
77.3 |
65.4 | |
Processing |
A$m |
89.5 |
71.4 |
81.5 |
92.4 |
80.0 | |
Site services |
A$m |
23.8 |
26.1 |
19.2 |
25.1 |
29.1 | |
TC/RC and freight |
A$m |
0.0 |
2.0 |
(0.1) |
2.4 |
6.2 | |
Royalties |
A$m |
14.7 |
16.6 |
24.4 |
17.6 |
14.8 | |
Sustaining capex 4 |
A$m |
36.5 |
32.3 |
28.7 |
25.1 |
17.9 | |
Rehabilitation |
A$m |
3.4 |
1.4 |
0.1 |
1.3 |
3.2 | |
By-product credits |
A$m |
(50.9) |
(57.5) |
(66.0) |
(51.7) |
(42.3) | |
AISC |
A$m |
205.1 |
182.9 |
170.1 |
189.5 |
174.5 | |
AISC/oz Au produced 5 |
A$/oz |
2,925 |
2,312 |
2,056 |
2,196 |
2,155 | |
Telfer growth capex |
A$m |
37.2 |
59.0 |
41.8 |
61.2 |
69.8 | |
Inventory movements 5 |
A$m |
(0.6) |
(16.4) |
48.6 |
(5.8) |
18.2 | |
Depreciation & amortisation |
A$m |
73.0 |
55.3 |
43.6 |
24.6 |
19.6 | |
Notes:
- Metal produced for gold includes dump leach ounces which are recovered separately to the processing plant circuit.
- Sales and revenue for copper-gold concentrate is recognised upon receipt of the bill of lading when the goods are delivered for shipment under Cost, Insurance, and Freight (CIF) Incoterms.
- Total net revenue includes adjustments for treatment and refining charges and payability deductions. Average price received is calculated by dividing net revenue by sales (i.e. average price received is also adjusted for payability deductions).
- $6.7 million of lease repayments are included in Sustaining Capital. Lease repayments are included in cashflows from financing activities in the Consolidated Statement of Cash Flows included in the Company’s financial statements.
- AISC is stated per ounce of gold produced, net of by-products (copper and silver) credits. AISC excludes inventory movements impacting EBIT by a credit of $0.6 million for the quarter.
Mining
Open Pit
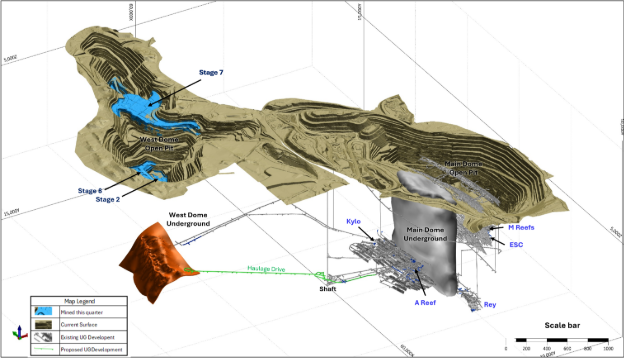
Open pit ore mined during the September quarter was from Stage 2, Stage 7 and Stage 8 (refer Figure 1), totalling 4.05Mt at 0.45g/t Au and 0.04% Cu. Dump leach ore mined was 0.17Mt.
Total material mined (TMM) was 7.86Mt including approximately 3.64Mt of waste. This is the seventh consecutive quarter-on-quarter increase in TMM, driven by a combination of higher trucking availability from new and rebuilt haul trucks matched with consistent digger productivity, and ongoing focus to improve bench turnover and open up larger, more productive work fronts in Stage 7.
Strip ratio (waste:ore) for the Stage 7 development during the quarter was 1.7, down from 2.3 in the previous quarter as more ore is exposed. Total Stage 7 waste mined in the quarter was 2.82Mt for a total cumulative waste mined of 19.02Mt to the end of the September quarter. Strip ratio for Stage 7 is expected to average 1.4 - 1.5 for FY27.
Underground
Ore mined during the September quarter was predominantly from A-reef and the Eastern Stockwork Corridor (ESC) areas of the Main Dome Underground (MDU) (refer Figure 1), totalling 0.38Mt at 1.33g/t Au and 0.32% Cu. Reduced copper grade compared to prior quarters was due to completion of the first stage of the higher-grade Rey mining area.
Record development metres were achieved for the seventh consecutive quarter and totalled 2,021m, with 674m growth capital development including ongoing extension opportunities at West Dome Underground (WDU) and ESC. The second development drive from the MDU to the WDU progressed during the September quarter and subsequently broke through in early-October, extending the primary ventilation loop to the current drill platform location. The shaft access haulage drive development is progressing from the shaft and crusher end to connect the existing shaft and return air rises to the WDU mining area.
Figure 1: September quarter mining areas
Processing
The September quarter delivered processed tonnes of 4.89Mt with an average head grade of 0.50g/t Au and 0.07% Cu.
Throughput volume was a highlight and ahead of plan for the quarter, noting that the major planned 15-day maintenance shutdown was successfully completed. Gold recoveries were in line with plan at 85.1% while copper recoveries of 82.5% were ahead of plan, partially assisted by higher mine grades and less reliance on stockpile feed.
Gold and copper production of 70,131oz and 2,927t respectively was achieved for the quarter, positioning the Company well to deliver FY27 guidance of 260,000 – 300,000 ounces of gold.
Costs
September quarter actuals
Mining costs of $88.1 million were lower than the previous quarter, despite higher total material moved, largely due to improved productivity aided by a higher proportion of mining volumes from the more productive Stage 7 mining areas.
Processing costs of $89.5 million were in line with plan, with the increase relative to prior quarters primarily from the higher surface maintenance costs associated with the planned major maintenance shutdown.
Sustaining capex of $36.5 million was in line with plan, though higher than the previous quarter which was largely due to underground development activity.
Site services of $23.8 million were in line with plan and previous quarters.
Stockpiles
Closing run-of-mine (ROM) ore stockpiles at 30 September 2026 are estimated at 1.4Mt at an average grade of 0.60g/t Au and 0.09% Cu for contained metal of 27koz Au and 1.2kt Cu. Low grade stockpiles at 30 September 2026 are estimated at 19.5Mt at average grade of 0.33g/t Au and 0.04% Cu for contained metal of 209koz Au and 8.4kt Cu.
Total stockpiles processed during the quarter was approximately 0.4Mt with underground and open pit mined volumes accounting for approximately 90% of total mill feed.
Table 2: Stockpiles (estimated)
|
Stockpiles |
|
Unit |
Sep Q 2026 |
Jun Q 2026 |
Mar Q 2026 |
Dec Q 2025 |
Sep Q 2025 | |
|
Closing ore stockpiles (ROM) – estimated | |||||||
Ore |
|
Mt |
1.4 |
1.4 |
1.9 |
2.7 |
4.5 | |
Average grade |
Au |
g/t Au |
0.60 |
0.68 |
0.69 |
0.66 |
0.63 | |
Cu |
% Cu |
0.09 |
0.12 |
0.13 |
0.11 |
0.07 | ||
Contained metal |
Au |
koz |
27 |
31 |
41 |
57 |
92 | |
Cu |
kt |
1.2 |
1.7 |
2.4 |
3.0 |
3.2 | ||
|
Closing ore stockpiles (low grade) – estimated | |||||||
Ore |
|
Mt |
19.5 |
19.8 |
20.6 |
20.8 |
20.8 | |
Average grade |
Au |
g/t Au |
0.33 |
0.33 |
0.33 |
0.33 |
0.33 | |
Cu |
% Cu |
0.04 |
0.04 |
0.04 |
0.04 |
0.04 | ||
Contained metal |
Au |
koz |
209 |
210 |
221 |
221 |
221 | |
Cu |
kt |
8.4 |
8.5 |
9.1 |
9.1 |
9.1 | ||
Growth and drilling
A total of $96.7 million was spent on growth and capitalised exploration during the quarter, comprising:
- Havieron: $45.2 million towards construction of evaporation ponds, blind bore drill rig pad and underground development (refer below).
- Telfer: $37.2 million towards TSF8 Stage 4 lift construction, West Dome Open Pit Stage 7 stripping, and underground growth development (primarily across Western Flanks, A-Reef, ESC, Rey and West Dome Underground).
- Exploration & resource development: $13.3 million capitalised for resource development from 51km of resource growth drilling, and $1.0 million capitalised exploration with a further $2.7 million of exploration expensed. A second surface diamond drill rig has been approved for the Pinnacles Prospect to continue testing of the highly prospective extension to the West Dome geological structure and stratigraphy.
Havieron
Updates from the September 2026 quarter include:
- Permitting and Approvals: All necessary secondary approvals to commence construction were obtained during the quarter, and all post-primary approval conditions were met. This enabled surface disturbance works to commence and marked the formal commencement of the Havieron Project.
- Delivery Partner: Greatland appointed Lycopodium to assist with the delivery of the Havieron Project. Lycopodium will be performing Engineering, Project Controls, Procurement services and Construction Management.
Figure 2: Evaporation pond 4 works (LHS) and blind bore pad construction (RHS).
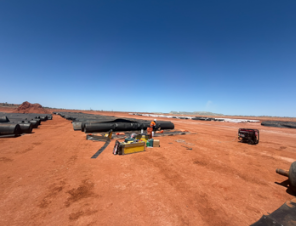
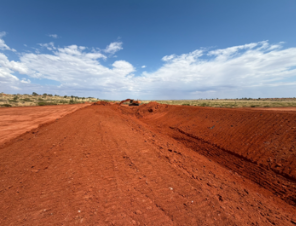
- Site Earthworks: Site Construction team was mobilised and Earthworks package has commenced with evaporation ponds 4, 5 and 6 progressing. The blind bore drill rig pad was also initiated and completed, ready for blind bore rig mobilisation.
- Blind bores: Pre-mobilisation works were completed for the blind bore contractor (Abergeldie Complex Infrastructure) with site establishment targeted for October.
- Development mining: Mining continues along the primary decline and conveyor decline. Development grouting trials are underway which will inform the mining sequence as the staged delivery of mine-water evaporation ponds enables increased development activity.
- Procurement: Major Project Packages (Haul Road, HV Powerline) were tendered to market. Other minor packages are also progressing in line with schedule.
- Process Plant: Early Contractor Engagement scope was awarded to GR Engineering Services for the upgrade of the Telfer process plant Train 1 which will optimise recoveries of Havieron ore.
Corporate & Finance
Sales and revenue
Greatland retains full upside exposure to the spot gold price. Sales of 71,901oz Au and 2,714t Cu at average realised prices of $5,980/oz Au and $16,653/t Cu, generated net sales revenues of $485 million for the quarter.
Cash and liquidity
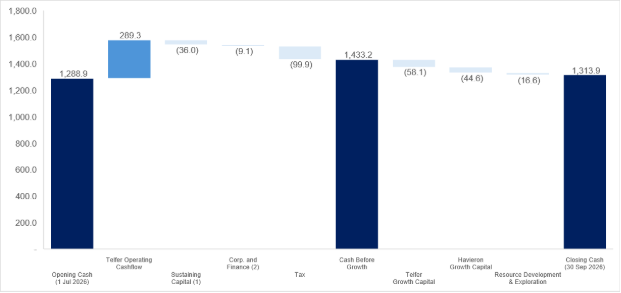
Cash flow from operations for the quarter was $289 million, with cash build of $25 million, for a closing cash balance on 30 September 2026 of $1,314 million and total available liquidity of $1,789 million1.
Note (1): Available liquidity refers to $1,314m net cash reported at 30 September 2026 plus the $475m in undrawn Revolving Credit Facilities.
Figure 3: September 2026 quarter cash movements
Notes:
- $6.7 million of lease repayments are included in Sustaining Capital ($36 million). Lease repayments are included in cash flows from financing activities in the Consolidated Statement of Cash Flows included in the Company’s financial statements.
- Corporate and finance includes corporate overheads and finance costs / interest and premiums paid for gold put options.
Tax instalments of $100 million were paid in the September 2026 quarter, comprising the June quarterly tax instalment of $64 million, following which Greatland was re-assessed for monthly instalments resulting in an additional $36 million of tax payments for July and August 2026. Ongoing monthly PAYG instalments will be made for the rest of FY27 based on an assessed rate of approximately 12% of instalment income (revenue and interest income), as determined by the ATO. In addition, a catch-up tax payment that relates to FY26 of ~$155 million is also anticipated in December 2026.
Depreciation and amortisation (D&A) for the quarter was $73 million. Full year FY27 D&A is expected to be $280 to $320 million, weighted towards H2. The increase in D&A from FY26 ($144 million) to FY27 results from the increased capital base established at Telfer following the significant investment made since acquisition, particularly from underground development, Stage 7 stripping and tailings storage facility construction.
Gold Hedging profile – downside price protection with full upside exposure
Greatland continues to maintain full upside exposure to the gold price, while achieving downside price protection through gold put options. Greatland's current gold put options are the following:
Table 3: Gold put option program
Quarter end date | Gold volumes under put options (oz) |
Weighted Average Strike Price (A$/oz) |
31-Dec-2026 |
37,498 |
4,200 |
31-Mar-2027 |
37,500 |
5,000 |
30-Jun-2027 |
37,500 |
5,200 |
30-Sep-2027 |
37,500 |
5,000 |
Total |
149,998 |
4,850 |
Safety
No lost time injury occurred during the quarter, and the 12-month moving average lost time injury frequency rate (LTIFR) is 0.2. Greatland’s TRIFR at quarter end was 3.7 (30 June 2026: 4.5).
Corporate Structure
Category |
Metric |
Ordinary shares on issue (#) |
674,667,361 |
Unquoted securities (#) |
6,188,498 Performance Rights 570,000 Employee Options 17,631,000 Warrants |
Market capitalisation ($ billion) |
$5.9 billion (as at ASX close price, 23 October 2026) |
Cash balance ($ million) |
$1,314 million (as at 30 September 2026) |
Contact
For further information, please contact:
Greatland Resources Limited
Shaun Day, Managing Director | Andrew Bowler, Head of Investor Relations
Nominated Advisor
SPARK Advisory Partners
Andrew Emmott / James Keeshan / Neil Baldwin | +44 203 368 3550
Corporate Brokers
Canaccord Genuity | James Asensio / George Grainger | +44 207 523 8000
RBC Capital Markets | James Agnew / Jamil Miah | Scott Redwood | +44 207 029 0528
Media Relations
Australia – Fivemark Partners | Michael Vaughan | +61 422 602 720
About Greatland
Greatland is a gold and copper mining company listed on the Australian Securities Exchange and London Stock Exchange's AIM Market (AIM:GGP, ASX:GGP), and operates its business from Western Australia.
The Greatland portfolio includes the 100% owned Telfer mine, the adjacent 100% owned brownfield world-class Havieron gold-copper development project, and a significant exploration portfolio within the surrounding region. The combination of Telfer and Havieron provides for a substantial and long-life gold-copper operation in the Paterson Province in the East Pilbara region of Western Australia.
Forward-Looking Statements
This document includes forward-looking statements and forward-looking information within the meaning of securities laws of applicable jurisdictions. Forward-looking statements can generally be identified by the use of words such as "may", "will", "expect", "intend", "plan", "estimate", "anticipate", "believe", "continue", "objectives", "targets", "outlook" and "guidance", or other similar words and may include, without limitation, statements regarding estimated reserves and resources, certain plans, strategies, aspirations and objectives of management, anticipated production, study or construction dates, expected costs, cash flow or production outputs and anticipated productive lives of projects and mines.
These forward-looking statements involve known and unknown risks, uncertainties and other factors that may cause actual results, performance and achievements or industry results to differ materially from any future results, performance or achievements, or industry results, expressed or implied by these forward-looking statements. Relevant factors may include, but are not limited to, changes in commodity prices, foreign exchange fluctuations and general economic conditions, increased costs and demand for production inputs, the speculative nature of exploration and project development, including the risks of obtaining necessary licences and permits and diminishing quantities or grades of reserves, political and social risks, changes to the regulatory framework within which Greatland operates or may in the future operate, environmental conditions including extreme weather conditions, recruitment and retention of personnel, industrial relations issues and litigation.
Forward-looking statements are based on assumptions as to the financial, market, regulatory and other relevant environments that will exist and affect Greatland's business and operations in the future. Greatland does not give any assurance that the assumptions will prove to be correct. There may be other factors that could cause actual results or events not to be as anticipated, and many events are beyond the reasonable control of Greatland. Forward-looking statements in this document speak only at the date of issue. Greatland does not undertake any obligation to update or revise any of the forward-looking statements or to advise of any change in assumptions on which any such statement is based.
Non-GAAP Measures
Some of the financial performance measures used in this announcement are non-IFRS financial measures, including "all-in sustaining cost", "total cash cost", "net cash", "free cash flow", “operating cash flow”, "sustaining capital" and "growth capital". These measures are presented as they are considered to provide useful information to assist investors with their evaluation of the business's underlying performance. Since the non-IFRS performance measures listed in this announcement do not have any standardised definition prescribed by IFRS, they may not be comparable to similar measures presented by other companies. Accordingly, they are intended to provide additional information and should not be considered in isolation or as a substitute for measures of performance prepared in accordance with IFRS.
RNS may use your IP address to confirm compliance with the terms and conditions, to analyse how you engage with the information contained in this communication, and to share such analysis on an anonymised basis with others as part of our commercial services. For further information about how RNS and the London Stock Exchange use the personal data you provide us, please see our Privacy Policy.

Latest directors dealings
- 16 minutes ago Literacy Capital
- 1 hour ago South32 Limited (DI)
- 1 hour ago Corero Network Security
- 3 hours ago Power Probe PLC
- 3 hours ago Primary Health Properties