December 2025 Group Mineral Resource Stmt.
Summary by AI BETAClose X
 Greatland Resources Limited
E: info@greatland.com.au
W: https://greatland.com.au
 : x.com/greatlandgold
NEWS RELEASE | 30 March 2026
December 2025 Group Mineral Resource Statement
THIS ANNOUNCEMENT CONTAINS INSIDE INFORMATION AS STIPULATED UNDER THE UK MARKET ABUSE REGULATIONS. ON PUBLICATION OF THIS ANNOUNCEMENT VIA A REGULATORY INFORMATION SERVICE, THIS INFORMATION IS CONSIDERED TO BE IN THE PUBLIC DOMAIN.
Telfer grows to 8.0Moz (+150%), supporting a long-life operation
Telfer adds 4.8Moz of gold Mineral Resources at a discovery cost of $5 per ounce
Telfer Measured and Indicated Resource growth of 163% to 3.8Moz
Telfer and Havieron Mineral Resources of 14.9Moz ounces gold and 645kt of copper
Greatland Resources Limited (Greatland or Company) (AIM:GGP, ASX:GGP) is pleased to provide its Group Mineral Resource Estimate (MRE), as at 31 December 2025 (December 2025 Group MRE).
The December 2025 Group MRE includes Greatland's 100% owned Telfer and Havieron (Havieron unchanged) gold-copper projects, and a Greatland MRE for the 100% owned O'Callaghans tungsten-copper-zinc-lead deposit (O'Callaghans), detailed in a separate concurrent announcement.
Significant new growth and infill drilling since the previous resource update as at 31 December 2024 (December 2024 Group MRE) has resulted in resource growth and a material upgrading of resource classification. Approximately 134,000m of additional drilling from 1 January 2025 to 31 December 2025 is incorporated into the December 2025 Group MRE update. More than 100,000m of further drilling is planned in the second half of Telfer's record FY26 drilling program, which will inform future MRE updates.
The December 2025 Group MRE includes a maiden resource for the high-grade West Dome Underground Project, with potential for further growth and classification upgrade from ongoing drilling.
Key highlights:
§ Telfer and Havieron MRE grows to 14.9Moz - 550Mt @ 0.84g/t Au & 0.12% Cu for 14.9Moz Au & 645kt Cu
§ Telfer MRE grows by 4.8Moz to 8.0Moz (+150%)
- Organic MRE growth delivered for a discovery cost of $5/oz
- 419Mt @ 0.59g/t Au & 0.09% Cu for 8.0Moz Au & 370Kt Cu
- Classification upgrade: Measured and Indicated (M&I) Resource grows 163% to 170Mt @ 0.69g/t Au & 0.13% Cu for 3.8Moz & 249Kt Cu
- M&I Resources are of an adequate level of geological confidence to be evaluated in the upcoming Ore Reserve Estimate update (targeted for June 2026 quarter)
§ West Dome Open Pit (WDO) MRE grows by 2.8Moz to 4.9Moz (+135%)
- 338Mt @ 0.45g/t Au & 0.04% Cu for 4.9Moz Au & 149Kt
§ Higher grade component of 258Mt @ 0.53g/t Au & 0.05% Cu for 4.4Moz Au
§ Main Dome Underground (MDU) MRE grows by 1.5Moz to 2.2Moz (+225%)
- Active mining areas - 12.3Mt @ 2.14g/t Au & 0.41% Cu for 0.8Moz Au & 50Kt Cu
- Sub-level cave (SLC) area - 37.5Mt @ 1.09 g/t Au & 0.33% Cu for 1.3Moz Au & 125Kt Cu
§ West Dome Underground (WDU) MRE: maiden 0.6Moz Au
- Maiden MRE of 8.0Mt @ 2.30g/t Au & 0.44% Cu for 0.6Moz Au & 35Kt Cu, consists of:
§ Lower Limey Unit (LLU): 3.5Mt @ 3.36g/t Au & 0.51% Cu
§ Western Stockwork Corridor (WSC): 4.5Mt @ 1.47g/t Au & 0.38% Cu
- Low cost organic growth with discovery cost of ~$9/oz
§ Telfer Stockpiles: 0.3Moz
- 24Mt @ 0.37g/t Au & 0.05% Cu for 0.28Moz Au & 11Kt Cu
§ Outlook:
- H1 FY26 infill drilling successfully delivered a major upgrade in the M&I category supporting an updated Telfer Ore Reserve Estimate targeted for the June 2026 Quarter.
- Following significant resource growth, particularly in the M&I category, Greatland's focus now shifts to advancing higher-grade opportunities including WDU and the MDU sub-level cave area.
- Record FY26 drilling program continues with >100,000 metres of further drilling planned for H2 FY26 and a substantial drilling program expected for FY27
§ Economic factors: Telfer MRE incorporates updated cost (based on CY25 actuals) and revenue assumptions with assumed metal prices of A$4,200/oz for gold and A$6.50/lb for copper, compared to spot prices of ~A$6,500/oz and ~A$8.00/lb respectively
Greatland Managing Director, Shaun Day, commented:
"Telfer and Havieron's combined resource of 550Mt @ 0.84g/t Au & 0.12% Cu for 14.9Moz Au & 645Kt Cu has the potential to underpin a multi-decade, world class mining hub. Our investment in significantly increased drilling has delivered substantial organic growth, with the overall Telfer resource growing by 150% to 8.0Moz, and the higher confidence Measured and Indicated component by 163% to 3.8Moz.
"The growth includes a high-grade maiden resource at the West Dome Underground project, which shows significant potential for a new mining front at Telfer and remains the focus of ongoing drilling.
"This strong resource update has been delivered by Greatland's dedicated technical team who have executed an accelerated and extensive Telfer drilling program since taking ownership in December 2024.
"The significant growth in Measured and Indicated Resources, particularly at the West Dome Open Pit, is very pleasing with this material being of adequate geological confidence to be evaluated as part of our upcoming Ore Reserve estimate, which remains targeted for the June 2026 quarter.
"The scale of Telfer's resource demonstrates clear potential to fully utilise our low cost 20 million tonne per annum processing infrastructure well into the future. The technical team's focus is now to advance our higher grade opportunities including the West Dome Underground and the potential to restart Main Dome Underground's sub-level cave, which could augment our development of Havieron."
Telfer resource background and future opportunities
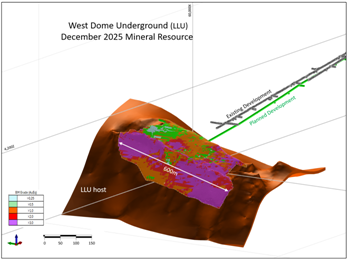
The December 2025 Telfer MRE (Table 1) incorporates all drilling available as at 31 December 2025 and comprises four key Mineral Resource areas (Figure 1), being:
§ West Dome Open Pit (WDO) (active mining operation)
§ Main Dome Underground (MDU) (active mining operation)
§ West Dome Underground (WDU) (near-mine resource)
§ Vertical Stockwork Corridor (VSC) (near-mine resource)
As part of Greatland's record 240,000m FY26 drilling program, more than 100,000m of further drilling is expected to be completed in H2 FY26 (after the 31 December 2025 data cut-off date for the December 2025 Telfer MRE). Greatland anticipates that this remaining drill information for FY26, and continued high drilling cadence at Telfer in FY27, will position the Company well for further resource growth and classification upgrades in subsequent MRE updates.
WDO is the baseload feed of ore mined at Telfer and, with stockpiles, underpins the full utilisation of Telfer's 20 million tonne per annum (Mtpa) nominal processing capacity. WDO's now sizable Indicated Resource of 102Mt @ 0.46g/t Au & 0.05% Cu for 1.5Moz Au & 51 Kt Cu includes a higher grade component of 79Mt @ 0.52g/t Au & 0.05% Cu for 1.3Moz Au & 41 Kt Cu. Importantly, this large volume of Indicated material is of an adequate level of geological confidence to be evaluated as part of the upcoming Ore Reserve Estimate update. Greatland is also advancing other 100% owned potential open pit resource opportunities, such as Main Dome Open Pit and the Southeast Hub satellite area.
Telfers existing underground infrastructure is underpinned by ~6Mtpa of underground crushing and hoisting (shaft) capacity along with surface materials handling that delivers underground ore directly to Train 1 of the Telfer processing facility. Increased utilisation of this existing infrastructure, through expansion of current mining activities in the MDU along with the potential for future development of WDU and VSC, is a key opportunity for Greatland, noting that MDU currently operates at a rate of ~1.0 - 1.5Mtpa. Higher underground output presents a compelling opportunity at Telfer given current underground mining grades are approximately three times higher than current open pit grades.
Greatland expects to release an updated Ore Reserve Estimate for Telfer in the June 2026 quarter.
Table 1: Telfer December 2025 Mineral Resource Statement
|
Area |
Measured |
Indicated |
Inferred |
Combined |
||||||||||||
|
Tonnes |
Au |
Cu |
Tonnes |
Au |
Cu |
Au |
Tonnes |
Au |
Cu |
Au |
Tonnes |
Au |
Cu |
Au |
Cu |
|
|
Mt |
g/t |
% |
Mt |
g/t |
% |
Moz |
Mt |
g/t |
% |
Moz |
Mt |
g/t |
% |
Moz |
kt |
|
|
West Dome Open Pit |
- |
- |
- |
102 |
0.46 |
0.05 |
1.5 |
235 |
0.45 |
0.04 |
3.4 |
338 |
0.45 |
0.04 |
4.9 |
149 |
|
Main Dome Underground |
- |
- |
- |
7.8 |
2.28 |
0.45 |
0.6 |
4.4 |
1.90 |
0.33 |
0.3 |
12.3 |
2.14 |
0.41 |
0.8 |
50 |
|
VSC |
- |
- |
- |
33 |
1.11 |
0.32 |
1.2 |
4.2 |
0.97 |
0.40 |
0.1 |
37.5 |
1.09 |
0.33 |
1.3 |
125 |
|
West Dome Underground |
- |
- |
- |
3 |
2.29 |
0 |
0.2 |
5.1 |
2.30 |
0.42 |
0.4 |
8 |
2.30 |
0.44 |
0.6 |
35 |
|
Stockpiles |
2.7 |
0.66 |
0.10 |
21 |
0.33 |
0.04 |
0.2 |
- |
- |
- |
|
24 |
0.37 |
0.05 |
0.3 |
11 |
|
Combined |
2.7 |
0.66 |
0.10 |
167 |
0.69 |
0.13 |
3.7 |
249 |
0.53 |
0.06 |
4.2 |
419 |
0.59 |
0.09 |
8.0 |
370 |
Notes: Mineral Resources are reported as at 31 December 2025, grades are reported to two decimal places to reflect appropriate precision in the estimate, and this may cause apparent discrepancies in totals. Cutoffs for the Telfer MRE are applied based on a NSR using metal prices of A$4,200/oz Au and A$6.50/lb and current site cost and revenue assumptions.
Figure 1: Telfer December 2025 Mineral Resource (schematic)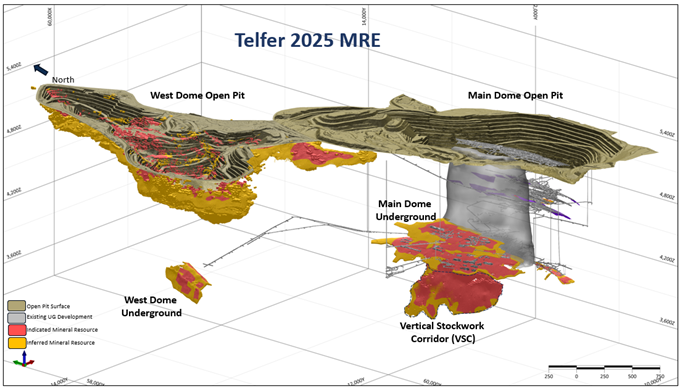
West Dome Open Pit (WDO)
WDO continues to be the primary source of ore mined at Telfer and, with stockpiles, underpins the full utilisation of Telfer's 20Mtpa of nominal processing capacity. As such, the WDO has been the focus of a targeted resource growth drilling program during 2025, with 467 holes for over 87,000 metres of new growth drilling informing the December 2025 Telfer MRE.
The WDO MRE is 338Mt @ 0.45g/t Au & 0.04% Cu for 4.9Moz Au & 149Kt Cu, including a significant increase (+184%) in the higher confidence Indicated category to 102Mt @ 0.46g/t Au & 0.05% Cu for 1.5Moz Au & 51Kt Cu. Indicated material is of an adequate level of geological confidence to be evaluated in the upcoming Ore Reserve update.
The December 2024 MRE for WDO only reported fully costed ex-pit material above a breakeven cut-off cost. During 2025 Greatland carried out processing trials of existing low-grade stockpiles as well as direct tipping of low-grade ex-pit material (incrementally costed) to the Telfer processing plant to confirm metallurgical recovery assumptions. The result of these trials supported the inclusion of this material into the December 2025 MRE for WDO (Table 2) and aligns with Greatland's current operational approach of prioritising direct-tipping of all profitable material to optimise processing throughput, reduce rehandle costs and preserve surface stockpiles.
Table 2: West Dome Open Pit December 2025 Mineral Resource Statement
|
West Dome Open Pit |
Indicated |
Inferred |
Combined |
||||||||||
|
Ton |
Au |
Cu |
Au |
Ton |
Au |
Cu |
Au |
Ton |
Au |
Cu |
Au |
Cu |
|
|
Mt |
g/t |
% |
Moz |
Mt |
g/t |
% |
Moz |
Mt |
g/t |
% |
Moz |
kt |
|
|
High Grade |
79 |
0.52 |
0.05 |
1.3 |
179 |
0.53 |
0.05 |
3.0 |
258 |
0.53 |
0.05 |
4.4 |
131 |
|
Low Grade |
23 |
0.23 |
0.04 |
0.2 |
57 |
0.22 |
0.02 |
0.4 |
80 |
0.22 |
0.03 |
0.6 |
23 |
|
Total |
102 |
0.46 |
0.05 |
1.5 |
235 |
0.45 |
0.04 |
3.4 |
338 |
0.45 |
0.04 |
4.9 |
149 |
Notes: Mineral Resources are reported as at 31 December 2025, grades are reported to two decimal places to reflect appropriate precision in the estimate, and this may cause apparent discrepancies in totals. Cutoffs for the Telfer MRE are applied based on a NSR using metal prices of A$4,200/oz Au and A$6.50/lb and current site cost and revenue assumptions.
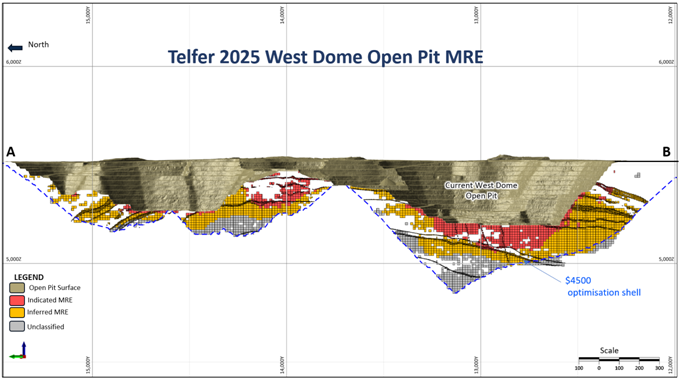
The substantial increase in the WDO MRE (Table 2, Figure 2) was achieved by a combination of resource growth (drilling) alongside an update to both cost and revenue factors. Pleasingly, the outcome of the infill drilling within the potential extension to the Stage 7 cutback returned excellent conversion rates (>85%) from Inferred to Indicated resource category, providing confidence in the geological model and estimation methods that underpin 3.4Moz of Inferred Resource. Greatland will focus on Resource conversion (from Inferred to Indicated) in WDO throughout the remainder of FY26.
Figure 2: West Dome Open Pit December 2025 Mineral Resource (plan)
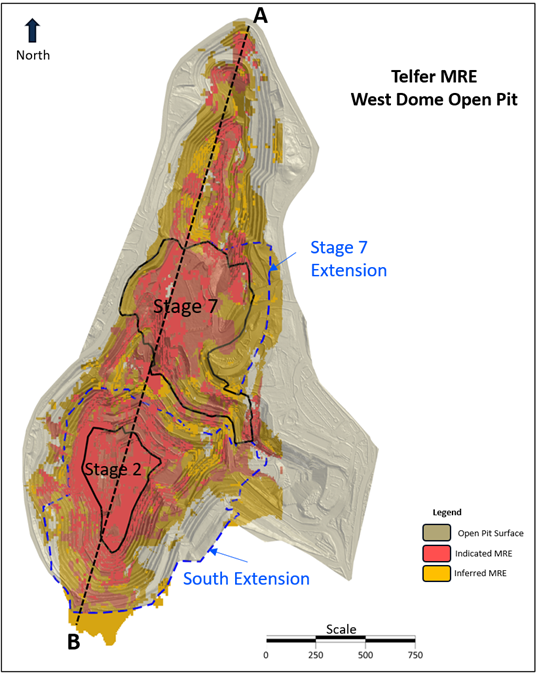
Figure 3: West Dome Open Pit 2025 Mineral Resource (long section AB as depicted on Figure 2)
Main Dome Underground (MDU)
Active mining Areas
Substantial resource growth in the active mining areas of the MDU has been achieved in the December 2025 Telfer MRE.
A total MRE of 12.3Mt @ 2.14g/t Au & 0.41% Cu for 0.8Moz Au & 50Kt Cu (Table 3) has been defined across the active A Reefs, M Reefs, Eastern Stockwork Corridor (ESC), Lower Limey Unit (LLU) and Rey areas. This is a 27% increase in contained metal relative to the December 2024 MRE for Telfer and underpins continued mining in the MDU, which currently contributes ~1.0-1.5Mtpa of ore to Telfer production.
Vertical Stockwork Corridor (VSC)
A key addition to the December 2025 Telfer MRE is the VSC area of the MDU, with a MRE of 37.5Mt @ 1.09g/t Au & 0.33% Cu for 1.3Moz Au & 125Kt Cu (Table 3).
This VSC was previously classified as a resource prior to Greatland ownership and, after technical and economic evaluation in 2025, has been reintroduced into Greatland's December 2025 Telfer MRE update. The VSC domain was previously targeted as part of a large scale sub-level cave (SLC) with no material mining of the SLC having occurred since 2023, noting any potential future mining would likely operate at a lower extraction rate than the historical SLC. The VSC resource is located directly below the previous SLC.
The resource is located proximal to key underground infrastructure which is underpinned by ~6Mtpa of underground crushing and hoisting (shaft) capacity along with surface materials handling that delivers underground ore directly to the Telfer processing facility.
Table 3: Main Dome Underground December 2025 Mineral Resource
|
Area |
Indicated |
Inferred |
Combined |
||||||||||
|
Ton |
Au |
Cu |
Au Metal |
Ton |
Au |
Cu |
Au Metal |
Ton |
Au |
Cu |
Au Metal |
Cu Metal |
|
|
Mt |
g/t |
% |
Moz |
Mt |
g/t |
% |
Moz |
Mt |
g/t |
% |
Moz |
kt |
|
|
MDU (Excluding VSC) |
7.8 |
2.28 |
0.45 |
0.6 |
4.4 |
1.90 |
0.33 |
0.3 |
12.3 |
2.14 |
0.41 |
0.8 |
50 |
|
VSC |
33 |
1.11 |
0.32 |
1.2 |
4.2 |
0.97 |
0.40 |
0.1 |
37.5 |
1.09 |
0.33 |
1.3 |
125 |
Notes: Mineral Resources are reported as at 31 December 2025, grades are reported to two decimal places to reflect appropriate precision in the estimate, and this may cause apparent discrepancies in totals. Cutoffs for the Telfer MRE are applied based on a NSR using metal prices of A$4,200/oz Au and A$6.50/lb and current site cost and revenue assumptions.
Figure 4: Main Dome Underground December 2025 Mineral Resource (isometric view)
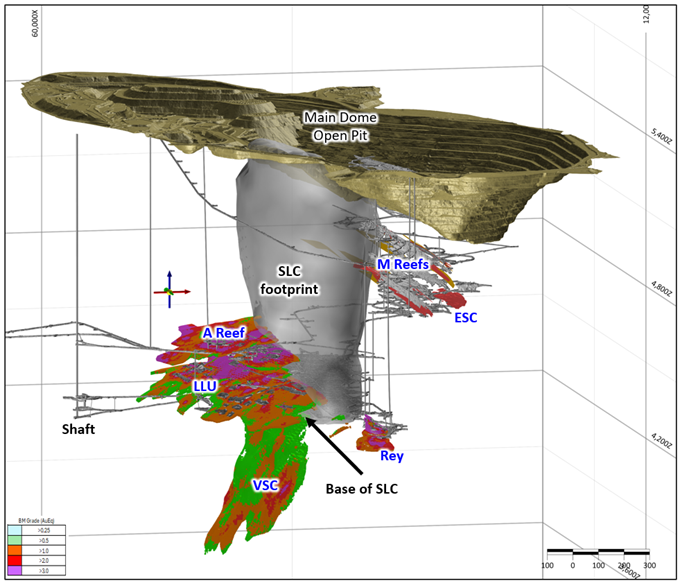
The VSC is a structurally controlled style of gold and copper mineralisation hosted in a steep west-dipping fold-axial-related breccia and stockwork zone in brittle sandstone host rocks. The VSC mineralised zone has been recognised over a 1,000m strike length and 600m vertically with widths of up to 60m. The MRE model consists of estimates for gold, copper, cyanide soluble copper, sulphur, arsenic, cobalt, and density using Indicator Kriging. The VSC MRE is reported above a notional net smelter return (NSR) value of A$70/t and below the 4350RL. The NSR profit algorithm has been updated for the December 2025 MRE and is based on SLC non-selective mining practices, resource metal pricing, updated SLC underground mining and processing costs assumptions and contains no mining dilution.
The VSC is considered a well-informed estimate, supported by over 354 diamond drill holes with drill density ranging from ~50m spacing in the Indicated material up to 100m within the inferred material.
West Dome Underground (WDU)
The WDU emerged from the recognition that key geological structures hosting mineralisation in the Main Dome Open Pit repeat in the West Dome Open Pit, specifically the E Reefs and the Middle Vale Reef. Accordingly, it was proposed that the geological features that are key to mineralisation in the Main Dome Underground (Figures 1 and 4), may repeat below the West Dome Open Pit. The Main Dome Underground has produced more than 3.1Moz gold and 210Kt copper to date.
This concept was drilled from surface between 2009 and 2020 with 16 holes completed over the 3km strike. Drilling was accelerated in 2024-2025 from newly established underground positions with a total of 18,963m drilled to December 2025. Greatland's drilling has confirmed that the key geological units hosting the Main Dome Underground mineralisation are present in the WDU.
Greatland considers the WDU area to be geologically analogous to the currently operating MDU, which hosts a range of mineralisation ranging from narrow high-grade reef (A Reefs), sulphide replacement (Rey) and bulk stockwork mineralisation (SLC). Drilling to date in the WDU has targeted high-grade sulphide replacement within the Lower Limey Unit (LLU), while broad stockwork mineralisation, termed the Western Stockwork Corridor (WSC), has also been defined.
The maiden WDU MRE consists of 8.0Mt @ 2.30g/t Au & 0.44% Cu for 0.6Moz Au & 35Kt Cu across both the high-grade sulphide replacement (LLU) and broad stockwork (WSC) domains (Table 4).
Table 4: West Dome Underground December 2025 Mineral Resource
|
Area |
Indicated |
Inferred |
Combined |
||||||||||
|
Ton |
Au |
Cu |
Au Metal |
Ton |
Au |
Cu |
Au Metal |
Ton |
Au |
Cu |
Au Metal |
Cu Metal |
|
|
Mt |
g/t |
% |
Moz |
Mt |
g/t |
% |
Moz |
Mt |
g/t |
% |
Moz |
kt |
|
|
Lower Limey Unit (LLU) |
1.6 |
2.99 |
0.49 |
0.2 |
1.9 |
3.67 |
0.53 |
0.2 |
3.5 |
3.36 |
0.51 |
0.4 |
18 |
|
Western stockwork Corridor (WSC) |
1.3 |
1.43 |
0.48 |
0.1 |
3.2 |
1.48 |
0.35 |
0.2 |
4.5 |
1.47 |
0.38 |
0.2 |
17 |
|
West Dome UG Total |
3.0 |
2.29 |
0.48 |
0.2 |
5.1 |
2.30 |
0.42 |
0.4 |
8.0 |
2.30 |
0.44 |
0.6 |
35 |
Notes: Mineral Resources are reported as at 31 December 2025, grades are reported to two decimal places to reflect appropriate precision in the estimate, and this may cause apparent discrepancies in totals. Cutoffs for the Telfer MRE are applied based on a NSR using metal prices of A$4,200/oz Au and A$6.50/lb and current site cost and revenue assumptions.
The release of the maiden MRE for the WDU caps an exciting 12 months of exploration with over 10,000m of new diamond drilling confirming the high-grade mineralisation within the LLU, along with the identification of the much larger-scale domain in the WSC, both over a >600m strike length. Importantly, WDU remains open in multiple directions and is a key target for high-grade resource growth with multiple underground diamond rigs to remain focused on the WDU resource in 2026. With >20,000m of drilling planned, key objectives include infill of existing mineralisation to the north, extensions of the system to the south, and evaluation of the WSC's vertical extent.
Greatland continues to view WDU as an area of high geological prospectivity, given the area is analogous to the Main Dome Underground while also being proximal to Telfer's considerable ~6Mtpa installed underground crushing, hoisting (shaft) and surface materials handling system that delivers underground ore directly to the Telfer processing facility. The WDU has the potential to be a future mining centre that, if validated by ongoing mining evaluation and studies, could materially lift Telfer's underground mining rates and overall grades reporting to the Telfer processing facility.
Figure 5: West Dome Underground December 2025 Mineral Resource (isometric view)
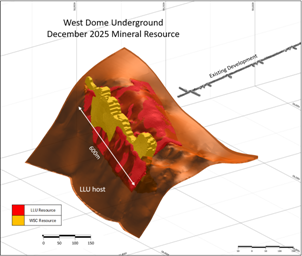
Notes: AuEq has been calculated based on the metal prices of $4200\oz and $6.50\lb Cu and metal recoveries similar to the Main Dome underground resulting a calculation of AuEq = Au + Cu% x 1.06.
Telfer Stockpiles
Substantial surface stockpiles continue to be maintained at Telfer, providing flexibility, resilience and optionality to continue fully utilising Telfer's 20Mtpa processing capacity. The December 2025 Telfer MRE includes 24Mt @ 0.37g/t Au & 0.05% Cu for 0.3Moz Au & 11Kt Cu in stockpile resources.
Table 5. Telfer Stockpiles December 2025 Mineral Resource
|
Area |
Measured |
Indicated |
Inferred |
Combined |
||||||||||||
|
Tonnes |
Au |
Cu |
Tonnes |
Au |
Cu |
Au |
Tonnes |
Au |
Cu |
Au |
Tonnes |
Au |
Cu |
Au |
Cu |
|
|
Mt |
g/t |
% |
Mt |
g/t |
% |
Moz |
Mt |
g/t |
% |
Moz |
Mt |
g/t |
% |
Moz |
kt |
|
|
Stockpiles |
2.7 |
0.66 |
0.1 |
21 |
0.33 |
0.04 |
0.2 |
- |
- |
- |
|
24 |
0.37 |
0.05 |
0.3 |
11 |
Notes: Mineral Resources are reported as at 31 December 2025, grades are reported to two decimal places to reflect appropriate precision in the estimate, and this may cause apparent discrepancies in totals. Cutoffs for the Telfer MRE are applied based on a NSR using metal prices of A$4,200/oz Au and A$6.50/lb and current site cost and revenue assumptions.
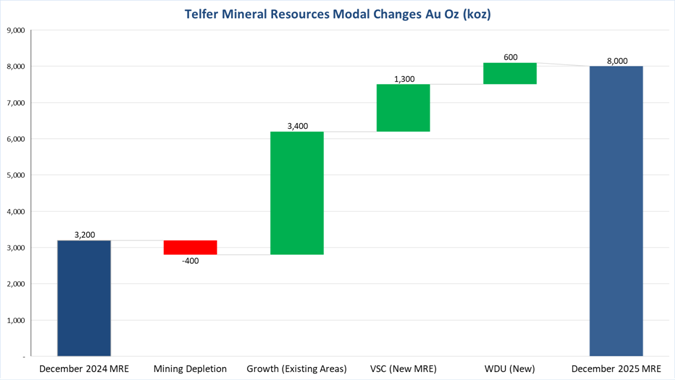
Comparison to previous Telfer MRE
Figure 6 below shows a comparison of the Telfer December 2025 MRE to the Telfer December 2024 MRE.
Figure 6: Waterfall chart of contained gold ounces reconciliation between Telfer December 2024 MRE & December 2025 MRE
Contact
For further information, please contact:
Greatland Resources Limited
Shaun Day, Managing Director | Andrew Bowler, Head of Investor Relations
Nominated Advisor
SPARK Advisory Partners
Andrew Emmott / James Keeshan / Neil Baldwin | +44 203 368 3550
Corporate Brokers
Canaccord Genuity | James Asensio / George Grainger | +44 207 523 8000
RBC Capital Markets | James Agnew / Jamil Miah | Scott Redwood | +44 207 029 0528
Media Relations
Australia - Fivemark Partners | Michael Vaughan | +61 422 602 720
About Greatland
Greatland is a gold and copper mining company listed on the Australian Securities Exchange and London Stock Exchange's AIM Market (ASX:GGP and AIM:GGP) and operates its business from Western Australia.
The Greatland portfolio includes the 100% owned Telfer mine, the adjacent 100% owned brownfield world-class Havieron gold-copper development project, and a significant exploration portfolio within the surrounding region. The combination of Telfer and Havieron provides for a substantial and long life gold-copper operation in the Paterson Province in the East Pilbara region of Western Australia.
Additional Information on the Telfer Mineral Resource Update
Telfer Gold-Copper Mine
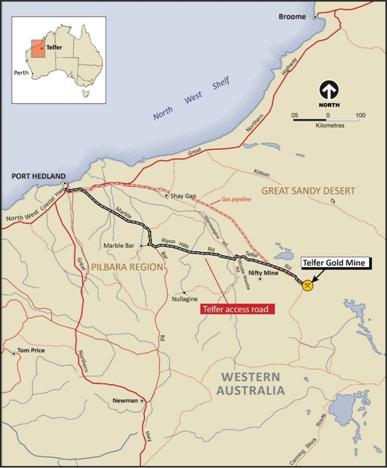
The Telfer gold-copper mine is 100% owned by Greatland and is located in the Paterson Province of the East Pilbara region in Western Australia, approximately 485 km by road south-east of Port Hedland (Figure 7). Telfer first produced gold in 1977 and has produced more than 15Moz of gold to date.
Telfer is a fly-in fly-out mine with both open pit and underground mining operations, an established workforce and significant infrastructure. Gold and copper are produced by a large processing facility comprising two 10Mtpa capacity trains, totalling 20Mtpa in nominal capacity, that produces gold doré and a copper-gold concentrate.
Ore from Telfer is currently being mined from the West Dome Open Pit and the Main Dome Underground mine. The Telfer Mineral Resources are located across mining leases M45/6, M45/7, M45/8 and M45/33.
Figure 7: Telfer mine location map
Drilling Overview
The December 2025 Telfer Mineral Resource Estimate (Table 1) incorporates all drilling available as at 31 December 2025 and comprises of Mineral Resources estimates from the West Dome Open Pit mine, West Dome Underground, Main Dome Underground mine, and already mined stockpiles.
Drill hole data for the current Telfer Mineral Resource Estimate areas is largely based on drilling completed from 1998 to 2025, with a total of 87,240 metres of additional reverse circulation (RC) and 46,566 metres of additional diamond drilling (DD) included since the previous December 2024 Telfer MRE. The new RC drilling has informed the West Dome open pit Mineral Resource Estimate while the additional diamond drilling has informed both the Main Dome and West Dome Underground Mineral Resource Estimates.
The West Dome Underground Mineral Resource Estimate has predominately been defined with NQ diamond drilling, with a total of 16 surface diamond holes and 33 underground diamond holes.
Drilling standards have changed over the history of the Telfer deposit, with historical drilling adopting protocols and standards consistent with industry practice at the time of the program. Early diamond drilling was predominantly NQ diameter but more recently has been a mixture of HQ & NQ diameter. Historic RC drilling used crossover subs with face sampling hammers used for later drilling programs.
Several different down hole survey methods were utilised at Telfer at different times of data collection. These included down hole electronic multi-shot camera, single shot camera, gyroscopic and Miniature Multi-shot Tool.
Multiple checks and validations are conducted on the drilling and sample data, with holes not meeting the set criteria excluded from the Mineral Resource estimation.
More recent drilling undertaken since Greatland's ownership has been conducted to a high standard, and the Competent Person is of the opinion that the data used to inform these Mineral Resource estimates is considered suitable and fit for purpose.
Mineralisation
Mineralisation within the Telfer deposit is controlled by structure and lithology. Several styles of mineralisation are present including narrow high-grade reefs, pod-like mineralised bodies, sheeted vein-sets, sulphide replacement and large areas of low grade stockwork mineralisation.
In the upper sequence the highest-grade gold and copper grades occurs within bedding sub-parallel reef systems (M Reefs), with reef systems being concordant to lithology, laterally extensive (>1km) both along strike and at depth. The thickness of these reefs varies from 0.1 to 1.2m while grade can also vary from 5g/t to 50g/t Au and 0.2% Cu and 1.5% Cu. This mineralisation has been targeted by both open pit and underground mining methods to date and form part of the West Dome Open Pit and Main Dome Underground Mineral Resource Estimates.
Within the lower sequence, bedding parallel reef systems still carry significant high-grade gold and copper mineralisation (A Reefs), while sulphide replacement within the Lower Limey Unit (LLU) also represent significant metal endowment with this unit averaging 0 8-10m thick and grading from 1-10g/t and 0.5-1.0% Cu. The LLU mineralisation form part of the Main Dome Underground and West Dome Underground Mineral Resource Estimates.
Stockwork mineralisation is present throughout the Telfer deposit (upper and lower sequence) and is characterised by narrow, often discontinuous veins that crosscut stratigraphy. Some stratigraphic units have more abundant stockworks than others (e.g. brittle sandstone units) and vein intensity within stockwork can be greater adjacent to reefs. Stockwork mineralisation can also include areas of breccia that are dominated by quartz, carbonate and sulphides characteristic of the VSC. Primary gold mineralisation is typically associated with pyrite/chalcopyrite sulphides and quartz/dolomite gangue. There is a correlation between vein frequency and gold grade.
Large domains of stockwork mineralisation have been defined in both the underground and open pits, within the axial zones within both the West Dome and Main Dome anticlines. Stockworks are laterally extensive, between 0.1km to 1.5km scale and the geometry of the stockwork zones is related to structure and stratigraphy. Stockwork mineralisation from part of all Mineral Resource estimates at Telfer (WDO, WDU, MDU).
Sampling Practices
Geologists define sample intervals to avoid crossing key geological boundaries and determine assay methods. Most Mineral Resource drilling used HQ3 core for surface, while NQ is more common in underground drilling programs. Samples, typically half-core, ranged from 20cm to 1m while RC drilling collected 1m samples, with 2-5kg sub-samples for fire assay. Recent West Dome surface RC drilling used 1m intervals for Resource drilling and 2m for Grade Control, with 3kg splits from a cone-splitter.
The geologist logging the core defines all sample intervals. Sample intervals do not extend across mineralised and important lithological contacts. The geologist also nominates the assay methodology. Resource development diamond drill core is sampled as half-core, while grade control are sampled as whole core. Samples are crushed, pulverised, and assayed for gold by Fire Assay and base metals by ICP. Cyanide-soluble copper was tested via bottle roll leach with AAS analysis. Samples are processed at either the Telfer site laboratory or certified external laboratories.
Assay quality control protocols have followed evolving industry standards from 1998-2025, with rigorous procedures including certified reference material submission, coarse blanks, umpire laboratory checks, duplicate comparisons, and unannounced lab inspections. Regular monitoring and reporting ensure assay reliability, with only a small percentage of samples requiring re-assay due to potential bias or imprecision. While occasional batch-specific issues arise, corrective actions are taken, and overall data confirms confidence in assay results.
Resource Estimation & Classification
West Dome Open Pit and the Main Dome Underground Mineral Resources have been estimated through a combination of ordinary kriging (OK) or multiple indicator kriging (MIK) techniques depending on the mineralisation style. The background stockwork mineralisation is estimated by MIK while reef and vein style mineralisation is estimated through OK. The estimation methodology for VSC uses an indicator kriging approach to define the proportion of higher and lower grade gold (Au) mineralisation, where the nominal grade threshold used to define higher grade mineralisation is 0.6ppm Au. Ordinary Kriging is then used to separately estimate the Au grade of the higher and lower grade components, and an average grade of the two Au estimates is then calculated by weighting these using their respective proportions. In the West Dome Underground, OK was identified as the most appropriate method of estimation for both gold and copper in the LLU and western stockwork corridor (WSC) domains. Further details on the estimation methodology are provided in Appendix 1.
The Mineral Resource estimates have been constrained using appropriate drill hole data spacing parameters and geological control. Resource classification is based on a combination of geological confidence, average weighted distance and slope of regression statistics for estimated gold grades, and economic constraints (NSR).
The NSR cutoff for the December 2025 Telfer MRE uses the following economic assumptions:
§ West Dome Open Pit: Metal prices of A$4,200/oz Au and A$6.50/lb Cu, costs are reviewed annually and include mining, treatment and refining costs, payables, royalties and uses metallurgical recoveries that are well understood and vary based on ore type, oxidisation state and geochemical characteristics, with average recoveries assumption of 77% for Au and 74% for Cu.
§ Main Dome, VSC and West Dome Underground: Metal prices of $4,200/oz Au and A$6.50/lb Cu, with the MRE reported representing multiple mineralised lodes that have different cost profiles based on the selected mining approach. For the December 2025 Telfer MRE update the NSR cutoffs applied to the underground ranged from $70-113/tonne. The inputs to these cutoffs are reviewed annually and include mining, treatment and refining costs, payables, royalties and uses metallurgical recoveries that are well understood and vary based on ore type with recoveries assumption ranging from 75-97% for Au and 68-98% for Cu.
Reasonable prospects for eventual economic extraction have been assessed through evaluating active mining and processing practices and costs that support the assumptions used in defining economic constraints for the Mineral Resources. There are no known environmental, social, governmental / regulatory or legal barriers to declaring this Mineral Resource.
Comparison to Telfer's Previous Mineral Resource Estimate (Telfer December 2024 MRE)
The previous Mineral Resource Estimate for Telfer was reported by Greatland as at 31 December 2024.
In the West Dome Open Pit, the Mineral Resource was previously spatially constrained by an optimisation shell based on A$3,450/oz gold and A$5.30/lb copper prices and all cost and revenue assumptions to identify potentially economic material were included in defining the NSR cutoff.
In the Main Dome Underground, the Mineral Resource estimate was also previously spatially constrained by the detailed economic evaluations (using MSO "mineable stope optimisers") to spatially define potentially economic material using A$3,150/oz and A$5.30/lb copper prices.
For the December 2025 MRE for Telfer, the following material changes were made:
§ Update metal price assumptions to A$4,200/oz gold and A$6.50/lb copper, in the context of current spot prices of approximately A$6,500/oz gold and A$8.00/lb copper.
§ Updated cost and revenue assumptions based on CY25 actual operating costs.
§ Addition of the West Dome Underground MRE.
§ Addition of the VSC "vertical stockwork corridor" MRE.
§ Depletion of active mining areas and stockpiles.
Figure 8 Telfer MRE waterfall chart showing tonnage reconciliation between the December 2024 MRE and December 2025 MRE for Telfer
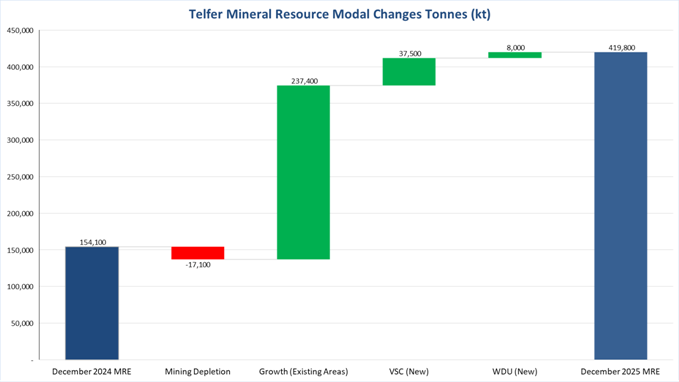
Figure 9: Telfer MRE waterfall chart showing contained gold ounces reconciliation between the December 2024 MRE and December 2025 MRE for Telfer

Group Mineral Resources Statement
Greatland's combined total 2025 Mineral Resource has increased to 550Mt @ 0.84g/t Au and 0.12% Cu, for 14.9Moz gold and 645kt copper, consisting of the December 2025 Telfer MRE and the previously reported December 2023 Havieron MRE for the 100% owned Havieron development project.
There has been no material change to the Havieron MRE published by Greatland on 30 May 2025 - please refer to Greatland's prospectus published on 30 May 2025 for further details.
Table 6: 2025 Telfer & Havieron Mineral Resource Statement
|
Area |
Measured |
Indicated |
Inferred |
Combined |
||||||||||||
|
Tonnes |
Au |
Cu |
Tonnes |
Au |
Cu |
Au |
Tonnes |
Au |
Cu |
Au |
Tonnes |
Au |
Cu |
Au |
Cu |
|
|
Mt |
g/t |
% |
Mt |
g/t |
% |
Moz |
Mt |
g/t |
% |
Moz |
Mt |
g/t |
% |
Moz |
kt |
|
|
Havieron |
|
|
|
50 |
2.56 |
0.33 |
4.1 |
81 |
1.09 |
0.13 |
2.8 |
131 |
1.65 |
0.21 |
7.0 |
275 |
|
Telfer |
||||||||||||||||
|
West Dome Open Pit |
- |
- |
- |
102 |
0.46 |
0.05 |
1.5 |
235 |
0.45 |
0.04 |
3.4 |
338 |
0.45 |
0.04 |
4.9 |
149 |
|
Main Dome Underground |
- |
- |
- |
7.8 |
2.28 |
0.45 |
0.6 |
4.4 |
1.90 |
0.33 |
0.3 |
12.3 |
2.14 |
0.41 |
0.8 |
50 |
|
Main Dome UG VSC |
- |
- |
- |
33 |
1.11 |
0.32 |
1.2 |
4.2 |
0.97 |
0.40 |
0.1 |
37.5 |
1.09 |
0.33 |
1.3 |
125 |
|
West Dome Underground |
- |
- |
- |
3 |
2.29 |
0.48 |
0.2 |
5.1 |
2.30 |
0.42 |
0.4 |
8 |
2.30 |
0.44 |
0.6 |
35 |
|
Stockpiles |
2.7 |
0.66 |
0.1 |
21 |
0.33 |
0.04 |
0.2 |
- |
- |
- |
- |
24 |
0.37 |
0.05 |
0.3 |
11 |
|
Combined |
2.7 |
0.7 |
0.1 |
217 |
1.12 |
0.18 |
7.8 |
330 |
0.66 |
0.08 |
7.0 |
550 |
0.84 |
0.12 |
14.9 |
645 |
Notes: Mineral Resources are reported as at 31 December 2025, grades are reported to two decimal places to reflect appropriate precision in the estimate, and this may cause apparent discrepancies in totals. Cutoffs for the Telfer MRE are applied based on a NSR using metal prices of A$4,200/oz Au and A$6.50/lb and current site cost and revenue assumptions. Cutoffs for the Havieron MRE was based on a NSR using metal prices of A$2,360/oz Au and A$5.20/lb Cu.
Table 7: 2025 O'Callaghans Mineral Resource Statement
|
Classification |
Tonnes |
Tungsten Trioxide (WO3) |
Copper |
Zinc |
Lead |
||||
|
Mt |
Grade % |
Metal kt |
Grade % |
Metal kt |
Grade % |
Metal kt |
Grade % |
Metal kt |
|
|
Indicated |
65 |
0.35 |
232 |
0.30 |
195 |
0.58 |
358 |
0.28 |
176 |
|
Inferred |
4 |
0.31 |
14 |
0.28 |
12 |
0.39 |
13 |
0.19 |
7 |
|
Total |
70 |
0.35 |
246 |
0.30 |
207 |
0.57 |
371 |
0.28 |
182 |
Notes: Mineral Resources are reported as at 31 December 2025, grades are reported to two decimal places to reflect appropriate precision in the estimate, and this may cause apparent discrepancies in totals. Cutoffs for the O'Callaghans MRE are applied based on a NSR using metal prices of US$25.74 lb W (equivalent to ~US$450/MTU APT), US$4.54 lb Cu, US$1.27 lb Zn and US$0.93 lb Pb.
Refer to the 'December 2025 O'Callaghans Mineral Resource Statement' announcement released on 30 March 2026 for full detail regarding the O'Callaghans December 2025 Mineral Resource.
Forward Looking Statements
This document includes forward looking statements and forward looking information within the meaning of securities laws of applicable jurisdictions. Forward looking statements can generally be identified by the use of words such as "may", "will", "expect", "intend", "plan", "estimate", "anticipate", "believe", "continue", "objectives", "targets", "outlook" and "guidance", or other similar words and may include, without limitation, statements regarding estimated reserves and resources, certain plans, strategies, aspirations and objectives of management, anticipated production, study or construction dates, expected costs, cash flow or production outputs and anticipated productive lives of projects and mines.
These forward looking statements involve known and unknown risks, uncertainties and other factors that may cause actual results, performance and achievements or industry results to differ materially from any future results, performance or achievements, or industry results, expressed or implied by these forward-looking statements. Relevant factors may include, but are not limited to, changes in commodity prices, foreign exchange fluctuations and general economic conditions, increased costs and demand for production inputs, the speculative nature of exploration and project development, including the risks of obtaining necessary licences and permits and diminishing quantities or grades of reserves, political and social risks, changes to the regulatory framework within which Greatland operates or may in the future operate, environmental conditions including extreme weather conditions, recruitment and retention of personnel, industrial relations issues and litigation.
Forward looking statements are based on assumptions as to the financial, market, regulatory and other relevant environments that will exist and affect Greatland's business and operations in the future. Greatland does not give any assurance that the assumptions will prove to be correct. There may be other factors that could cause actual results or events not to be as anticipated, and many events are beyond the reasonable control of Greatland. Forward looking statements in this document speak only at the date of issue. Greatland does not undertake any obligation to update or revise any of the forward looking statements or to advise of any change in assumptions on which any such statement is based.
Competent Person Statement
The information in this announcement pertaining to estimation and reporting of the Mineral Resource estimates is based on, and fairly reflects, information and supporting documentation compiled under the supervision of Michael Thomson, Principal Geologist at Greatland. Mr Thomson is a full-time employee of the Greatland Group and has a financial interest in the Company. Mr Thomson is a member of the Australian Institute of Geology (AIG) and has over 20 years' relevant industry experience. Mr Thomson has sufficient experience that is relevant to the style of mineralisation and type of deposits under consideration and to the activity currently being undertaken to qualify as a Competent Person as defined in the 2012 Edition of the 'Australasian Code for Reporting Exploration Results, Mineral Resources and Ore Reserves'. Mr Thomson consents to the inclusion in this announcement of the matters based on that information and supporting documentation in the form and context in which it appears.
Appendix 1: JORC Tables
JORC Code, 2012 Edition - Table 1 Section 1: Sampling Techniques and Data
|
Criteria |
Commentary |
|
Sampling techniques |
Resource definition drilling at Telfer involves a combination of reverse circulation (RC) and diamond drilling throughout the mining period. For diamond drilling, samples are taken according to lithological boundaries, with logging geologists defining sample intervals and selecting the appropriate analytical methodology. Historically, high-grade reef samples were sent for screen fire assay, with selected intervals also analysed for a multi-element suite to support with geological domaining and resource modelling. Core diameters for resource drilling typically range from NQ to PQ, while smaller sizes (BQ or LTK60) are used for specific applications. Diamond core is sampled to lithological units with lengths between 0.2 to 1.2 metres; 1-metre intervals being most common. Core samples are placed into pre-numbered calico bags and submitted to a certified laboratory for analysis. Historically, RC drilling typically produced nominal 1-metre samples, from which a 2-5 kg sub-sample was taken using a riffle splitter and subsequently pulverized for gold assay. Earlier RC drilling collected samples from 0.5-metre to 2-metre intervals, with the shorter intervals targeting reef positions. Current RC resource definition drilling collects 1-metre intervals using a cone splitter from which a 2-5 kg sub-sample is taken. Grade control drilling collects 2-metre intervals from the cone splitter. Field duplicates are routinely collected at a ratio of 1:20 as part of the QAQC protocol. Rock chip samples are manually collected from exposed development faces. Samples typically weigh 2-3 kg and are systematically taken perpendicular to bedding to ensure representative coverage of all relevant domains (reef, hanging wall, footwall). Samples are placed in pre-numbered calico bags and submitted for laboratory analysis. |
|
Drilling techniques |
Drilling at the Telfer has evolved over time, following industry-standard protocols. Prior to 1998, RC drilling targeted mainly previously mined areas. Between 1998 and 2002, diamond drilling formed the primary data source for Mineral Resource estimates, supplemented by RC drilling. Currently, RC drilling is the primary data source for the open pit resources and diamond drilling for underground resources. The dominant diamond drill size is NQ2 and RC drilling is drilled with a pre-collar of 143mm, reducing to 134mm diameter. Additional core sizes, including NQ, HQ, HQ3, LTK60, and limited PQ and BQ, have also been used at Telfer. LTK60 and BQ have primarily been used for grade control purposes. Diamond core orientation is undertaken using a Reflex orientation tool. All core is oriented and marked at the drill rig using the Ezy-Mark system to mark the bottom of hole reference line. Core is subsequently reconstructed in V-rail cradles, where a continuous orientation line is marked along the length of the core for structural and geological logging. |
|
Drill sample recovery |
Diamond core recovery is systematically measured and recorded by the drill contractor, identified with core blocks inserted at the end of each core run. Core recovery is verified by geological staff through the comparison of recovered core lengths against drilled intervals. Recovery data is entered into the geological database. Core recovery is generally high and deemed sufficient to demonstrate geological continuity for a mineral resource estimate. Where significant core loss is identified within mineralised intervals, follow-up wedge holes may be drilled to recover the affected interval. A review undertaken in 2019 confirmed no significant relationship between sample recovery and grade for either core or RC samples, with high core recovery minimizing potential loss effects. For RC drilling, sample recovery is monitored at the rig. RC samples are routinely weighed at the drill rig to monitor consistency of sample return and support confidence in representativity appropriate for mineral resource estimation. |
|
Logging |
Geological logging is completed for all diamond and reverse circulation (RC) drill holes. Logging captures lithology, alteration, mineralisation, veining, weathering and other relevant geological features. Structural measurements are recorded in oriented diamond core. Diamond drill holes are logged both quantitatively and quantitatively, including recording of vein type, vein density (percentage), vein orientation and structural features. All diamond drill core is photographed prior to sampling using digital cameras (historically film), providing a permanent visual record of the core. Rock Quality Designation (RQD) is routinely recorded, with around 900 diamond holes geotechnically assessed. All geological logging data are entered into the site geological database and validated before merging into the database. The database currently contains in excess of 1,000 km of logged geology, representing approximately 80% of total drilling completed at Telfer. The level of geological and geotechnical logging detail is considered appropriate to support mineral resource estimation and associated technical studies. |
|
Sub-sampling techniques and sample preparation |
Sampling and quality control procedures at Telfer are designed to ensure representativity for the material being tested. Geologists mark sample intervals to avoid crossing key lithological contacts. Analytical methods are chosen based on lithology and mineralisation style. Diamond core is typically sampled as half-core using a diamond saw with the remaining half retained for reference. Whole core sampling is predominantly conducted on grade control diamond drilling. RC samples are collected dry, with sample conditions (moisture) recorded in the database. Since 2015, cone splitters have replaced riffle splitters for RC sampling to collect a primary 2-3 kg split from each sample. Core and RC samples are prepared at either the Telfer laboratory or offsite at an accredited commercial laboratory. Samples are dried, crushed, sub split and pulverized. Historical preparation standards typically achieve approximately 90% passing 75 µm. Current preparation pulverise the sample to achieve 95% passing 106 µm. Gold is analysed via 30 g fire assay, while multi-element analysis (including base metals, sulphur, and arsenic) undergo a four-acid digest followed by ICP determination. Cyanide-soluble copper is determined by bottle roll leach with AAS analysis. Site QAQC procedures require at least 1 in 20 samples to be submitted for external laboratory verification to monitor analytical accuracy and laboratory performance. |
|
Quality of assay data and laboratory tests |
Assay and quality control protocols at the Telfer deposit have evolved to align with industry standards. Prior to 1998, quality control procedures followed industry norms of the time, with no major concerns identified. Since 1998, protocols were enhanced, particularly during prefeasibility and feasibility studies conducted between 1998 and 2002. Samples are prepared either at the Telfer laboratory or external commercial laboratories. Currently, all resource definition samples have been assayed through a combination of the Telfer Laboratory, Intertek and Bureau Veritas (BV) commercial laboratories in Perth. All grade control samples have been sent through Telfer Laboratory. Gold is analysed using fire assay, while multi-element analyses-including silver, arsenic, bismuth, copper, iron, nickel, lead, sulphur, and zinc-are determined using ICP techniques. Cyanide-soluble copper is assessed via bottle roll leach with AAS analysis. Since 1998, comprehensive quality control measures have been in place, including the use of Certified Reference Materials (CRMs), blanks, duplicate assays, blind pulp re-submissions and checks at independent laboratories. Matrix-matched CRMs were introduced in 1999, and transition to multi-client CRMs in 2018. Since 2000, Telfer's laboratory was managed by commercial organisations. The recommencement of mining in 2002 saw management of the laboratory by Newcrest and now Greatland. Regular reviews of Quality Assurance and Quality Control (QAQC) procedures, including sample resubmissions and bias assessments, help ensure data accuracy and reliability. Monthly reports document any anomalies, with corrective actions taken as needed. Comparison studies, including analyses of duplicate pulp samples sent to external laboratories, confirm data precision, with a 90% repeatability rate. The QAQC protocols and assay techniques used are considered reliable for Mineral Resource estimation. |
|
Verification of sampling and assaying |
Drill hole data is securely stored in an acQuire database, with stringent controls to ensure data integrity and prevent errors or duplication. Data collection, including collar coordinates, drill hole designation, logging, and assaying, follows strict protocols to maintain accuracy. Validation involves multiple stages, with input from geologists, surveyors, assay laboratories, and down-hole surveyors where applicable. Data entry has evolved from manual methods to direct digital input, incorporating automated validation checks. Internal and external reviews further enhance data quality before mineral resource estimation. Resource data is managed daily by site geologists, with additional verification by a centralised resource team. Sampling details are recorded digitally, utilising tracking systems to monitor sample integrity throughout the process. Recent drilling programs employ numbered calico bags for tracking consistency. Regular audits of both internal and commercial laboratories ensure compliance with quality standards. No assay data adjustments have been made in the Mineral Resource estimate. |
|
Location of data points |
Mining operations at Telfer adhere to periodic reporting requirements for the WA Department of Local Government, Industry Regulation and Safety (LGIRS), using the MGA2020/AHD coordinate system for official submissions. However, site operations utilise the Telfer Mine Grid (TMG) and Telfer Height Datum (THD), requiring coordinate transformations between the national and operational coordinate systems. Coordinate transformation data has been supplied by AAM Surveys in 1995 (AMG84 to Telfer Mine Grid) and AAMHATCH in February 2007 (Telfer Mine Grid to MGA Transformation). Both reports also addressed the height datum and in 2007 established the THD=AHD + 5193.7m. A local grid covers the whole of the Telfer mine area (Telfer Mine Grid 2002). It is oriented with grid north at 44 03'12" west of magnetic north. Topographic control is maintained through a combination of surface and aerial surveys, with routine updates for pits and underground voids. Drill hole collars are surveyed upon completion by mine surveyors. The natural surface topography, along with current pit surveys and underground voids (development, stopes and vertical openings) are used to deplete the resources and account for changes in mining areas at Telfer. Downhole survey methods have evolved over time, progressing from early single-shot cameras to modern electronic tools. Currently, drilling programs include multi-shot surveys at regular intervals, with post-completion continuous down hole surveys conducted at finer resolutions. Specific drilling campaigns may incorporate gyroscopic surveys where required. Routine in-pit drilling, particularly for pre-production and grade control, typically excludes downhole surveys, relying on collar surveys for accuracy. |
|
Data spacing and distribution |
The drill hole spacing is sufficient to demonstrate geological continuity appropriate for the mineral resource and the classifications applied under the 2012 JORC Code. The drill spacing applied to specific domains within the overall resource is variable and is considered suitable for the style of mineralisation and mineral resource estimation requirements. |
|
Orientation of data in relation to geological structure |
The Telfer mine site topography is dominated by two large scale asymmetric dome structures with steep west dipping axial planes. Main Dome is in the southeast portion of the mine and is exposed over a strike distance of 3 km north-south and 2 km east-west before plunging under transported cover. West Dome forms the topographical high in the northwest quadrant of the mine and has similar dimensions to Main Dome. Both fold structures have shallow to moderately dipping western limbs and moderate to steep dipping eastern limbs. Surface drilling is orientated to ensure optimal intersection angle for the reefs and stockwork corridors. Underground drilling orientation may be limited by available collar locations, but acceptable intersection angles are considered during the drill hole planning process. No orientation bias has been indicated in the drilling data. |
|
Sample security |
Sample security is maintained through a tracking system from drilling to database entry. While barcoding was previously used, it has been replaced with pre-numbered calico bags for surface and underground drilling samples. All sample movements, including dispatch details, drill hole identification, sample ranges, and analytical requests, are recorded in a database. Any discrepancies identified upon receipt by the laboratory are validated to ensure data integrity. |
|
Audits or reviews |
In-house reviews of data, QAQC results, sampling protocols and compliance with corporate and site protocols are carried out at various frequencies by company employees not closely associated with the Telfer projects. Procedure audits and reviews are carried out by corporate employees during site visits. |
JORC Code, 2012 Edition - Table 1 Section 2: Reporting of Exploration Results
|
Criteria |
Commentary |
|
Mineral tenement and land tenure status |
Mining and ore processing at Telfer operate under granted mining leases and exploration licenses covering all key infrastructure, including open pits, underground resources, processing facilities, waste storage, and support services. The Telfer Main Dome underground mineral resource is within mining leases M45/6 and M45/8, while the West Dome mineral resource, approximately 3 km northwest of the Main Dome open pit, lies within leases M45/7 and M45/33. An Indigenous Land Use Agreement (ILUA) has been in place since December 2015, covering all operational aspects of the site. |
|
Exploration done by other parties |
The Telfer district was first geologically mapped by the Bureau of Mineral Resources in 1959, though no gold or copper mineralization was identified. In 1971, regional sampling by Day Dawn Minerals NL detected anomalous copper and gold at Main Dome. From 1972 to 1975, Newmont Pty Ltd conducted extensive exploration and drilling, defining an open pit reserve primarily in the Middle Vale Reef. In 1975, BHP Gold acquired a 30% stake in the project, and in 1990, Newmont and BHP Gold merged their Australian assets to form Newcrest Mining Limited. Newcrest managed exploration and resource drilling from 1990 until its acquisition by Newmont Corp on November 6, 2023. Newmont later divested Telfer, selling it to Greatland Gold on December 4, 2024, which now oversees exploration and drilling activities. |
|
Geology |
Telfer is located within the northwestern Paterson Orogen and is hosted by the Yeneena Supergroup, a 9 km thick sequence of marine sedimentary rocks. Gold and copper mineralisation forms in stratiform reefs and stockworks within the Malu Formation of the Lamil Group, controlled by both structure and lithology. Mineralisation styles include high-grade narrow reefs, reef stockwork corridors, sheeted vein sets, and extensive low-grade stockwork, which forms most of the sulphide resource. Sulphide mineralisation consists mainly of pyrite and chalcopyrite, with copper minerals including chalcopyrite, chalcocite, and bornite. Gold is primarily free-grained or associated with sulphides and quartz/dolomite gangue. A correlation exists between vein density and gold grade. The highest gold and copper grades occur within bedding sub-parallel reef systems, including multiple reef structures in Main Dome, such as E-Reefs, MVR, M10-M70 reefs, A-Reef, and B-Reefs (notably B30). Additional mineralisation occurs in northwest-trending and north-dipping veins. Stockwork mineralisation, found in open pits, Telfer Deeps, and the Vertical Stockwork Corridor (VSC), is best developed in the axial zones of Main Dome and West Dome, often extending over large areas (0.1 km to 1.5 km). It can include brecciated zones filled with quartz, carbonate, and sulphides. |
|
Drill hole Information |
Not applicable to the mineral resource estimate. |
|
Data aggregation methods |
Significant assay intercepts are reported using length-weighted averages based on predefined thresholds, with a maximum allowable internal dilution. For mineral resource estimates, data aggregation methods are aligned with sampling, drilling, and recovery techniques. No exploration results are included in this report, as it focuses on Mineral Resources. |
|
Relationship between mineralisation widths and intercept lengths |
No exploration has been reported in this release, therefore there are no relationships between mineralisation widths and intercept lengths to report. This section is not relevant to this report on Mineral Resources. |
|
Diagrams |
As provided |
|
Balanced reporting |
Significant assay intervals represent apparent widths, as drilling is not always perpendicular to the dip of mineralisation. True widths are typically less than downhole widths and can only be estimated once all results are received and final geological interpretations are completed. No exploration results are included in this report, so relationships between mineralisation widths and intercept lengths are not applicable to the Mineral Resources report. |
|
Other substantive exploration data |
Not applicable to the mineral resource estimate. |
|
Further work |
Further work is planned to evaluate exploration opportunities that extend the known mineralisation and to improve confidence of the model. |
JORC Code, 2012 Edition - Table 1 Section 3: Estimation and Reporting of Mineral Resources
|
Criteria |
Commentary |
|
Database integrity |
Data is stored in a SQL Server database known as acQuire. Assay data and geological data are electronically loaded into acQuire and the database is replicated in Greatland's centralised database system. Regular reviews of data quality are conducted by site and corporate teams prior to mineral resource estimation. Validation checks include but are not limited to: · Duplicate drill hole identifier. · Overlapping FROM and TO intervals values in the geology, oxidation state, assay, density, core size, and recovery tables. · Duplicate records. Other checks made outside the SQL environment include but are not limited to: · Down hole survey dip and bearing angles appear reasonable. · All collar co-ordinates were within the permit area. · Any anomalous assay, density or sample recovery values. |
|
Site visits |
The Competent Person for Telfer mineral resources regularly visits the site. |
|
Geological interpretation |
MDU Block Model The MDU Block Model wireframe interpretations were constructed in Leapfrog software using implicit modelling interpolations from primary logging codes extracted from the Acquire database. The Main Dome Underground model now includes the M-Reef horizons (from M52 downward), the A Reefs horizons, I30T, Kylo, B30 Reef, LLU (including the I30 Reef), Rey LLU and Rey AR, Oakover Vein, Wedge, North Finn, Vertical Stockwork Corridor (VSC) and intervening Stockwork mineralisation. The Lower M Reefs comprise both intermittent reef but more significantly zones of stockwork mineralisation, as such each of these are modelled as mineralised corridors. The same approach has been applied to the A Reef interpretation, five corridors of reef and stockwork mineralisation have been recognised, these are A95, A80, A75, A70, A50 and A35. Kylo comprises of high-grade mineralized breccia\stockwork that's stratabound above LLU and below A35. In the south-eastern LLU, additional monocline thrust structures have been identified and offset and dilate the eastern limb stratigraphy, specifically the hanging wall of the LLU and the A Reef stratigraphic layers. High-grade veining has formed in the dilation zone and two domains have been interpreted to capture this mineralisation Rey LLU and Rey A-Reefs. Potential to mine semi-bulk stopes in the Middle Stockwork lead to a re-interpretation of the mineralisation in this area. Regional NW fault zones trend across the Main Dome, slip along the LLU and B30 Reef has caused rotation of the Middle Stockwork unit allowing dilation along the NW fault zones and deposition of Au & Cu bearing fluids. Collectively these are known as the North West HG Veins (NWHGV). Only one NWHG Vein is domained stand alone and that is Finn North. The VSC corridor is separated into two sub-domains differentiating the high grade VSC Monocline related mineralisation and the deeper VSC Lower which is characterised by a zone of broader low-grade mineralisation surrounding a series of discrete higher-grade shears. The VSC corridor has been split into the two domains based off geology, grade statistics and orientation of mineralisation. The VSC Monocline (above B30) is represented by high grade and highly variable gold representing several overprinted mineralisation events. The monocline orientation flattens from ~70-50 degrees. Immediately below the B30, the VSC Lower represents a broadening and less defined structural corridor with lower grade and a decrease in stockwork mineralisation and intensity. With depth the VSC corridor gradually narrows into a more defined structural corridor, sulphide and brecciation increases. Discrete higher-grade shears are present throughout the VSC Lower corridor. The LLU is a mineralised stratigraphic layer that is guided by the well know dome-shaped stratigraphy in Main Dome and monocline structure. The western limb of the mineralised Lower Limey Unit (LLU) west of the SLC mine is the target of bulk stoping in mining areas called Western Flanks and Tarkin. This interpretation is based primarily on drill core and a minor Sirovision mapping from the periphery of SLC and WF development drives. ESC The Eastern Stockworks Corridor (ESC) geology and mineralisation model has been interpreted by experienced company geologists familiar with the Telfer system. The ESC is located within the Upper Malu Member (UMM) on the eastern side of the Main Dome and is hosted in brittle meta-sandstone (quartzite) situated between silty reef units within the Monocline thrust system. The structural setting is defined by steep to sub-vertical bedding, with mineralisation dominated by shallow west-dipping veins that gently plunge north. Higher-grade mineralisation is typically associated with these shallow-dipping vein sets, surrounded by lower-grade background mineralisation within the host rock. The Monocline structure is interpreted as a fluid pathway, with mineralisation influenced by reactivated faulting and rheological contrasts between ductile silty reefs and brittle quartzite. Alteration is characterised by strong albite and moderate sericite, associated with Fe-S-Cu hydrothermal fluids and enrichment in key elements. M-Reef Block Model The Upper M Reefs (M20 to M50) are largely strataform, interpretation is guided by the well-known dome shape stratigraphy. The Upper M-Reef mineral resource consists of discrete reef wireframes constructed in Vulcan using Sirovision mapping, wall mapping and sampling data from development drives, and from drill hole intercepts. The thickness of the reef is honoured as far as practicable in the interpretation process. West Dome Open Pit Block Model The Telfer West Dome Resource model was estimated in March 2026 with the addition of RC and Diamond drilling results. In doing this, it has led to a change in the domain boundaries from the previous model. The March 2026 West Dome Mineral Resource estimates were domained on geological, mineralisation and structural information. The primary estimation domains are based on stratigraphy. One of the changes in the March 2026 West Dome Open Pit Model is the E-Reef have been separated into two continuous individual reefs throughout the previous E-Reef stockwork corridor with e-reef stockwork domain still valid but a lot lower in grade. The M-Reefs domains in West Dome they have been interpreted as reef/stockwork corridors from drill hole intercepts. The thickness of the reef is honoured as far as practicable in the interpretation process and within the database, defined by intercept domains. The M-Reefs are largely strataform, interpretation is guided by the well-known dome shape stratigraphy. The Leeder Hill Veins are sub-vertical veins sets that run west to east across the West Dome Resource. They vary in thickness from 1-10cm in thickness and can appear as individual veins or vein sets. West Dome Underground The West Dome Underground Resource Model geological interpretation is based on lithology, mineralisation and structural information in Leapfrog Implicit modelling software. The model contain four domains the West Dome Lower Limey Unit (WLLU), Western Hinge Stockwork (WHinge Stkwk), Far West Stockwork and Background Stockwork domain. The WLLU is based on logged stratigraphy and is distinct calcareous sandstone layer that hosts most of the high-grade mineralisation. It is tightly folded on the western limb and a more open fold on its eastern limb. The Western Hinge Stockwork is a vertical mineral stockwork running through the hinge of the Western Hinge of the WLLU and is structurally controlled it is lower in grade in comparison to the WLLU but is a larger mineralised domain that extent is still open. The Far West Stockwork is a mineralised stockwork domain that is lower grade. |
|
Dimensions |
The maximum extent of the Telfer Mineral Resource is approximately 5km x 1.5km x 1840m over the two dome complexes. |
|
Estimation and modelling techniques |
Main Dome Underground Block Model: Drill data used for the MDU December 2025 resource estimate include underground diamond drilling and resource definition reverse circulation drilling. Three composite databases were compiled for each element from the raw assay database using 4m composite lengths for bulk domains e.g. Oakover, VSC, LLU, general stockwork, 2m composite length for more discrete domains like Lower M-Reefs, A-Reefs, Kylo and Rey Domains and copper specific 4m composite that's coded for copper. The databases use all available resource definition drill data and the 3-D wireframes from the interpreted geological model. Many of the wireframe volumes overlap, reflecting the overprinting nature of various mineralising events at Telfer. A priority sequence was developed where the main mineralised reef structures were prioritised over bulk domains and background stockwork mineralisation. The majority of the raw assay file contains 1 or 2m assay intervals. Boundary contact analyses were undertaken on all stratigraphic and mineralised domains. The result of this analysis forms the basis for the majority of the stockwork sub-domaining decisions for the project. The analyses were conducted using both the 4m and 2m downhole composites for gold and copper. The boundary analyses for both elements (Au and Cu) reveal that most of the domain boundaries are hard and are accordingly estimated independently. Exploratory data analysis was undertaken on the bulk and discrete domains with a statistical summary, by domain, of the DDH and RC 4m and 2m composite data for gold, copper, sulphur, arsenic, and cobalt. Statistical reviews indicate that the VSC Monocline and Stockwork domains have highly variable distributions. Ordinary Kriging is considered to be sub-optimal for estimating such highly variable material without the need for aggressive top-cuts, due to the potential over-representation of the extreme end of the data distribution. A non-linear method such as Multiple Indicator Kriging (MIK) is considered to be better suited for dealing with these highly variable data sets. MIK was used to estimate gold and copper grade in the VSC Monocline and most of the stockwork domains (exception is the middle stockwork domains). The MIK estimate is e-type that directly estimates the model blocks with the average grade of the cumulative distribution. The Lower VSC is estimated using a high grade\low grade indicator approach and the estimate is combined for final gold grade. The threshold for the high grade\low grade indicator is 0.6Au g/t. The variography was done on sub-populations individually. This was to account for the high grade en-echelon pods that were identified within the VSC breccia. The rest of elements are estimated by OK. Top cutting (capping) was applied where appropriate for the OK estimations. Metal at risk analysis was completed to inform the capping grades. The non-economic elements are all estimated by ordinary kriging in all domains. Cyanide soluble copper, sulphur, arsenic and cobalt variogram models were generated by transforming the data to Gaussian space and back transforming the resulting variogram model to raw space, as no robust experimental variography could be obtained in raw space alone. All sills have been normalised to 1. The local varying anisotropy (LVA) rotation functionality provided by Vulcan was used during OK and MIK estimation for the A-Reefs, LLU and B30 domains. For each target block, a unique rotation can be set and used to control both the variogram model and search neighbourhood rotation. These orientations are derived from smoothed interpretations of the main stratigraphic surfaces that define the overall geometry of the Main Dome anticline as applied to the stratigraphically aligned mineralisation. Upper M-Reef Block Models Modelling of the reef volume / thickness for all reefs was determined using a calculated hanging wall surface from reef domain intercepts. The vertical and true width were determined using a dynamic anisotropy model of the footwall and determining the reef dip and azimuth and calculating a vertical width and true width. Drill data used for the estimate included underground diamond drilling, resource definition reverse circulation drilling and underground production face samples with interpreted resource definition mineralisation surfaces. Grade composites were determined by vertical reef grade accumulates as the reef thickness varies between 0.01m to approximately 2.0m therefore a single composite was generated for each reef intercept. Grade accumulates were generated for gold, copper, cyanide soluble copper and sulphur, silver, arsenic, cobalt and lead and determined by grade x width. The data was then transformed into 2 dimensions and projected to a planar surface. Exploratory data analysis (EDA) and variography analysis was conducted. Grade sensitivity tests were completed for each metal accumulate for each reef and a high- and low-grade indicator was determined for the majority of the reefs and elements. The composite files were then flagged for the indicators and indicator variograms compiled. An Ordinary Kriged indicator model was estimated and for each reef estimation block, a high grade and low-grade proportion determined. Variogram analysis for the metal accumulates was completed at the indicator thresholds along with a review of the metal at risk for each reef and element. Gold mineralisation anisotropy is consistent for all the reefs aligned northeast, whereas copper, cyanide soluble copper and sulphur is less consistent between reefs and can lie along either the northeast trend similar to the gold trend or to the northwest along the dome hinge axis. Ordinary Kriging was used for estimation of the metal accumulates in 2D space for both the high- and low-grade indicator domains for each reef. Then using the high grade and low-grade block proportions, an overall grade was determined for each block estimate for each element. Block grade estimates were then translated back into 3-dimensional resource block models defined by the footwall and hanging wall surfaces of the reef. The 2022 resource block dimensions and M20 Jan 25 resource block dimensions are 0.5 x 0.5 x 0.2m to eliminate volume variances that can exist when reporting a narrow reef at larger block sizes. ESC Block Model The ESC Mineral Resource estimate is based predominantly on diamond drill core data, sampled as either full or half core and coded according to interpreted geological and domain wireframes. The raw assay data was composited to 2m downhole intervals using length-weighted averaging, with composites constrained by geological boundaries. Exploratory Data Analysis, including statistical and geostatistical assessment such as variography, was undertaken on the composited data. To manage the effects of positively skewed grade distributions, particularly for gold, high-end outliers were capped prior to both analysis and estimation. A range of estimation approaches was tested to ensure adequate resolution between higher-grade vein-hosted mineralisation and lower-grade background mineralisation, including both linear and non-linear methods. Indicator Kriging was ultimately used to estimate the proportion of high-grade and low-grade gold mineralisation within the ESC, followed by Ordinary Kriging to estimate the gold grades of these components. Other elements with less skewed distributions, including copper, sulphur, arsenic, cobalt and CNSCu, were estimated directly using Ordinary Kriging. Local Varying Anisotropy (LVA) was applied during estimation using Vulcan, allowing each block to have a unique search neighbourhood and variogram orientation derived from smoothed geological surfaces. Given the tapering geometry of the ESC, a mid-point surface approximately equidistant between the hanging wall and footwall was used to control these orientations. Estimation outputs were peer reviewed through visual comparisons, statistical checks and swath plots against composite data and domain wireframes. In addition, key metrics such as slope of regression, number of informing samples and drillholes, and average distance to data were recorded to support subsequent resource classification. West Dome Open Pit Block Model The West Dome Open Pit Resource model includes estimates for gold, copper and density along with attributes required for modelling metallurgical recovery including cyanide soluble copper, sulphur, cobalt and arsenic. A composite database was compiled for each element from the raw assay database using 4m composite lengths using the available resource definition drill data and the 3-D wireframes from the geological model. Many of the wireframe volumes overlap, reflecting the overprinting nature of various mineralising events at Telfer. A priority sequence was developed whereby the main mineralised reef structures were prioritised over bulk domains and background stockwork mineralisation. The majority of the raw assay file contains 1 or 2m assay intervals. The composite length of 4m was chosen to standardise sample support and reflects the minimum Z sub-cell size (mining selectivity in the reef corridor areas). Boundary contact analyses were undertaken on all stratigraphic, oxidation and mineralised reef domains. The results of this analysis forms the basis for the majority of the stockwork sub-domaining decisions for the project. The analyses were conducted using the 4m downhole composites for gold, copper and sulphur grade. The West Dome Mineral Resource grade model is constructed with two components: Stockwork domains (bounded by key stratigraphy contacts) and Reef\Stockwork Corridor domains. The Telfer Reefs (M-Reefs) are stratabound and have relatively uniform thickness over short range intervals. Grade distribution within the reefs is also relatively consistent with regionally separated areas of on average high or low grades. Grade partitions are used to domain the reefs into high-grade and low-grade domains using an indicator estimation methodology. The West Dome M-Reef Stockwork Corridors use ordinary kriging into the 3D solid utilising local rotation functionality (LVA) in Vulcan. Variography and estimation parameters were updated based on the revised interpretation of the mineralisation style. The stockwork gold mineralisation outside the reefs is highly positively skewed with high Coefficient of Variation of between ~ 2 and 4. Ordinary Kriging (OK) has been demonstrated to be sub-optimal for estimating such highly variable material. Multiple Indicator Kriging (MIK) is considered best suited for this type of mineralisation. Gold and copper were estimated using MIK. The type of MIK is the e-type estimate; that is directly estimating the model blocks with the average grade of the cumulative indicator distribution. Indicator variograms for gold and copper were modelled for all Stockwork domains. The indicator thresholds were selected such that each bin has a reducing balance of number of samples. Indicator variography was then undertaken on gold and copper ensuring that nuggets increased and ranges decreased consistently in modelling progressively higher cut-offs; this minimises order relational problems in the MIK estimates. Stockwork cyanide soluble copper, sulphur, arsenic and cobalt stockwork estimates were estimated using Ordinary Kriging. Cyanide soluble copper, sulphur, arsenic and cobalt variogram models were generated by transforming the data to Gaussian space and back-transforming the resulting variogram model to raw space. The local rotation (LVA) functionality provided by Vulcan was used during stockwork OK and MIK estimation. For each target block, a unique rotation can be set and used to control both the variogram model and search neighbourhood rotation. These orientations are derived from smoothed interpretations of the main stratigraphic surfaces that define the overall geometry of the West Dome anticline as applied to the stratigraphically aligned mineralisation. The block sizes in the resource models are 3.125m x 3.125m x 1m for the selective reef areas and 12.5m x 12.5m x 12m for the bulk stockwork. All modelling and estimation are done in commercially available software supplemented with specialised algorithms coded within the package as required. The West Dome Underground Block Model The West Dome Underground (WDU) block model is based on underground diamond drilling and RC pre-collar data, composited to 4m for bulk stockwork domains and 2m for more discrete mineralised domains (e.g. WLLU, West Hinge and Far West stockworks). Geological wireframes, which often overlap due to multiple mineralising events, were prioritised so that key reef structures take precedence over background domains. Boundary contact analysis for gold and copper indicates that most domains have hard boundaries and are therefore estimated independently, with these results also informing sub-domaining. Exploratory data analysis was completed by domain for key elements (Au, Cu, S, As, Co) using both DDH and RC data. Estimation methods vary depending on grade variability within domains: Ordinary Kriging (OK) is applied to moderately variable domains (WLLU, West Hinge Stk, Far West Stk), with top-cutting applied where necessary based on metal-at-risk analysis. Multiple Indicator Kriging (MIK) is used for the highly variable background stockwork domain, providing a non-linear estimate (e-type mean) better suited to skewed grade distributions. Variography was conducted in Gaussian space due to poor raw-space continuity, with models back-transformed and sills normalised. Anisotropy was handled using Local Varying Anisotropy (LVA) for stratigraphically controlled domains (WLLU and background stockwork), allowing block-by-block rotation of variograms and search orientations based on the West Dome anticline geometry. In contrast, cross-cutting domains such as West Hinge and Far West stockworks use a single global variogram orientation. Back-transformed variograms were also used to validate MIK estimates for gold and copper. |
|
Moisture |
All tonnages are calculated and reported on a dry tonne basis. |
|
Cut-off parameters |
A specific cut-off grade was not used. Each block within the resource model is assigned a value based on an estimate of its net smelter return. Net smelter return is calculated on a payable metal basis taking into account metal prices, metallurgical recoveries, processing costs and realisation costs. Value / profit cut-off includes mining costs, processing costs with assigned sustaining capital and G&A components. The reported A$NSR cutoffs for UG are: · WF NSR COG = 86 (changed from Dec24) · SW NSR COG = 83 (changed from Dec24) · AReef NSR COG = 90 (changed from Dec24) · MReef NSR COG = 113 (changed from Dec24) · REY NSR COG = 87 (changed from Dec24) · KYLO NSR COG = 86 (changed from Dec24) · VSC NSR COG = 70 (new in Dec25) · ESC NSR COG = 96 (new in Dec25) The reported NSR cutoff for Open Pit: West Dome COG = $24.78 Consequently, for stockpiled material, the material is estimated based on the Grade Control criteria at the time of production. |
|
Mining factors or assumptions |
The WLLU, WHinge Stk, ESC, LLU, B30, Kylo, and Rey resource areas will be mined using bulk stope mining, while the M20-M50 and A50-A80 areas will be mined using selective narrow vein techniques. The VSC will be mined using Sub Level Caving. Resource estimates have been constrained by MSO outlines to enhance mining feasibility. Fit-for-purpose models have been developed for these methods, though future technological advancements may enable alternative mining approaches. Open-pit operations at Telfer use an excavator-loader fleet for selective ore extraction, employing a 12m bench height mined in 4m flitches to minimize ore dilution and loss. Bulk waste is removed in either a single 12m pass or three 4m flitches. The Selective Mining Unit (SMU) is defined as 6.25m x 6.25m x 4.00m, ensuring dilution control without additional mining dilution or recovery factors applied to the resource estimate. The West Dome Mineral Resource shells are constrained based on contract mining costs and value NSR assessments. |
|
Metallurgical factors or assumptions |
The current Telfer plant has been operating since 2003. The feed ore for the Telfer treatment plant is sourced from both open pit and underground mining operations. Owing to the range of ore types with differing mineralisation of both gold and copper, together with variation in ore hardness, the treatment flowsheet is complex. Two parallel process trains have been incorporated through the grinding and flotation circuits in the treatment plant which has a nominal throughput capacity of 20 Mtpa but the throughput rate varies between 17Mtpa and 23Mtpa dependent upon the ore characteristics. The typical operating strategy is to blend ore to control ore grade and hardness. The circuit was designed to maximize the recovery of the valuable minerals, with a flash flotation and gravity recovery section within the grinding circuit to capture coarse gold. The milled product passes to the copper flotation circuit where copper sulphides are recovered together with attached gold and independently liberated gold particles. Tailings from the copper circuit are processed through the pyrite flotation circuit with recovered pyrite processed through a cyanidation leach circuit for final gold extraction. The gold is extracted from the leach liquor by means of adsorption onto activated carbon followed by stripping and electrowinning. Two products are generated - gold doré (gravity and pyrite float leach) and gold-bearing copper concentrate. Minor amounts of oxide ore are processed in a dump leach operation as an adjunct to the main treatment route, with the dump leach output being incorporated within the overall gold doré production total. Metallurgical recovery formulae are applied in the value estimations developed from production history and reconciliations for each deposit. Typically, gold and copper recoveries are a function of absolute gold grade, copper grade and copper/sulphur and cyanide soluble/copper ratios to estimate either recovered grade or estimated tails grades. Transport costs and realisation costs (TCRC) of recovered metals plus smelting and royalty costs contribute to the estimated block value. |
|
Environmental factors or assumptions |
Telfer has a long history of mining and processing ore with the waste dump and residue disposal facilities all currently in place in accordance with the required statutory approvals. Statutory approvals under the Western Australian Environmental Protection Act (EP Act) provide the umbrella approval for the project. These approvals are reflected in Ministerial Approvals (issued by the Minister for the Environment - Nos. 605 and 606). The approvals include both environmental commitments made by Greatland and conditions applied by the Minister acting primarily on the recommendations of the Environmental Protection Authority (EPA), which coordinated detailed assessment by government agencies of potential environmental impacts and proponent-proposed management plans to manage those impacts. Performance against Ministerial Approval conditions is reported on a regular basis and reviewed by the government. |
|
Bulk density |
Bulk density measurements at Telfer are taken from 20cm samples of whole diamond core using the air-water method, with results stored in the acQuire database. These measurements are conducted at nominal 20m intervals and are assigned to stratigraphic units and associated oxidation/weathering profiles. Bulk densities were extensively evaluated in the 2002 feasibility study, and continue to be re-evaluated and updated based on new data. Certain domains, such as the reef domains, MVR, WLLU, LLU, and Oakover, show greater density variability due to high sulphide content, leading to bimodal distributions in some areas. Sulphur regression is used for these domains. Density estimation follows a three-step process: 1. Global mean densities are assigned to bulk domains with low variability. 2. Sulphur regression is used to estimate density in the LLU, where density variability is high due to sulphide content. 3. M-Reef densities are assigned based on previous resource estimates from 2011 and 2013. |
|
Classification |
MDU, WDU and ESC: Resource classification is based on geological interpretation confidence combined with Ordinary Kriging derived Slope of Regression (SoR) and/or Average weighted distance (AWD) of informing composites. Typical Indicated classification (SoR) >0.65 and Inferred classification is based on SoR >0.5 on a block-by-block basis. However final classification is based on manually interpreted aggregated volumes, not individual blocks that is constrained within minable outline. There are no Measured Mineral Resources. M-Reef Maximum drill spacing up to 40m by 40m with development sampling was classified as Indicated Mineral Resources. Indicated Mineral Resources must also have a sound geological understanding and grade continuity. Where drill density and development sampling are satisfied but unsolved geological complexity exists, for example, the steeper zones of M30, M40 and M50, these were classified as Inferred. Where drill spacing is greater than 40m X by 40m Y and up to100m X by 100m Y where unresolved geological complexity exists have been classified as Inferred Mineral Resources. Mineralisation with drill spacing wider than 100m X by 100m Y is unclassified. The primary reef M30 and M40 resource classification was used for the two double reefs M28/M30 and M38/M40. All M-Reef Classification is constrained by a minable outline. There are no Measured Mineral Resources in the M-Reefs. West Dome The December 2025 West Dome Mineral Resource reported figures were classified using a combination of geostatistical confidence parameters including average weighted distance for informing samples and slope of regression resulting from the Ordinary Kriging estimation for each block. Contiguous volumes were flagged with either Indicated or Inferred classification, no in-situ material is classified as Measured. Measured Resources at Telfer open pits are stockpiled material which has been grade controlled by very closed spaced production blast hole and/or RC sample data. |
|
Audits or reviews. |
All mineral resources at Telfer are regularly independently reviewed by resource estimation specialist consultants. The results and recommendations are tabulated and actioned by Telfer Resource Geologists. The most recent review completed was at the time Greatland acquired Telfer (Dec 2024). |
|
Discussion of relative accuracy/ confidence |
Telfer Gold Mine is an established operation with a long history to support development of plans to exploit the available Mineral Resources. As such, in the Competent Persons opinion, there are no known factors related to the environment, permitting, legal, title, taxation, socio-economic, marketing or political changes that could materially affect the Mineral Resource estimates. The Mineral Resource estimates are based on long term capital and operating costs assumptions based on the current operating cost base modified for changing activity levels and reasonable cost base reductions over the life of the mine. Any material change in long term cost base or metal price assumptions would impact the Mineral Resource estimate. |
RNS may use your IP address to confirm compliance with the terms and conditions, to analyse how you engage with the information contained in this communication, and to share such analysis on an anonymised basis with others as part of our commercial services. For further information about how RNS and the London Stock Exchange use the personal data you provide us, please see our Privacy Policy.


Latest directors dealings
- 22 minutes ago Sintana Energy Inc.
- 27 minutes ago accesso Technology Group
- 27 minutes ago Iofina
- 27 minutes ago Allergy Therapeutics
- 27 minutes ago Tinybuild Inc. (DI) (Reg s, CAT 3)