
Half-year Report
Summary by AI BETAClose X

THIS ANNOUNCEMENT CONTAINS INSIDE INFORMATION
FOR IMMEDIATE RELEASE
22 September 2026
Globalworth Real Estate Investments Limited
("Globalworth" or the "Company")
Interim Results for the six months ended 30 June 2026
Globalworth, a leading office investor in Central and Eastern Europe, announces the release of its Interim Report and Unaudited Consolidated Financial Results for the six-month period ended 30 June 2026 (the "Interim Report").
The Interim Report is also available on Globalworth's website at: https://www.globalworth.com/investor-relations/reports-presentations/
For further information visit www.globalworth.com or contact:
Enquiries
|
Rashid Mukhtar Group CFO
|
Tel: +40 732 800 000 |
|
Panmure Liberum (Nominated Adviser and Broker) Atholl Tweedie |
Tel: +44 20 7886 2500 |
About Globalworth / Note to Editors:
Globalworth is a listed real estate company active in Central and Eastern Europe, quoted on the AIM-segment of the London Stock Exchange. It has become the pre-eminent office investor in the CEE real estate market through its market-leading positions both in Poland and Romania. Globalworth acquires, develops and directly manages high-quality office and industrial real estate assets in prime locations, generating rental income from high-quality tenants from around the globe. Managed by over 250 professionals across Cyprus, Guernsey, Poland and Romania the combined value of its portfolio is €2.6 billion, as at 30 June 2026. Approximately 98.3% of the portfolio is in income-producing assets, predominately in the office sector, being leased to a diversified array of over 650 national and multinational corporates. In Poland Globalworth is present in Warsaw, Wroclaw, Lodz, Krakow, Gdansk and Katowice, while in Romania its assets span Bucharest, Constanta and Craiova.
IMPORTANT NOTICE: This announcement has been prepared for the purposes of complying with the applicable laws and regulations of the United Kingdom and the information disclosed may not be the same as that which would have been disclosed if this announcement had been prepared in accordance with the laws and regulations of any jurisdiction outside of the United Kingdom. This announcement may include statements that are, or may be deemed to be, "forward-looking statements". These forward-looking statements may be identified by the use of forward-looking terminology, including the terms "targets", "believes", "estimates", "plans", "projects", "anticipates", "expects", "intends", "may", "will" or "should" or, in each case, their negative or other variations or comparable terminology, or by discussions of strategy, plans, objectives, goals, future events or intentions. These forward-looking statements include all matters that are not historical facts and involve predictions. Forward-looking statements may and often do differ materially from actual results. Any forward-looking statements reflect the Company's current view with respect to future events and are subject to risks relating to future events and other risks, uncertainties and assumptions relating to the Company's business, results of operations, financial position, liquidity, prospects, growth or strategies and the industry in which it operates. Forward-looking statements speak only as of the date they are made and cannot be relied upon as a guide to future performance. Save as required by law or regulation, the Company disclaims any obligation or undertaking to release publicly any updates or revisions to any forward-looking statements in this announcement that may occur due to any change in its expectations or to reflect events or circumstances after the date of this announcement.
GLOBALWORTH REAL ESTATE INVESTMENTS LIMITED
INTERIM REPORT AND UNAUDITED INTERIM CONDENSED CONSOLIDATED FINANCIAL STATEMENTS
30 JUNE 2026
|
Combined portfolio open market value €2.6bn |
|
Shareholders' equity
€1.5bn |
|
Dividends paid in H1-26
5 cents |
|
0.4% on YE-25 |
|
1.3% on YE-25 |
|
9 cents in H1-25 |
|
|
|
|
|
|
|
NOI[1]
€68.4m |
|
NOI1 Like-for-like
€68.3m |
|
LTV[2]
36.7% |
|
+2.1% in H1-25 |
|
0.1% in H1-25 |
|
37.0% at YE-25 |
|
|
|
|
|
|
|
Adjusted normalised EBITDA[3] €58.5m |
|
EBITDA3 Like-for-like
€58.4m |
|
Cash and cash equivalents
€273.4m |
|
+2.1% in H1-25 |
|
€58.4m in H1-25 |
|
€410.6m on YE-25 |
|
|
|
|
|
|
|
IFRS Earnings per share
7 cents |
|
EPRA Earnings per share
8 cents |
|
EPRA NRV per share
€5.52 |
|
3[4] cents in H1-25 |
|
6 cents in H1-25 |
|
€5.62 at YE-25 |
1 Net Operating Income ('NOI')
2 Loan to value ('LTV')
3 Earnings before interest, taxes, depreciation, and amortisation ('EBITDA')
4 Restated for scrip shares in April 2026
Dear Stakeholders,
At the beginning of 2026, before the outbreak of the conflict in the Middle East, the global economy was gaining momentum, despite a challenging geopolitical environment and uncertainty over US tariffs. This was supported by easing inflation and a strong investment cycle driven by AI-related spending. The conflict materially changed the outlook, creating a significant energy shock.
Since then, the global economy has proven more resilient than feared, absorbing the shock with limited evidence of second-round effects, although the disinflation trend that had been underway since early 2024 has now stalled. Growth remains uneven: the war shock is weighing on energy importers and vulnerable economies, while AI-driven demand is supporting countries that are more integrated into the global technology value chain. Global growth is now projected at 3.0% for 2026 and 3.4% for 2027, broadly unchanged on a cumulative basis from the April 2026 forecast. Risks are more balanced than in April, although downside risks from renewed conflict and financial market repricing persist.
During the first half of the year, Globalworth continued its strategy of business consolidation, carefully managing and enhancing its high-quality office portfolio while combining prudent financial planning with its core mission: to be the preferred office landlord, providing cutting-edge spaces and services to its partners.
While EU forecasts have been revised downwards, with part of the recovery postponed to 2027, the CEE region remains a bright spot, albeit with clear geographic divergence. We are seeing mixed trends in the two markets in which we operate: Poland is leading growth alongside the Czech Republic and Croatia, while Romania is experiencing a slowdown closely linked to fiscal consolidation measures and energy market dynamics.
Globalworth's steady performance continued throughout the first half of the year, characterised by robust financial and operational results, as we focused on delivering a "local landlord" experience to our tenants while creating sustainable value for our communities and stakeholders.
Recognising the efforts that made our resilient performance possible, we are genuinely grateful to all our team members for their unwavering enthusiasm, dedication and positive attitude, which provide the extra quality that differentiates us from our competitors. We also extend our sincere appreciation and warmest regards to all our stakeholders, partners and communities for their continued support and trust, which make us both proud and responsible.
Our Portfolio
Our portfolio consists predominantly of Class "A" office space, complemented by investments in several landmark mixed-use office and retail assets in Poland, a residential investment with a retail component, one logistics property in Romania and several land plots that provide future development potential for the business.
During the first six months of 2026, the footprint of our standing portfolio remained above 1 million sqm. This followed the sale of one small office asset in Warsaw, which we considered non-core, and the sale of residential units from our Upground retail and residential project in Bucharest.
However, the total combined portfolio value increased slightly, by 0.4%, during the first half of the year. This was supported by a 0.8% (€20.8 million) increase in the like-for-like value of our standing commercial assets owned throughout the period, partly offset by disposals during the six months.
Our Leasing and Occupancy
During the first half of 2026, we met our target and leased 106.1k sqm of commercial space, with a Weighted Average Lease Length (WALL) of 4.3 years.
As of 30 June 2026, the average occupancy rate across our combined commercial portfolio stood at 86.6%, an increase of 1.2 percentage points compared with year-end 2025, when it was 85.4%, with the most visible gains recorded in our Warsaw and regional Poland submarkets, both of which registered increases of approximately 2.0%.
In both Romania and Poland, new office supply remains well below historical levels, reflecting the prolonged development slowdown seen in recent years. Early signs now suggest that this slowdown may be bottoming out, with new supply beginning to pick up in Poland, although the overall development pipeline remains subdued. As occupier demand gradually recovers in a more stable macroeconomic environment, the limited development pipeline is expected to continue supporting upward pressure on prime rents. At the same time, the ongoing "flight to quality" continues to reinforce demand for well-located, sustainable, A-grade office buildings, strengthening the competitive position of high-quality portfolios such as Globalworth's as the scarcity of comparable assets becomes increasingly evident.
Our total annualised contracted rent increased by 3.2%, reaching €195.5 million compared to the year-end 2025 figures (€189.5 million). This was driven by rent indexation and positive leasing activity across our projects.
Our Financial Results
Net rental income increased to €76.2 million in H1 2026, up €1.2 million year-on-year, driven primarily by indexation.
We recorded €76.2 million net rental income, €1.2 million higher compared to the first half of last year as an effect of indexation and partially offset by the reduced rates at which existing leases were renewed for extended period or new leases were signed, accounting also for the new lease incentives amortisation during the period.
Our net service charge expense is €7.8 million, €0.1 million lower year on year.
Like-for-like net operating income increased slightly to €68.3 million, compared with €68.2 million in H1 2025. The €0.3 million decline in Romania was offset by a €0.4 million increase in Poland. Reported net operating income reached €68.4 million, reflecting €0.1 million contribution from the disposed Philips property and the absence of €1.6 million of one-off non-recoverable property costs incurred in Poland in H1 2025.
Adjusted normalised EBITDA for the first half of 2026, on a like-for-like property basis, reached €58.4 million, broadly in line with the amount generated in the first six months of last year.
Our net result for the first half of 2026 was a profit of €20.2 million in H1 2026 (€8.0 million profit in similar period 2025). This included a €7.7 million gain from the fair value of investment properties (€1.7 million loss in similar period 2025).
Dividend
In February 2026, we announced a second interim dividend of €0.05 per share for the financial year ended 31 December 2025, with a scrip alternative at a reference price of €1.42 per share. Shareholders representing approximately 98.03% of Globalworth's share capital elected to receive shares, resulting in a cash outflow of only €0.3 million and supporting the Group's liquidity position.
Also, in August 2026, we announced the payment of an interim dividend in respect of the six-month ended 30 June 2026 of €0.07 per ordinary share, payable on 9 October 2026. A scrip dividend alternative is also being offered on this occasion.
Balance Sheet
As of 30 June 2026, our portfolio of €2.6 billion investment properties remains concentrated in Bucharest and Warsaw, where office occupancy exceeds 94%. Combined with the strong ESG credentials of our assets, this provides continued access to secure financing from local and regional banking partners.
Cash and cash equivalents stood at €273.4 million as of 30 June 2026, representing approximately 22% of outstanding debt. During the period, we redeemed €125 million of the 2029 Notes using existing liquidity resources. As a result, 90.7% of total debt remains fixed-rate or hedged, while 37% is unsecured financing sourced from the public debt markets. Average debt maturity was 4.1 years, and the loan-to-value ratio was 36.7%, consistent with our long-term target of around or below 40%.
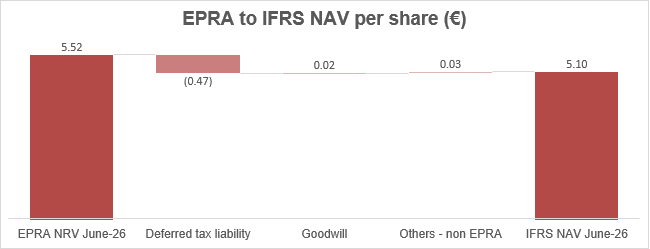
EPRA Net Reinstatement Value was €1.66 billion, or €5.52 per share, at 30 June 2026. This compares with €5.62 per share at 31 December 2025, with the decrease primarily attributable to the increased share count following the scrip dividend issued in April 2026.
Fitch Ratings re-affirmed, in June 2026, Globalworth's investment grade rating, keeping the stable outlook, also S&P Global Ratings re-affirmed during first half of the year the BB rating and the stable outlook.
Environmental and social
During the period, we issued our eighth Sustainable Development Report, covering 2025, and received limited audit assurance for the first time.
We continued to invest in our green portfolio and, during the first six months of 2026, recertified five properties in our portfolio with LEED Platinum and BREEAM Outstanding, the highest grades within their respective certification systems. As of the end of June 2026, we are proud to manage a portfolio of 51 green-certified properties valued at €2.5 billion, accounting for 99.0% of our total standing commercial portfolio by value.
Outlook
Following a solid performance in 2025, the CEE real estate market is entering a phase of consolidation and steady growth, supported by cautious optimism, stabilising yields and resilient demand. The macroeconomic backdrop remains supportive: inflation seems to be under control despite recent energy-driven shocks, which in turn is supporting investor sentiment and accelerating a shift towards domestic capital.
Globalworth's strategy is now focused on enhancing core business efficiencies, preserving value and maintaining a proactive financial policy. Our commitment to sustainable development and, more broadly, to the highest ESG standards has positioned us as the landlord of choice for corporates and multinationals seeking a home for their operations.
Office market fundamentals in our focus countries remain notably stronger than in Western Europe, supported by higher GDP growth rates, newer office stock, higher office attendance and sharp supply constraints, combined with better yield profiles in CEE countries. While Poland remains the undisputed regional leader, the Romanian market is continuing to narrow the gap despite the challenges of fiscal consolidation within Romania.
We are confidently steering our company towards a future in which we continue to capitalise on our expertise, scale and proven business model to deliver value for all our stakeholders. Our optimism remains balanced by our responsibilities towards the communities we serve, as we actively pursue initiatives and opportunities that help us continue to improve.
Piotr Olendski and Roy Vishnovizki
Joint Chief Executive Officers
21 September 2026
MANAGEMENT REVIEW
REAL ESTATE ACTIVITY
|
· During the first half of the year, Globalworth continued to focus on its core-assets base, prioritising initiatives aimed at preserving and enhancing the quality and desirability of our premium assets. · Construction works on our latest office project in Bucharest, Green Court D, are progressing as planned, with the building expected to be completed during the second half of 2027, and reaching a pre-leasing of 61.8% as 30 June 2026 · During the first half of 2026, we successfully concluded the sale of Philips House, a 6.2k sqm office building in Warsaw, which we had deemed a non-core asset due to its smaller size. |
Green Court D - our latest office project in Bucharest
Last year, after careful consideration, we confidently started our first office development since the Covid pandemic, Green Court D. The building is part of our wider Green Court Complex, located in one of Bucharest's most vibrant areas, and, on completion, it will add a further 17.2k sqm of state-of-the-art office space to our standing portfolio, strengthening Globalworth's position as the largest business community in Romania. As of June 2026, the construction works are progressing as planned, with the building reaching a pre-leasing of 61.8%.
|
Property Under Development |
|
|
|
Green Court D |
|
Location |
Bucharest New CBD |
|
Expected Delivery |
2027 |
|
GLA - on Completion (k sqm) |
17.2 |
|
Capex to 30 June 2026 (€ m) |
9.6 |
|
GAV (€ m) |
13.9 |
|
Estimated Capex to go (€ m) |
31.4 |
|
Pre-leasing status (%) |
61.8% |
|
Contracted Rent (€ m) |
2.7 |
|
ERV at 100% (€ m) |
4.4 |
Sale of non-core asset
In May 2026, we successfully finalised the sale of Philips House, a 6.2k sqm office building in Warsaw, which we had deemed a non-core asset due to its smaller size.
|
Property Sold in H1-2026 |
|
|
|
Philips House |
|
Location |
Warsaw |
|
Year of Acquisition |
2017 |
|
GLA (k sqm) |
6.2 |
|
GAV as Dec'25 (€ m) |
10.8 |
Land bank potential
We own, directly or through JV partnerships, other land plots in prime locations in Bucharest and Constanta, Romania and in Krakow, Poland, covering a total land surface of 0.3 million sqm (comprising 1.2% of the Group's combined GAV), for future developments of office, retail, industrial or mixed-use properties. When fully developed, these land plots have the potential to add a total of over 200k sqm of high-quality GLA to our standing portfolio footprint.
These projects, which are classified as "Future Development", continue to be reviewed by the Group periodically. The pace at which they will be developed is subject to tenant demand and general market conditions.
|
Future Developments |
|
|
|
|
|||
|
|
Podium Park III |
Globalworth West |
Constanta Business Park (Phased) |
Luterana |
|||
|
Location |
Krakow |
Bucharest |
Constanta |
Bucharest |
|||
|
Status |
Postponed |
Postponed |
Planned |
Planned |
|||
|
GAV (€ m) |
6.9 |
5.7 |
8.2 |
10.7 |
|||
ASSET MANAGEMENT REVIEW
|
· 106.1k sqm of commercial space taken up or extended at an average WALL of 4.3 years, with Romania accounting for 52.8% of leases signed in the first six months of 2026 · Renewals accounted for 63.6% of our leasing activity at a WALL of 3.4 years, with new leases (including expansions) signed at a WALL of 5.8 years · Total annualised contracted rent has increased to €195.5 million, up 3.2% compared to the year-end 2025, driven by rent indexations and positive leasing activity in our portfolio - Like-for-like annualised contracted rent from our standing commercial assets owned throughout the first six months of the year increased 2.8% to €192.7m (€187.4 as of Dec'25) · Total combined portfolio value slightly increased by 0.4% to €2.6 billion, due to valuation gains, partly offset by the sale of one non-core asset in Warsaw, Poland - The like-for-like increase in value of our standing commercial assets owned throughout H1-2026 was €20.8 million meaning an overall increase of 0.8% compared to year-end 2025. |
Leasing Review
New Leases
Our core focus continues to be the renewal of leases with existing tenants in our portfolio and the take-up of available space in standing properties and developments, maximising the utilisation degree and efficiency of our buildings.
In the first six months of 2026, Globalworth successfully negotiated the take-up (including expansions) or extension of 106.1k sqm of commercial spaces in Romania (52.8% of transacted GLA) and Poland (47.2% of transacted GLA), with an average WALL of 4.3 years. Our leasing activity during the first half of 2026 was focused on lease extensions, with such leases accounting for 63.6% of our total leasing activity being signed at a WALL of 3.4 years, while take-up of available spaces accounted for 36.4% signed at a WALL of 5.8 years.
The office has been shaped in recent years by a "human-centric" transformation that is blending technology with employee wellbeing, transforming the traditional, outdated open offices we were used to, into a destination dedicated to enhancing human connections, collaboration and innovation, whilst offering comfort, flexibility and meaningful experiences.
Lease renewals in the first half of the year accounted for a total of 67.6k sqm of GLA, with 49 of our tenants, and at a WALL of 3.4 years. The most notable extensions were in relation to leases at: Green Court Complex, Globalworth Square (Bucharest); Spektrum Tower, Nordic Park (Warsaw); and Silesia Star (Katowice); while c.71% of the renewals by GLA were for leases that were expiring in 2027 or later, which demonstrates our proactive approach to leases nearing maturity.
In total, we signed new take-ups for 38.6k sqm of GLA, with 79.3% of those being spaces leased to new tenants, and the rest being taken up by existing tenants expanding their operations.
· New leases were signed with 35 tenants for 30.6k sqm of GLA at a WALL of 5.6 years. The majority were for office spaces, accounting for 98.0%, with the remainder involving retail and storage spaces. The largest new leases in this period were signed in Green Court D (pre-lease), our latest office development from Bucharest, Quattro Business Park (Krakow) and Globalworth Square (Bucharest).
· In addition, 11 tenants signed new leases, expanding their operations by 8.0k sqm at an average WALL of 6.6 years, with the most notable expansions being signed at Green Court Complex (Bucharest), and Silesia Star and Supersam (Katowice).
|
Summary Leasing Activity for Combined Portfolio in H1-2026 |
|||
|
|
GLA (k sqm) |
No. of Tenants* |
WALL (yrs) |
|
New Leases (incl. expansions) |
38.6 |
46 |
5.8 |
|
Renewals / Extensions |
67.6 |
49 |
3.4 |
|
Total |
106.1 |
87 |
4.3 |
|
*Number of individual tenants |
|||
Rental levels
For the last two years we have witnessed upward pressure on headline rental levels due to a historical shortage of new supply which has been coupled with rent indexations; this dynamic has been particularly visible in the two capital cities in which we operate, as opposed to in the regional cities, and this trend is expected to continue for the foreseeable future, especially for high-quality, ESG compliant buildings in prime locations.
The rents for most of our leases typically adjust on an annual basis in the first quarter of the year. In the first half of this year, eligible leases were indexed at an average of 2.4%. These indexation adjustments, combined with the rates at which leases were renewed or new leases signed, have led to a positive impact on the evolution of our average rents.
At the end of June 2026, our average headline rents in our standing properties for office and retail spaces were €16.2/sqm/month (€16.0 at YE-2025) and €16.7/sqm/month (€16.5 at YE-2025) respectively.
Office leases signed in the first half of the year were at an average rent of €16.7/sqm/month while retail spaces were leased at an average of €18.8/sqm/month. The overall commercial GLA take-up during the first six months of 2026 was at an average rent of €16.7/sqm/month.
Contracted Rents (on annualised basis)
Total annualised contracted rent across our portfolio in Poland and Romania increased by 3.2% during the first six months of 2026, to €195.5 million, driven by rent indexations and positive leasing activity.
Like-for-like total annualised contracted rent in our standing commercial portfolio was €192.7 million as at 30 June 2026, 2.8% higher than 31 December 2025 (€187.4 million). Annualised contracted rent from pre-leased space in Green Court D, our latest office development in Bucharest, had reached €2.7m by the end of the first half of the year.
|
Annualised Contracted Rent Evolution H1-2026 (€m) |
|||
|
|
Poland |
Romania |
Group |
|
Rent from St. Comm. Props ("SCP") 31 Dec 2025 |
99.9 |
88.3 |
188.2 |
|
Less: Assets sold |
(0.7) |
- |
(0.7) |
|
Rent from SCP Adj. for Properties sold |
99.1 |
88.3 |
187.4 |
|
Less: Space Returned |
(1.9) |
(3.1) |
(5.0) |
|
Plus: Rent Indexation |
1.8 |
1.7 |
3.5 |
|
Plus/Less: Lease Renewals (net impact) & Other |
(0.4) |
(0.2) |
(0.6) |
|
Plus: New Take-up |
3.9 |
3.4 |
7.3 |
|
Total L-f-L Rent from SCP 30 Jun 2026 |
102.5 |
90.2 |
192.7 |
|
Plus: Standing Commercial Properties Acquired During the Period |
- |
- |
- |
|
Plus: Developments Completed During the Period |
- |
- |
- |
|
Total Rent from Standing Commercial Properties |
102.5 |
90.2 |
192.7 |
|
Plus: Residential Rent |
- |
0.1 |
0.1 |
|
Total Rent from Standing Properties |
102.5 |
90.3 |
192.8 |
|
Plus: Active and Pre-lets of Space on Projects Under Development / Refurbishment |
- |
2.7 |
2.7 |
|
Total Contracted Rent as at 30 Jun 2026 |
102.5 |
93.0 |
195.5 |
|
Annualised Commercial Contracted Rent Profile as of 30 June 2026 |
|||
|
|
Poland |
Romania |
Group |
|
Contracted Rent (€ m) |
102.5 |
92.9 |
195.4 |
|
Tenant origin - % |
|||
|
Multinational |
64.6% |
78.5% |
71.2% |
|
National |
34.1% |
19.7% |
27.3% |
|
State Owned |
1.3% |
1.8% |
1.5% |
|
Note: Commercial Contracted Rent excludes c.€0.1 million from residential spaces as of 30 June 2026
|
|||
|
Annualised Contracted Rent by Period of Commencement Date as of 30 June 2026 (€m) |
||||||
|
|
Active Leases |
H2-2026 |
H1-2027 |
H2-2027 |
>2027 |
Total |
|
Standing Properties |
188.0 |
4.8 |
- |
- |
- |
192.8 |
|
Developments |
- |
- |
- |
2.7 |
- |
2.7 |
|
Total |
188.0 |
4.8 |
- |
2.7 |
- |
195.5 |
|
Annualised Commercial Portfolio Lease Expiration Profile as of 30 June 2026 (€m) |
||||||||||
|
Year |
H2-2026 |
2027 |
2028 |
2029 |
2030 |
2031 |
2032 |
2033 |
2034 |
>2034 |
|
Total |
9.9 |
17.8 |
22.3 |
32.5 |
31.8 |
22.1 |
21.1 |
16.5 |
11.5 |
9.9 |
|
% of total |
5.0% |
9.1% |
11.4% |
16.6% |
16.3% |
11.3% |
10.8% |
8.5% |
5.9% |
5.1% |
The Group's rent roll across its combined portfolio is well diversified, with the largest tenant accounting for 3.5% of contracted rents, while the top three tenants account for 9.3% and the top 10 account for 22.9%.
Cost of Renting Spaces
The headline (base) rent represents the reference point typically communicated in the real estate market when a new lease is signed. Renting spaces typically involves certain costs, such as rent-free periods, fit-out expenses for the leased spaces, and brokerage fees, which the landlords incur. These incentives can vary significantly between leases and depend on market conditions, type of lease signed (new take-up or lease extension), space leased (office, retail, other), lease duration and other factors.
In calculating our effective rent, we account for the costs incurred over the lifetime of a lease, which we deduct from the headline (base) rent, thus allowing us to assess the profitability of a rental agreement.
Overall, in the first half of 2026, we successfully negotiated the take-up (including expansions) or extension of 103.8k sqm of commercial spaces in our portfolio, excluding leases granted in connection with our social commitments. The weighted average effective rent for these new leases was €12.8/sqm/month with a WALL of 4.2 years.
The difference between headline (base) and effective rents in the first half of 2026 was, on average, 23.3%, which was higher than FY2025 (average of 21.4%), but in line with the performance of the previous year.
In total, new leases signed in the first six months of 2026 will generate a future headline rental income of €100.5 million (including auxiliary spaces and revenues from GW flex offices), with leases from office properties accounting for 90.4% of future headline rental income.
|
Weighted Average Effective Rent (€ / sqm / m) - H1-2026 |
|
|
|
||
|
|
Poland |
Romania |
Group |
||
|
Headline Commercial Rent |
16.3 |
17.1 |
16.7 |
||
|
Less: Rent Free Concessions |
(1.7) |
(1.3) |
(1.5) |
||
|
Less: Tenant Fitouts |
(2.5) |
(1.2) |
(1.9) |
||
|
Less: Broker Fees |
(0.6) |
(0.4) |
(0.5) |
||
|
Effective Commercial Rent |
11.6 |
14.1 |
12.8 |
||
|
WALL (in years) |
4.6 |
3.9 |
4.2 |
||
Portfolio Valuation
In line with our practice of biannual valuations, our entire portfolio in Poland and Romania was revalued as of 30 June 2026.
The valuations were performed by Knight Frank and Axi Immo for our properties in Poland, with Colliers and Cushman & Wakefield valuing our properties in Romania (more information is available under note 4 of the unaudited interim condensed consolidated financial statements as of and for the period ended 30 June 2026).
Assigning the appraisal of our entire portfolio to independent and experienced service providers in this way makes the process of determining the value of properties transparent and impartial. Through our oversight, we ensure that a consistent methodology, reporting, and timeframe are respected.
As such, the third-party appraised value of the entire portfolio on 30 June 2026 was estimated at €2.6 billion, 0.4% higher than as at 31 December 2025. The like-for-like increase in value of our standing commercial assets owned throughout H1-2026 was €20.8 million meaning an average increase of 0.8% compared to the values at the end of 2025.
In valuing our properties, key market indicators used by our independent appraisers typically include factors such as the commercial profile of the property, its location, age and the country in which it is situated, although they can vary from time to time. These factors have remained consistent against year-end 2025, with ERVs displaying a selective upward trend, especially in prime locations and for class A assets.
|
Combined Portfolio Value Evolution 30 June 2026 (€m) |
|||
|
|
Poland |
Romania |
Group |
|
Total Portfolio Value on 31 Dec 2025 |
1,410.9 |
1,211.1 |
2,622.0 |
|
Less: Properties Held in Joint Venture (*) |
- |
(7.9) |
(7.9) |
|
Total Investment Properties on 31 Dec 2025 |
1,410.9 |
1,203.2 |
2,614.1 |
|
Plus: Transactions |
(10.8) |
(3.7) |
(14.5) |
|
o/w New Acquisitions |
- |
- |
- |
|
o/w Disposals |
(10.8) |
(3.7) |
(14.5) |
|
Plus: Capital Expenditure |
8.1 |
10.2 |
18.3 |
|
o/w Developments |
- |
5.6 |
5.6 |
|
o/w Standing Properties |
8.1 |
4.6 |
12.6 |
|
o/w Future Developments |
- |
- |
- |
|
Plus: Net Revaluations Adjustments |
0.2 |
5.6 |
5.8 |
|
o/w Developments |
0.0 |
(0.7) |
(0.7) |
|
o/w Standing Properties |
0.2 |
7.9 |
8.1 |
|
o/w Lands, Future Developments & Acquisitions |
- |
(1.6) |
(1.6) |
|
Total Investment Properties on 30 Jun 2026 |
1,408.4 |
1,215.3 |
2,623.7 |
|
Plus: Properties Held in Joint Venture (*) |
- |
8.2 |
8.2 |
|
after Capital Expenditure & Acquisitions |
- |
- |
- |
|
after Net Revaluation Adjustments |
- |
0.3 |
0.3 |
|
Total Portfolio Value on 30 Jun 2026 |
1,408.4 |
1,223.5 |
2,631.9 |
(*) Joint Venture Portfolio is shown at 100%; Globalworth owned 50% stake as of June 30th,2026.
STANDING PORTFOLIO REVIEW
|
· Standing portfolio footprint of 1,049.5k sqm valued at €2.6 billion as of 30 June 2026. · Average standing occupancy of our combined commercial portfolio increased by 1.2 percentage points to 86.6% as of 30 June 2026 (85.4% as of year-end 2025) - Like-for-like average occupancy of our commercial standing properties improved by 1.1 percentage points during the first half of the year · Total contracted rent of €192.8 million in our standing properties (over 90% coming from office properties). · All our properties in Poland are now internally managed, which means that 96.5% of our combined standing commercial portfolio by value (96.7% of office and mixed-use standing properties) are now internally managed by the Group. |
Standing Portfolio Evolution
The footprint of our standing portfolio decreased slightly, to 1.0 million sqm following the disposals made during H1-2026 and is valued at €2.6 billion as of 30 June 2026.
Overall, our standing portfolio is almost entirely focused on 27 Class "A" office (47 properties in total) and three mixed-use investments (with seven properties in total) in central locations in Bucharest (Romania), Warsaw (Poland) and five of the largest office markets/cities of Poland (Krakow, Wroclaw, Katowice, Gdansk and Lodz), which together account for c. 99.0% of our standing portfolio by value. In addition, in Romania we own a small logistic park in Craiova and part of a residential complex in Bucharest with a retail component on the ground floor.
As of 30 June 2026, our combined standing portfolio comprised 32 investments (33 as of 31 December 2025) with 56 buildings (57 as of 31 December 2025) in Poland and Romania. This decrease of one investment/building is due to the sale of Philips House in Warsaw, Poland in H1-2026.
The appraised value of our combined standing portfolio as of 30 June 2026 was €2.6 billion (more than 99% in commercial properties), which was 0.2% higher than 31 December 2025, the increase during the first half of 2026 being mostly due to valuation gains which were partly offset by sales during the period. The value of our like-for-like standing commercial properties owned throughout the first six months of the year reached €2.6 billion as of 30 June 2026, €20.8 million (or 0.8%) higher than December 2025.
Globalworth Combined Portfolio: Key Metrics
|
Total Standing Properties |
31 Dec. 2024 |
31 Dec. 2025 |
30 Jun. 2026 |
|
Number of Investments |
32 |
33 |
32 |
|
Number of Assets |
56 |
57 |
56 |
|
GLA (k sqm) |
1,014.0 |
1,058.1 |
1,049.5 |
|
GAV (€ m) |
2,449.2 |
2,580.2 |
2,586.5 |
|
Contracted Rent (€ m) |
181.5 |
188.4 |
192.8 |
|
Of which Commercial Properties |
31 Dec. 2024 |
31 Dec. 2025 |
30 Jun. 2026 |
|
Number of Investments |
31 |
32 |
31 |
|
Number of Assets |
55 |
56 |
55 |
|
GLA (k sqm) |
1,003.7 |
1,051.1 |
1,044.5 |
|
GAV (€ m) |
2,428.5 |
2,565.7 |
2,575.7 |
|
Occupancy (%) |
86.7% |
85.4% |
86.6% |
|
Contracted Rent (€ m) |
181.2 |
188.2 |
192.7 |
|
Potential rent at 100% occupancy (€ m) |
205.5 |
216.8 |
218.9 |
|
WALL (years) |
4.6 |
4.3 |
4.2 |
|
Evolution of Combined Standing Portfolio over H1-2026 |
|
|
|
|
|
|||||||
|
|
31 Dec. 2025
|
LfL Change*
|
New Acquisitions |
Sales |
New Deliveries
|
Reclass. & Other Adj** |
30 Jun. 2026
|
|
||||
|
GLA (k sqm) |
1,058.1 |
- |
- |
(8.2) |
- |
(0.4) |
1,049.5 |
|
||||
|
GAV (€ m) |
2,580.2 |
20.7 |
- |
(14.5) |
- |
- |
2,586.5 |
|
||||
(*) Like-for-Like change represents the changes in GLA or GAV of standing properties owned by the Group at 31 December 2025 and 30 June 2026.
(**) Includes impact in areas (sqm) from the remeasurement of certain properties and other GAV adjustments (redevelopment capex, reclassification).
Occupancy of Commercial Standing Portfolio increasing by more than 1.0 percentage point in the first six months of 2026
Our standing commercial portfolio's average occupancy as of 30 June 2026 was 86.6%, representing an increase of 1.2 percentage points over the past six months (85.4% as of 31 December 2025), with the most visible improvements occurring in our Regional Polish and Warsaw submarkets.
On a like-for-like basis, occupancy increased by 1.1 percentage points to 86.6% at the end of June 2026 (from 85.5% as of December 2025).
Across the portfolio, at the end of the first half of 2026, we had 904.5k sqm of commercial GLA leased to c. 700 tenants at an average WALL of 4.2 years, the majority of which is let to national and multinational corporates that are well-known within their respective markets.
|
Occupancy Evolution H1-2026 (GLA 'k sqm) - Commercial Portfolio |
||||||
|
|
Poland |
Occupancy Rate (%) |
Romania |
Occupancy Rate (%) |
Group |
Occupancy Rate (%) |
|
Standing Available GLA - 31 Dec. 25 |
578.3 |
|
472.8 |
|
1,051.1 |
|
|
Sold GLA |
(6.2) |
|
- |
|
(6.2) |
|
|
Acquired GLA |
- |
|
- |
|
- |
|
|
New Built GLA |
- |
|
- |
|
- |
|
|
Remeasurements, reclassifications |
(0.1) |
|
(0.4) |
|
(0.4) |
|
|
Standing Available GLA - 30 Jun. 26 |
572.0 |
|
472.5 |
|
1,044.5 |
|
|
Occupied Standing GLA - 31 Dec. 25 |
451.1 |
78.0% |
446.2 |
94.4% |
897.3 |
85.4% |
|
Sold Occupied GLA |
(3.8) |
|
- |
|
(3.8) |
|
|
Acquired/Developed Occupied GLA |
- |
|
- |
|
- |
|
|
Expiries & Breaks |
(7.8) |
|
(13.8) |
|
(21.6) |
|
|
Renewals* |
32.5 |
|
35.1 |
|
67.6 |
|
|
New Take-up |
17.7 |
|
14.9 |
|
32.6 |
|
|
Other Adj. (relocations, remeasurements, etc) |
(0.0) |
|
0.0 |
|
(0.0) |
|
|
Occupied Standing GLA - 30 Jun. 26 |
457.1 |
79.9% |
447.4 |
94.7% |
904.5 |
86.6% |
* Renewals are neutral to the occupancy calculation.
Standing Properties Operation
Offering best-in-class real estate space to our business partners remains a key component of our strategy at Globalworth.
Through our continuous "hands-on" approach, combining active management initiatives and selective investments, we are preserving and enhancing the value of our properties, generating long-term income, while offering best-in-class real estate space to our business partners.
We are pleased that all our properties in Poland are now internally managed by the Group, while in Romania, we manage all but one of our offices in-house. Overall, we internally manage 996.3k sqm of high-quality commercial spaces with an appraised value of €2.5 billion. Of our total standing commercial portfolio, internally managed properties account for 96.5% by value (96.7% of office and mixed-use standing properties) as of 30 June 2026.
In the first half of 2026, we invested €12.6 million in select improvement initiatives in our standing commercial portfolio. As a result of our continuous investments, we hold a modern portfolio with 33 of our standing commercial properties, accounting for more than two thirds of our standing portfolio, having been delivered or significantly refurbished in the past 10 years.
|
Internally Managed Commercial Portfolio as of 30 June 2026 |
Poland |
Romania |
Group |
|
Internally Managed GLA (k sqm) |
572.0 |
424.3 |
996.3 |
|
% of Commercial GLA |
100% |
90% |
95% |
|
% of Office and Mixed-Use GLA |
100% |
91% |
96% |
|
Internally Managed GAV (€ m) |
1,401.5 |
1,085.3 |
2,486.8 |
|
% of Commercial GAV |
100% |
92% |
97% |
|
% of Office and Mixed-Use GAV |
100% |
93% |
97% |
SUSTAINABLE DEVELOPMENT UPDATE / OTHER INITIATIVES
|
· Overall, we own 51 green certified properties in our portfolio valued at €2.5 billion, accounting for 99.0% of our total standing commercial portfolio value. · 5 properties were recertified with LEED Platinum and BREEAM Outstanding certifications in our portfolio during H1-2026 · All our office properties in Romania have a WELL Health-Safety rating, further demonstrating the quality of our portfolio. · Issued our eighth sustainable development report for the Group for FY 2025, the first one to receive limited assurance from auditors · c.€80.0k donated to more than 11 initiatives in Romania and Poland. |
Green Buildings
Consistent with our commitment to energy-efficient properties, during H1-2026 we recertified 5 properties in our portfolio with LEED Platinum and BREEAM Outstanding, the highest certification grade of their respective type.
Overall, as of 30 June 2026, our combined standing portfolio comprised 51 green-certified properties, accounting for 99.0% of our standing commercial portfolio by value. BREEAM-accredited properties account for 57.9% of our green-certified standing portfolio by value, with the remaining properties being holders of other certifications (LEED or EDGE).
Furthermore, as part of our overall green initiatives, we kept our policy of securing 100% of the energy used in our Polish and Romanian properties from renewable sources.
Social Initiatives
In the first half of 2026, Globalworth and the Globalworth Foundation continued with their very active social programme, contributing €80k to more than 11 initiatives in Romania and Poland.
Initiatives to which we contributed included:
- Open Learning powered by Globalworth. This is an educational initiative, built around the idea of "Learn where business happens." The programme is aimed at high school and university students in Wroclaw, connecting them with leading companies operating in the region through practical learning experiences in real workplaces.
- Blood donation day: organised in our offices both in Romania and Poland for our community members
In addition to these, we had several other campaigns within our communities, the noteworthy of which are:
- Book Clubs. Organised for our Bucharest Globalworth Community, we shared our thoughts, sipped tea and wine, enjoyed cookies, and connected with fellow book lovers
- Bike to Work and No Car Day campaigns. To celebrate World Environment Day, we dedicated the entire week to our No Car Day initiative across our office buildings. We supported our community members who chose to bike to work by offering dedicated bike parking, showers, and secure lockers across our buildings.
- Earth Hour. We turned off all non-essential lights in our buildings for Earth Hour, joining the global movement to protect our planet.
Reporting
As part of our efforts to improve disclosure in relation to our sustainable development strategy, initiatives and performance, we published Globalworth's "2025 Sustainable Development Report".
This is the eighth report published by the Group and has been prepared in accordance with the GRI Standards: Core Option and with the European Public Real Estate Association's Sustainability Best Practice Reporting Recommendations (EPRA sBPR), and was our first report to receive limited assurance from auditors. The limited assurance was given for the energy consumption and carbon footprint of the Group.
PORTFOLIO SNAPSHOT
Our real estate investments are in Poland and Romania, the two largest markets in the CEE. As of 30 June 2026, our portfolio was spread across 9 cities, with Poland accounting for 53.5% by value and Romania 46.5%.
|
Combined Portfolio Snapshot (as of 30 June 2026) |
|||
|
|
Poland |
Romania |
Combined Portfolio |
|
Standing Investments(1) |
18 |
14 |
32 |
|
GAV(2) / Standing GAV (€m) |
€1,408m / €1,401m |
€1,224m / €1,185m |
€2,632m / €2,586m |
|
Occupancy(3) |
79.9% |
94.7% |
86.6% |
|
WALL |
3.8 years |
4.7 years |
4.3 years |
|
Standing GLA (k sqm)(4) |
572.0k sqm |
477.5k sqm |
1,049.5k sqm |
|
Contracted Rent (€m)(5) |
€102.5 |
€93.0 |
€195.5m |
|
GAV Split by Asset Usage |
|
|
|
|
Office |
79.8% |
96.3% |
87.5% |
|
Mixed-Use |
20.2% |
0.0% |
10.8% |
|
Industrial |
0.0% |
0.4% |
0.2% |
|
Others |
0.0% |
3.3% |
1.5% |
|
GAV Split by City |
|
|
|
|
Bucharest |
0.0% |
98.9% |
46.0% |
|
Constanta |
0.0% |
0.7% |
0.3% |
|
Craiova |
0.0% |
0.4% |
0.2% |
|
Warsaw |
42.5% |
0.0% |
22.8% |
|
Krakow |
20.2% |
0.0% |
10.8% |
|
Wroclaw |
17.5% |
0.0% |
9.4% |
|
Katowice |
11.8% |
0.0% |
6.3% |
|
Gdansk |
4.2% |
0.0% |
2.2% |
|
Lodz |
3.8% |
0.0% |
2.0% |
|
GAV as % of Total |
53.5% |
46.5% |
100.0% |
|
|
|
|
|
|
1. Standing Investments representing income producing properties. One investment can comprise multiple buildings. e.g. Globalworth Campus comprises three buildings or one investment |
|||
|
2. Includes all property assets, land and development projects valued at 30 June 2026 3. Adjusted standing commercial occupancies as of Jun'26 are as follows: • 79.3% for Globalworth Poland, adjusted with the available areas of spaces leased to GW Flex • 94.3% for Globalworth Romania, adjusted with social commitment lease (DGASMB in BOC) • 86.1% for the full Group portfolio, considering above-mentioned adjustments |
|||
|
4. Including 5.0k sqm of residential assets in Romania |
|||
|
5. Total rent comprises commercial (€192.7 million) and residential (€0.1 million in Romania) standing properties and pre-let rent in assets under development (€2.7 million in Green Court D, Bucharest, Romania) |
|||
|
|
|||
CAPITAL MARKETS UPDATE
|
· Although CEE is navigating a landscape of resilient, modest growth, it remains one of Europe's fastest-growing regions. As a result, its capital markets are increasingly shaped by yield stabilisation and a shift towards local capital. · In H1 2026, Globalworth's share price continued to trade below our last reported EPRA NRV. We believe this divergence is a reflection of the limited free float and the low liquidity of our shares and does not take account of our strong fundamentals, operational performance, and long-term value creation potential · In the first months of 2026, we successfully redeemed €125 million of our Senior Notes due in 2029. This further demonstrates our proactive approach to debt and liquidity management. It also reflects our commitment to maintaining financial health and flexibility. We expect this to have a positive impact on our overall financing costs. · Both Fitch and S&P rating agencies have maintained their credit ratings during the first six months of 2026, with Fitch reaffirming our investment grade rating of BBB- with a stable outlook following their annual review, while S&P maintained the group's corporate credit rating at BB with a stable outlook |
Equity Capital Markets Review
During the first half of 2026, CEE's capital markets were shaped by a shift towards domestic capital. They were also marked by growth divergence and cautious optimism. Despite global macroeconomic challenges and geopolitical tensions, the regional real estate market remained resilient. This resilience was supported by strong fundamentals, robust demand, and solid infrastructure investment.
Real estate valuations have stabilised after the post-2022 adjustments and they are now starting to edge up. This signals growing investor confidence. Structural drivers continue to support the recovery, including rental growth and the ongoing supply squeeze. We expect values in prime, well-located, sustainable offices to continue recovering in 2026 and beyond.
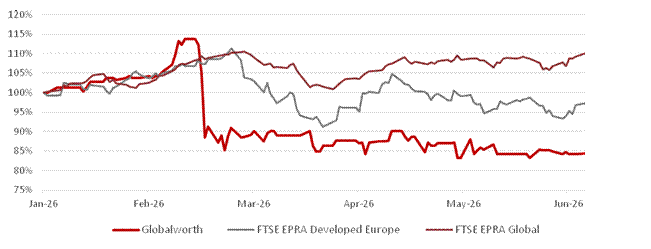
As of 30 June 2026, the FTSE EPRA Developed Europe index recorded a performance of -2.8%. The FTSE EPRA Global index recorded a performance of +11.7%. Both figures cover the six months from 1 January 2026. Over the same period, Globalworth's share price performance was -15.0%. However, we believe this was mainly driven by the limited free float and low liquidity of our shares, and it does not take account of the Company's strong fundamentals, operational performance, or long-term value creation potential.
During the first half of 2026, Globalworth's share price traded consistently below its last reported EPRA NRV (€5.62 per share as at 31 December 2025). The lowest closing price was €1.66 per share on 7 May 2026. The highest closing price was €2.27 per share on 16 February 2026.
Zakiono Enterprises Ltd, jointly and equally owned by CPI Property Group S.A. ("CPI") and Aroundtown SA ("Aroundtown"), holds 60.9% of the Group's share capital. Growthpoint Properties Ltd holds a further 29.6%. Shareholders representing, in aggregate, more than 98% of Globalworth's issued share capital chose the scrip dividend alternative for the interim dividend announced and paid during the first half of 2026 which, we believe, demonstrates their commitment to the business.
|
Globalworth Shareholding |
|||
|
|
|
30 June 25 |
30 June 26 |
|
CPI Property Group |
Together: Zakiono Enterprises |
60.9% |
60.9% |
|
Aroundtown |
|||
|
Growthpoint Properties |
|
29.6% |
29.6% |
|
Oak Hill Advisors |
|
4.7% |
4.7% |
|
Others |
|
4.8% |
4.8% |
|
Basic Data on Globalworth Shares (Information as of 30 June 2026) |
||
|
Number of Shares |
300.6m plus 0.7m shares held in treasury |
|
|
Share Capital |
€1.9bn |
|
|
WKN / ISIN |
GG 00B979FD04 |
|
|
Symbol |
GWI |
|
|
Free Float |
7.4% |
|
|
Exchange |
London AIM |
|
|
Globalworth Share Performance |
|||
|
|
H1-2025 |
H1-2026 |
|
|
Market Capitalisation (€ million) - 30 June |
689 |
510 |
|
|
30-June Closing Price (€) |
2.37 |
1.70 |
|
|
52-week high (€) |
2.69 |
2.41 |
|
|
52-week low (€) |
2.23 |
1.66 |
|
|
Dividend paid per share (€) |
0.09 |
0.05 |
|
|
Globalworth H1-2026 Share Price Performance |
|
|
Bonds Update
We finance ourselves through a combination of equity and debt, and we compete with many other real estate companies for investor trust to support our initiatives.
Following our bond refinancing exercise in 2024, and subsequent redemptions and buybacks, total debt stood at €1.2 billion as of 30 June 2026. Our two bonds, which currently comprise €98.9 million of Senior Notes due in 2029 and €268.4 million of Senior Notes due in 2030, together with the €85 million IFC unsecured loan, make up less than €0.5 billion of the total debt. The balance is financed through secured loans with reputable local and regional banking groups.
During the first half of 2026 we redeemed €125m of our Senior Notes due in 2029 which we funded from existing liquidity resources, anticipating a positive impact on our overall financing costs.
This proactive approach to managing debt and liquidity underscores GWI's commitment to maintaining financial health and maintaining strategic flexibility in an evolving market landscape.
Globalworth is rated by two of the three major agencies. Fitch maintained our investment-grade rating of BBB- with a stable outlook after its annual review of the Group. S&P kept the Group's corporate credit rating at BB, also maintaining a stable outlook.
|
Rating |
|
|
|
|
S&P |
Fitch |
|
Rating |
BB |
BBB- |
|
Outlook |
Stable |
Stable |
|
Basic Data on the Globalworth Bonds |
|
|
|
|
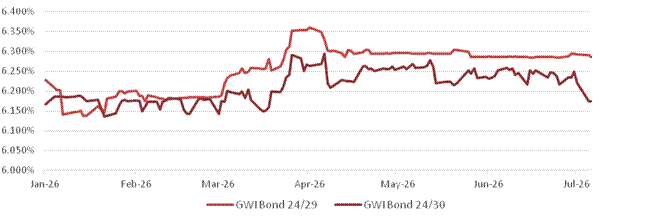
GWI bond 24/29 |
GWI bond 24/30 |
|
ISIN |
XS2809858561 |
XS2809868446 |
|
Segment |
Euronext Dublin |
Euronext Dublin |
|
Minimum investment amount |
€100,000 and €1,000 thereafter |
€100,000 and €1,000 thereafter |
|
Coupon |
6.250% |
6.250% |
|
Issuance volume |
€307.1 million |
€333.4 million |
|
Outstanding 30 June 2026 |
€98.9 million |
€268.4 million |
|
Maturity |
31 March 2029 |
31 March 2030 |
|
Performance of the Globalworth Bonds |
|
|
||
|
|
H1-2025 |
H1-2026 |
||
|
GWI bond 24/29 |
|
|
||
|
30 June closing price |
101.77 |
101.55 |
||
|
Yield to maturity on 30 June |
6.2% |
6.3% |
||
|
GWI bond 24/30 |
|
|
||
|
30 June closing price |
101.85 |
101.61 |
||
|
Yield to maturity on 30 June |
6.2% |
6.2% |
||
|
Globalworth H1-2026 Eurobond Yield Performance |
|
|
FINANCIAL REVIEW
1. Introduction and Highlights
The Group delivered a solid performance in the first half of 2026, with revenue increasing by 3.6% to €119.9 million, NOI by 2.1% to €68.4 million and adjusted normalised EBITDA by 2.1% to €58.5 million. EPRA earnings increased to €24.0 million, or 8 cents per share, supported by the improvement in operating performance. IFRS profit increased to €20.2 million, or 7 cents per share, reflecting the higher operating result and a €7.7 million revaluation gain.
The Group maintained a strong balance sheet, with a combined portfolio value of €2.6 billion, cash and cash equivalents of €273.4 million and an LTV of 36.7%, remaining below the Group's long-term target of around 40%. During the period, we redeemed €125 million of the 2029 Notes using existing cash resources, reducing total debt and the weighted average cost of debt to 4.68%. With 90.7% of debt fixed or hedged and full compliance with all financial covenants, the Group remains well positioned to meet its obligations and continue investing selectively in the quality and long-term value of its portfolio.
We measure our performance using a range of metrics widely recognized in the real estate sector, based on consolidated figures, incorporating our joint ventures, to show in the best way possible how we manage our portfolio and operations. Additionally, we report like-for-like metrics and adopt standards set by EPRA, aimed at enhancing transparency and ensuring comparability across the European real estate industry.
|
Revenues €119.9 3.6% on H1 2025 |
Combined Portfolio Value (OMV)1 €2.6bn 0.4% on 31 Dec. 2025 |
|
NOI1 €68.4m 2.1% on H1 2025 |
NOI1 Like-for like €68.3m 0.1% on H1 2025 |
|
Adjusted normalised EBITDA1 €58.5m 2.1% on H1 2025 |
Adjusted normalised EBITDA1 Like-for-Like €58.4m €58.4m in H1 2025 |
|
IFRS Earnings per share2 7 cents 3 cents in H1 2025 |
EPRA NRV per share1,3 €5.52 -1.8% on 31 Dec. 2025 |
|
EPRA NRV1,3 €1,659.3m 1.7% on 31 Dec. 2025 |
EPRA Earnings per share1,2 8 cents 6 cents in H1 2025 |
|
LTV1,4 36.7% 37.0% at 31 Dec. 2025 |
Dividends paid in H1 2026 per share 5 cents 9 cents in H1 2025 |
1. See Glossary for definitions.
2. See note 12 of the unaudited condensed consolidated financial statements for calculation.
3. See note 20 of the unaudited condensed consolidated financial statements for calculation.
4. See note 17 of the unaudited condensed consolidated financial statements for calculation.
2. Revenues and Profitability
Total consolidated revenue generated by our properties in the first half of 2026 was €119.9 million, an increase of €4.2 million, or 3.6%, compared with the same period in 2025.
Rental income, our core revenue stream, was €76.2 million in H1 2026, compared with €74.9 million in the same period of 2025. Of the total, €40.5 million, or 53%, was generated in Poland (H1 2025: €39.2 million; 53%) and €35.7 million, or 47%, was generated in Romania (H1 2025: 47%).
|
Revenue share per country
|
Period ended 30 June 2026 |
Period ended 30 June 2025 |
|
Romania |
47% |
47% |
|
Poland |
53% |
53% |
Our Net Operating Income ("NOI") was €68.4 million, €1.4 million or 2.1% higher than €67.0 million NOI recorded in H1 2025. However, the like-for-like NOI for H1 2026 was €68.3 million, with only €0.1 million higher, or 0.1%, than H1 2025, after excluding the €1.6 million one-off non recoverable operating costs recorded in H1 2025 and €0.1 million NOI generated in H1 2026 by the disposed property (H1 2025: €0.5 million).
The majority of our leases are triple-net leases; therefore, most operating expenses are recharged to tenants. At Group level, the recovery rate was approximately 83% (H1 2025: approximately 83%), comprising 91% in Romania and 79% in Poland (H1 2025: 92% and 76%, respectively).
|
NOI share per country |
Period ended 30 June 2026 |
Period ended 30 June 2025 |
|
Romania |
50% |
51% |
|
Poland |
50% |
49% |
Adjusted normalised EBITDA reached €58.5 million in H1 2026 (H1 2025: €57.3 million), an increase of €1.2 million, or 2.1%, reflecting the €1.4 million increase in NOI, partly offset by a €0.2 million increase in administrative expenses.
Finance costs for H1 2026 were €35.7 million (H1 2025: €34.7 million), an increase of €1.0 million, mainly reflecting:
· €1.3 million increase in interest on secured loans following drawdowns under new facilities in the second half of 2025
· €3.1 million decrease in interest on fixed-rate Notes following the redemption of €125 million of 2029 Notes in February 2026
· €2.9 million increase in debt-issue cost amortisation, reflecting the close-out costs associated with the Notes redeemed; and
· €0.1 million decrease in bank charges and interest on lease liabilities
Finance income for H1 2026 was €2.6 million, €2.9 million lower than in H1 2025, mainly reflecting:
· a €1.7 million decrease in income from short-term and overnight placements with banks;
· a €1.3 million decrease in income from a loan receivable, which was collected in full in the second half of 2025; partly offset by
· a €0.1 million increase in interest income from discounting.
Profit before tax in H1 2026 was €32.0 million, compared with €21.2 million in H1 2025. This included a revaluation gain of €7.7 million, compared with a revaluation loss of €1.7 million in H1 2025.
Current income tax expense was €2.0 million, €5.6 million lower than in H1 2025 (€7.6 million), as the prior period included a one-off withholding tax charge of €5.9 million in Poland. Deferred income tax expense was €9.9 million (H1 2025: €5.5 million), mainly reflecting the uplift in investment property valuations
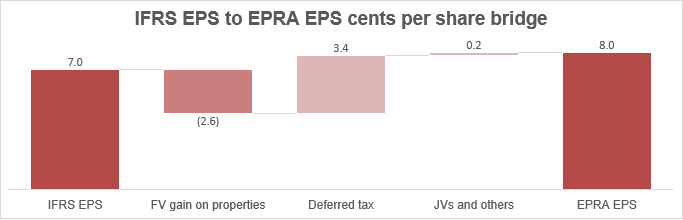
EPRA earnings for the first half of 2026 were €24.0 million, or 8 cents per share, an increase of €6.3 million, primarily reflecting higher adjusted normalised EBITDA and lower withholding tax expense in Poland. EPRA earnings per share were moderated by the increase in the weighted average number of shares to 295.5 million in H1 2026 (H1 2025: 285.2 million), following the issue of scrip dividend shares in April 2026.
IFRS earnings for H1 2026 were €20.2 million, or 7 cents per share, compared with €8.0 million, or 3 cents per share, in H1 2025.
3. Balance Sheet
As of 30 June 2026, we own real estate that makes up most of our assets, with investment properties and cash equivalents accounting for over 97% of our total value.
The combined market value of our investment property portfolio was €2,631.9 million, an increase of €11.5 million from 31 December 2025 (€2,620.4 million). This comprised €2,623.7 million of wholly owned investment property and €8.2 million (31 December 2025: €7.9 million), representing 100% of the value of properties held by a joint venture in which we have a 50% interest
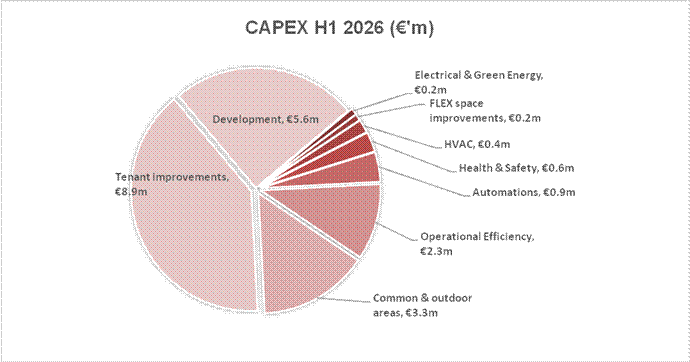
The carrying value of our wholly owned investment property, excluding €6.9 million of land held for sale, was €2,616.8 million, comprising €1,215.3 million in Romania and €1,401.5 million in Poland. During the period, we invested €22.4 million in our properties (€10.5 million in Romania and €11.9 million in Poland) and recorded a fair value gain of €8.9 million for investment property freehold (€8.2 million in Romania and €0.7 million in Poland). We continued to dispose of residential properties in Romania, selling assets with a total fair value of €3.7 million, and sold an office property in Warsaw, Poland, with a fair value of €9.2 million.
The pie chart below presents further details of our capital expenditure:
Our cash position remained strong at €273.4 million at 30 June 2026, compared with €410.6 million at 31 December 2025, following the redemption of €125 million of the 2029 Notes at 102% of par value in February 2026.
Total assets at the end of the period were €2,995 million, 4.0% lower compared to €3,118 million at 31 December 2025.
EPRA NRV was €1,659.3 million at 30 June 2026, 1.7% higher than €1,631.5 million at 31 December 2025. EPRA NRV per share was €5.52 (31 December 2025: €5.62), a decrease of 1.8%. The decrease in EPRA NRV per share was driven by the increase in the fully diluted number of shares following the issue of 10.0 million scrip dividend shares in April 2026.
4. Dividends
Globalworth distributes at least 90% of its EPRA Earnings to shareholders on a biannual basis. The distribution in the first half of 2026 included a scrip dividend alternative, under which qualifying shareholders could elect to receive new ordinary shares in the Company instead of cash in respect of all or part of their dividend entitlement. The number of Scrip Dividend Shares was calculated using a price representing a 20% discount to the average middle-market quotation for the Company's shares over the five consecutive dealing days beginning on the Ex-Dividend Date (the 'Reference Price').
The dividend declared for the six-month period ended 31 December 2025 was 5 cents per share. Following the scrip dividend election, 10.0 million new shares were issued in April 2026, and the Group paid a total cash dividend of €0.3 million, resulting in shareholders representing 98.03% of Globalworth's share capital opting to reinvest in the Company.
The results for the period are set out in the consolidated statement of comprehensive income from the interim condensed consolidated financial statements below.
5. Financing and Liquidity Review
Our key priorities included maintaining strong cash reserves, managing debt maturities, reducing the weighted average cost of debt and preserving access to revolving credit facilities for unforeseen liquidity needs.
We closely monitor our cost of debt and manage interest-rate risk through hedging and by adjusting the mix of fixed- and floating-rate debt. Regular monitoring of covenant compliance and opportunities to reduce financing costs is also central to maintaining financial flexibility.
Debt Summary
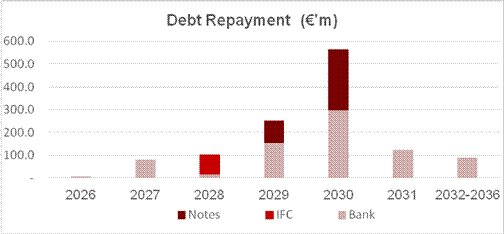
The Group's total debt at 30 June 2026 was €1,219.9 million (31 December 2025: €1,353.3 million), comprising mainly medium- to long-term debt denominated entirely in euros. This included €85.0 million of unsecured loans, €367.3 million of unsecured Notes and €767.6 million of secured loans.
In the first half of 2026, the Company announced on 26 January 2026 and completed on 5 February 2026 the redemption of €125 million of 2029 Notes at 102% of par value plus accrued interest, funded from existing cash resources.
In March 2026, the Group signed a €39.4 million secured facility with Banca Transilvania to finance the development of the new Green Court D office project. The facility is available for drawdown until September 2028, followed by a ten-year repayment period.
Our debt portfolio continues to demonstrate a highly hedged interest rate structure with a predominance of fixed-rate debt, providing protection against interest rate volatility while maintaining a gradual reduction in funding costs.
As of 30 June 2026, our debt portfolio maintained a strong fixed-rate positioning, with 90.7% of total liabilities bearing fixed interest rates, compared to 91.4% at year-end 2025. The weighted average term of Euribor variable-fixed rate swap instruments was 3.50 years (31 December: 3.92 years) and the average hedged rate against Euribor in variable-fixed interest rate swaps was unchanged at 1.93% on 30 June 2026.
The Group's weighted average interest rate decreased slightly to 4.68% from 4.81% as of 31 December 2025. The weighted average debt maturity was 4.1 years (31 December 2025: 4.6 years), as shown in the chart below.
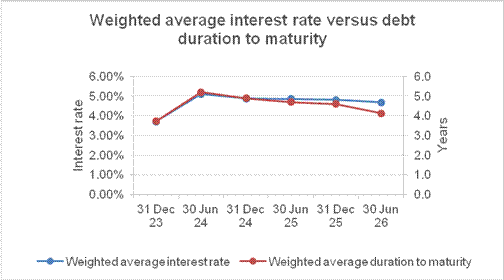
· Average cost of debt: 4.68%
· Weighted average debt: 4.1 years
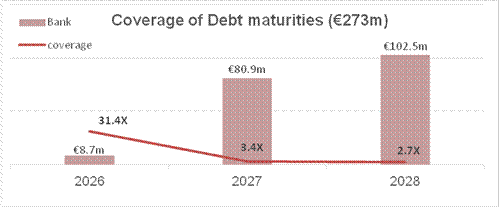
The Group has a €62.7 million credit facility maturing in February 2027. The Group has commenced discussions regarding the refinancing of the facility and, based on its liquidity position at 30 June 2026, also has sufficient resources to repay it at maturity if required. This flexibility allows the Group to evaluate refinancing alternatives on appropriate terms while maintaining a prudent liquidity position.
|
Liquidity & Loan-to-value ratio (LTV)
Careful management of our financial and operational resources remained a key focus throughout this period of heightened volatility and uncertainty.
Of the Group's €273.4 million of cash and cash equivalents at 30 June 2026 (31 December 2025: €410.6 million), €31.0 million was restricted under conditions imposed by financing banks.
The Group's loan-to-value ratio at 30 June 2026 was 36.7% (31 December 2025: 37.0%), consistent with its strategy of maintaining long-term LTV at or below approximately 40%.
Debt Structure as at 30 June 2026
Debt Structure - Secured vs. Unsecured Debt
At 30 June 2026, unsecured facilities represented 37.1% of total debt outstanding (31 December 2025: 42.7%). These comprised Notes maturing in 2029 and 2030 totalling €367.3 million and the €85.0 million IFC facility. The remaining 62.9% of total debt was secured by real estate mortgages, share and receivables pledges, and loan subordination agreements in favour of the financing banks.
Debt Denomination Currency and Interest Rate Risk
Our loan facilities are denominated entirely in euros. At 30 June 2026, 9.3% of total debt carried floating interest rates based on three-or six-month EURIBOR plus a margin (31 December 2025: 8.6%), 60.6% carried fixed interest rates (31 December 2025: 63.9%) and 30.1% was hedged through interest-rate swaps (31 December 2025: 27.5%). Accordingly, 90.7% of total debt was fixed or hedged at 30 June 2026 (31 December 2025: 91.4%).
The euro denomination of our debt provides a natural currency hedge against our predominantly euro-denominated liquid assets, rental receivables and investment property values, while fixed-rate debt and interest-rate swaps mitigate interest-rate risk. Based on the Group's debt balances at 30 June 2026, a 100-basis-point increase in EURIBOR would increase annual interest expense by approximately €1.1 million.
Debt Covenants
As of 30 June 2026, the Group is in compliance with all of its debt covenants.
The Group's financial indebtedness is arranged with standard terms and financial covenants, the most notable being the following:
Unsecured Notes and IFC loan:
· the Consolidated Coverage Ratio, with minimum value of 150% (covenant value was aligned for all debt facilities)
· the Consolidated Leverage Ratio, with maximum value of 60%
· the Consolidated Secured Leverage Ratio with a maximum value of 30%, and
· the Total Unencumbered Assets Ratio, with minimum value of 125% (additional covenant applicable for the IFC loan).
Secured Bank Loans:
· the debt service cover ratio ('DSCR') / interest cover ratio ('ICR'), with values starting from 120% (be it either historic or projected), and
· the LTV ratio, with contractual values ranging from 45% to 83%.
6. Principal Risks and Uncertainties
The principal risks which may have a material impact on the Group's performance, together with the corresponding mitigating actions, are presented on pages 56 to 61 of the Annual Report for the year ended 31 December 2025, which is available at www.globalworth.com.
These principal risks comprise the following:
· Market conditions and the economic environment, particularly in Romania and Poland
· Changes in the political or regulatory framework in Romania, Poland or the European Union
· Inflation in Romania and Poland
· Execution of investment strategy
· Valuation of portfolio
· Inability to lease space
· Counterparty credit risk
· Sustainable portfolio risk and response to climate change
· Lack of available financing and refinancing
· Breach of loan covenants
· Changes in Interest and foreign exchange rates
· Compliance with fire, structural, health and safety, or other regulations, and
· Cyber security
There have been no new principal risks identified during the six-month period ended 30 June 2026, and the identified principal risks are expected to continue to remain relevant during the second half of 2026.
7. Going Concern
The Directors have considered the Company's ability to continue to operate as a going concern based on the Management's cash flow projections for the 15 months subsequent to the date of approval of the unaudited interim condensed consolidated financial statements. The Directors believe that the Company would have sufficient cash resources to meet its obligations as they fall due and continue to adopt the going concern basis in preparing the unaudited interim condensed consolidated financial statements as of and for the six months ended 30 June 2026.
GLOBALWORTH REAL ESTATE INVESTMENTS LIMITED
UNAUDITED INTERIM CONDENSED CONSOLIDATED FINANCIAL STATEMENTS
FOR THE PERIOD ENDED 30 JUNE 2026
INTERIM CONDENSED CONSOLIDATED STATEMENT OF COMPREHENSIVE INCOME
FOR THE SIX-MONTH PERIOD ENDED 30 JUNE 2026
|
|
|
30 June 2026 |
30 June 2025 |
|
|
|
|
Unaudited |
Unaudited |
|
|
|
Note |
€'000 |
€'000 |
|
|
Revenue |
7 |
119,907 |
115,697 |
|
|
Operating expenses |
8 |
(51,484) |
(48,654) |
|
|
Net operating income |
|
68,423 |
67,043 |
|
|
Administrative expenses |
9 |
(9,902) |
(9,764) |
|
|
Fair value gain/(loss) on investment property |
3.4 |
7,683 |
(1,659) |
|
|
Share-based payment expense |
21 |
(102) |
(128) |
|
|
Loss on disposal of investment property |
3.5 |
(89) |
- |
|
|
Depreciation and amortisation expense |
|
(434) |
(554) |
|
|
Other expenses |
|
(764) |
(1,468) |
|
|
Other income |
|
203 |
141 |
|
|
Foreign exchange loss |
|
(1,412) |
(1,268) |
|
|
Profit/(Loss) from fair value of financial instruments at fair value through profit or loss |
|
1,503 |
(2,021) |
|
|
Profit before net financing cost |
|
65,109 |
50,322 |
|
|
Finance cost |
10 |
(35,709) |
(34,657) |
|
|
Finance income |
10.2 |
2,597 |
5,544 |
|
|
Share of profit/(loss) of equity-accounted investments in joint ventures |
22 |
51 |
(59) |
|
|
Profit before tax |
|
32,048 |
21,150 |
|
|
Income tax expense |
11 |
(11,880) |
(13,119) |
|
|
Profit for the period |
|
20,168 |
8,031 |
|
|
Total comprehensive income for the period |
|
20,168 |
8,031 |
|
|
Profit attributable to: |
|
20,168 |
8,031 |
|
|
- ordinary equity holders of the Company |
|
20,168 |
8,031 |
|
|
Total comprehensive income attributable to: |
|
20,168 |
8,031 |
|
|
- ordinary equity holders of the Company |
|
20,168 |
8,031 |
|
|
|
|
Cents |
Cents restated* |
|
|
Earnings per share |
|
|
|
|
|
- Basic |
12 |
7 |
3 |
|
|
- Diluted |
12 |
7 |
3 |
|
* The IFRS earnings per share as of 30 June 2025 have been restated following the IAS 33 'Earnings per share' requirements regarding accounting for scrip dividend shares issued in the period of 01 January 2026 to 30 June 2026.
INTERIM CONDENSED CONSOLIDATED STATEMENT OF FINANCIAL POSITION
AS AT 30 JUNE 2026
|
|
|
30 June 2026 |
31 December 2025 |
|
|
|
Unaudited |
Audited |
|
|
Notes |
€'000 |
€'000 |
|
ASSETS |
|
|
|
|
Investment property |
3 |
2,643,951 |
2,642,130 |
|
Goodwill |
|
12,039 |
12,039 |
|
Advances for investment property |
5 |
3,320 |
1,317 |
|
Investments in joint ventures |
22 |
4,236 |
4,074 |
|
Equity investments |
|
8,313 |
8,272 |
|
Other long-term assets |
|
1,989 |
2,064 |
|
Prepayments |
|
204 |
240 |
|
Non-current financial assets |
|
9,686 |
8,789 |
|
Deferred tax asset |
11.1 |
2,071 |
2,059 |
|
Non-current assets |
|
2,685,809 |
2,680,984 |
|
Trade and other receivables |
14 |
16,825 |
16,568 |
|
Contract assets |
|
6,044 |
7,113 |
|
Guarantees retained by tenants |
|
24 |
40 |
|
Income tax receivable |
|
102 |
720 |
|
Prepayments |
|
5,439 |
2,173 |
|
Cash and cash equivalents |
15 |
273,355 |
410,594 |
|
Current assets |
|
301,789 |
437,208 |
|
Investment property held for sale |
|
6,910 |
- |
|
Total current assets |
|
308,699 |
437,208 |
|
Total assets |
|
2,994,508 |
3,118,192 |
|
EQUITY AND LIABILITIES |
|
|
|
|
Issued share capital |
18 |
1,861,763 |
1,847,532 |
|
Treasury shares |
21.1 |
(4,711) |
(4,722) |
|
Share-based payment reserve |
|
36 |
200 |
|
Retained earnings |
|
(318,404) |
(324,047) |
|
Fair value reserve of financial assets at FVOCI |
|
(5,379) |
(5,379) |
|
Total equity |
|
1,533,305 |
1,513,584 |
|
Interest-bearing loans and borrowings |
13 |
1,133,642 |
1,327,575 |
|
Deferred tax liability |
11.1 |
135,965 |
126,050 |
|
Lease liabilities |
3.2 |
24,960 |
27,511 |
|
Deposits from tenants |
|
4,647 |
3,994 |
|
Guarantees retained from contractors |
|
3,215 |
3,032 |
|
Other financial liabilities |
|
368 |
973 |
|
Non-current liabilities |
|
1,302,797 |
1,489,135 |
|
Interest-bearing loans and borrowings |
13 |
94,378 |
40,100 |
|
Guarantees retained from contractors |
|
3,186 |
4,600 |
|
Trade and other payables |
|
33,894 |
34,422 |
|
Contract liability |
|
3,270 |
3,802 |
|
Current portion of lease liabilities |
|
1,705 |
1,975 |
|
Deposits from tenants |
|
19,226 |
19,696 |
|
Income tax payable |
|
2,747 |
10,878 |
|
Current liabilities |
|
158,406 |
115,473 |
|
Total equity and liabilities |
|
2,994,508 |
3,118,192 |
The financial statements were approved by the Board of Directors on 21 September 2026 and were signed on its behalf by:
Andreas Tautscher,
Director
INTERIM CONDENSED CONSOLIDATED STATEMENT OF CHANGES IN EQUITY
FOR THE SIX-MONTH PERIOD ENDED 30 JUNE
|
|
|
Issued share capital |
Treasury shares |
Share- based payment reserve |
Retained earnings |
Fair value reserve of financial assets at FVOCI |
Total Equity |
|
|
Notes |
€'000 |
€'000 |
€'000 |
€'000 |
€'000 |
€'000 |
|
As at 1 January 2026 |
|
1,847,532 |
(4,722) |
200 |
(324,047) |
(5,379) |
1,513,584 |
|
Interim dividends paid in cash and scrip dividend |
19 |
14,240 |
11 |
- |
(14,525) |
- |
(274) |
|
Transaction costs on issuance of shares for cash |
|
(9) |
- |
- |
- |
- |
(9) |
|
Settlement of share-based payment |
21 |
- |
- |
(266) |
- |
- |
(266) |
|
Share - based payment expense |
21 |
- |
- |
102 |
- |
- |
102 |
|
Profit for the period |
|
- |
- |
- |
20,168 |
- |
20,168 |
|
Total comprehensive income for the period |
|
- |
- |
- |
20,168 |
- |
20,168 |
|
At 30 June 2026 |
|
1,861,763 |
(4,711) |
36 |
(318,404) |
(5,379) |
1,533,305 |
|
|
|
Issued share capital |
Treasury shares |
Share- based payment reserve |
Retained earnings |
Fair value reserve of financial assets at FVOCI |
Total Equity |
|
|
|
€'000 |
€'000 |
€'000 |
€'000 |
€'000 |
€'000 |
|
As at 1 January 2025 |
|
1,822,934 |
(4,752) |
185 |
(294,036) |
(5,379) |
1,518,952 |
|
Interim dividends paid in cash and scrip dividend |
|
24,616 |
19 |
- |
(25,081) |
- |
(446) |
|
Transaction costs on issuance of shares for cash |
|
(10) |
- |
- |
- |
- |
(10) |
|
Settlement of share-based payment |
|
- |
- |
(246) |
- |
- |
(246) |
|
Share - based payment expense |
|
- |
- |
128 |
- |
- |
128 |
|
Profit for the period |
|
- |
- |
- |
8,031 |
- |
8,031 |
|
Total comprehensive income for the period |
|
- |
- |
- |
8,031 |
- |
8,031 |
|
At 30 June 2025 |
|
1,847,540 |
(4,733) |
67 |
(311,086) |
(5,379) |
1,526,409 |
INTERIM CONDENSED CONSOLIDATED STATEMENT OF CASH FLOWS
FOR THE SIX-MONTH PERIOD ENDED 30 JUNE 2026
|
|
Notes |
30 June 2026 €'000 |
30 June 2025 €'000 |
|
Operating activities |
|
|
|
|
Profit before tax |
|
32,048 |
21,150 |
|
|
|
|
|
|
Adjustments to reconcile profit before tax to net cash flows: |
|
|
|
|
Fair value adjustment of investment property |
3.4 |
(7,683) |
1,659 |
|
Loss on sale of residential properties |
|
233 |
19 |
|
Share-based payment expense |
21 |
102 |
128 |
|
Depreciation and amortisation expense |
|
434 |
554 |
|
Net movement in allowance for expected credit losses |
16.2 |
436 |
(264) |
|
Net foreign exchange differences |
|
1,412 |
1,268 |
|
Profit/(loss) from fair valuation of financial instrument at fair value through profit or loss |
|
(1,503) |
2,021 |
|
Loss on disposal of investment property |
3.5 |
89 |
- |
|
Share of (profit)/loss of a joint venture |
22.4 |
(51) |
59 |
|
Finance income |
10.2 |
(2,597) |
(5,544) |
|
Finance costs |
10 |
35,709 |
34,657 |
|
Operating profit before changes in working capital |
|
58,629 |
55,707 |
|
|
|
|
|
|
Decrease in contract assets, trade and other receivables |
|
9,693 |
2,647 |
|
(Decrease)/Increase in contract liabilities, trade and other payables |
|
(2,459) |
4,511 |
|
Interest paid |
|
(38,131) |
(30,749) |
|
Interest received |
|
2,251 |
4,014 |
|
Income tax paid |
|
(9,565) |
(2,246) |
|
Net cash flows from operating activities |
|
20,418 |
33,884 |
|
|
|
|
|
|
Investing activities |
|
|
|
|
Expenditure on investment property completed |
|
(22,030) |
(28,876) |
|
Expenditure on investment property under development |
|
(7,588) |
- |
|
Advances for investment property |
3.5 |
755 |
- |
|
Proceeds from disposal of subsidiary |
|
- |
1,000 |
|
Proceeds from sale of investment property |
3.5 |
12,239 |
4,271 |
|
Payments for equity investments |
|
(41) |
(190) |
|
Payment for purchase of other long-term assets |
|
(309) |
(566) |
|
Net cash flows used in investing activities |
|
(16,974) |
(24,361) |
|
|
|
|
|
|
Financing activities |
|
|
|
|
Transaction costs of issue of scrip dividend shares |
|
(9) |
(10) |
|
Proceeds from interest-bearing loans and borrowings |
|
- |
44,966 |
|
Repayments of interest-bearing loans and borrowings |
13 |
(135,949) |
(51,190) |
|
Interim dividend paid (net of scrip) |
19 |
(274) |
(446) |
|
Payment for lease liability obligations |
3.2 |
(1,915) |
(2,018) |
|
Payments for financial assets at fair value through profit or loss |
|
- |
(6,136) |
|
Payment of bank loan arrangement fees and other financing costs |
|
(451) |
(2,000) |
|
Net cash flows used in financing activities |
|
(138,598) |
(16,834) |
|
|
|
|
|
|
Net decrease in cash and cash equivalents |
|
(135,154) |
(7,311) |
|
Net foreign exchange difference |
|
(2,085) |
(793) |
|
Cash and cash equivalents on 1 January |
15 |
410,594 |
333,560 |
|
Cash and cash equivalents on 30 June |
15 |
273,355 |
325,456 |
NOTES TO THE INTERIM CONDENSED CONSOLIDATED FINANCIAL STATEMENTS
SECTION I: BASIS OF PREPARATION
1. Basis of Preparation
Corporate Information
Globalworth Real Estate Investments Limited ('the Company' or 'Globalworth') is a company with liability limited by shares and incorporated and domiciled in Guernsey on 14 February 2013, with registered number 56250. The registered office of the Company is located at PO Box 336, Fourth Floor, Plaza House, Admiral Park, St Peter Port, Guernsey, GY1 3UQ. Globalworth, being a real estate entity, has had its ordinary shares admitted to trading on AIM (Alternative Investment Market of the London Stock Exchange) under the ticker "GWI" since 2013.
On 23 July 2021 Zakiono Enterprises Limited ("Zakiono"), a company wholly owned by Tevat Limited, became a controlling shareholder by holding 60.6% share capital of the company through public offer. Tevat Limited is a joint venture between CPI Property Group S.A. and Aroundtown SA. As of 30 June 2026, Zakiono holds 60.9% share capital of the company.
The Company's Eurobonds were admitted to the Official List of Euronext Dublin and to trading on its Global Exchange Market (GEM) in April 2024. The main country of operation of the Company is Guernsey. The Group's principal activities and nature of its operations are mainly investments in real estate properties, through both acquisition and development, as set out in the Strategic Report section of the 2025 Annual Report.
Directors
The Directors of the Company are:
· Piotr Olendski, Joint Chief Executive Officer and Executive Director
· Martin Bartyzal, Independent Non-Executive, Chair of the Board, Member of the Remuneration Committee
· Andreas Tautscher, Senior Independent Non-Executive, Chair of the Audit and Risk Committee, Member of Nomination Committee
· Daniel Malkin, Independent Non-Executive, Chair of the Nomination Committee, Member of the Audit & Risk Committee
· Favieli Stelian, Independent Non-Executive, Chair of the Investment Committee, Member of the Remuneration Committee
· Norbert Sasse, Non-Executive, Member of the Investment Committee
· Panico Theocharides, Non-Executive, Member of the Nomination Committee
· Richard van Vliet, Independent Non-Executive, Chair of the Remuneration Committee and Member of the Audit & Risk Committee
· David Maimon, Independent Non-Executive, Member of the Audit & Risk Committee and Investment Committee
On 6 November 2025, Roy Vishnovizki was appointed Joint Chief Executive Officer alongside Piotr Olendski. He is not a director of the Company.
Basis of Preparation and Compliance
The interim condensed consolidated financial statements of the Group (or 'financial statements' or 'consolidated financial statements') for the six months ended 30 June 2026 have been prepared in accordance with International Accounting Standard (IAS) 34 "Interim Financial Reporting". These interim condensed consolidated financial statements are presented in euros ("EUR" or "€") and all values are rounded to the nearest thousand ("000") unless otherwise indicated, being the functional currency and presentation currency of the Company.
These consolidated financial statements have been prepared on a historical cost basis, except for investment property, financial assets at fair value through other comprehensive income and financial assets at fair value through profit or loss that have been measured at fair value.
The Company has prepared the financial statements on the basis that it will continue to operate as a going concern. The Directors have considered the Company's ability to continue to operate as a going concern based on the management's cash flow projections for the 15 months subsequently to the date of approval of the unaudited interim condensed consolidated financial statements. The Directors believe that the Company would have sufficient cash resources to meet its obligations as they fall due to and continue to adopt the going concern basis preparing the unaudited interim condensed consolidated financial statements for the six months ended 30 June 2026.
Accounting policies
These consolidated financial statements apply the same accounting policies, presentation and methods of calculation as those followed in the preparation of the Group's consolidated financial statements for the year ended 31 December 2025, which were prepared in accordance with International Financial Reporting Standards ('IFRS') as adopted by the European Union ('EU') and the Companies (Guernsey) Law 2008, as amended. The interim condensed consolidated financial statements included in this Interim Report do not include all the information and disclosures required in the annual financial statements and should be read in conjunction with the consolidated financial statements for the year ended 31 December 2025.
Basis of Consolidation
These condensed consolidated financial statements comprise the financial statements of the Company and its subsidiaries ('the Group') as of and for the period ended 30 June. Subsidiaries are fully consolidated (refer to note 23) from the date of acquisition, being the date on which the Group obtains control, and continues to be consolidated until the date when such control ceases. The financial statements of the subsidiaries are prepared for the period from the date of obtaining control to 30 June, using consistent accounting policies. All intra-group balances, transactions and unrealised gains and losses resulting from intra-group transactions are eliminated in full. Non-controlling interest represents the portion of profit or loss, other comprehensive income and net assets not held by the Group and is presented separately in the income statement and within equity in the consolidated statement of financial position, separately from net assets and profit and loss attributable to the equity holders of the Company.
Foreign Currency transactions and balances
Foreign currency transactions during the period are initially recorded in the functional currency at the exchange rates approximating those ruling on the date of the transaction. Monetary assets and liabilities denominated in foreign currencies other than functional currency of the Company and its subsidiaries are retranslated at the rates of exchange prevailing on the statement of financial position date. Gains and losses on translation are taken to profit and loss. Non-monetary items that are measured in terms of historical cost in a foreign currency are translated using the exchange rates as at the dates of the initial transactions. Non-monetary items measured at fair value in a foreign currency are translated using the exchange rates at the date when the fair value was determined.
2. Critical Accounting Judgements, Estimates and Assumptions
The preparation of consolidated financial statements in conformity with IFRS Accounting Standards requires management to make certain judgements, estimates and assumptions that affect reported amounts of revenue, expenses, assets and liabilities, and the accompanying disclosures and the disclosures of contingent liabilities.
Selection of Functional Currency
The Company and its subsidiaries used their judgment, based on the criteria outlined in IAS 21 "The Effects of Changes in Foreign Exchanges Rates", and determined that the functional currency of all the entities is the EUR. In determining the functional currency consideration is given to the denomination of the major cash flows of the entity e.g., revenues and financing.
Consequently, the Company uses EURO (€) as the functional currency, rather than the local currency Romanian Lei ("RON") for the subsidiaries incorporated in Romania, Polish Zloty ("PLN") for the subsidiaries in Poland and Pounds Sterling ("GBP") for the Company and the subsidiary incorporated in Guernsey.
Further additional critical accounting judgements, estimates and assumptions are disclosed in the following notes to the financial statements.
· Investment Property, see note 3 and Fair value measurement and related estimates and judgements, see note 4;
· Commitments (operating leases commitments - Group as lessor), see note 6;
· Taxation, see note 11;
· Trade and other receivables, see note 14;
· Share-based payment reserve, see note 21;
· Investment in Joint Ventures, see note 22; and
· Investment in Subsidiaries, see note 23.
NOTES TO THE INTERIM CONDENSED CONSOLIDATED FINANCIAL STATEMENTS
SECTION II: INVESTMENT PROPERTY
This section focuses on the assets on the balance sheet of the Group which form the core of the Group's business activities. This includes investment property (both 100% owned by the Group and by the Joint Ventures), related disclosures on fair valuation inputs, commitments for future property developments and investment property-leasehold and related lease liability recognised for the right of perpetual usufruct of the lands. Further information about the property portfolio is described in the Management Review section of the Interim Report.
3. Investment Property
|
|
|
Investment property - freehold |
Investment property leasehold- Right of usufruct of the land |
TOTAL |
||||
|
|
|
Completed investment property |
Investment property under refurbishment |
Investment property under development |
Land for further development |
Sub-total |
||
|
|
Note |
€'000 |
€'000 |
€'000 |
€'000 |
€'000 |
€'000 |
€'000 |
|
1 January 2025 |
|
2,416,010 |
110,860 |
12,300 |
19,400 |
2,558,570 |
26,775 |
2,585,345 |
|
Subsequent expenditure |
|
37,875 |
4,473 |
957 |
18 |
43,323 |
- |
43,323 |
|
Net lease incentive movement |
|
(2,074) |
951 |
- |
- |
(1,123) |
- |
(1,123) |
|
Transfer to completed investment property |
|
115,620 |
(115,620) |
7,100 |
(7,100) |
- |
- |
- |
|
Disposal during the year |
|
(6,891) |
- |
- |
- |
(6,891) |
- |
(6,891) |
|
Transfer from held for sale assets |
|
33,230 |
- |
- |
- |
33,230 |
2,533 |
35,763 |
|
Additions of right of usufruct of the land |
|
- |
- |
- |
- |
- |
677 |
677 |
|
Fair value gain/(loss) on investment property |
|
(15,127) |
(664) |
1,213 |
(18) |
(14,596) |
(368) |
(14,964) |
|
31 December 2025 |
|
2,578,643 |
- |
21,570 |
12,300 |
2,612,513 |
29,617 |
2,642,130 |
|
Subsequent expenditure |
|
12,847 |
- |
5,670 |
- |
18,517 |
- |
18,517 |
|
Net lease incentive movement |
|
(4,071) |
- |
668 |
- |
(3,403) |
- |
(3,403) |
|
Disposal during the year |
3.5 |
(12,909) |
- |
- |
- |
(12,909) |
- |
(12,909) |
|
Transfer to land for further development |
|
- |
- |
(5,700) |
5,700 |
- |
- |
- |
|
Transfer to held for sale |
|
- |
- |
(6,910) |
- |
(6,910) |
- |
(6,910) |
|
Decrease in right of usufruct of the land |
|
- |
- |
- |
- |
- |
(1,710) |
(1,710) |
|
Additions of right of usufruct of the land |
3.2 |
- |
- |
- |
- |
- |
553 |
553 |
|
Fair value gain /(loss) on investment property |
3.4 |
11,970 |
- |
(1,398) |
(1,600) |
8,972 |
(1,289) |
7,683 |
|
30 June 2026 |
|
2,586,480 |
- |
13,900 |
16,400 |
2,616,780 |
27,171 |
2,643,951 |
3.1 Investment Property - Freehold
Judgements
Classification of Investment Property
Investment property comprises completed property, property under construction or refurbishment and land bank for further development which are not occupied substantially for use by, or in the operations of, the Group, nor for sale in the ordinary course of business, but are held, or to be held, primarily to earn rental income and for capital appreciation. The Group considers that, when the property is in a condition which will allow the generation of cash flows from its rental, the property is no longer a property under development or refurbishment but an investment property. If the property is kept for sale in the ordinary course of the business, then it is classified as inventory property.
Disposal of Investment Property not in the Ordinary Course of Business
The Group occasionally enters into such contracts with customers to sell properties that are complete. The sale of completed property is generally expected to be the only performance obligation, and the Group has determined that it will be satisfied at the point in time when control transfers. For unconditional exchange of contracts, this is generally expected to be when legal title transfers to the customer. For conditional exchanges, this is expected to be when all significant conditions are satisfied. The recognition and measurement requirements in IFRS 15 are applicable for determining the timing of derecognition and the measurement of consideration (including applying the requirements for variable consideration) when determining any gains or losses on disposal of non-financial assets when that disposal is not in the ordinary course of business.
3.2 Investment property - Leasehold
Right of Perpetual Usufruct of the Land (the "RPU") or "right-of-use assets"
Under IFRS 16, right-of-use assets that meet the definition of investment property are required to be presented in the statement of financial position as investment property. The Group has the right of perpetual usufruct of the land (the "RPU" or "right-of-use assets") contracts for the property portfolio in Poland which meet the definition of investment property under IAS 40. Therefore, the Group has combined its 'Right-of-use assets' being Investment property - freehold under the line item "Investment property" along with the investment property - freehold in the statement of financial position. The corresponding lease liabilities are presented under the line item 'Lease liabilities' as non-current and the related short-term portion are presented in the line item "Current portion of lease liability".
3.3 Investment Property Held for Sale
Judgements and Assumptions Used in the Classification of Investment Properties as Held for Sale
During the period ended 30 June 2026, the Group entered into a preliminary agreement (PSPA) to sell a plot of land held by Podium Park Sp. z o.o. and received an advance of €0.9 million from the buyer. As of 30 June 2026, the property is valued at €6.9 million and was reclassified from investment property under development to assets held for sale. On 8 September 2026, Podium Park Sp. z o.o. entered into a conditional sale agreement due to the statutory pre-emption rights of the municipality and the owner of the special economic zone. If neither party exercises its pre-emption right in 30 days, the company will enter into the final sale agreement (SPA) with the initial buyer no later than 15 December 2026.
3.4 Investment property - Fair value gain/(loss)
|
|
|
30 June 2026 |
30 June 2025 |
|
|
Note |
€'000 |
€'000 |
|
Fair value gain/(loss) on investment property |
|
7,683 |
(1,659) |
|
- Related to investment property |
3.1 |
7,683 |
(1,659) |
|
- Related to investment property - held for sale |
3.3 |
- |
- |
3.5 Sale of investment property
In the first half of 2026 the Group completed investment property disposal for an amount of €12.9 million that mainly include the sale of Philips, a Standing office property, located in Warsaw, held by Lamantia sp. z o.o. for a total consideration of €9.2 million and residential units from Upground residential complex having a value of €3.7 million, located in Bucharest.
4. Fair Value Measurement and Related Estimates and Judgements
Investment Property Measured at Fair Value
The Group's investment property portfolio for Romania was valued by Colliers Valuation and Advisory SRL and Cushman & Wakefield International Real Estate Advisor Ltd and for Poland by Knight Frank Sp. z o.o. and AXI IMMO Group Sp. z o.o. All independent professionally qualified valuers hold a recognised relevant professional qualification and have recent experience in the locations and segments of the investment properties valued using recognised valuation techniques.
Our Property Valuation Approach and Process
The Group's investment department includes a team that reviews twice in a financial year the valuations performed by the independent valuers for financial reporting purposes. For each independent valuation performed, the investment team along with the finance team:
· verifies all major inputs to the independent valuation report.
· assesses property valuation movements when compared to the initial valuation report at acquisition or latest period end valuation report; and
· holds discussions with the independent valuer.
The fair value hierarchy levels are specified in accordance with IFRS 13 "Fair Value Measurement". Some of the inputs to the valuations are defined as "unobservable" by IFRS 13 and these are analysed in the tables below. Any change in valuation technique or fair value hierarchy (between level 1, level 2 and level 3) is analysed at each reporting date or as of the date of the event or variation in the circumstances that caused the change. As of 30 June 2026 (2025: same) the values of all investment properties were classified as level 3 fair value hierarchy under IFRS 13 and there were no transfers from or to level 3 from level 1 and level 2.
Valuation Techniques, Key Inputs and Underlying Management's Estimations and Assumptions
Property valuations are inherently subjective as they are made on the basis of assumptions made by the valuer. Valuation techniques comprise the discounted cash flows, the sales comparison approach, and the residual value method.
The Group has based its assumptions and estimates on the parameters available when the unaudited interim condensed consolidated financial statements were prepared, including the amendments or possible amendments of the current lease contracts, delays to non-committed capital expenditure, cost-cutting initiatives and delays in construction activity. The key assumptions concern the future and other key sources of estimation uncertainty at the reporting date, that have a significant risk of causing a material adjustment to the carrying amounts of assets and liabilities within the next reporting period. However, all such assumptions or estimates are sensitive to change due to the current market environment. The climate-related risks are embedded in the determination of future cash flows that are used for the fair value of investment properties. Further information is disclosed in Operational Review and Strategic Review sections of the 2025 Annual report. Such uncertainty is reflected in the assumptions used for the valuation and the Group disclosed below the sensitivity to different key inputs to overall valuation.
Key information about fair value measurements, valuation technique and significant unobservable inputs (Level 3) used in arriving at the fair value under IFRS 13 are disclosed below:
|
|
Fair value |
|
|
|
|
|
|
|
|
Class of property |
30 June 2026 |
31 December 2025 |
Valuation Technique |
Country |
Location |
Input |
30 June 2026 |
31 December 2025 |
|
|
€'000 |
€'000 |
|
|
|
|
|
|
|
Completed |
484,640 |
488,053 |
DCF |
Poland |
Office |
Rent per sqm |
€12.00 - €24.00 |
€11.50 - €24.00 |
|
Investment |
|
|
|
Warsaw |
|
Discount rate |
6.16% - 10.45% |
5.09% - 9.20% |
|
property |
|
|
|
|
|
Exit yield |
6.15% - 7.90% |
6.05% - 7.90% |
|
|
632,520 |
632,570 |
DCF |
Poland |
Office |
Rent per sqm |
€12.50 - €15.75 |
€12.50 - €15.50 |
|
|
|
|
|
Regional |
|
Discount rate |
5.21% - 16.45% |
4.45% - 16.34% |
|
|
|
|
|
|
|
Exit yield |
6.70% - 10.00% |
6.80% - 10.00% |
|
|
284,320 |
281,820 |
DCF |
Poland Warsaw |
Mixed - use |
Rent per sqm |
€13.50 - €25.00 |
€13.50 - €24.00 |
|
|
|
|
|
and |
|
Discount rate |
5.57% - 9.06% |
6.35% - 8.81% |
|
|
|
|
|
Regional |
|
Exit yield |
5.90% - 7.50% |
5.67% - 7.00% |
|
|
1,158,800 |
1,147,100 |
DCF |
Romania |
Office |
Rent per sqm |
€2.00 - €40.00 |
€2.00 - €40.00 |
|
|
|
|
|
|
|
Discount rate |
8.20% - 9.25% |
8.20% - 9.25% |
|
|
|
|
|
|
|
Exit yield |
6.75% - 7.55% |
6.75% - 7.45% |
|
|
5,000 |
4,900 |
DCF |
Romania |
Industrial |
Rent per sqm |
€4.57 - €4.57 |
€4.35 - €4.35 |
|
|
|
|
|
|
|
Discount rate |
9.50% - 9.50% |
9.50% - 9.50% |
|
|
|
|
|
|
|
Exit yield |
7.50% - 7.50% |
7.50% - 7.50% |
|
|
10,400 |
9,700 |
DCF |
Romania |
Residential |
Rent per sqm |
€7.72 - €16.00 |
€7.72 - €15.75 |
|
|
|
|
|
|
|
Discount rate |
9.50% - 9.50% |
9.75% - 9.75% |
|
|
|
|
|
|
|
Exit yield |
7.50% - 7.50% |
7.50% - 7.50% |
|
|
10,800 |
14,500 |
SC |
Romania |
Residential |
Sales value (sqm) |
€1,500 |
€1,500 |
|
Sub-total |
2,586,480 |
2,578,643 |
|
|
|
|
|
|
|
Investment |
13,900 |
14,700 |
RM |
Romania |
Office |
Rent per sqm |
€19.00 - €19.00 |
€14.00 - €19.00 |
|
property under |
|
|
|
|
|
Discount rate |
9.00% - 9.00% |
9.00% - 9.50% |
|
development |
|
|
|
|
|
Exit yield |
7.00% - 7.00% |
7.00% - 7.50% |
|
|
|
|
|
|
|
Capex (€m) |
€31.40 |
€35.76 |
|
|
- |
6,870 |
SC |
Poland Regional |
Office |
Sales value (sqm) |
- |
€1,132 |
|
Land bank - for further |
|
|
|
|
|
Rent per sqm |
€14.00 - €20.25 |
€19.35 - €20.00 |
|
development |
16,400 |
12,300 |
RM |
Romania |
Office |
Exit yield |
7.2% - 7.5% |
7.2%-7.2% |
|
Investment property held for sale |
6,910 |
- |
SC |
Poland Regional |
Office |
Sales value (sqm) |
€ 1,139 |
- |
|
TOTAL investment property held for sale |
6,910 |
- |
|
|
|
|
|
|
|
TOTAL investment property freehold |
2,616,780 |
2,612,513 |
|
|
|
|
|
|
Income approach: Discounted Cash Flows ('DCF'), Residual Method ('RM'); Market approach: Sales Comparison ('SC')
All classes of property portfolio were categorised as Level 3 under the fair value hierarchy. The fair value movement on investment property recognised, as gain, in the income statement includes an amount of €7.7 million (June 2025: loss of €1.7 million) for fair value measurements as of the statement of financial position date related to investment properties categorised within Level 3 of the fair value hierarchy. In arriving at estimates of market values as at 30 June 2026 and 31 December 2025, the independent valuation experts used their market knowledge and professional judgement and did not rely solely on comparable historical transactions. In these circumstances, there was a greater degree of uncertainty in estimating the market values of investment properties than would have existed in a more active market.
Sensitivity Analysis on significant estimates used in the valuation
The assumptions on which the property valuations have been based include, but are not limited to, rent per sqm (per month), discount rate, exit yield, cost to complete, comparable market transactions for land bank for further development, tenant pro file for the rented properties, and the present condition of the properties. These assumptions are market standard and in line with the International Valuation Standards ('IVS'). Generally, a change in the assumption made for the rent per sqm (per month) is accompanied by a similar change in the rent growth per annum and discount rate (and exit yield) and an opposite change in the other inputs.
Other Disclosures Related to Investment Property
Interest-bearing loans and borrowings are secured on investment property freehold, see note 13 for details. Further information about individual properties is disclosed in the asset management review section in the Interim Report.
A quantitative sensitivity analysis, in isolation, of the most sensitive inputs used in the independent valuations performed, as of the statement of financial position date, are set out below:
|
|
|
|
€0.5 change in rental value per month, per sqm |
|
25 bps change in market yield |
|
5% change in Capex |
|
€50 change in sales prices per sqm |
|
2.5% change in vacancy in Perpetuity1 |
||||||||
|
Investment property |
Year |
Country |
Increase |
Decrease |
|
Increase |
Decrease |
|
Increase |
Decrease |
|
Increase |
Decrease |
|
Increase |
Decrease |
|||
|
|
|
|
€'000 |
€'000 |
|
€'000 |
€'000 |
|
€'000 |
€'000 |
|
€'000 |
€'000 |
|
€'000 |
€'000 |
|||
|
Completed |
2026 |
Poland |
35,900 |
(35,860) |
|
(56,840) |
61,360 |
|
- |
- |
|
- |
- |
|
(31,946) |
- |
|||
|
|
2026 |
Romania |
24,400 |
(25,100) |
|
(42,200) |
44,900 |
|
- |
- |
|
300 |
(300) |
|
(12,800) |
10,400 |
|||
|
|
2025 |
Poland |
35,900 |
(35,950) |
|
(56,270) |
60,670 |
|
- |
- |
|
- |
- |
|
(31,762) |
- |
|||
|
|
2025 |
Romania |
24,200 |
(24,400) |
|
(41,700) |
44,400 |
|
- |
- |
|
400 |
(400) |
|
(12,400) |
10,400 |
|||
|
Under |
2026 |
Romania |
2,600 |
(2,700) |
|
(3,500) |
3,700 |
|
(3,800) |
3,700 |
|
- |
- |
|
- |
- |
|||
|
development |
2025 |
Romania |
2,700 |
(2,500) |
|
(3,300) |
3,800 |
|
(3,900) |
4,000 |
|
- |
- |
|
- |
- |
|||
|
Land bank - for further development |
2026 |
Romania |
1,000 |
(1,000) |
|
(1,700) |
1,700 |
|
(1,600) |
1,600 |
|
- |
- |
|
- |
- |
|||
|
2025 |
Romania |
1,100 |
(1,200) |
|
(1,900) |
1,900 |
|
(1,800) |
1,700 |
|
- |
- |
|
- |
- |
||||
1. The vacancy in perpetuity sensitivity analysis is not followed for the Polish properties portfolio as this factor is considered in the valuation methodology as part of yields and not a variable in isolation. Generally, a change in the assumption made for the estimated rental value is accompanied by a directionally similar change in the rent growth per annum and the discount rate (and exit yield), and an opposite change in the long-term vacancy rate.
4.1 Investment properties owned by Joint Ventures
|
|
|
30 June 2026 |
31 December 2025 |
|
|
Note |
€'000 |
€'000 |
|
Land for further development |
22.2 |
8,200 |
7,900 |
|
|
|
8,200 |
7,900 |
Sensitivity analysis on significant estimates used in the valuation of investment properties owned by the joint venture
The Group holds 50% interest in Black Sea Business Park SRL (similar on 31 December 2025), owning a plot of land where the investment property is valued at fair value under the similar Group accounting policies by Cushman & Wakefield International Real Estate Advisor Ltd.
The table below describes key information about the fair value measurements, valuation technique and significant unobservable inputs (Level 3) used in arriving at the fair value under IFRS 13.
|
|
Carrying value |
|
|
|
Range |
||
|
Class of Joint Venture property |
30 June 2026 |
31 December 2025 |
Valuation technique |
Country |
Input |
30 June 2026 |
31 December 2025 |
|
|
€'000 |
€'000 |
|
|
|
|
|
|
Land bank - for further development |
8,200 |
7,900 |
SC |
Romania |
Sales value /sqm |
€34.00 |
€33.00 |
|
TOTAL |
8,200 |
7,900 |
|
|
|
|
|
Market approach: SC: Sales Comparison
A quantitative sensitivity analysis (for properties owned by joint ventures), in isolation, of the most sensitive inputs used in the independent valuations performed, as of the statement of financial position date, are set out below. Generally, a change in the assumption made for the estimated rental value is accompanied by a directionally similar change in the rent growth per annum and the discount rate (and exit yield), and an opposite change in the long-term vacancy rate.
|
Joint ventures |
|
|
2.5% change in vacancy in perpetuity |
|
|
|
|
|
Increase |
Decrease |
|
Investment Property |
Year |
Country |
€'000 |
€'000 |
|
Land bank - for further development |
2026 |
Romania |
500 |
(500) |
|
2025 |
Romania |
400 |
(400) |
|
The Group is committed to responding to the effects of climate change and its Sustainability Policy covers the impact of the Group's operations and processes, the long-term environmental performance of the properties owned and developed, as well as the reduction of energy consumption and greenhouse gas emissions. The Group, therefore, actively invests in properties which are either certified as environmentally friendly or have the potential to be classified as such following our own initiatives.
The Company conducted a climate change transition and physical risks and opportunities assessment, across its value chain, in alignment with TCFD recommendations (i.e. Task Force on Climate-Related Financial Disclosures). Climate analysis indicates that the probability of floods to occur is very likely across RCPs climate scenarios (2.6, 4.5 and 8.5 W/m 2) for several locations in Poland and likely in Romania, where construction operations are in progress. As Globalworth considers that extreme precipitation and flood events will increase and that direct operations might be compromised, it is investing in solutions that will provide business continuity. Already, we are implementing procedures, and flood protection has been purchased for the majority of the properties, as we consider flooding to be one of the main natural hazards occurring in Poland and Romania, which, in certain circumstances, may take the form of a disaster.
5. Advances for investment Property
|
|
30 June 2026 €'000 |
31 December 2025 €'000 |
|
Advances to contractors for investment properties completed and development |
3,320 |
1,317 |
|
|
3,320 |
1,317 |
6. Commitments
Commitments for Investment Property
As at 30 June 2026 the Group agreed to construction contracts with third parties and is consequently committed to future capital expenditure in respect of completed investment property of €9.3 million (2025: €7.7 million), had committed with tenants to incur incentives (such as fit-out works and other lease incentives) of €13.0 million (2025: €8.8 million) and had committed to future capital expenditure in respect of investment property under development of €28.6 million (2025: €32.6 million)
As of 30 June 2026, the Group's joint ventures had no commitments for the construction of investment property (2025: nil).
Judgements Made for Properties Under Operating Leases, being the lessor
The Group has determined, based on an evaluation of the terms and conditions of the arrangements, that it retains all the significant risks and rewards of ownership of the investment properties leased to third parties and, therefore, being the lessor accounts for these leases as operating leases.
The duration of these leases is one year or more (2025: one year or more) and rentals are subject to annual upward revisions based on the consumer price index. The future aggregate minimum rentals receivable under non-cancellable operating leases for investment properties - freehold are as follows:
|
|
30 June 2026 €'000 |
31 December 2025 €'000 |
|
Not later than 1 year |
184,146 |
159,283 |
|
Later than 1 year and not later than 5 years |
535,269 |
542,556 |
|
Later than 5 years |
98,913 |
98,869 |
|
|
818,328 |
800,708 |
NOTES TO THE INTERIM CONDENSED CONSOLIDATED FINANCIAL STATEMENTS
SECTION III: FINANCIAL RESULTS
This section quantifies the financial impact of the operations for the period; further analysis on operations is presented in the Financial Review section of the Interim Report. This section includes the results and performance of the Group, including earnings per share and EPRA Earnings. This section also includes details about the Group's tax position in the period and deferred tax assets and liabilities held at the period end.
7. Revenue
Revenue from asset management fees, marketing and other income are recognised at the time the service is provided.
|
|
30 June 2026 €'000 |
30 June 2025 €'000 |
|
Contracted rent |
96,307 |
94,511 |
|
Adjustment for lease incentives |
(20,116) |
(19,572) |
|
Rental income |
76,191 |
74,939 |
|
Revenue from contracts with customers |
|
|
|
Service charge income |
42,654 |
39,973 |
|
Fit-out services income |
200 |
264 |
|
Income from other services rendered |
670 |
422 |
|
Marketing and other income |
192 |
99 |
|
|
43,716 |
40,758 |
|
|
119,907 |
115,697 |
The total contingent rents and surrender premia recognised as rental income during the period amount to €0.6 million (30 June 2025: €0.9 million) and €1.8 million (30 June 2025: €1.0 million), respectively.
8. Operating Expenses
|
|
30 June 2026 €'000 |
30 June 2025 €'000 |
|
|
Property management, utilities and insurance |
48,637 |
44,789 |
|
|
Property maintenance costs and other non-recoverable costs |
2,250 |
3,250 |
|
|
Expenses related to other services rendered |
392 |
350 |
|
|
Property expenses arising from investment property that generate rental income |
51,279 |
48,389 |
|
|
Property expenses arising from investment property that did not generate rental income |
7 |
13 |
|
|
Fit-out services costs |
198 |
252 |
|
|
|
51,484 |
48,654 |
|
9. Administrative expenses
|
|
30 June 2026 €'000 |
30 June 2025 €'000 |
|
Directors' emoluments |
376 |
439 |
|
Salaries and contractor costs |
5,916 |
5,366 |
|
Accounting, secretarial and administration costs |
218 |
445 |
|
Legal and other advisory services |
730 |
885 |
|
Audit and non-audit services |
720 |
649 |
|
Corporate social responsibility |
60 |
16 |
|
Travel and accommodation |
89 |
180 |
|
Marketing and advertising services |
971 |
958 |
|
Office and IT expenses |
368 |
377 |
|
Stock exchange expenses |
454 |
449 |
|
|
9,902 |
9,764 |
10. Finance Cost
|
|
Note |
30 June 2026 €'000 |
30 June 2025 €'000 |
|
Interest on secured loans |
|
15,424 |
14,101 |
|
Interest on unsecured credit facilities |
|
1,717 |
1,717 |
|
Interest on fixed rate unsecured 2029/2030s Notes |
|
12,154 |
15,226 |
|
Debt cost amortisation and other finance costs |
10.1 |
2,536 |
2,549 |
|
Debt close-out costs1 |
|
2,919 |
- |
|
Interest on lease liabilities |
3.2 |
833 |
862 |
|
Bank charges |
|
126 |
202 |
|
|
|
35,709 |
34,657 |
1Debt close-out-costs comprise a 2% voluntary redemption fee paid to bondholders and the accelerated expensing of unamortised Notes issuance costs resulting from the redemption of €125 million 2029 Notes in February 2026. See note 13.1 for further details.
10.1 Debt cost amortisation and other finance costs
|
|
30 June 2026 €'000 |
30 June 2025 €'000 |
|
Debt issue cost amortisation - secured bank loans |
703 |
608 |
|
Debt issue cost amortisation - unsecured facility |
124 |
207 |
|
Debt issue cost amortisation - fixed rate 2029/3030s Notes |
1,709 |
1,734 |
|
|
2,536 |
2,549 |
10.2 Finance income
|
|
Note |
30 June 2026 €'000 |
30 June 2025 €'000 |
|
Income from bank deposits |
|
2,251 |
4,014 |
|
Interest income from loans to joint ventures |
22 |
111 |
120 |
|
Interest income on deferred sale consideration for subsidiary disposal |
|
- |
1,289 |
|
Other finance income |
|
235 |
121 |
|
|
|
2,597 |
5,544 |
11. Taxation
|
|
30 June 2026 €'000 |
30 June 2025 €'000 |
|
Current income tax expense |
1,977 |
7,629 |
|
- Related to current period |
3,309 |
5,479 |
|
- Related to prior period |
(1,332) |
2,150 |
|
Deferred tax expense |
9,903 |
5,490 |
|
|
11,880 |
13,119 |
Current income tax expense
The Company is tax resident in Guernsey and subject to Guernsey tax rules. The Company and its subsidiaries do not fall in the scope of the Pillar Two model rules. The subsidiaries in Romania, Poland and Cyprus are subject to tax on local sources of income. The current income tax expense of €2.0 million (June 2025: €7.6 million income) represents the profit tax for the Group. The taxable income arising in each jurisdiction is subject to the following standard corporate income tax rates: Poland at 19% (however small entities with revenue up to €2 million in the given tax year and entities starting a new business for their first tax year of operation, under certain conditions, are charged a reduced rate of 9%), Romania at 16% and Cyprus at 15%.
The Group's subsidiaries in Poland are subject to the minimum tax, which is applied to income from ownership of certain high- value fixed assets having an initial value of the asset exceeding PLN 10 million at a rate of 0.035% per month. From 2019, the taxpayer has a right to apply for the refund of previously paid minimum tax which was not deducted from the advance corporate income tax. This minimum tax can be set off against CIT if CIT is higher. The tax is applied only to leased buildings while no tax applies on vacant buildings or on vacant space in partially occupied buildings.
Starting 1 January 2024, there is an additional minimum tax on turnover introduced in Poland and it is applicable to taxpayers declaring tax losses or negligible income (≤ 2% of revenue) from a source of income other than capital gains. Therefore, the Polish entities are captured by this new rule, and they will be paying the higher amount of tax between corporate income tax or a minimum tax on turnover. The minimum tax related to real estate companies is not deducted from the additional minimum tax.
The additional minimum income tax rate amounts to 10% and the tax base is calculated as the sum of: the amount corresponding to 1.5% of taxable operational income other than capital gains, excessive debt financing costs paid to related entities exceeding 30% of the so-called tax EBITDA plus costs of intangible services or royalties paid to related entities exceeding PLN 3 million plus 5% of the tax EBITDA. There are certain additional conditions on which the entity can be exempt from paying the minimum tax, e.g. the average joint taxable income other than capital gains for the related entities in Poland (for the companies belonging to a group, in which one entity holds, directly or indirectly, at least 75% of the share capital of the other entities throughout the tax year) is higher than 2% of joint revenue other than capital gains. For the years 2024, 2025 and 2026 the additional minimum tax on turnover was not applicable for Polish entities.
Starting 1 January 2024, there is a minimum tax on turnover introduced in Romania and it applies to entities which have a turnover over certain limit. Therefore, the Romanian entities which are part of the tax unity will be captured by this new rule, and they will be paying the higher amount of tax between corporate income tax or a minimum tax on turnover. The minimum tax on turnover for fiscal year 2026 is 0.5% applicable on certain adjusted elements of income. Moreover, the minimum tax on turnover will be eliminated starting with fiscal year 2027
The Group's subsidiaries registered in Cyprus need to comply with the National tax regulations; the most significant sources of income, of the Group subsidiaries registered in Cyprus, are dividend and interest income. Dividend income is tax exempt under certain conditions and interest income, however, is subject to corporate income tax at the rate of 15% in Cyprus.
Judgements and Assumptions Used in the Computation of Current Income Tax Liability
There are uncertainties in Romania and Poland where the Group has significant operations and this is due to the interpretation of complex tax regulations, changes in tax laws, and the amount and timing of future taxable income. Differences arising between the actual results and the assumptions made, or future changes to such assumptions, could necessitate future adjustments to tax income and expense already recorded. Such differences of interpretation may arise on a wide variety of issues depending on the conditions prevailing in the respective company's domicile. In Romania and Poland, the tax position is open to further verification for five years and no subsidiary in Romania has had a corporate income tax audit in the last five years.
The tax regulations regarding withholding taxes in Poland significantly changed in recent years. Subsequently, the Polish tax authorities have issued guidance and interpretation with respect to law provisions applicable to prior periods, while the subsidiaries were subject to tax audits. Nevertheless, the tax audits for withholding taxes in Poland have been finalised in 2025 and the entities amended the tax returns and paid the tax liability during 2025 without challenging the respective amounts.
11.1 Deferred tax (asset)/liabilities
|
|
Note |
30 June 2026 €'000 |
31 December 2025 €'000 |
|
Deferred tax asset |
11.2 |
(2,071) |
(2,059) |
|
Deferred tax liabilities |
|
135,965 |
126,050 |
|
|
|
133,894 |
123,991 |
11.2 Deferred income tax expense
|
|
Consolidated statement of financial position |
Consolidated statement of comprehensive income |
||
|
|
30 June 2026 |
31 December 2025 |
30 June 2026 |
30 June 2025 |
|
Net Deferred Tax |
€'000 |
€'000 |
€'000 |
€'000 |
|
Valuation of investment property at fair value |
140,626 |
131,031 |
9,595 |
4,997 |
|
Deductible temporary differences |
(2,033) |
(2,692) |
659 |
382 |
|
Interest expense and foreign exchange loss on intra-group loans |
(4,160) |
(3,606) |
(554) |
399 |
|
Discounting of tenant deposits and long-term deferred costs |
198 |
166 |
32 |
(7) |
|
Share issue cost recognised in equity |
(7) |
(7) |
- |
- |
|
Valuation of financial instruments at fair value |
197 |
(112) |
309 |
(414) |
|
Recognised unused tax losses |
(927) |
(789) |
(138) |
133 |
|
|
133,894 |
123,991 |
9,903 |
5,490 |
Deferred tax assets
The deferred tax assets for deductible temporary differences are related to allowances recorded for trade receivables, in amount of €0.7 million (2025: €0.6 million) in Romania and €1.3 million (2025: €2.1 million) in Poland.
The Group is also recording deferred tax assets for unused tax losses and carried forward Interest expense and foreign exchange loss on intra-group loans.
Carry-forward tax loss
The tax losses in Romania recorded before 1 January 2024 can be carried forward for seven years from the year of generation, subject to the 70% limit on taxable income. Starting with 2024, tax losses can be carried forward for five years within the same 70% limit. The tax losses in Poland can be carried forward for a period of five consecutive tax years from the year of origination. In Poland, in any particular tax year, the taxpayer may utilise one-time tax losses in the amount of greater than PLN 5 million or 50% of tax loss of a given fiscal year in the following five fiscal years.
Following the tax reform in Cyprus starting with 1 January 2026, Cyprus allows tax losses to be carried forward for up to 7 years. This was extended from the previous 5-year carry-forward period. Therefore, the tax loss incurred in 2026 can be offset against taxable profits up to and including 2033. Nevertheless, the tax losses incurred before 2026 generally remain subject to the old 5-year limitation and do not benefit from the 7-year extension. Also, in case of a group relief situation, a company must first use its own brought-forward losses before utilizing surrendered group losses.
As of the statement of financial position date the Group has recorded a deferred tax assets of €0.9 million (2025: €0.8 million) in Romania and Poland, and nil for Cyprus (2025 :nil ) for which deferred tax asset recognition criteria were met under IAS 12, out of the total available deferred tax assets of €5.0 million (2025: €5.8 million), calculated at the corporate income tax rates of 16% in Romania, 19% (9% for small entities) in Poland and 15% in Cyprus, representing unused assessed tax losses carried forward of €7.5 million (2025: €7.5 million) in Romania, €9.2 million (2025: €8.8 million) in Poland, €13.5 million (2025: €19.5 million) in Cyprus which are available for offset against future taxable profits of the entity which has the tax losses.
The remaining available deferred tax assets of €4.1 million (31 December 2025: €2.1 million) was not recognised (Romania, Poland and Cyprus) in the income statement of the Group as the amount could not be utilised from the future taxable income as per the criteria under IAS 12.
|
Expiry year |
2026 |
2027 |
2028 |
2029 |
2030 |
2031 |
Total |
|
Total available deferred tax assets (€m) |
0.4 |
0.3 |
0.8 |
0.7 |
2.5 |
0.3 |
5.0 |
Temporary non-deductible interest expenses and net foreign exchange
There are also temporary non-deductible interest expenses and net foreign exchange losses of €298.2 million, €50.3 million in Romania and €247.9 million in Poland (2025: €262.9 million, €55 million in Romania and €207.9 million in Poland) related to intercompany and bank loans. Each year an amount up to 30% of tax EBITDA (not less than PLN 3 million for Poland and €0.5 million for Romania) would become tax-deductible, for which €4.2 million (€0.2 million in Romania and €4.0 million in Poland) deferred tax asset was recorded (2025: €3.6 million, €0.3 million in Romania and €3.3 million in Poland).
In Romania such temporary non-deductible interest expenses can be carried forward indefinitely until they are tax deductible as per EBITDA threshold. Nevertheless, starting 1 January 2025, the threshold for deductibility of interest expense on related party loans which will be subject to 30% of tax EBITDA is decreased from €1 million to €500,000. On the other hand, in Poland, the interest expense which was already paid prior to the financial position date (and corresponding net foreign exchange loss on such interest expense) can only be utilized over five consecutive tax years from the year of payment and unpaid interest expense (and corresponding net foreign exchange loss on such interest expense) is available for utilization indefinitely.
Judgements, Estimates and Assumptions Used for Assessed Tax Losses and Related Deferred Tax Assets
At each statement of financial position date, the Group assesses whether the realisation of future tax benefits is sufficiently probable to recognise deferred tax assets. This assessment requires the exercise of judgement on the part of management with respect to, among other things, benefits that could be realised from available tax strategies and future taxable income, as well as other positive and negative factors. Based on the above assessment, the Group recognised deferred tax expense related to deferred tax asset for fiscal losses carried forward for an amount of €0.6 million (2025: deferred tax income of €0.4 million).
The recorded amount of total deferred tax assets could be reduced if estimates of projected future taxable income or if changes in current tax regulations are enacted that impose restrictions on the timing or extent of the Group's ability to utilise future tax benefits.
12. Earnings Per Share
The following table reflects the data used in the calculation of basic and diluted earnings per share per IFRS and EPRA guidelines:
|
|
|
|
Number of shares issued |
% of the period |
Weighted average |
|
Date |
Event |
Note |
('000) |
|
('000) |
|
01-Jan-2025 |
At the beginning of the year |
|
280,827 |
|
280,827 |
|
01-Jan-2025 |
New shares issued for scrip dividend (April 2026)* |
18 |
2,005 |
100% |
2,005 |
|
08-Apr-2025 |
New shares issued for scrip dividend (April 2025)* |
|
9,468 |
46% |
4,366 |
|
30-Jun-2025 |
Shares in issue at period-end (basic) |
|
292,300 |
|
287,198 |
|
01-Jan-2025 |
Share options given to employees |
|
41 |
100% |
41 |
|
17-Apr-2025 |
Share options given to employees |
|
106 |
41% |
44 |
|
23-May-2025 |
Share options bought back from employees |
|
(41) |
21% |
(9) |
|
30-Jun-2025 |
Shares in issue at period-end (diluted) |
|
292,406 |
|
287,274 |
|
|
|
|
|
|
|
|
01-Jan-2026 |
At the beginning of the year |
|
292,300 |
|
292,300 |
|
21-Apr-2026 |
New shares issued for scrip dividend (April 2026) |
18 |
8,023 |
39% |
3,120 |
|
22-May-2026 |
Share options distributed to employees |
21.1 |
99 |
22% |
21 |
|
30-Jun-2026 |
Shares in issue at period-end (basic) |
|
300,422 |
|
295,441 |
|
01-Jan-2026 |
Share options given to employees |
|
99 |
100% |
99 |
|
22-May-2026 |
Share options distributed to employees |
21.1 |
(99) |
22% |
(21) |
|
25-May-2026 |
Share options given to employees |
|
56 |
20% |
11 |
|
30 June 2026 |
Shares in issue at period-end (diluted) |
|
300,478 |
|
295,530 |
Subsequent to 30 June 2026, no new shares were issued.
|
|
30 June 2026 €'000 |
30 June 2025 €'000 |
|
Profit attributable to equity holders of the Company for the basic and diluted earnings per share |
20,168 |
8,031 |
|
|
|
|
|
|
|
Restated* |
|
IFRS earnings per share |
Cents |
Cents |
|
- Basic |
7 |
3 |
|
- Diluted |
7 |
3 |
* The IFRS earnings per share as of 30 June 2025 have been restated following the IAS 33 "Earnings per share" requirements regarding accounting for scrip dividend issued in 2026, the number of Scrip Dividend Share being calculated based on a discount of 20%.
EPRA Earnings Per Share
The following table reflects the reconciliation between IFRS earnings as per the statement of comprehensive income and EPRA earnings (non-IFRS measure):
|
|
Note |
30 June 2026 €'000 |
30 June 2025 €'000 |
|
Earnings per IFRS income statement |
|
20,168 |
8,031 |
|
Changes in value of investment property |
3.4 |
(7,683) |
1,659 |
|
Changes in value of financial instruments |
|
(1,503) |
2,021 |
|
Losses on disposal of investment properties |
|
324 |
19 |
|
Loan close-out costs |
10.1 |
2,919 |
- |
|
Deferred tax charge in respect of above |
|
9,904 |
4,583 |
|
Adjustments in respect of joint ventures for above items |
|
(108) |
- |
|
One off other expense |
|
- |
1,423 |
|
EPRA earnings attributable to equity holders of the Company |
|
24,021 |
17,736 |
|
EPRA earnings per share |
|
Cents |
Restated* Cents |
|
- Basic |
|
8 |
6 |
|
- Diluted |
|
8 |
6 |
* EPRA earnings per share as of 30 June 2025 have been calculated based on weighted average of the diluted number of shares following the IFRS requirements.
NOTES TO THE INTERIM CONDENSED CONSOLIDATED FINANCIAL STATEMENTS
SECTION IV: FINANCIAL ASSETS AND LIABILITIES
This section focuses on financial instruments, together with the working capital position of the Group and financial risk management of the risks that the Group is exposed to at period end.
13. Interest-Bearing Loans and Borrowings
This note describes information on the material contractual terms of the Group's interest-bearing loans and borrowings. For more information about the Group's exposure to market risk, currency risk and liquidity risks, see note 16.
|
|
30 June 2026 €'000 |
31 December 2025 €'000 |
|
Current portion of: Secured loans and accrued interest |
84,350 |
21,399 |
|
Unsecured loans and accrued interest |
10,028 |
18,701 |
|
Sub-total |
94,378 |
40,100 |
|
Non-current Secured loans |
682,401 |
753,450 |
|
Unsecured loans and Notes |
451,241 |
574,125 |
|
Sub-total |
1,133,642 |
1,327,575 |
|
TOTAL |
1,228,020 |
1,367,675 |
13.1 Key terms and conditions of outstanding debt
|
|
|
|
|
30 June 2026 |
31 December 2025 |
||
|
|
|
|
|
Face value |
Carrying value |
Face value |
Carrying value |
|
Facility |
Security |
Nominal interest rate |
Maturity date |
€'000 |
€'000 |
€'000 |
€'000 |
|
Loan 16 |
Secured |
EURIBOR 3 month + margin |
March 2031 |
8,991 |
8,954 |
9,236 |
9,195 |
|
Loan 41 |
Secured |
EURIBOR 3 month + margin |
March 2029 |
80,001 |
79,733 |
81,295 |
80,981 |
|
Loan 44/45 |
Secured |
Fixed rate |
February 2027 |
62,293 |
62,259 |
62,295 |
62,235 |
|
Loan 46 |
Secured |
Fixed rate |
November 2029 |
65,043 |
64,744 |
65,043 |
64,707 |
|
Loan 51 |
Unsecured |
EURIBOR 6 month + margin |
May 2028 |
85,142 |
84,765 |
85,152 |
84,688 |
|
Loan 55 |
Secured |
EURIBOR 3 month + margin |
October 2030 |
145,329 |
144,292 |
145,351 |
144,209 |
|
Loan 56 |
Secured |
EURIBOR 3 month + margin |
December 2030 |
41,419 |
41,166 |
42,245 |
41,972 |
|
Loan 57 |
Secured |
EURIBOR 3 month + margin |
June 2034 |
50,911 |
50,654 |
52,470 |
52,197 |
|
Loan 58 |
Secured |
EURIBOR 6 month + margin |
February 2036 |
21,714 |
21,466 |
22,564 |
22,303 |
|
Loan 59 |
Unsecured |
Fixed rate Notes |
March 2029 |
105,429 |
104,808 |
231,025 |
228,955 |
|
Loan 60 |
Unsecured |
Fixed rate Notes |
March 2030 |
274,366 |
271,696 |
282,179 |
279,183 |
|
Loan 61 |
Secured |
EURIBOR 3 month + margin |
October 2031 |
41,227 |
40,798 |
41,862 |
41,394 |
|
Loan 62 |
Secured |
EURIBOR 3 month + margin |
December 2031 |
91,529 |
90,493 |
92,977 |
91,839 |
|
Loan 63 |
Secured |
EURIBOR 3 month + margin |
March 2030 |
100,189 |
99,478 |
100,202 |
99,406 |
|
Loan 64 |
Secured |
EURIBOR 3 month + margin |
August 2035 |
34,023 |
33,819 |
34,907 |
34,691 |
|
Loan 65 |
Secured |
EURIBOR 3 month + margin |
August 2035 |
29,056 |
28,895 |
29,890 |
29,720 |
|
|
|
|
|
1,236,662 |
1,228,020 |
1,378,693 |
1,367,675 |
Unsecured corporate Notes
In April 2024, the Company successfully completed a bond exchange exercise thus €142.9 million nominal value of 18/25 Notes was repaid and thus €66.6 million nominal value of 20/26 Notes was repaid. The remaining nominal value of €307.1 million and €333.4 million were exchanged into two new 6.25% Senior Notes due in March 2029 and in March 2030. In accordance with the terms and conditions of the Notes, following the disposal of the logistic properties in May 2024, in June 2024 the Company used part of the net proceeds received from the sale to redeem at par €45 million of the Notes due 2029 and €20 million of the Notes due 2030.
In July 2024, the Company completed a tender offer, purchasing: €38.2 million of 2029 Notes and €45.0 million of 2030 Notes, for a total cash consideration of €80.3 million plus accrued interest.
In February 2026 the Company completed the voluntarily redemption of €125 million of 2029 Notes at 102% of par value plus accrued interest, funded from existing cash resources. As of 30 June 2026, the Company holds €98.9 million of the Notes due 2029 and €268.4 million of the Notes due 2030.
Financial covenants for unsecured corporate Notes and IFC loan
Financial covenants on unsecured fixed rate Notes are calculated on a semi-annual basis at 30 June and 31 December each year and include the Consolidated Coverage Ratio, with minimum value of 150%, the Consolidated Leverage Ratio, with maximum value of 60%, and the Consolidated Secured Leverage Ratio with a maximum value of 30%. The IFC loan terms are aligned with the Company's Notes in terms of financial covenants for leverage and coverage ratios. In addition to leverage and coverage ratio, IFC loan terms include the Total Unencumbered Assets Ratio as financial covenants, with minimum value of 125%.
New secured facilities
In March 2026, the Group signed a secured facility with Banca Transilvania in amount of €39.4 million for financing the development of the new office project, Green Court D. The facility is subject to conditions precedent, including, requiring the Group to fund at least €12.8 million of qualifying development expenditure from its own resources before any drawdown can be made. As of 30 June 2026, the Group has incurred approximately €7.9 million development expenditure. The facility is available for drawdown until September 2028, having a further a ten-year repayment period from the drawdown availability date. As of 30 June 2026, the facility was not yet used.
Financial covenants
Financial covenants on secured loans are calculated based on the individual financial statements of the respective subsidiaries, as of each calculation date specified in the loan agreement, on an annual, bi-annual or quarterly basis, and subject to the following ratios:
· gross loan-to-value ratio ("LTV") with maximum values ranging from 45%-83% (2025: 45%-83%). LTV is calculated as the loan value divided by the market value of the relevant property;
· the debt service cover ratio ("DSCR") minimum values of 120% (2025: 120%). DSCR is calculated, depending on the respective credit facility, on the preceding 12-months historical ratio or projected future 12-months period ratio;
· minimum interest cover ratio ("ICR") projected with minimum values from 140% (2025: 140%), which was applicable to two properties as at 30 June 2026 (31 December 2025: two). Historic ICR is calculated as Actual Net Rental Income as a percentage of the Actual Interest Costs for the 12 preceding months period from the calculation date. Projected ICR is calculated as Projected Net Rental Income as a percentage of the Projected Interest Costs for the 12-month period commencing immediately after the date of the calculation; and
· debt yield ratio ("DYR") with minimum values of 5%. DYR is calculated as the 12-month projected Net Operating Income divided by the loan outstanding value at a relevant calculation date.
Secured bank loans are secured by investment properties which were recognised in the statement of financial position at fair value of €1,763.5 million at 30 June 2026 (2025: €1,750 million) and also carry pledges on rent and other receivable balances of €6.8 million (2025: €9.4 million), VAT receivable balances of €1.6 million (2025: €0.2 million) and a movable charge on the respective bank accounts (refer to note 15).
The Group is in compliance with all financial covenants and there were no payment defaults during the period ended 30 June 2026 (2025: same). As of 30 June 2026, the Group had undrawn loan facilities of €39.4 million destined for the development of Green Court D building (2025: none).
13.2 Loan from non-controlling interest holders to a subsidiary
In July 2024, the Group provided €3.9 million loan to Black Sea Business Park SRL, representing 50% of acquisition price for purchased investment property. On 30 June 2026 the outstanding loan receivable is €4.1 million; the loans are unsecured and carry a variable interest of EURIBOR 3 month plus margin.
14. Trade and Other Receivables
|
|
30 June 2026 |
31 December 2025 |
|
|
€'000 |
€'000 |
|
Rent and service charges receivable |
11,353 |
12,489 |
|
VAT and other taxes receivable |
3,149 |
1,716 |
|
Guarantees paid to suppliers |
585 |
601 |
|
Advances to suppliers for services |
1,254 |
1,262 |
|
Sundry debtors |
484 |
500 |
|
|
16,825 |
16,568 |
Rent and Service Charges receivable
Rent and service charges receivable are shown, in the above table, net of an allowance for expected credit losses of €6.5 million (2025: €6.3 million). Rent and service charges receivable are non-interest-bearing and are typically due within 30-90 days (see more information on credit risk and currency profile in note 16.2). For the terms and conditions for related party receivables, see note 25.
15. Cash and Cash Equivalents
|
|
30 June 2026 |
31 December 2025 |
|
|
€'000 |
€'000 |
|
Cash at bank and in hand |
151,409 |
134,867 |
|
Short-term deposits |
121,946 |
275,727 |
|
Cash and cash equivalents at period end |
273,355 |
410,594 |
Cash at bank and in hand include restricted cash balances of €24.5 million (2025: €20.0 million) and short-term deposits include restricted deposits of €6.5 million (2025: €9.5 million). The restricted cash balance can be used to repay the outstanding debts and repayment of deposits to tenants.
Details of cash and cash equivalents denominated in foreign currencies are disclosed in note 16.1.
Short-term deposits are placed for varying term ranging from overnight to monthly deposits based on the Group's immediate cash requirements and earn interest income at the following rates per annum: Euro deposits ranging from 0.0% to 2.7% (2025: 0.0% to 4.3%); PLN deposits ranging from 0.0% to 2.7% (2025: 0.0% to 4.2%) and RON deposits ranging from 0.0% to 5.5% (2025: 0.0% to 6.6%).
16. Financial Risk Management - Objective and Policies
The Group is exposed to the following risks from its use of financial instruments:
· Market risk (including currency risk, interest rate risk).
· Credit risk.
· Liquidity risk.
Refer to the Principal Risks & Uncertainties section on the Annual Report, pages 56 to 61, for further details on the Group's Risk Management Framework, covering Business Environment Risks, Property Portfolio Risks, Financial, Financing & Liquidity Risks and Regulatory Risks.
16.1 Market Risk
Market risk is the risk that the fair value or future cash flows of a financial instrument will fluctuate because of changes in market prices.
The Group's market risks arise from open positions in: (a) foreign currencies; (b) interest-bearing assets and liabilities, (c) investments in equity instruments and (d) fair value of investment property - refer to note 4, to the extent that these are exposed to general and specific market movements.
16.1 a) Foreign currency risk
The Group has entities registered in several EU countries, with the majority of the operating transactions arising from its activities in Romania and Poland.
Therefore, the Group is exposed to foreign exchange risk, primarily with respect to the Romanian Lei ("RON") and Polish Zloty ("PLN"). Foreign exchange risk arises in respect of those recognised monetary financial assets and liabilities that are not in the functional currency of the Group.
The Group's exposure to foreign currency risk was as follows (based on nominal amounts):
|
|
|
30 June 2026 |
|
|
31 December 2025 |
|
||
|
|
|
Denominated in |
|
|
Denominated in |
|
||
|
Amounts in €'000 equivalent value |
RON |
PLN |
GBP |
USD |
RON |
PLN |
GBP |
USD |
|
ASSETS |
|
|
|
|
|
|
|
|
|
Cash and cash equivalents |
45,946 |
29,154 |
16 |
5 |
28,302 |
24,376 |
16 |
5 |
|
Trade and other receivables |
9,204 |
6,663 |
- |
- |
9,501 |
6,430 |
- |
- |
|
Contract assets |
5,563 |
1,364 |
- |
- |
5,975 |
2,022 |
- |
- |
|
Income tax receivable |
15 |
87 |
- |
- |
15 |
705 |
- |
- |
|
Total |
60,728 |
37,268 |
16 |
5 |
43,793 |
33,533 |
16 |
5 |
|
LIABILITIES |
|
|
|
|
|
|
|
|
|
Trade and other payables |
14,897 |
11,940 |
- |
- |
15,138 |
13,399 |
- |
- |
|
Lease liability |
- |
26,665 |
- |
- |
- |
29,486 |
- |
- |
|
Income tax payable |
282 |
2,421 |
- |
- |
2,044 |
8,834 |
- |
- |
|
Guarantees from subcontractors |
261 |
4,725 |
- |
- |
231 |
4,229 |
- |
- |
|
Deposits from tenants |
4,584 |
7,461 |
- |
- |
4,584 |
7,177 |
- |
- |
|
Total |
20,024 |
53,212 |
- |
- |
21,997 |
63,125 |
- |
- |
|
Net exposure |
40,704 |
(15,944) |
16 |
5 |
21,796 |
(29,592) |
16 |
5 |
Foreign Currency Sensitivity Analysis
As of the statement of financial position date, the Group is mainly exposed to foreign exchange risk in respect of the exchange rate fluctuations of the RON and PLN. The following table details the Group's sensitivity (impact on income statement before tax and equity) to a 5% devaluation in RON, PLN and GBP exchange rates against the Euro, on the basis that all other variables remain constant.
The 5% sensitivity rate represents management's assessment of the reasonably possible change in foreign exchange rates. The sensitivity analysis includes only outstanding foreign currency denominated monetary items and adjusts their translation at the reporting date for a 5% appreciation in the Euro against other currencies.
|
|
30 June 2026 |
31 December 2025 |
||
|
|
Profit or (loss) |
Equity |
Profit or (loss) |
Equity |
|
All amounts in €'000 |
|
|
||
|
RON |
(2,035) |
(2,035) |
(1,090) |
(1,090) |
|
PLN |
797 |
797 |
1,480 |
1,480 |
|
USD |
(0) |
(0) |
(0) |
(0) |
|
GBP |
(1) |
(1) |
(1) |
(1) |
A 5% devaluation of the Euro against the above currencies would have had an equal but opposite impact on the above currencies to the amounts shown above, on the basis that all other variables remain constant.
16.1 b) Interest Rate Risk
Interest rate price risk is the risk that the value of a financial instrument will fluctuate due to changes in market interest rates relative to the interest rate that applies to the financial instrument. Interest rate cash flows risk is the risk that the interest cost will fluctuate over time.
The Group's interest rate risk principally arises from interest-bearing loans and borrowings. As at 30 June 2026, 60.6% of the total outstanding balance of interest-bearing loans and borrowings (2025: 63.9%) carry fixed rate interest, as a consequence, the Group is exposed to fair value interest rate risk, which has been disclosed under IFRS. As of 30 June 2026, the fair value of such fixed rate debt was €1,234.5 million, €6.5 million higher than its carrying value of €1,228.0 million (2025: higher with €11.3 million).
The Group monitors on a regular basis the cost of its debt financing and has a preference towards fixed rate long-term financing either through fixed rate secured or unsecured loans or variable rate loans where the risk for interest rate increase is mitigated through fixed-variable swaps or caps from case-by-case basis.
Furthermore, as at 30 June 2026, 39.4% from the total outstanding interest-bearing loans and borrowings (2025: 36.1%) carry interest at variable rate based three- or six-month EURIBOR. Further details of the interest rate applicable to each individual loan are provided note 13. To mitigate this risk, the Group hedged 76.4% of its variable-rate exposure (2025: 76.2%) using floating-to-fixed interest rate swaps. Consequently, after taking into account the effect of these hedging instruments, 9.3% of the Group's total outstanding interest-bearing loans and borrowings remained exposed to variable interest rates (2025: 8.6%)
Based on the Group's debt balances at 30 June 2026, an increase or decrease of 100 basis points in the EURIBOR will result in an increase or decrease (net of tax) of interest expense by €1.1 million per annum (2025: €1.2 million per annum), with a corresponding impact on equity for the same amount, respectively. This analysis assumes that all other variables, in particular foreign currency rates, remain constant.
16.2 Credit Risk
Credit risk refers to the risk that a counterparty will default on its contractual obligations resulting in financial loss to the Group. The Group's policy is to trade with recognised and creditworthy third parties. The Group's exposure is continuously monitored and spread amongst approved counterparties. The Group's maximum exposure to credit risk, by class of financial asset, is equal to their carrying values at the statement of financial position date.
|
|
Note |
30 June 2026 €'000 |
31 December 2025 €'000 |
|
Non-current assets |
|
|
|
|
Loan receivable from joint venture |
22 |
4,101 |
3,990 |
|
Equity investments |
|
8,313 |
8,272 |
|
Non-current financial assets |
|
9,686 |
8,789 |
|
|
|
|
|
|
Current assets |
|
|
|
|
Trade receivables - net of provision |
14 |
11,353 |
12,489 |
|
VAT and other taxes receivable |
14 |
3,149 |
1,716 |
|
Guarantees paid to suppliers |
14 |
585 |
601 |
|
Sundry debtors |
14 |
484 |
500 |
|
Contract assets |
|
6,044 |
7,113 |
|
Guarantees retained by tenants |
|
24 |
40 |
|
Income tax receivable |
|
102 |
720 |
|
Cash and cash equivalents |
15 |
273,355 |
410,594 |
|
|
|
317,196 |
454,824 |
Financial assets at fair value through profit or loss and other comprehensive income
The Group places funds in financial instruments issued by reputable real estate companies with high creditworthiness.
Contract assets and Trade Receivables
A trade receivable is recognised if an amount of consideration that is unconditional is due from the customer (only the passage of time is required before payment of the consideration is due).
There is no significant concentration of credit risk with respect to contract assets and trade receivables, as the Group has a large number of tenants, most of which are part of multinational groups, internationally dispersed, as disclosed in the Interim Report. For related parties, including the joint ventures, it is assessed that there is no significant risk of non-recovery.
Estimates and assumptions used for impairment of trade receivables and contract assets
The Group's trade receivables do not contain any financing component and mainly represent lease receivables. Therefore, the Group applied the simplified approach under IFRS 9 and measured the loss allowance based on a provision matrix that is based on historical collection and default experience adjusted for forward looking factors (such as macroeconomic forecasts of unemployment, economic sentiment indicator, real GDP growth, inflation rate) in order to estimate the provision on initial recognition and throughout the life of the receivables at an amount equal to lifetime ECL (Expected Credit Losses). The assessment is performed on a six-month basis and any change in original allowance will be recorded as gain or loss in the income statement.
The movements in the provision for impairment of receivables during the respective periods were as follows:
|
|
30 June 2026 €'000 |
31 December 2025 €'000 |
|
Opening balance |
6,279 |
6,468 |
|
Specific allowance for expected credit losses |
868 |
1,106 |
|
Reversal of provision for doubtful debts |
(432) |
(734) |
|
Net movement in allowance for expected credit losses |
436 |
372 |
|
Foreign currency translation income |
(186) |
(561) |
|
Closing balance |
6,529 |
6,279 |
The analysis by credit quality of financial assets, cumulated for rent, service charge and property management, is as follows:
|
30 June 2026 (€'000) |
Current |
Days past due |
|
|||
|
|
<90 days |
<120 days |
<365 days |
>365 days |
TOTAL |
|
|
Trade and other receivables - gross |
6,877 |
3,700 |
237 |
1,979 |
5,089 |
17,882 |
|
Less: Specific provision |
- |
50 |
118 |
911 |
5,089 |
6,168 |
|
Less: Expected credit loss |
4 |
198 |
7 |
152 |
- |
361 |
|
Carrying amount |
6,873 |
3,452 |
112 |
916 |
- |
11,353 |
|
Expected credit loss rate |
0.1% |
5.7% |
6.3% |
16.6% |
0.0% |
|
|
31 December 2025 (€'000) |
Current |
|
Days past due |
|
|
|
|
|
<90 days |
<120 days |
<365 days |
>365 days |
TOTAL |
|
|
Trade and other receivables - gross |
9,137 |
2,987 |
199 |
1,149 |
5,296 |
18,768 |
|
Less: Specific provision |
- |
72 |
102 |
448 |
5,296 |
5,918 |
|
Less: Expected credit loss |
4 |
198 |
7 |
152 |
- |
361 |
|
Carrying amount |
9,133 |
2,717 |
90 |
549 |
- |
12,489 |
|
Expected credit loss rate |
0.0% |
7.3% |
7.8% |
27.7% |
- |
|
The Group considers that a default on a trade receivable occurs when the counterparty fails to make contractual payments within 90 days of when they fall due. The customer balances which were overdue but for which no specific loss allowance was recorded are due to the fact that the related customers committed and started to pay the outstanding balances subsequent to the year-end. Further deposits payable to tenants may be withheld by the Group in part or in whole if receivables due from the tenant are not settled or in case of other breaches of contractual terms.
VAT and other taxes receivable
This balance relates to corporate income tax paid in advance, VAT and other taxes receivable from the tax authorities in Romania and Poland. The balances are not considered to be subject to significant credit risk as all the amounts receivable from Government authorities are secured under sovereign warranty.
Cash and cash equivalents
The credit risk on cash and cash equivalents is considered very low, as funds are held at reputable banks across multiple jurisdictions. Of the Group's cash balances, 75% (2025: 82%) is held with international banks rated upper-medium grade (long-term A+ to A−; Short-term P-1 to P-2 and F1+ to F2 by S&P, Moody's or Fitch), 24% (2025: 17%) with lower-medium investment grade range (BBBs) and the remainder 1% with non-investment grade institutions. Surplus operating funds are placed only in short-term, highly liquid deposits with these reputable institutions.
Loans receivable from joint ventures
The outstanding loan balance is neither past due nor impaired. Loans receivable from joint ventures are considered to be low credit risk where they have a low risk of default and the issuer has a strong capacity to meet its contractual cash flow obligations.
Financial instruments for which Fair values are disclosed
Set out below is a comparison by class of the carrying amounts and fair values of the Group's financial instruments, other than those with carrying amounts that are reasonable approximations of their fair values (such as: financial assets, guarantees retained by tenants, deposits from tenants, guarantees retained from contractors, financial liabilities, trade receivables and trade payables).
|
Fair value hierarchy |
|||||||
|
|
|
Carrying amount |
Level 1 |
Level 2 |
Level 3 |
Total |
|
|
|
Year |
€000 |
€000 |
€000 |
€000 |
€000 |
|
|
Interest-bearing loans and borrowings (Note 13) |
30 June 2026 |
1,228,020 |
373,129 |
- |
861,402 |
1,234,531 |
|
|
31 December 2025 |
1,367,675 |
500,916 |
- |
878,086 |
1,379,002 |
||
|
Lease liabilities |
30 June 2026 |
26,665 |
- |
- |
26,665 |
26,665 |
|
|
|
31 December 2025 |
29,486 |
- |
- |
29,486 |
29,486 |
|
The fair value of financial liabilities is included at the amount at which the instrument could be exchanged in a current transaction between willing parties, other than in a forced or liquidation sale. When determining the fair values of interest-bearing loans and borrowings and lease liabilities the Group used the DCF method with inputs such as discount rate that reflects the issuer's borrowing rate as at the statement of financial position date. Specifically, for the 2029's and 2030's Notes, their fair value is calculated on the basis of their quoted market price at 30 June 2026 and 31 December 2025. The Group non-performance risk at the statement of financial position date was assessed to be insignificant.
16.3 Liquidity Risk
The Group's policy on liquidity is to maintain sufficient liquid resources to meet its obligations as they fall due. Ultimate responsibility for liquidity risk management rests with management. The Group manages liquidity risk by maintaining adequate cash reserves and planning and close monitoring of cash flows. The Group expects to meet its financial liabilities through the various available liquidity sources, including a secure rental income profile, further equity raises and in the medium term, debt refinancing. The table below summarizes the maturity profile of the Group's financial liabilities based on contractual undiscounted payments.
The table below presents the undiscounted cash flows of financial liabilities based on the earliest date on which the Group can be required to pay and includes both interest and principal cash flows. As the amount of contractual undiscounted cash flows related to bank borrowings is based on variable rather than fixed interest rates, the amount disclosed is determined by reference to the conditions existing at the period end, that is, the actual spot interest rates effective at the end of the period are used for determining the related undiscounted cash flows.
|
|
Contractual payment term |
Difference from carrying amount |
|
||||
|
All amounts in €'000 30 June 2026 |
<3 months |
3 months- 1 year |
1-5 years |
>5 years |
Total |
Carrying amount |
|
|
Interest-bearing loans and borrowings |
18,542 |
113,013 |
1,209,810 |
145,041 |
1,486,406 |
(258,386) |
1,228,020 |
|
Lease liability |
- |
1,705 |
8,541 |
104,026 |
114,272 |
(87,607) |
26,665 |
|
Trade payables and guarantee retained from contracts (excluding advances from customers) |
21,800 |
9,602 |
3,159 |
89 |
34,650 |
(1,663) |
32,987 |
|
Other payables |
1,827 |
- |
- |
- |
1,827 |
- |
1,827 |
|
Other non-current financial liabilities |
- |
- |
- |
368 |
368 |
- |
368 |
|
Deposits from tenants |
18,568 |
658 |
3,422 |
2,423 |
25,071 |
(1,198) |
23,873 |
|
Total |
60,737 |
124,978 |
1,224,932 |
251,947 |
1,662,594 |
(348,854) |
1,313,740 |
|
|
Contractual payment term |
Difference from carrying amount |
|
||||
|
All amounts in €'000 31 December 2025 |
<3 months |
3 months- 1 year |
1-5 years |
>5 years |
Total |
Carrying amount |
|
|
Interest-bearing loans and borrowings |
28,859 |
46,659 |
1,444,843 |
163,376 |
1,683,737 |
(316,062) |
1,367,675 |
|
Lease liability |
- |
1,975 |
9,780 |
110,207 |
121,962 |
(92,476) |
29,486 |
|
Trade payables and guarantee retained from contracts (excluding advances from customers) |
24,439 |
7,167 |
3,042 |
35 |
34,683 |
(1,990) |
32,693 |
|
Other payables |
1,778 |
- |
- |
- |
1,778 |
- |
1,778 |
|
Other non-current financial liabilities |
- |
- |
- |
973 |
973 |
- |
973 |
|
Deposits from tenants |
19,580 |
116 |
3,067 |
1,959 |
24,722 |
(1,032) |
23,690 |
|
Total |
74,656 |
55,917 |
1,460,732 |
276,550 |
1,867,855 |
(411,560) |
1,456,295 |
Other financial liabilities
Other financial liabilities represent the mark-to-market value of swap instruments classified as fair value through profit or loss measured at €0.4 million at 30 June 2026 (2025: €1.0 million). The fair value of the derivative was measured in accordance with the requirements of IFRS 13 "Fair Value Measurement". Under the terms of the swap agreement, the Group swapped the floating rate of 3-month EURIBOR at a notional amount of €83.1 million with a fixed rate of interest of 2.71% p.a. on the said notional amount with maturity date of April 2029.
The total movement in fair value of financial instruments at fair value through profit or loss, non-current financial assets and other financial liabilities, recognised in the income statement for the year was a gain of €1.5 million (2025: a loss of €2.0 million).
17. Capital Management
The Company has no legal capital regulatory requirement. The Group's policy is to maintain a strong equity capital base so as to maintain investor, creditor and market confidence and to sustain the continuous development of its business. The Board considers from time to time whether it may be appropriate to raise new capital by a further issue of shares. The Group monitors capital primarily using an LTV ratio and manages its gearing strategy to a long-term target LTV of less than 40%.
The LTV is calculated as the amount of outstanding debt (Group's debt balance plus 50% of joint ventures' debt balance), less cash and cash equivalents (Group cash balance plus 50% of joint ventures' cash balance), divided by the open market value of its investment property portfolio (Group's investment property- freehold portfolio plus 50% of joint ventures' investment property - freehold value) as certified by external valuers. The future share capital raise or debit issuance are influenced, in addition to other factors, by the prevailing LTV ratio.
|
|
Note |
30 June 2026 €'000 |
31 December 2025 €'000 |
|
Interest-bearing loans and borrowings (face value) |
13 |
1,236,662 |
1,378,693 |
|
Less: Cash and cash equivalents |
15 |
273,355 |
410,594 |
|
Group Interest-bearing loans and borrowings (net of cash) |
|
963,307 |
968,099 |
|
Add: |
|
|
|
|
50% Share of Joint Ventures cash and cash equivalents |
|
(1) |
(9) |
|
Combined Interest-bearing loans and borrowings (net of cash) |
|
963,306 |
968,090 |
|
Group open market value as of financial position date |
|
2,623,690 |
2,612,513 |
|
Add: 50% Share of Joint Ventures open market value as of financial position date |
22 |
4,100 |
3,950 |
|
Open market value as of financial position date |
|
2,627,790 |
2,616,463 |
|
Loan-to-value ratio ("LTV") |
|
36.7% |
37.0% |
Since the carrying value of the lease liability closely matches the fair value of the investment property - leasehold at 30 June 2026 under the applicable accounting policy as per IFRS 16, both asset and liability, related to the right of perpetual usufruct of the lands, are excluded from the above calculation.
NOTES TO THE INTERIM CONDENSED CONSOLIDATED FINANCIAL STATEMENTS
SECTION V: SHARE CAPITAL AND RESERVES
The disclosures in this section focus on dividend distributions, the share schemes in operation and the associated share-based payment charge to profit or loss. Other mandatory disclosures, such as details of capital management, are also disclosed in this section.
18. Issued share capital
|
|
30 June 2026 |
31 December 2025 |
||
|
|
€'000 |
Number '000 |
€'000 |
Number '000 |
|
Opening balance |
1,847,532 |
291,345 |
1,822,934 |
279,511 |
|
Share issued for scrip dividends |
14,240 |
10,029 |
24,616 |
11,834 |
|
Transaction costs on issuance of shares in cash |
(9) |
- |
(18) |
- |
|
Closing balance |
1,861,763 |
301,374 |
1,847,532 |
291,345 |
Ordinary shares carry no right to fixed income but are entitled to dividends as declared from time to time. Each ordinary share is entitled to one vote at meetings of the Company. There is no limit on the authorised share capital of the Company. The Company can issue no par value and par value shares as the Directors see fit.
Under Guernsey company law there is no distinction between distributable and non-distributable reserves, requiring instead that a company passes a solvency test in order to be able to make distributions to shareholders. Similarly, the share premium for the issuance of shares above their par value per share was recognised directly under share capital and no separate share premium reserve account was recognised.
At an extraordinary general meeting of the Company held on 8 March 2023, a resolution was passed to grant the Board of Directors the authority to offer a scrip dividend alternative to shareholders, so that qualifying shareholders can elect to receive new ordinary shares in the Company (the "scrip dividend shares") instead of cash in respect of all or part of their entitlement to the Interim Dividend. The reference price used for the scrip shares issued is determined on the basis of a discount of 20% to the average of the middle market quotations on the five consecutive dealing days from and including the ex-dividend date.
On 27 February 2026, the Company offered a scrip dividend alternative to the interim dividend so that qualifying shareholders can elect to receive new ordinary shares at a reference price of €1.42 per scrip dividend share instead of cash dividend of €0.05 per share. Shareholders representing approximately 98.03% of Globalworth's issued share capital (excluding shares held in treasury) elected to receive scrip dividend shares in respect of their entitlement to the interim dividend resulting in the issuance of 10.0 million new shares on 2 April 2026 to qualifying shareholders.
19. Dividends
|
|
30 June 2026 €'000 |
31 December 2025 €'000 |
|
Distributed during the period |
14,525 |
39,607 |
On 27 February 2026, the Board of Directors of the Company approved the distribution of an interim dividend in respect of the six-month financial period ended 31 December 2025 of €0.05 per ordinary share, which was paid on 21 April 2026 to the eligible shareholders. Shareholders representing approximately 98.03% of issed shares elected to receive scrip dividend shares instead of cash.
20. Financial Position Key Performance Measures
The net assets value ("NAV"), EPRA Net Reinstatement Value ("EPRA NRV") and the numbers of shares used for the calculation of each key performance measure on the financial position of the Group and the reconciliation between IFRS and EPRA measures are shown below.
|
|
Note |
30 June 2026 €'000 |
31 December 2025 €'000 |
|
Net assets attributable to equity holders of the Company |
|
1,533,305 |
1,513,584 |
|
|
|
|
|
|
Number of ordinary shares used for the calculation of: |
|
Number ('000) |
Number ('000) |
|
- NAV per share* |
12 |
300,422 |
290,294 |
|
- Diluted NAV and EPRA NRV per share* |
12 |
300,478 |
290,401 |
|
* Exclude treasury shares held by the Group
|
|
€ |
€ |
|
NAV per share |
|
5.10 |
5.21 |
|
Diluted NAV per share |
|
5.10 |
5.21 |
|
EPRA Net Reinstatement Value ("EPRA NRV") Per Share* |
Note |
30 June 2026 €'000 |
31 December 2025 €'000 |
|
Net assets attributable to equity holders of the Company |
|
1,533,305 |
1,513,584 |
|
Exclude: |
|
|
|
|
V) Deferred tax in relation to fair value gains of Investment Property |
11 |
140,626 |
131,031 |
|
VI) Fair value of financial instruments |
|
(9,318) |
(7,816) |
|
VII) Goodwill as a result of deferred tax |
|
(5,387) |
(5,387) |
|
IX) Adjustment in respect of Joint venture for above items |
|
103 |
64 |
|
EPRA NRV attributable to equity holders of the Company |
|
1,659,329 |
1,631,476 |
|
|
|
€ |
€ |
|
EPRA NRV per share |
|
5.52 |
5.62 |
* Not an IFRS requirement
21. Share-Based Payment Reserve
|
|
|
30 June 2026 |
30 June 2025 |
|
|
Note |
€'000 |
€'000 |
|
Opening balance |
|
200 |
185 |
|
Settlement of share-based payment |
21.1 |
(266) |
(246) |
|
Expense during the period |
21.1 |
102 |
128 |
|
Closing balance |
|
36 |
67 |
21.1 Treasury shares
|
|
|
30 June 2026 |
31 December 2025 |
||
|
|
|
Amount |
Number |
Amount |
Number |
|
|
Note |
€'000 |
('000) |
€'000 |
('000) |
|
Opening balance |
|
4,722 |
1,053 |
4,752 |
1,053 |
|
Dividend on treasury shares held by a subsidiary |
|
(11) |
- |
(30) |
- |
|
Shares distributed to employees |
21 |
- |
(99) |
- |
(41) |
|
Shares bought back from employees |
21 |
- |
- |
- |
41 |
|
Closing balance |
|
4,711 |
954 |
4,722 |
1,053 |
NOTES TO THE INTERIM CONDENSED CONSOLIDATED FINANCIAL STATEMENTS
SECTION VI: INVESTMENT IN SUBSIDIARIES, JOINT VENTURES AND RELATED DISCLOSURE
This section includes details about Globalworth's subsidiaries, if any new business and /or new properties acquired, investment in joint ventures and related impact on the statement of comprehensive income and cash flows.
22. Investment in Joint ventures
|
Investments |
Note |
30 June 2026 €'000 |
31 December 2025 €'000 |
|
Opening balance |
|
84 |
216 |
|
Share of profit/(loss) during the period |
22.4 |
51 |
(132) |
|
Sub-total |
|
135 |
84 |
|
Loans receivable from joint venture |
|
|
|
|
Opening balance |
|
3,990 |
3,744 |
|
Loan provided to the joint venture |
|
- |
15 |
|
Interest income on the loans to joint venture |
|
111 |
231 |
|
Sub-total |
|
4,101 |
3,990 |
|
TOTAL |
|
4,236 |
4,074 |
22.1 Investments in the Joint Ventures
In July 2024 the Group's subsidiary, Globalworth Holdings Cyprus Limited, sold 50% equity interest in Black Sea Business Park SRL to Global Vision Business Development SRL (a company controlled by Mr. Sorin Preda) by entering into a joint venture agreement. Following this, Black Sea Business Park SRL acquired Constanta Business Park from Black Sea Vision SRL (i.e. a joint venture company owned and subsequently sold by the Group in 2024) at a price of €7.2 million.
As at 30 June 2026 and 31 December 2025 the investment property owned by the joint venture entity was classified as an industrial segment for the Group.
Judgements and assumptions used for Joint Ventures
At the time of acquisition, the Group considered whether the acquisition represented an acquisition of a business or an acquisition of an asset. In the absence of an integrated set of activities required for a business other than the property, the Group concluded the acquisition of the joint venture does not represent a business therefore accounted for it as an acquisition of a group of assets and liabilities. The cost to acquire the entity is allocated between the identifiable assets and liabilities of the entity based upon their relative fair values at the acquisition date and no goodwill or deferred tax is recognised.
Joint control is the contractually agreed sharing of control of an arrangement, which exists only when decisions about the relevant activities require the unanimous consent of the parties sharing control. The considerations made in determining significant influence or joint control are similar to those necessary to determine control over subsidiaries. Following such assessment, the Group's investment was classified as a joint venture. Until the disposal date, the carrying amount of the investment in the joint venture was recorded at cost plus the change in the Group's share of net assets of the joint venture until the disposal date.
22.2 Summarised Statements of Financial Position of the Joint Ventures as at reporting date
The summarised statements of financial position of the joint ventures are disclosed below, which represents the assets and liabilities recognised in the financial statements of joint ventures without adjusting of the balance payable to or receivable from the Group. Transactions and balances receivable or payable between the Group and the individual joint ventures are disclosed in note 25.
|
|
30 June 2026 |
31 December 2025 |
|
|
€'000 |
€'000 |
|
|
Constanta Business Park |
Constanta Business Park |
|
Investment property |
8,200 |
7,900 |
|
Other current assets |
17 |
14 |
|
Cash and cash equivalents |
1 |
18 |
|
Total assets |
8,218 |
7,932 |
|
Loans payable to the Group |
4,101 |
3,990 |
|
Loan from Joint venture partner |
4,100 |
3,989 |
|
Deferred tax liability |
206 |
128 |
|
Total non-current liabilities |
8,407 |
8,107 |
|
Other current liabilities |
1 |
- |
|
Total liabilities |
8,408 |
8,107 |
|
Net assets |
(190) |
(175) |
The Group has signed loan facilities amounting to €4.0 million (2025: €3.9 million) with Black Sea Business Park. Further details about the fair valuation of investment property owned by the Joint Ventures are disclosed in note 4.1.
22.3 Summarised Statements of Financial Performance of the Joint Ventures
The table below contains the income statements of the joint venture extracted from the individual financial statements of the venture without adjusting for the transactions with the Group.
|
|
30 June 2026 |
30 June 2025 |
|
|
€'000 |
€'000 |
|
|
Constanta Business Park |
Constanta Business Park |
|
Administrative expenses |
(8) |
(11) |
|
Fair value gain/(loss) on investment property |
294 |
- |
|
Foreign exchange loss |
(1) |
(1) |
|
Profit/(loss) before net financing cost |
285 |
(12) |
|
Finance expense |
(222) |
(239) |
|
Income tax expense |
(78) |
- |
|
Total comprehensive income for the period |
(15) |
(251) |
Income tax expense mainly represents deferred tax expense on the valuation of investment property.
22.4 Share of profit/(loss) of equity-accounted investments in joint ventures
The following table presents a reconciliation between the profit/(loss) for the period ended 30 June 2026 and 30 June 2025 recorded in the individual financial statements of the joint venture with the Share of profit/(loss) recognised in the Group's financial statements under the equity method.
|
|
30 June 2026 |
30 June 2025 |
|
|
Constanta Business Park |
Constanta Business Park |
|
|
€'000 |
€'000 |
|
Loss for the period |
(15) |
(251) |
|
Group 50% share of loss for the period |
(8) |
(126) |
|
Adjustments for transactions with the Group |
59 |
67 |
|
Share of profit/(loss) of equity-accounted investments in joint ventures |
51 |
(59) |
23. Investment in Subsidiaries
Details on all direct and indirect subsidiaries of the Company, over which the Group has control and consolidated as of 30 June 2026 and 31 December 2025, are disclosed in the table below. The Group did not have any restrictions (statutory, contractual or regulatory) on its ability to transfer cash or other assets (or settle liabilities) between the entities within the Group.
As of 30 June 2026, the Group consolidated the following subsidiaries with advisory, holding and financing as principal activities.
|
|
||||
|
|
|
30 June 2026 |
31 December 2025 |
Place of incorporation |
|
Subsidiary |
|
Shareholding interest (%) |
Shareholding interest (%) |
|
|
Globalworth Investment Advisers Limited |
|
100 |
100 |
Guernsey, |
|
|
|
|
|
Channel Islands |
|
Globalworth Holdings Cyprus Limited |
|
|
|
|
|
Tisarra Holdings Limited* |
|
|
|
|
|
Serana Holdings Limited |
|
100 |
100 |
Cyprus |
|
Kusanda Holdings Limited |
|
|
|
|
|
Minory Investments Limited |
|
|
|
|
|
Globalworth Tech Limited |
|
|
|
|
|
IB 14 Fundusz Inwestycyjny Zamkniety Aktywow Niepublicznych |
|
100 |
100 |
Poland |
* Currently under liquidation process
As of 30 June 2026, the Group consolidated the following subsidiaries, which own real estate assets in Romania and Poland, being asset holding companies as their principal activities, except for Globalworth Building Management SRL, Atlas Office Technology SRL, GPRE Property Management Sp. z o.o, GPRE Management Sp. z o.o, GW Tech Sp. z o.o. and GW Flex Sp. z o.o. with building management activities in Romania and Poland, Fundatia Globalworth in Romania is a non-profit organisation with corporate social responsibility activities.
|
|
|
30 June 2026 |
31 December 2025 |
Place of incorporation |
|
Subsidiary |
|
Shareholding interest |
Shareholding interest |
|
|
|
Note |
(%) |
(%) |
|
|
Aserat Properties SRL |
|
|
|
|
|
Atlas Office Technology SRL |
|
|
|
|
|
BOB Development SRL |
|
|
|
|
|
BOC Real Property SRL |
|
|
|
|
|
Corinthian Five SRL |
|
|
|
|
|
Corinthian Tower SRL |
|
|
|
|
|
Corinthian Twin Tower SRL |
|
|
|
|
|
Elgan Offices SRL |
|
|
|
|
|
Fundatia Globalworth |
|
|
|
|
|
Gara Herastrau Office SRL |
|
|
|
|
|
Globalworth Asset Managers SRL |
|
100 |
100 |
Romania |
|
Globalworth Building Management SRL |
|
|
|
|
|
Globalworth Expo SRL |
|
|
|
|
|
SPC Beta Property Development Company SRL |
|
|
|
|
|
SPC Epsilon Property Development Company SRL |
|
|
|
|
|
SPC Gamma Property Development Company SRL |
|
|
|
|
|
Netron Investment SRL |
|
|
|
|
|
Tower Center International SRL |
|
|
|
|
|
Upground Estates SRL |
|
|
|
|
|
West Logistics Hub SRL |
|
|
|
|
|
A4 Business Park Sp. z o.o. |
|
|
|
|
|
Artigo Sp. z o.o. |
|
|
|
|
|
Bakalion Sp. z o.o. |
|
|
|
|
|
Centren Sp. z o.o. |
|
|
|
|
|
DH Supersam Katowice Sp. z o.o. |
|
|
|
|
|
Dolfia Sp. z o.o |
|
|
|
|
|
Dom Handlowy Renoma Sp. z o.o. |
|
|
|
|
|
Ebgaron Sp. z o.o. w likwidacji |
|
|
|
|
|
Gold Project Sp. z o.o. |
|
|
|
|
|
GPRE Management Sp. z o.o. |
|
|
|
|
|
GPRE Property Management Sp. z o.o. |
|
|
|
|
|
GW Flex Sp. z o.o. |
|
|
|
|
|
GW Tech Sp. z o.o. |
|
|
|
|
|
Hala Koszyki Sp. z o.o. |
|
|
|
|
|
Ingadi Sp. z o.o. |
|
100 |
100 |
Poland |
|
Lamantia Sp. z o.o. |
|
|
|
|
|
Lima Sp. z o.o. |
|
|
|
|
|
Nordic Park Offices Sp. z o.o. |
|
|
|
|
|
Podium Park Sp. z o.o. |
|
|
|
|
|
Quattro Business Park Sp. z o.o. |
|
|
|
|
|
Rondo Business Park Sp. z o.o. |
|
|
|
|
|
Spektrum Tower Sp. z o.o. |
|
|
|
|
|
Tryton Business Park Sp. z o.o. |
|
|
|
|
|
Warsaw Trade Tower 2 Sp. z o.o. |
|
|
|
|
|
Warta Tower Sp. z o.o. |
|
|
|
|
|
West Gate Sp. z o.o. |
|
|
|
|
|
West Link Sp. z o.o. |
|
|
|
|
|
Tryton Parking Sp. z o.o. |
23.1 |
100 |
- |
Poland |
23.1 Investment in Subsidiaries
Tryton Parking Sp. z o.o. (formerly named Archicom ZAM Sp. z o.o.) was bought for €0.2 million holding the right of perpetual usufruct over a land, currently a parking lot next to Tryton Business Park.
NOTES TO THE INTERIM CONDENSED CONSOLIDATED FINANCIAL STATEMENTS
SECTION VII: OTHER DISCLOSURES
This section includes segmental disclosures highlighting the core areas of Globalworth's operations in the Office, Mixed -use, residential, and other (industrial and corporate segments). There were no significant transactions between segments except for management services provided by the offices segment to the residential, mixed-use and other (industrial) segments. This section also includes the transactions with related parties, new standards and amendments, contingencies that existed at the period end and details on significant events which occurred subsequent to the period end.
24. Segmental Information
The Group is engaged mainly in real estate business, and the Board of Directors analyses the performance of the offices, mixed - use, industrial and residential investment properties segments and property management services, in two geographical areas, Romania and Poland.
Operating segments are reported in a manner consistent with the internal reporting provided to the chief operating decision-makers. The chief operating decision-makers who are responsible for allocating resources and assessing the performance of the operating segments have been identified as the Joint Chief Executive Officers.
The Group earns revenue and holds non-current assets (investment properties) in Romania and Poland, the geographical area of its operations. For investment property, discrete financial information is provided on a property-by-property basis (including those under construction or refurbishment) to members of Executive Management, which collectively comprise the Joint Executive Officers of the Group. The information provided is Net Operating Income ("NOI", i.e. gross rental income less property expenses) on a quarterly basis and valuation gains/losses from property valuation at each semi -annual basis. The individual properties are aggregated into office, mixed-use, industrial and residential segments.
The industrial property segment and head office segments are presented on a collective basis as Others in the table on the next page since their individual assets, revenue and absolute profit (or loss) are below 10% of all combined total asset, total revenue and total absolute profit (or loss) of all segments. All other segments are disclosed separately as these meet the quantitative threshold of IFRS 8. Consequently, the Group is considered to have four reportable operating segments: the offices segment (acquires, develops, leases and manages offices and spaces), the residential segment (builds, acquires, develops and leases apartments), mixed-use and the other segment (acquires, develops, leases and manages industrial spaces and corporate office).
Share-based payments expense is not allocated to individual segments as underlying instruments are managed at the Group level. Segment assets and liabilities reported to Executive Management on a segmental basis are set out below:
|
30 June 2026 |
Office |
Mixed-use |
Residential |
Other |
Inter - segment eliminations |
Total |
|
|
€'000 |
€'000 |
€'000 |
€'000 |
€'000 |
€'000 |
|
Rental income - Total |
69,013 |
6,906 |
468 |
188 |
(384) |
76,191 |
|
Romania |
35,097 |
- |
468 |
188 |
(57) |
35,696 |
|
Poland |
33,916 |
6,906 |
- |
- |
(327) |
40,495 |
|
Revenue from contract with customers - Total |
39,901 |
5,365 |
269 |
187 |
(2,006) |
43,716 |
|
Romania |
18,023 |
- |
269 |
187 |
(146) |
18,333 |
|
Poland |
21,878 |
5,365 |
- |
- |
(1,860) |
25,383 |
|
Revenue-total |
108,914 |
12,271 |
737 |
375 |
(2,390) |
119,907 |
|
Operating expenses |
(45,355) |
(6,101) |
(316) |
(185) |
473 |
(51,484) |
|
Segment NOI |
63,559 |
6,170 |
421 |
190 |
(1,917) |
68,423 |
|
NOI - Romania |
33,540 |
- |
421 |
190 |
(155) |
33,996 |
|
NOI - Poland |
30,019 |
6,170 |
- |
- |
(1,762) |
34,427 |
|
Administrative expenses |
(7,047) |
(322) |
(16) |
(2,517) |
- |
(9,902) |
|
Fair value gain/(loss) on investment property |
8,670 |
(253) |
(839) |
105 |
- |
7,683 |
|
Depreciation and amortisation expense |
(388) |
- |
(20) |
(26) |
- |
(434) |
|
Other expenses |
(590) |
48 |
(222) |
- |
- |
(764) |
|
Other income |
217 |
9 |
- |
- |
(23) |
203 |
|
Loss on disposal of investment property |
(89) |
- |
- |
- |
- |
(89) |
|
Foreign exchange gain/(loss) |
(1,148) |
2 |
(64) |
(202) |
- |
(1,412) |
|
Segment result |
63,184 |
5,654 |
(740) |
(2,450) |
(1,940) |
63,708 |
|
Finance cost |
(15,248) |
(1,766) |
- |
(18,695) |
- |
(35,709) |
|
Finance income |
1,355 |
50 |
41 |
1,151 |
- |
2,597 |
|
Share-based payment expense |
- |
- |
- |
(102) |
- |
(102) |
|
Gain from fair value of financial instruments |
892 |
- |
- |
611 |
- |
1,503 |
|
Share of profit of equity-accounted investments in joint ventures |
- |
- |
- |
51 |
- |
51 |
|
Profit/(loss) before tax |
50,183 |
3,938 |
(699) |
(19,434) |
(1,940) |
32,048 |
|
30 June 2025 |
Office |
Mixed-use |
Residential |
Other |
Inter - segment eliminations |
Total |
|
|
€'000 |
€'000 |
€'000 |
€'000 |
€'000 |
€'000 |
|
Rental income - Total |
67,368 |
7,085 |
526 |
183 |
(223) |
74,939 |
|
Romania |
35,059 |
- |
526 |
183 |
(65) |
35,703 |
|
Poland |
32,309 |
7,085 |
- |
- |
(158) |
39,236 |
|
Revenue from contract with customers - Total |
37,664 |
5,101 |
300 |
212 |
(2,519) |
40,758 |
|
Romania |
17,778 |
- |
300 |
212 |
(166) |
18,124 |
|
Poland |
19,886 |
5,101 |
- |
- |
(2,353) |
22,634 |
|
Revenue-total |
105,032 |
12,186 |
826 |
395 |
(2,742) |
115,697 |
|
Operating expenses |
(42,823) |
(5,830) |
(329) |
(111) |
439 |
(48,654) |
|
Segment NOI |
62,209 |
6,356 |
497 |
284 |
(2,303) |
67,043 |
|
NOI - Romania |
33,714 |
- |
497 |
284 |
(208) |
34,287 |
|
NOI - Poland |
28,495 |
6,356 |
- |
- |
(2,095) |
32,756 |
|
Administrative expenses |
(6,834) |
(366) |
(16) |
(2,548) |
- |
(9,764) |
|
Fair value gain/(loss) on investment property |
(4,710) |
1,496 |
1,553 |
2 |
- |
(1,659) |
|
Depreciation and amortisation expense |
(511) |
- |
(20) |
(23) |
- |
(554) |
|
Other expenses |
(1,297) |
(75) |
(40) |
(80) |
24 |
(1,468) |
|
Other income |
199 |
(19) |
- |
- |
(39) |
141 |
|
Loss on disposal of investment property |
9 |
(8) |
- |
(1) |
- |
- |
|
Foreign exchange loss |
(1,013) |
(64) |
(27) |
(164) |
- |
(1,268) |
|
Segment result |
48,052 |
7,320 |
1,947 |
(2,530) |
(2,318) |
52,471 |
|
Finance cost |
(13,886) |
(1,773) |
- |
(18,998) |
- |
(34,657) |
|
Finance income |
2,375 |
73 |
125 |
2,971 |
- |
5,544 |
|
Share-based payment expense |
- |
- |
- |
(128) |
- |
(128) |
|
Gain from fair value of financial instruments |
(1,652) |
- |
- |
- |
(369) |
(2,021) |
|
Share of profit of equity-accounted investments in joint ventures |
- |
- |
- |
(59) |
- |
(59) |
|
Profit/(loss) before tax |
34,889 |
5,620 |
2,072 |
(18,744) |
(2,687) |
21,150 |
Revenues are derived from a large number of tenants, and no tenant contributes more than 10% of the Group's rental revenues for the period ended 30 June 2026.
|
30 June 2026 |
Office |
Mixed-use |
Residential |
Other |
Inter segment eliminations |
Total |
|
Segments |
€'000 |
€'000 |
€'000 |
€'000 |
€'000 |
€'000 |
|
Segment non-current assets |
2,323,843 |
298,732 |
21,273 |
5,000 |
(4,897) |
2,643,951 |
|
Romania |
1,189,100 |
- |
21,273 |
5,000 |
(73) |
1,215,300 |
|
Poland |
1,134,743 |
298,732 |
- |
- |
(4,824) |
1,428,651 |
|
Assets held for sale |
6,910 |
- |
- |
- |
- |
6,910 |
|
Total assets |
2,659,978 |
309,166 |
25,630 |
5,502 |
(5,768) |
2,994,508 |
|
Total liabilities |
919,253 |
77,952 |
2,505 |
462,360 |
(867) |
1,461,203 |
|
|
|
|
|
|
|
|
|
Additions to non-current assets |
|
|
|
|
|
|
|
- Romania |
7,516 |
- |
96 |
(4) |
- |
7,608 |
|
- Poland |
5,148 |
2,358 |
- |
- |
- |
7,506 |
|
31 December 2025 |
Office |
Mixed-use |
Residential |
Other |
Inter segment eliminations |
Total |
|
Segments |
€'000 |
€'000 |
€'000 |
€'000 |
€'000 |
€'000 |
|
Segment non-current assets |
2,321,070 |
296,422 |
24,272 |
4,900 |
(4,534) |
2,642,130 |
|
Romania |
1,174,100 |
- |
24,272 |
4,900 |
(72) |
1,203,200 |
|
Poland |
1,146,970 |
296,422 |
- |
- |
(4,462) |
1,438,930 |
|
Assets held for sale |
- |
- |
- |
- |
- |
- |
|
Total assets |
2,773,301 |
306,791 |
38,396 |
5,254 |
(5,550) |
3,118,192 |
|
Total liabilities |
930,628 |
78,950 |
2,787 |
593,256 |
(1,013) |
1,604,608 |
|
|
|
|
|
|
|
|
|
Additions to non-current assets |
|
|
|
|
|
|
|
- Romania |
20,415 |
- |
378 |
(11) |
- |
20,782 |
|
- Poland |
11,294 |
10,124 |
- |
- |
- |
21,418 |
None of the Group's non-current assets are located in Guernsey except for goodwill (there are no employment benefit plan assets, deferred tax assets or rights arising under insurance contracts) recognised on business combination.
25. Transactions with Related Parties
The Group's immediate parent is Zakiono Enterprises Limited, 60.9% holding (2025: same), a wholly owned subsidiary of Tevat Limited. Tevat Limited is jointly owned by Aroundtown SA (indirectly) and CPI Property Group S.A.
The Group's related parties are Aroundtown SA and CPI Property Group S.A, the Company's joint venturers, the Company's Executive and Non -Executive Directors, other key Executives, as well as all the companies controlled by them or under their joint control, or under significant influence. The related party transactions are set out in the table below:
|
|
Income statement |
Statement of financial position |
|||||
|
|
|
Note |
Income/(expense) |
Amounts owing (to)/from |
|||
|
|
Nature of transaction/balances |
|
30 June 2026 |
30 June 2025 |
30 June 2026 |
31 December 2025 |
|
|
Name |
Amounts |
|
€'000 |
€'000 |
€'000 |
€'000 |
|
|
Black Sea Business Park SRL |
Shareholder loan receivable |
22.1 |
- |
- |
4,101 |
3,990 |
|
|
(50% Joint Venture) |
Finance income |
|
111 |
169 |
- |
- |
|
|
|
Office rent |
|
6 |
13 |
- |
- |
|
26. New and Amended Standards
The accounting policies adopted in the preparation of the interim condensed consolidated financial statements are consistent with those followed in the preparation of the Group's annual consolidated financial statements for the year ended 31 December 2025, except for the adoption of new standards effective as of 1 January 2026. The new standards and amendments had no significant impact on the Group's financial position and performance.
|
Narrow scope amendments and new Standards |
Effective Date (EU endorsement) |
|
Annual Improvements Volume 11 (issued on 18 July 2024) |
Jan-26
|
|
Contracts Referencing Nature-dependent Electricity - Amendments to IFRS 9 and IFRS 7 (issued on 18 December 2024) |
Jan-26 |
|
Amendments to the Classification and Measurement of Financial Instruments - Amendments to IFRS 9 and IFRS 7 (issued on 30 May 2024) |
Jan-26 |
For the other standards issued but not yet effective and not early adopted by the Group, the management has assessed the impact and considers that their application will not have a significant effect on the financial statements for the current period. Standards and amendments that are not yet effective or endorsed by the European Union are, as follows:
|
Narrow scope amendments and new Standards |
Effective Date (EU endorsement) |
|
IFRS 18 Presentation and Disclosure in Financial Statements (issued on 9 April 2024) * |
Jan-27 |
|
Amendments to IFRS 19 Subsidiaries without Public Accountability: Disclosures (issued on 21 August 2025) |
Jan-27 |
|
Amendments to IAS 21 The Effects of Changes in Foreign Exchange Rates: Translation to a Hyperinflationary Presentation Currency (issued on 13 November 2025) |
Jan-27 |
|
Amendments to the Fair Value Option in IAS 28 Investments in Associates and Joint Ventures (issued on 26 June 2026) |
Jan-27 |
|
IFRS 19 Subsidiaries without Public Accountability: Disclosures (issued on 9 May 2024) |
Jan-27 |
|
IFRS 20 Regulatory Assets and Regulatory Liabilities (issued on 27 May 2026) |
Jan-29 |
*IFRS 18 Presentation and Disclosure in Financial Statements (issued on 9 April 2024)
In April 2024, the IASB issued IFRS 18, which replaces IAS 1 Presentation of Financial Statements. IFRS 18 introduces new requirements for presentation within the statement of profit or loss, including specified totals and subtotals. Furthermore, entities are required to classify all income and expenses within the statement of profit or loss into one of five categories: operating, investing, financing, income taxes and discontinued operations, whereof the first three are new. It also requires disclosure of newly defined management-defined performance measures, subtotals of income and expenses, and includes new requirements for aggregation and disaggregation of financial information based on the identified "roles" of the primary financial statements ("PFS") and the notes. In addition, narrow-scope amendments have been made to IAS 7 Statement of Cash Flows, which include changing the starting point for determining cash flows from operations under the indirect method, from "profit or loss" to "operating profit or loss" and removing the optionality around classification of cash flows from dividends and interest.
In addition, there are consequential amendments to several other standards. IFRS 18, and the amendments to the other standards, is effective for reporting periods beginning on or after 1 January 2027, but earlier application is permitted and must be disclosed. IFRS 18 will apply retrospectively.
The Group is currently working to identify all impacts the amendments will have on the primary financial statements and notes on the financial statements.
The Group is currently assessing the impact of the application of IFRS 18 on its consolidated financial statements. The Group expects that the adoption of IFRS 18 will primarily affect the presentation and disclosure of items in the statement of profit or loss and related notes, rather than the recognition or measurement of assets, liabilities, income or expenses.
The Group has assessed the classification of certain income and expenses, including rental income generated from investment properties, gains and losses from fair value adjustments of investment property, property operating expenses (i.e. including maintenance, utilities and property management costs) and related financing income and expenses and other income and expenses which may affect the presentation of results within the newly defined categories in the statement of profit and loss.
The new requirements may result in changes to the presentation of certain income and expenses items within the categories prescribed by IFRS 18 and may introduce additional subtotals within the statement of profit and loss that were not previously presented. At the date of approval of these condensed consolidated financial statements, the Group has not yet completed its assessment of the quantitative impact of the new standard.
The Group frequently use performance metrics such as EPRA Earnings and EPRA Earnings per share as presented in note 12, Loan-to-Value ratio ("LTV") as disclosed in note 17 and EBITDA, adjusted EBITDA, net operating income ("NOI") or other similar measures to monitor operating performance which may become management - defined performance measures ("MPMs") requiring reconciliation disclosures under IFRS 18.
27. Contingencies
Taxation
All amounts due to State authorities for taxes have been paid or accrued at the balance sheet date. There might be inconsistent interpretations of the tax law and frequent changes of tax law which creates unpredictability and may trigger the risk of additional taxes and penalties. In case the State authorities have findings from tax audits relating to misinterpretation of tax laws and/or related regulations, these may result in confiscation of the amounts, additional tax liabilities, fines and penalties which are applied on the total outstanding amount of additional tax liability. As a result, the fiscal penalties resulting from misinterpretation of the legal provisions may result in a significant amount payable to the State. The Group assessed any uncertainties regarding the tax treatments in accordance with IFRIC 23 "Uncertainty over Income Tax Treatments", analysed all significant tax positions and concluded that it is more likely than not that the tax treatment applied in its tax filings will be accepted by the relevant tax authorities. The Group has provided for possible outcomes accordingly where uncertainty exists regarding the tax treatment. Any adjustments to tax provisions, will be recognised in the period in which the uncertainty is resolved, with appropriate disclosures in the financial statements. The Group believes that it has paid in due time and in full all applicable taxes, penalties and penalty interests in the applicable extent.
Transfer Pricing
According to applicable relevant tax legislation in Cyprus, Romania and Poland, the tax assessment of related party transactions is based on the concept of market value for the respective transfers. Following this concept, the prices applicable for intra-group transactions reflect the market value that would have been set between unrelated companies acting independently (i.e. based on the "arm's length principle"). It is likely that transfer pricing reviews will be undertaken in the future to assess whether the transfer pricing policy observes the "arm's length principle".
Legal Proceedings
The Group is engaged in ongoing litigations related to development projects, lease contracts and for miscellaneous compensation. The outcome of such litigations is uncertain, and no provision for potential losses has been made as the likelihood of an adverse judgment is not considered probable.
28. Subsequent events
Dividends
On 26 August 2026, the Company announced that its Board of Directors has approved the payment of an interim dividend in respect of the six-month period ended 30 June 2026 of €0.07 per ordinary share (which will be paid on 9 October 2026) and offers a scrip dividend alternative to the interim dividend so that qualifying shareholders can elect to receive new ordinary shares in the Company instead of cash in respect of all or part of their entitlement to the interim dividend. Qualifying shareholders who validly elect to receive the scrip dividend alternative will become entitled to a number of scrip dividend shares in respect of their entitlement to the interim dividend that is based on the reference price of €1.34 per scrip dividend share.
ADDITIONAL INFORMATION
29. EPRA NAV Metrics
|
|
EPRA NRV |
EPRA NTA |
EPRA NDV |
EPRA NRV |
EPRA NTA |
EPRA NDV |
|
|
30-Jun-26 |
30-Jun-26 |
30-Jun-26 |
31-Dec-25 |
31-Dec-25 |
31-Dec-25 |
|
|
€'000 |
€'000 |
€'000 |
€'000 |
€'000 |
€'000 |
|
Net assets attributable to equity holders of the parent |
1,533,305 |
1,533,305 |
1,533,305 |
1,513,584 |
1,513,584 |
1,513,584 |
|
Include / exclude |
|
|
|
|
|
|
|
I) Hybrid instruments |
− |
− |
− |
− |
− |
− |
|
Diluted NAV |
1,533,305 |
1,533,305 |
1,533,305 |
1,513,584 |
1,513,584 |
1,513,584 |
|
Include: |
|
|
|
|
|
|
|
II. a) Revaluation of IP (if IAS 40 cost option is used) |
− |
− |
− |
− |
− |
− |
|
II. b) Revaluation of IPUC (if IAS 40 cost option is used) |
− |
− |
− |
− |
− |
− |
|
II. c) Revaluation of other non-current investments |
− |
− |
− |
− |
− |
− |
|
III.) Revaluation of tenant leases held as finance leases |
− |
− |
− |
− |
− |
− |
|
IV.) Revaluation of trading properties |
− |
− |
− |
− |
− |
− |
|
Diluted NAV at fair value |
1,533,305 |
1,533,305 |
1,533,305 |
1,513,584 |
1,513,584 |
1,513,584 |
|
Exclude: |
|
|
|
|
|
|
|
V) Deferred tax in relation to fair value gains of IP |
140,626 |
70,313 |
n/a |
131,031 |
65,516 |
n/a |
|
VI) Fair value of financial instruments |
(9,318) |
(9,318) |
(9,318) |
(7,816) |
(7,816) |
(7,816) |
|
VII) Goodwill as a result of deferred tax |
(5,387) |
(5,387) |
(5,387) |
(5,387) |
(5,387) |
(5,387) |
|
VIII. a) Goodwill as per the IFRS balance sheet |
n/a |
(6,652) |
(6,652) |
n/a |
(6,652) |
(6,652) |
|
VIII. b) Intangibles as per the IFRS balance sheet |
n/a |
(411) |
(411) |
n/a |
(338) |
(338) |
|
IX) Adjustment in respect of joint venture and NCI share for above items |
103 |
103 |
n/a |
64 |
64 |
n/a |
|
Include: |
|
|
|
|
|
|
|
IX) Fair value of fixed interest rate debt |
n/a |
n/a |
(6,511) |
n/a |
n/a |
(11,327) |
|
X) Revaluation of intangibles to fair value |
n/a |
n/a |
n/a |
n/a |
n/a |
n/a |
|
XI) Real estate transfer tax / acquisition costs |
− |
− |
n/a |
− |
− |
n/a |
|
NAV |
1,659,329 |
1,581,953 |
1,505,026 |
1,631,476 |
1,558,971 |
1,482,064 |
|
Fully diluted number of shares |
300,478 |
300,478 |
300,478 |
290,401 |
290,401 |
290,401 |
|
NAV per share (EUR) |
5.52 |
5.26 |
5.01 |
5.62 |
5.37 |
5.10 |
30. EPRA LTV Metric
|
|
30 June 2026 |
31 December 2025 |
||||
|
|
|
Proportionate Consolidation |
|
|
Proportionate Consolidation |
|
|
|
Group (as reported) |
Share of Joint Ventures |
Combined |
Group (as reported) |
Share of Joint Ventures |
Combined |
|
|
€'000 |
€'000 |
€'000 |
€'000 |
€'000 |
€'000 |
|
Include: |
|
|
|
|
|
|
|
Borrowings from Financial Institutions |
856,867 |
- |
856,867 |
865,489 |
- |
865,489 |
|
Commercial paper |
n/a |
n/a |
n/a |
n/a |
n/a |
n/a |
|
Hybrids (incl. convertibles, pref. shares, debt, options, perpetuals) |
n/a |
n/a |
n/a |
n/a |
n/a |
n/a |
|
Bond loans |
379,795 |
n/a |
379,795 |
513,204 |
n/a |
513,204 |
|
Foreign currency derivatives |
n/a |
n/a |
n/a |
n/a |
n/a |
n/a |
|
Net payables |
40,960 |
2,042 |
43,002 |
44,029 |
1,988 |
46,017 |
|
Owner-occupied property (debt) |
n/a |
n/a |
n/a |
n/a |
n/a |
n/a |
|
Current accounts (equity characteristic) |
n/a |
n/a |
n/a |
n/a |
n/a |
n/a |
|
Exclude: |
|
|
|
|
|
|
|
Cash and cash equivalents |
273,355 |
1 |
273,356 |
410,594 |
9 |
410,603 |
|
Net Debt (a) |
1,004,267 |
2,042 |
1,006,309 |
1,012,128 |
1,979 |
1,014,107 |
|
Include: |
|
|
|
|
|
|
|
Owner-occupied property |
n/a |
n/a |
n/a |
n/a |
n/a |
n/a |
|
Investment properties at fair value |
2,630,051 |
4,100 |
2,634,151 |
2,620,560 |
3,950 |
2,624,510 |
|
Properties held for sale |
6,910 |
- |
6,910 |
- |
- |
- |
|
Properties under development |
13,900 |
- |
13,900 |
21,570 |
- |
21,570 |
|
Intangibles |
411 |
- |
411 |
338 |
- |
338 |
|
Net receivables |
- |
- |
- |
- |
- |
- |
|
Financial assets |
4,101 |
- |
4,101 |
3,990 |
- |
3,990 |
|
Total Property Value (b) |
2,655,373 |
4,100 |
2,659,473 |
2,646,458 |
3,950 |
2,650,408 |
|
|
|
|
|
|
|
|
|
LTV (a/b) |
37.8% |
49.8% |
37.8% |
38.2% |
50.1% |
38.3% |
31. EPRA Capex
|
|
30 June 2026 €'000 |
30 June 2025 €'000 |
||||||||
|
|
Romania |
Poland |
Total Group |
Joint Ventures (proportionate share) |
Total Group |
Romania |
Poland |
Total Group |
Joint Ventures (proportionate share) |
Total Group |
|
|
Romania |
Poland |
|
Romania |
|
Romania |
Poland |
|
Romania |
|
|
Acquisitions |
- |
- |
- |
- |
- |
- |
- |
- |
- |
- |
|
Development |
6,276 |
62 |
6,338 |
- |
6,338 |
19 |
3,845 |
3,864 |
- |
3,864 |
|
Investment properties |
1,332 |
7,444 |
8,776 |
- |
8,776 |
7,774 |
8,643 |
16,417 |
- |
16,417 |
|
Incremental lettable space |
- |
- |
- |
- |
- |
- |
- |
- |
- |
- |
|
No incremental lettable space |
4,770 |
8,077 |
12,847 |
- |
12,847 |
10,581 |
9,266 |
19,847 |
- |
19,847 |
|
Tenant incentives (net) |
(3,438) |
(633) |
(4,071) |
- |
(4,071) |
(2,807) |
(623) |
(3,430) |
- |
(3,430) |
|
Other material non-allocated types of expenditure |
- |
- |
- |
- |
- |
- |
- |
- |
- |
- |
|
Capitalised interest (if applicable) |
- |
- |
- |
- |
- |
- |
- |
- |
- |
- |
|
Total Capex |
7,608 |
7,506 |
15,114 |
- |
15,114 |
7,793 |
12,488 |
20,281 |
- |
20,281 |
|
Conversion from accrual to cash basis |
7,813 |
6,691 |
14,504 |
- |
14,504 |
4,209 |
4,386 |
8,595 |
- |
8,595 |
|
Total Capex on cash basis |
15,421 |
14,197 |
29,618 |
- |
29,618 |
12,002 |
16,874 |
28,876 |
- |
28,876 |
32. EPRA Cost Ratios (%)
|
|
|
|
|
|
|
|
30 June 2026 |
30 June 2025 |
|
|
|
€'000 |
€'000 |
|
Include: |
|
|
|
|
Administrative/operating expense line per IFRS income statement |
|
(9,902) |
(9,764) |
|
Net service charge costs/fees |
|
(6,717) |
(6,411) |
|
Management fees less actual/estimated profit element |
|
- |
- |
|
Other operating income/recharges intended to cover overhead expenses less any related profits |
|
(136) |
214 |
|
Share of Joint Ventures expenses |
|
(4) |
(6) |
|
Exclude (if part of the above): |
|
|
|
|
Investment property depreciation |
|
n/a |
n/a |
|
Ground rent costs |
|
- |
- |
|
EPRA Costs (including direct vacancy costs) |
(A) |
(16,759) |
(15,967) |
|
Direct vacancy costs |
|
5,983 |
4,816 |
|
EPRA Costs (excluding direct vacancy costs) |
(B) |
(10,776) |
(11,151) |
|
|
|
|
|
|
Gross Rental Income less ground rents - per IFRS |
|
76,191 |
74,939 |
|
Less: service fee and service charge costs components of Gross Rental Income (if relevant) |
|
- |
- |
|
Add: share of Joint Ventures (Gross Rental Income less ground rents) |
|
- |
- |
|
Gross Rental Income |
(C) |
76,191 |
74,939 |
|
|
|
|
|
|
EPRA Cost Ratio (including direct vacancy costs) |
(A/C) |
22.0% |
21.3% |
|
EPRA Cost Ratio (excluding direct vacancy costs) |
(B/C) |
14.1% |
14.8% |
|
STANDING PORTFOLIO - BREAKDOWN BY LOCATION & TYPE |
||||||||||||||||||||
|
(data as of 30 June 2026) |
|
|
|
|
|
|
|
|
|
|
|
|
|
|
|
|
|
|
||
|
|
|
Number of |
|
Value |
|
Area |
|
Occupancy Rate |
|
Rent |
|
Contracted Headline Rent / Sqm or Unit |
||||||||
|
|
|
Investments |
Properties |
|
GAV |
|
GLA |
|
by GLA |
|
Contracted |
WALL |
100% Rent |
|
Office |
Commercial |
Industrial |
|
||
|
|
|
(#) |
(#) |
|
(€m) |
|
(k sqm) |
|
(%) |
|
Rent (€m) |
Years |
(€m) |
|
(€/sqm/m) |
(€/sqm/m) |
(€/sqm/m) |
|
||
|
|
|
|
|
|
|
|
|
|
|
|
|
|
|
|
|
|
|
|
||
|
Office & Mixed-Use Portfolio |
|
|
|
|
|
|
|
|
|
|
|
|
|
|
|
|
|
|
||
|
|
|
|
|
|
|
|
|
|
|
|
|
|
|
|
|
|
|
|
||
|
Bucharest New CBD |
|
8 |
12 |
|
884.7 |
|
343.1 |
|
94.9% |
|
67.5 |
4.7 |
71.0 |
|
15.6 |
15.6 |
-- |
|
||
|
Bucharest Other |
|
4 |
6 |
|
274.1 |
|
118.2 |
|
93.7% |
|
21.5 |
4.5 |
23.2 |
|
15.3 |
15.0 |
-- |
|
||
|
Romania: Office |
|
12 |
18 |
|
1,158.8 |
|
461.3 |
|
94.6% |
|
89.0 |
4.6 |
94.2 |
|
15.5 |
15.5 |
-- |
|
||
|
|
|
|
|
|
|
|
|
|
|
|
|
|
|
|
|
|
|
|
||
|
Warsaw |
|
6 |
11 |
|
599.1 |
|
166.2 |
|
92.3% |
|
42.1 |
3.6 |
45.3 |
|
20.5 |
20.7 |
-- |
|
||
|
Krakow |
|
4 |
12 |
|
278.2 |
|
150.2 |
|
67.4% |
|
20.1 |
3.4 |
28.7 |
|
15.1 |
15.2 |
-- |
|
||
|
Wroclaw |
|
3 |
4 |
|
246.5 |
|
105.1 |
|
81.8% |
|
17.6 |
5.1 |
21.2 |
|
15.1 |
15.5 |
-- |
|
||
|
Lodz |
|
1 |
2 |
|
52.1 |
|
35.5 |
|
70.5% |
|
4.4 |
1.7 |
6.0 |
|
13.8 |
13.7 |
-- |
|
||
|
Katowice |
|
3 |
6 |
|
166.7 |
|
89.4 |
|
73.7% |
|
13.1 |
4.1 |
17.0 |
|
14.5 |
14.3 |
-- |
|
||
|
Gdansk |
|
1 |
1 |
|
59.0 |
|
25.5 |
|
99.8% |
|
5.2 |
4.1 |
5.3 |
|
16.0 |
15.8 |
-- |
|
||
|
Poland: Office & Mixed-Use |
|
18 |
36 |
|
1,401.5 |
|
572.0 |
|
79.9% |
|
102.5 |
3.8 |
123.5 |
|
16.9 |
16.9 |
-- |
|
||
|
|
|
|
|
|
|
|
|
|
|
|
|
|
|
|
|
|
|
|
||
|
Total Office & Mixed-Use Portfolio |
|
30 |
54 |
|
2,560.3 |
|
1,033.3 |
|
86.5% |
|
191.5 |
4.2 |
217.7 |
|
16.2 |
16.2 |
-- |
|
||
|
|
|
|
|
|
|
|
|
|
|
|
|
|
|
|
|
|
|
|
||
|
Logistics / Light-Industrial |
|
|
|
|
|
|
|
|
|
|
|
|
|
|
|
|
|
|
||
|
|
|
|
|
|
|
|
|
|
|
|
|
|
|
|
|
|
|
|
||
|
Craiova |
|
1 |
1 |
|
5.0 |
|
5.9 |
|
100.0% |
|
0.4 |
17.9 |
0.4 |
|
8.4 |
4.7 |
4.6 |
|
||
|
|
|
|
|
|
|
|
|
|
|
|
|
|
|
|
|
|
|
|
||
|
Total Industrial Portfolio |
|
1 |
1 |
|
5.0 |
|
5.9 |
|
100.0% |
|
0.4 |
17.9 |
0.4 |
|
8.4 |
4.7 |
4.6 |
|
||
|
|
|
|
|
|
|
|
|
|
|
|
|
|
|
|
|
|
|
|
||
|
Other Portfolio |
|
|
|
|
|
|
|
|
|
|
|
|
|
|
|
|
|
|
||
|
|
|
|
|
|
|
|
|
|
|
|
|
|
|
|
|
|
|
|
||
|
Bucharest New CBD |
|
1 |
1 |
|
10.8 |
|
5.0 |
|
nm |
|
0.1 |
3.5 |
0.1 |
|
-- |
-- |
-- |
|
||
|
Bucharest New CBD |
|
-- |
-- |
|
10.4 |
|
5.3 |
|
95.5% |
|
0.8 |
8.1 |
0.8 |
|
-- |
11.0 |
-- |
|
||
|
|
|
|
|
|
|
|
|
|
|
|
|
|
|
|
|
|
|
|
||
|
Total Other Portfolio |
|
1 |
1 |
|
21.2 |
|
10.3 |
|
nm |
|
0.9 |
7.4 |
0.9 |
|
-- |
11.0 |
-- |
|
||
|
|
|
|
|
|
|
|
|
|
|
|
|
|
|
|
|
|
|
|
||
|
Total Standing Commercial Portfolio |
|
31 |
55 |
|
2,575.7 |
|
1,044.5 |
|
86.6% |
|
192.7 |
4.2 |
218.9 |
|
16.2 |
16.1 |
4.6 |
|
||
|
Of which Romania |
|
13 |
19 |
|
1,174.2 |
|
472.5 |
|
94.7% |
|
90.2 |
4.7 |
95.4 |
|
15.5 |
15.3 |
4.6 |
|
||
|
Of which Poland |
|
18 |
36 |
|
1,401.5 |
|
572.0 |
|
79.9% |
|
102.5 |
3.8 |
123.5 |
|
16.9 |
16.9 |
-- |
|
||
GLOSSARY
Adjusted EBITDA (normalised)
Earnings before finance cost, finance income, tax, depreciation, amortisation of other non-current assets, purchase gain on acquisition of subsidiaries, fair value gain or loss on investment properties and financial instruments, and other non-operational and/or non-recurring income and expense items.
Asset or Property
Represent the individual land plot or building under development or standing building which forms part or the entirety of an investment.
Bargain Purchase Gain
Any excess between the fair value of net assets acquired and consideration paid, in accordance with IFRS 3 "Business Combination".
BREEAM
Building Research Establishment Assessment Method, which assesses the sustainability of the buildings against a range of criteria.
CAPEX
Represents the estimated Capital Expenditure to be incurred for the completion of the development projects.
Capitalisation Rates
Based on actual location, size and quality of the properties and considering market data at the valuation date.
CBD
Central Business District
CEE
Central and Eastern Europe
CIT
Corporate income tax
Commercial Properties
Comprises the office, light-industrial and retail properties, or areas of the portfolio.
Combined Portfolio
Includes the Group's property investments consolidated on the balance sheet under Investment Property- Freehold, plus those properties held as Joint Ventures (currently the land relating to Constanta Business Park project) presented at 100%.
Completed Investment Property
Completed developments consist of those properties that are in a condition which will allow the generation of cash flows from its rental.
Completion Dates
The date when the properties under development will be completed and ready to generate rental income after obtaining all necessary permits and approvals.
Consolidated Coverage Ratio
Calculated as the aggregate amount of Adjusted EBITDA for the period of the most recent two consecutive semi-annual periods ending on such Measurement Date divided by the Consolidated Interest Expense for such two semi-annual periods.
Consolidated Interest Expense
All charges, interest, commission, fees, discounts, premiums, and other finance costs in respect of Indebtedness (but excluding such interest on Subordinated Shareholder Debt) incurred by the Group.
Consolidated Leverage Ratio
Calculated as the Consolidated Total Indebtedness divided by Consolidated Total Assets
Consolidated Secured Leverage Ratio
Calculated as the Secured Consolidated Total Indebtedness divided by Consolidated Total Assets at that date
Consolidated Total Assets
Total assets (excluding intangible assets) of the Group.
Consolidated Total Indebtedness
Total Indebtedness of the Group (excluding deferred tax liabilities and income and deposits from tenants).
Contracted Rent
The annualised headline rent that is contracted on leases (including pre-leases) before any customary tenant incentive packages.
Debt Service Cover Ratio ("DSCR")
It is calculated as net operating income for the year as defined in specific loan agreements with the respective lenders, divided by the principal plus interest due over the same year or period.
Discount Rates
The discount rate is the interest rate used to discount a stream of future cash flows to their present value.
Discounted Cash Flow Analysis ("DCF")
Valuation method that implies income projections of the property for a discrete period, usually between 5-10 years. The DCF method involves the projection of a series of periodic cash flows either to an operating property or a development property. Discounted cash flow projections based on significant unobservable inputs considering the costs to complete and completion date.
Earnings Per Share ("EPS")
Profit after tax divided by the basic/diluted weighted average number of shares in issue during the year or period.
EDGE
Excellence in Design for Greater Efficiencies ("EDGE"). An innovation of the International Finance Corporation ("IFC"), member of the World Bank Group, EDGE is a green building standard and a certification system for more than 160 countries.
EPRA
The European Public Real Estate Association is a non-profit association representing Europe's publicly listed property companies.
EPRA Capex
Capitalised expenses for the financial period.
EPRA Earnings
Profit after tax attributable to the equity holders of the Company, excluding investment property revaluation, gains, losses on investment property disposals and related tax adjustment, bargain purchase gain on acquisition of subsidiaries, acquisition costs, changes in the fair value of financial instruments and associated close-out costs and the related deferred tax impact of adjustments made to profit after tax.
EPRA Earnings Per Share
EPRA Earnings divided by the basic or diluted number of shares outstanding at the year or period end.
EPRA Net Disposal Value ("EPRA NDV")
The EPRA Net Disposal Value provides the reader with a scenario where deferred tax, financial instruments, and certain other adjustments are calculated as to the full extent of their liability, including tax exposure not reflected in the Balance Sheet, net of any resulting tax. This measure should not be viewed as a "liquidation NAV" because, in many cases, fair values do not represent liquidation values.
EPRA Net Reinstatement Value ("EPRA NRV")
The objective of the EPRA Net Reinstatement Value measure is to highlight the value of net assets on a long-term basis. Assets and liabilities that are not expected to crystallise in normal circumstances such as the fair value movements on financial derivatives and deferred taxes on property valuation surpluses are therefore excluded. Since the aim of the metric is to also reflect what would be needed to recreate the Company through the investment markets based on its current capital and financing structure, related costs such as real estate transfer taxes are included, as applicable.
EPRA Net Tangible Assets ("EPRA NTA")
The underlying assumption behind the EPRA Net Tangible Assets calculation assumes entities buy and sell assets, thereby crystallising certain levels of deferred tax liability.
EPRA NAV, EPRA NRV, EPRA NTA, EPRA NDV Per Share
EPRA NAV, or EPRA NRV, or EPRA NTA, or EPRA NDV divided by the diluted number of shares outstanding at the year or period end. Estimated Rental Value ("ERV")
ERV is the external valuers' opinion as to the open market rent which, on the date of valuations, could reasonably be expected to be obtained on a new letting or rent review of a property.
Estimated Vacancy Rates
Represent vacancy rates computed based on current and expected future market conditions after expiry of any current lease.
EURIBOR
The Euro Interbank Offered Rate: the interest rate charged by one bank to another for lending money, often used as a reference rate in bank facilities.
Financial Year
Period from 1 January to 31 December.
FFO
Free funds from operations, estimated as the EPRA Earnings for the relevant period.
GLA
Gross leasable area.
IFRS
International Financial Reporting Standards as adopted by the European Union.
IFRS Earnings
Result (Profit or Loss) after tax as per the statement of comprehensive income.
IFRS Earnings per share
Result (Profit or Loss) after tax as per the statement of comprehensive income divided by the weighted average number of shares in issue during the year.
Interest Cover Ratio ("ICR")
Calculated as net operating income divided by the debt service / interest.
Investment
Represent a location in which the Company owns / has interests in.
Land Bank for Further Development
Land bought for further development but for which the Group did not obtain all the legal documentations and authorisation permits in order to start the development process.
Leadership in Energy & Environmental Design ("LEED")
LEED, a green building certification programme that recognises best-in-class building strategies and practices.
Loan-to-Cost Ratio ("LTC")
Calculated by dividing the value of loan drawdowns by the total project cost.
Loan to Value ("LTV")
Calculated as the total outstanding debt excluding amortised cost, less cash and cash equivalents as of financial position date, divided by the appraised value of owned assets as of the financial position date. Both outstanding debt and the appraised value of owned assets include our share of these figures for joint ventures, which are accounted for in the consolidated financial statements under the equity method.
Maintenance Costs
Including necessary investments to maintain functionality of the property for its expected useful life.
Master Lease
Master lease includes various rental guarantees, which range between 3 and 5 years, covering certain vacant spaces in certain properties owned in Poland.
MSCI
MSCI is an international finance company headquartered in New York City and listed on New York Stock Exchange and serves as a global provider of equity, fixed income, hedge fund stock market indexes, multi-asset portfolio analysis tools and ESG products. An MSCI ESG Rating is designed to measure a company's resilience to long-term, industry material environmental, social and governance ("ESG") risks.
NBP
National bank of Poland.
Net Assets Value ("NAV")
Equity attributable to shareholders of the Company and/or net assets value.
Net Asset Value ("NAV") Per Share
Equity attributable to owners of the Company divided by the number of Ordinary shares in issue at the period end.
Net Operating Income ("NOI")
Net operating income (being the gross operating income less operating expenses that are not paid by or rechargeable to tenants, excluding funding costs, depreciation and capital expenditure).
Occupancy Rate
The estimated let sqm (GLA) as a percentage of the total estimated total sqm (GLA) of the portfolio, excluding development properties and in certain cases (where applicable) spaces subject to asset management (where they have been taken back for refurbishment and are not available to let as of the financial position date).
Open Market Value ("OMV" or "GAV")
Open market value means the fair value of the Group's investment properties and the joint ventures (where the Group owns 50%) determined by Colliers Valuation and Advisory SRL ("Colliers"), Cushman & Wakefield International Real Estate Advisor Ltd, AXI IMMO Group Sp. z o.o and Knight Frank Sp. z o.o. ("Knight Frank") independent professionally qualified valuers who hold a recognised relevant professional qualification and have recent experience in the locations and segments of the investment properties valued, using recognised valuation techniques.
Passing Rent
It is the gross rent, less any ground rent payable under the head leases.
Property Under Development
Properties that are in development process that do not meet all the requirements to be transferred to completed investment property.
RCF
Revolving Credit Facility.
Residual Value Method
Valuation method that estimated the difference between the market value of the building upon completion that can be built on the plot of land, and all the building's construction costs, as well as the developer's profit. This method relies on the contribution concept by estimating from the future income of the building, the amount that can be distributed to the land.
ROBOR
Romanian Interbank Offer Rate.
Sales Comparison Approach
Valuation method that compares the subject property with quoted prices of similar properties in the same or similar location.
Secured Consolidated Total Indebtedness Consolidated
Total Indebtedness that is secured by any Security granted by any member of the Group.
SPA
Share sale purchase agreement.
SQM
Square metres.
The Company or the Group
Globalworth Real Estate Investments Limited and its subsidiaries.
The Investment Adviser
Globalworth Investment Advisers Limited, a wholly owned holding subsidiary incorporated in Guernsey.
Total Accounting Return
Total accounting return is the growth in EPRA NRV per share plus dividends paid, expressed as a percentage of EPRA NRV per share at the beginning of the year.
Total Unencumbered Assets Ratio
Calculated as the Unsecured Consolidated Total Assets divided by Unsecured Consolidated Total Indebtedness.
Unsecured Consolidated Total Assets
Means such amount of Consolidated Total Assets that is not subject to any Security granted by any subsidiary of the Group.
Unsecured Consolidated Total Indebtedness
Means the Consolidated Total Indebtedness less Secured Consolidated Total Indebtedness.
WALL
Represents the remaining weighted average lease length of the contracted leases as of the financial position date, until the lease contracts full expiration.
Weighted Average Interest Rate
The average of the interest rate charged on the Group's loans, weighted by the relative outstanding balance of each loan at the year or period end.
WIBOR
Warsaw Interbank Offered Rate.
COMPANY DIRECTORY
Registered Office
PO Box 336
Fourth Floor
Plaza House
Admiral Park
St Peter Port
Guernsey
GY1 3UQ
Nominated Adviser and Broker
Panmure Liberum Limited
Ropemaker Place
Level 12
25 Ropemaker Street
London
EC2Y 9LY
Auditors
Ernst & Young
Esperides Building
10 Esperidon Street
1087 Nicosia
Cyprus
P.O Box 21656 1511 Nicosia
Cyprus
Administrator
IQ EQ (Guernsey) Limited
Fourth Floor
Plaza House
Admiral Park
St Peter Port
Guernsey
GY1 2HU
Company Secretary
Fourth Floor
Plaza House
Admiral Park
St Peter Port
Guernsey
GY1 2HU
Registrar
MUFG Corporate Markets (Guernsey) Limited
Mont Crevalt House
Bulwer Avenue St. Sampson
Guernsey
GY2 4LH
RNS may use your IP address to confirm compliance with the terms and conditions, to analyse how you engage with the information contained in this communication, and to share such analysis on an anonymised basis with others as part of our commercial services. For further information about how RNS and the London Stock Exchange use the personal data you provide us, please see our Privacy Policy.

Latest directors dealings
- 1 hour ago Mcbride
- 2 hours ago Next
- 2 hours ago Craneware
- 2 hours ago Solid State
- 2 hours ago Coca-Cola Europacific Partners (DI)