
Full year results for the year ended 31 May 2026
Summary by AI BETAClose X


4 August 2026
FILTRONIC PLC
("Filtronic", the "Company" or the "Group")
Audited full year results for the year ended 31 May 2026
Solid execution and strengthening foundations for future growth
Filtronic plc (AIM: FTC), the designer and manufacturer of products and sub-systems for the aerospace, defence, telecoms infrastructure, space and critical communications markets, announces its full year results for the 12 months ended 31 May 2026 ("FY 2026").
Financial Highlights
|
|
FY2026 |
FY2025 |
|
Revenue |
£55.5m |
£56.3m |
|
Adjusted EBITDA¹ |
£11.3m |
£17.0m |
|
Operating profit |
£4.0m |
£13.4m |
|
Profit before taxation |
£3.8m |
£13.4m |
|
Profit for the year |
£4.6m |
£14.0m |
|
Basic earnings per share |
2.07p |
6.42p |
|
Diluted earnings per share |
1.78p |
6.05p |
|
Cash at bank |
£12.9m |
£14.5m |
|
Net cash when excluding right of use property leases |
£10.8m |
£12.3m |
|
Net cash |
£7.3m |
£10.8m |
|
Cash generated from operating activities |
£11.8m |
£13.8m |
¹ Adjusted EBITDA is earnings before interest, taxation, depreciation, amortisation, share-based payments and exceptional items.
Operational highlights
Continued contract momentum and growing customer diversification
|
· |
Expansion of strategic relationship with SpaceX, for the previously announced deployment of next-generation Gallium Nitride ("GaN") E-band technology at $62.5m, the Group's largest single order to date. |
|
· |
Secured an $8.0m contract with a US-based customer for the development high-performance amplifier systems, followed by a further contract post-period end, broadening Filtronic's position within the wider satellite communications ecosystem. |
|
· |
Accelerating diversification of the customer base, with new multi-year contract wins including a €7.0m agreement with a European space customer and a £13.4m contract with a leading European defence prime, strengthening the Company's position across space, aerospace and defence markets. |
Product roadmap progressing into higher-value RF opportunities
|
· |
Successful deployment of next-generation GaN E-band products, representing an important step in the transition towards higher-performance and higher-value RF solutions. |
|
· |
Continued expansion into high-frequency spectrum bands, including development activity across V-band, W-band and Q-band and adjacent opportunities, increasing Filtronic's addressable market. |
Operational scale supporting long-term growth
|
· |
Completed transition into the new self-funded Sedgefield headquarters and manufacturing facility, materially increasing production capacity that can support revenues in excess of £200m per annum and supporting future programme growth. |
|
· |
Continued investment across engineering capability, programme management and commercial engagement to support an increasing number of concurrent customer programmes, evidenced by positive contract momentum in the year. |
|
· |
Investment in the technology and product roadmap continues at pace, reflecting the Board's confidence in medium- and long-term opportunities. |
Outlook
During FY2026, Filtronic continued its progress toward operating at a larger scale, successfully diversified the customer base and expanding its operational capabilities. The Board continues to have confidence in the opportunities ahead, as evidenced by:
|
· |
Entered FY2027 with a strong order book providing approximately 90% coverage of current market expectations for FY2027 revenue. |
|
· |
Structural growth drivers across space and defence remain supportive, underpinned by increasing demand for high-capacity communications infrastructure and resilient RF technologies. |
|
· |
The year is expected to be H2 weighted, reflecting the transition between Gallium Arsenide ("GaAs") supply and the ramp-up of GaN production. |
|
· |
The balance sheet remains strong proving the flexibility needed to support future growth. |
|
· |
The Board remains confident of delivering FY2027 in line with market expectations. |
Nat Edington, Chief Executive Officer, commented: "FY2026 reflects the continued evolution of Filtronic into a business operating at greater scale, with stronger visibility, a growing product-led offering and an expanding opportunity across our core markets. We have continued to strengthen strategic customer relationships, progress our technology roadmap and invest in the capabilities required to support long-term growth. With a strong order book already providing substantial coverage for FY2027 revenues and growing engagement across key programmes, we are excited about the opportunities ahead."
Enquiries
|
Filtronic plc |
www.filtronic.com |
|
Nat Edington, CEO |
01740 618800 or |
|
Michael Tyerman, CFO |
investor.relations@filtronic.com |
|
|
|
|
Cavendish Capital Markets Limited (Nomad and Corporate Broker) |
020 7220 0500 |
|
Jonny Franklin-Adams/Isaac Hooper/Callum Davidson (Corporate Finance) |
|
|
Sunila de Silva (Corporate Broking) |
|
|
|
|
|
Berenberg (Joint Broker) |
020 3207 7800 |
|
Tom Ballard, Mark Whitmore, Harry Nicholas, Brooke Harris-Lowing |
|
|
Alma Strategic Communications Caroline Forde, Hannah Campbell, Rose Docherty |
020 3405 0205 or filtronic@almastrategic.com |
Notes:
This announcement contains inside information for the purposes of Article 7 of Regulation (EU) No 596/2014.
Forward-looking statements
The Chairman's statement and Chief Executive's review include statements that are forward looking in nature. These are made by the Directors in good faith based on the information available to them at the time of their approval of this report. Such statements are based on current expectations and are subject to a number of risks and uncertainties, including both economic and business risk factors that could cause actual events or results to differ materially from any expected future events referred to in these forward-looking statements. Unless otherwise required by applicable law, regulation or accounting standard, the Group undertakes no obligation to update any forward-looking statements whether as a result of new information, future events or otherwise.
Chairman's statement
FY2026 has been another important year in Filtronic's evolution. While the financial performance reflects a deliberate period of investment following several years of significant growth, the progress made across our customer base, technology roadmap, operational capabilities and strategic positioning gives the Board increased confidence in the scale of the opportunity ahead. Filtronic enters its next phase of development with stronger foundations, broader market exposure and enhanced long-term growth potential.
As a Board, our role is to provide effective oversight, constructive challenge and long-term stewardship. We continue to ensure that management is positioned not only to deliver today's objectives but also to build a business capable of sustaining success over many years. During FY2026, the Board remained focused on those priorities: supporting investment in future growth, maintaining strong financial discipline, strengthening governance and ensuring that the organisation continues to evolve as the business scales.
Filtronic is a very different company from that of only a few years ago. Today, Filtronic operates a higher-value, increasingly scalable and more strategically significant business model, characterised by greater levels of repeat production revenue, longer duration programmes, deeper customer relationships and growing participation in critical communications infrastructure. These characteristics provide increased visibility, resilience and opportunity as the business continues to scale. The increasing scale of the business opportunities ahead, the strategic importance of our customer relationships and the complexity of our programmes require the Company to continue maturing in every aspect of its operations. The Board has therefore placed considerable emphasis on organisational capability, leadership development, succession planning and ensuring that the Company's governance and control environment develops in line with its ambitions.
One of the Board's responsibilities is to balance opportunity with risk. Throughout the year we carefully considered the pace of investment in technology, facilities and people against the need to preserve the Group's strong financial position. We remain convinced that disciplined investment is essential to securing Filtronic's long-term competitive advantage and creating sustainable shareholder value. At the same time, we continue to maintain a rigorous approach to capital allocation and risk management.
The Board also continued to engage actively with shareholders during the year. We greatly value the constructive dialogue we have with both existing and prospective investors, whose feedback provides valuable insight into how the Company is perceived and where we can continue to improve. We remain committed to maintaining high standards of transparency, governance and communication as the Company continues to grow.
The Board recognises that our success is built upon technical excellence, innovation and a commitment to customers. As the organisation grows, preserving these qualities while developing the leadership, processes and capabilities required of a larger international technology business remains a key priority.
On behalf of the Board, I would like to thank all our employees for their continued commitment and professionalism and commitment to excellence. Their contribution is fundamental to Filtronic's success. I would also like to thank our customers, suppliers and shareholders for their continued trust and support.
Looking ahead, the Board believes Filtronic is entering its next five years from a position of strength. The Group has established strong relationships with world-leading customers, expanded its addressable market, significantly enhanced its manufacturing capacity and developed a technology roadmap aligned with some of the most attractive growth themes across space, defence and advanced communications. Together, these factors underpin our confidence in the Company's long-term prospects. Supported by a strong balance sheet and net cash position, the Group retains the flexibility to continue investing in technology, capacity and capability while maintaining appropriate financial discipline.
The foundations that have been established over recent years provide confidence that the Company is well placed to deliver sustainable long-term growth and create enduring value for all of its stakeholders. The Group enters FY2027 with a strong order book and multi-year customer commitments which gives the Board a high level of confidence to deliver the current market expectation. To address a key strategic priority, the customer concentration of our lead client is expected to reduce further whilst increasing revenue, reflecting the progress we are making on new customer acquisition. The market phasing and timing of our product road maps will mean that revenue and profitability are expected to be weighted towards the second half of the year as we ramp to volume on our next-generation E band Gallium Nitride monolithic microwave integrated circuit technology ("GaN") programme. We look to the future with confidence while remaining committed to the disciplined governance and long-term stewardship that will continue to underpin the Company's success.
Jonathan Neale
Chair
3 August 2026
Chief Executive's review
When I reflect on FY2026, I see a business that has reached an important inflection point in its evolution.
While our reported revenue of £55.5 million was marginally below last year's record performance, we saw year on year organic sales growth and delivered adjusted EBITDA marginally ahead of adjusted expectations at £11.3 million (FY2025: £17.0m). While FY2026 reflects a year of continued investment, customer diversification and operational scaling, I believe the fundamental strength of the business has never been greater. We enter FY2027 with enhanced visibility, broader market opportunities and significantly improved strategic positioning. Over the past twelve months we have continued to broaden our customer base, expand our technology leadership, invest in manufacturing capacity and strengthen the organisation for the next phase of growth. As a result, we enter FY2027 with greater strategic momentum, improved visibility and a business that is materially stronger than it was a year ago.
The market backdrop for Filtronic is arguably the most compelling it has been in the Company's history. Rapid growth in satellite communications, increasing defence expenditure and the escalating demand for secure, high-capacity communications infrastructure are driving sustained investment in the advanced RF technologies that sit at the core of our expertise. The convergence of the space and defence sectors is fundamentally changing the communications landscape. Governments are increasing defence spending at unprecedented levels, commercial space continues to scale rapidly, and both markets are demanding higher performance, greater bandwidth and more resilient communications networks. These long-term structural trends are creating a sustained increase in demand for advanced RF technology, particularly at mmWave frequencies where Filtronic has built a reputation as one of the industry's leading specialists.
Our strategy has always been straightforward: develop technologies that solve the most difficult RF engineering challenges, build deep partnerships with world-class customers, and continually invest ahead of demand. The progress we have made during FY2026 demonstrates that this strategy is working.
Despite the significant progress made over recent years, I believe we are still in the early stages of our journey. The markets in which we operate continue to expand rapidly, our technology roadmap is strengthening, and our ambition remains unchanged: to establish Filtronic as a globally recognised leader in advanced RF solutions for the world's most demanding communications applications.
Perhaps the clearest evidence of this is the increasing diversification of the business, both in terms of customers and the products we are delivering in our focus markets. Several years ago, we recognised that whilst our strategic relationship with our primary customer represented a transformational opportunity, long-term shareholder value would ultimately be created through broadening our customer base and applying our technologies across multiple markets and applications. During FY2026 we made significant progress against this objective. Revenue from our largest customer reduced to 68% of Group revenue (FY2025: 83%). Importantly, this diversification has been achieved while continuing to grow our engagement with our largest customer, demonstrating that expansion of the business is being driven by the addition of new programmes and customers rather than a reallocation of existing revenue streams. This not only reduces customer concentration risk but demonstrates that Filtronic's technologies are increasingly recognised by multiple global leaders.
Importantly, our growth is not being driven by a single product or programme. We continue to expand our technology portfolio, extending our capabilities across higher frequency bands and investing in next-generation gallium nitride ("GaN") solutions that we believe will underpin the next wave of satellite communications and defence systems. In 2026 we launched new products in E, V and W-band, and sampled our first full SSPA system at world leading 200W for a solid-state V-band amplifier. As spectrum utilisation continues to migrate towards higher frequencies, our expertise in RF design and complex manufacturing positions us exceptionally well to address markets where technical barriers to entry remain high.
Technology leadership alone, however, is not sufficient. Customers increasingly require partners capable of delivering both innovation and industrial scale. During FY2026 we therefore continued to invest heavily in the capabilities required to support substantially larger programmes. The successful relocation into our new headquarters represents far more than additional manufacturing space; it provides the operational platform from which we can support the significant growth opportunities we see ahead, future proofing our business to support in excess of £200 million revenues in the future. Alongside this investment, we have strengthened our engineering capability, enhanced programme management disciplines and continued to develop the talent that differentiates Filtronic.
A key highlight in the year was the ongoing development of our strategic relationship with our largest customer, including the award of a second major contract valued at $62.5m (£47.3m). The programme marks the first production deployment of our E-band GaN technology and supports the transition of this platform from development into volume manufacture.
We also continued to broaden our presence across the wider space sector. During the year, we secured an $8.0m contract with a US-based customer for the development and qualification of high-performance amplifier systems. This was followed, post year end, by a further contract award from the same customer to design a state-of-the-art, high frequency transmit/receive ("Tx/Rx") module.
Together, these awards strengthen our position within the broader US space ecosystem and demonstrate the growing recognition of Filtronic as a trusted partner for advanced RF solutions to Tier 1 space players. They also reflect increasing demand for our differentiated technology across a widening range of satellite communications applications, supporting our strategy to diversify our customer base and create multiple long-term growth opportunities within the global space market.
Alongside our continued progress in the US, we secured further aerospace and defence contracts across Europe, including multi-year programmes supporting Low Earth Orbit satellite constellation deployments and advanced defence electronics applications. These contract wins demonstrate our growing penetration of adjacent markets and further strengthen the diversification of our customer base.
One of the characteristics I value most within Filtronic is our willingness to invest for the long term. We have consistently prioritised sustainable value creation over short-term optimisation, investing in technology, facilities and people ahead of revenue. Whilst this inevitably creates periods where investment runs ahead of financial returns, I believe it is precisely this discipline that has enabled Filtronic to establish itself as a trusted strategic partner to some of the world's most demanding technology organisations.
Our financial position provides us with the flexibility to continue executing this strategy with confidence. We maintain a strong balance sheet and healthy profitability enabling us to continue investing organically while remaining disciplined in our allocation of capital.
Looking ahead, I believe Filtronic has never been better positioned. We enter FY2027 with a record order book providing approximately 90% visibility against current market expectations, an increasingly diversified customer base, expanded manufacturing capabilities and a growing portfolio of proprietary technologies addressing attractive end markets. Combined with a strong balance sheet and a substantial pipeline of opportunities, these factors provide us with confidence in both the near-term outlook and our longer-term growth potential. We possess the technology, customer relationships, manufacturing capability and talented people required to convert the plentiful opportunities we see into sustainable long-term growth.
None of this would be possible without the commitment, expertise and determination of our people. Their passion for engineering excellence, innovation and customer success continues to define Filtronic and remains our greatest competitive advantage. I would like to thank every member of the team for their outstanding contribution throughout the year, together with our customers, partners and shareholders for their continued trust and support.
The opportunities ahead are significant. We remain focused on disciplined execution, continued innovation and delivering sustainable long-term value for all our stakeholders. I have every confidence that Filtronic is exceptionally well placed to build on the strong foundations established during FY2026 and create substantial value in the years ahead.
Nat Edington
Chief Executive Officer
3 August 2026
Financial Review
I am pleased to present the financial review for the year ended 31 May 2026.
This has been a year in which strategic investment and financial discipline have moved in step with one another. The Group operates in a large and growing market opportunity, across space, defence and aerospace, and the Board's clear priority this year has been to invest ahead of that opportunity with conviction, while maintaining the financial rigour that has always underpinned the Group's performance.
Investment has been deliberate and targeted at a number of strategic areas including the internal capabilities needed to convert our growing opportunity pipeline. This includes the commercial capacity to broaden the customer register, engineering resource to advance our technology roadmap and customer programmes, and a new enlarged manufacturing facility in Sedgefield to support the business at greater scale. The Group has continued to maintain healthy cash reserves, despite this significant investment for growth, and as a result enters the next phase of development with a strengthened balance sheet, a broader customer base, and the operational capacity to capitalise on the opportunity ahead.
New customer acquisition has translated into a natural reduction in the dependency of our largest customer. This is evidenced through a series of contract wins, each to a different customer, demonstrating execution against the objective of broadening the customer base. Importantly, this has been achieved alongside further entrenchment within our lead customer, as the period includes the Group's largest ever contract win with SpaceX for next-generation E-band GaN products. As a result of this work, the Group enters the new financial year with a strong order book that substantially underwrites the current forecast numbers.
Revenue
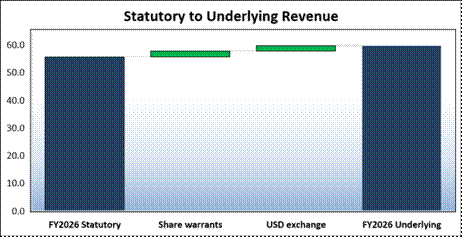
As anticipated, this year represented a natural pause in the Group's recent trajectory of exceptional growth, with headline revenue decreasing marginally to £55.5 million (2025: £56.3 million).
Excluding the impact of the factors outlined below, the Group delivered underlying year-on-year organic sales growth of 6% to £59.7m.
· An amortisation charge to revenue of £3.5m (FY2025: £1.3m) for the SpaceX share warrant agreement reducing revenue by £2.2m year-on-year; and
· A drag from the US dollar, in which a significant portion of revenue is recognised, which weakened across the financial year making each dollar sale less valuable than that of prior year by £2.0m.
Importantly, there was also a sizeable reduction in customer dependency risk during FY2026 as the revenue from our largest customer reduced to 68% (2025: 83%), due to the commercial success described above, in widening our customer base as planned. We expect this to reduce further as a percentage in the outlook period as we convert our pipeline into order book with other major players across our markets.
The space market continues to perform well, and this year has benefitted from new customers including Airbus, Viasat and our recently acquired, but confidential, US customer, adding meaningful revenue. The addition of these new logos will drive further growth in the space market into the next financial year and beyond. Overall, this year saw a decline in space revenue of 12%, despite a volume increase due to the FX headwinds already mentioned, a charge to revenue of £3.5m for the share warrant charge and a planned strategic pricing strategy.
Revenue from the aerospace and defence sector grew by 135%, demonstrating our ability to enhance our reach in this core market, in line with our guidance to the market. A large element of this revenue relates to the contract to supply airborne radar systems to our lead defence customer. As a result of the two large contract wins commencing which were announced in the year. The momentum continues to build, and we expect to deliver further year-on-year growth in the coming year to this sector.
Demand in the critical communications market benefitted from the rollout of the new platform for use in P25 networks although this is likely to replace the legacy combiner product going forward rather than being additive. This resulted in a 28% increase in revenue to this market.
IFRS 15 'Revenue from Contracts with Customer' requires the SpaceX share warrants to be treated as a non-cash variable consideration payable to the customer. The charge to revenue in the year was £3.5m (2025: £1.3m).
Operating costs and headcount
Operating costs increased by 19% in the year to £25.1m (2025: £21.0m) demonstrating the controlled investment we continue to make to ensure we capitalise on the significant market opportunity ahead. Most of this investment was people related particularly within engineering disciplines, business development, bid management and the manufacturing function.
Engineering headcount has again increased substantially to support both product development and customer delivery. We now service a considerably larger portfolio of programmes, reflecting the growing opportunity within the space sector and the corresponding demand placed on our supply capabilities. Recruitment remains an area of active risk management, given the ongoing industry-wide challenge relating to the skills shortage in RF engineering. However, we are encouraged by recent success in attracting new talent and onboarding across our four UK engineering development sites, particularly at our Cambridge site, which has provided access to a deeper talent pool. To further strengthen our workforce, we are focused on building an organisation fit for the future by increasing graduate recruitment and expanding our apprenticeship programme, ensuring a pipeline of skilled engineers to support our growth ambitions. This also aligns well with our sustainability strategy to provide high-quality jobs in the local community.
To maintain flexibility and manage workload peaks, we continue to partner with external engineering firms and contract engineering resource on a variable cost basis, especially where niche skills or additional capacity is required. This is a cost-effective method of securing the relevant skills without the long-term commitment of hiring permanent employees.
Manufacturing headcount increased as we converted temporary production staff to permanent roles, allowing us to retain the skills developed within the team. This was particularly important as pipeline opportunities converted into firm orders and forward demand became more visible.
The business development team has been substantially strengthened during the period to capitalise on the significant market opportunity we see, and to expand coverage in terms of both customer volume and geographic reach, with Asia excluding China, now identified as a key territory for growth. To further professionalise the organisation, we have also established a bid management function to support sales and marketing, enabling us to service a greater number of bids in a timely and efficient manner. This has the added benefit of protecting capacity within the engineering team, allowing them to prioritise design rather than bid work.
Salary-related costs remain the Group's largest overhead, representing 74% of total operating costs, increasing by 28% and totalling £4.1 million, which is a significant driver of the overall rise in operating costs. This increase is reflected in headcount, which grew to 236 employees (2025: 186) as at 31 May 2026, and is analysed further below:
|
Number |
2026 |
2025 |
|
Manufacturing |
109 |
89 |
|
Research and development (engineering) |
92 |
72 |
|
Sales and marketing |
12 |
6 |
|
Administration |
23 |
19 |
|
Total headcount |
236 |
186 |
Engineering spend as a percentage of revenue is a critical key performance indicator ("KPI") for the Group, reflecting its importance in driving long-term, sustainable growth. We have previously guided that we aim to control this R&D spend at around 13% of revenue; however, given the scale of the opportunity we are seeing and the position the Group has secured in the market, underpinned by its deep understanding of high-frequency RF engineering, we are pursuing the technology roadmap more aggressively to maintain our competitive advantage and position ourselves for success, in this substantial market opportunity. Consequently, spend has temporarily increased to 17% (2025: 12%).
Other costs increased by 3%, in line with inflation, to support the ongoing scale-up of the business. Maintaining financial discipline to tightly control these costs remains important in ensuring we deliver strong returns on both the top and bottom line. The increase reflects additional headcount in support functions, along with recruitment fees associated with ongoing headcount growth and higher insurance costs.
Other operating income benefitted substantially from the UK R&D tax regime. The Group recognises R&D tax credits, through the new merged scheme, within operating profit. Within the year, operating income included a benefit of £1.2m.
Adjusted EBITDA
The Group utilises an alternative performance measure ("APM") to provide a clearer view of underlying business performance. The APM adopted is adjusted EBITDA as it measures the quality of earnings without the impact of non-cash expenses such as depreciation, amortisation and share-based payments, including the charge associated with SpaceX share warrants which is recognised against revenue.
Adjusted EBITDA for the year was £11.3m (2025: £17.0m), representing a 34% decrease, while operating profit was £4.0m (2025: £13.4m), representing a 70% decrease. This reduction was driven partly by softer gross profit, reflecting the deliberate pricing strategy to secure increased volumes, which resulted in a slight dilution in earnings quality, and partly by increased overheads arising from headcount growth.
The table below shows the reconciliation of operating profit delivered at £4.0m (2025: £13.4m) to adjusted EBITDA of £11.3m (2025: £17.0m).
|
|
2026 |
2025 |
|
Reconciliation of operating profit to adjusted EBITDA |
£000 |
£000 |
|
Operating profit |
3,971 |
13,442 |
|
Depreciation |
2,359 |
1,315 |
|
Amortisation |
586 |
537 |
|
Share warrant charge |
3,504 |
1,303 |
|
Share-based payments |
837 |
414 |
|
Adjusted EBITDA |
11,257 |
17,011 |
Taxation
Our tax strategy is aligned with our core values and fits within our overall corporate governance structure. Our strategy ensures that we comply with all tax laws wherever we do business and that we pay all taxes that we are legally required to pay when they fall due. To safeguard our reputation as a responsible taxpayer we do not participate in any tax planning arrangements that do not comply with either the legal interpretation or the spirit of tax laws.
A tax credit of £0.8m (2025: £0.7m) was recognised in the year. The Group benefits from R&D tax credits and the Patent Box regime, reflecting the advancement of science and technology embodied in the new products we develop, which reduce taxable profit on qualifying R&D activities and products. We also make use of the Annual Investment Allowance ("AIA"), which provides tax relief on capital expenditure, and utilise first-year allowances on capital purchases above the AIA threshold.
Research and development costs ("R&D")
Total R&D costs in the year before capitalisation and amortisation of development costs were £9.3m (2025: £6.7m). The Group incurred engineering costs on a mix of customer funded developments and progression of the technology roadmap.
The Group remains committed to investing in R&D as a key driver for future revenue growth and consequently measures R&D spend as a KPI. Key areas of spend in the year included product development for space applications, in both the ground station and the payload, and aerospace and defence. The year ahead will see us continue to invest in the development of our own strategic technology roadmap and proprietary intellectual property ("IP"), enabling us to build long-term shareholder value in the years ahead.
Where product development is customer specific, we seek to receive a Non-Recurring Engineering ("NRE") charge to maintain a healthy cashflow during the development phase of engineering projects and ensure commitment from our customer. When developing our own technology roadmap and IP, we invest from our own cash reserves unless we have successfully secured grant financing. Technology developed for the LEO space market, across multiple frequency bands, in both ground station applications and the payload have been developed exclusively from internal funds this year. Consequently, we capitalised £2.3m of development costs in the year (2025: £1.5m).
The Group capitalises its development costs in line with IAS 38 as set out in note 1 to the financial statements. A reconciliation of R&D costs before capitalisation and amortisation can be seen in the table below along with details of our conservative approach to capitalisation of R&D:
|
|
2026 |
2025 |
|
Reconciliation of R&D costs |
£000 |
£000 |
|
R&D costs in income statement |
7,481 |
5,625 |
|
Capitalisation of development costs |
2,303 |
1,496 |
|
Amortisation of development costs |
(452) |
(440) |
|
R&D cash spend |
9,333 |
6,681 |
When capitalising development costs, an impairment review is undertaken of each development programme to test the carrying value does not require impairment in line with IAS 36.
Capital expenditure - plant and machinery and right of use assets (excluding property leases)
An elevated level of capital expenditure was undertaken in the year to support expansion plans, including completion of construction work on the new, state-of-the-art facility at Sedgefield, which will serve the business well through the next phase of growth. Investment in plant and machinery related primarily to automated test equipment, providing the capability to service additional frequency bands under development, as well as new production lines to support the scale-up of operations. Total capital expenditure for the year was £10.3m (2025: £4.0m).
Warranty provision
In line with industry practice, the Group provides warranties to customers over the quality and performance of the products it sells. Reflecting a full risk analysis of current commercial contracts at 31 May 2026, the warranty provision was £0.4m (2025: £0.2m).
Dilapidation provision
The Group leases facilities at four sites in the UK and one in the USA with each of the leases requiring the site to be restored to its original condition. At 31 May 2026, the dilapidation provision was £0.3m (2025: £0.3m).
Cash position and banking facilities
The Group recorded a decrease in cash and cash equivalents to £12.9m (2025: £14.5m) at the year-end. Cash generated from operating activities in the year was £11.8m (2025: £13.8m) as adjusted EBITDA performance and advance customer payments drove cash generation, albeit with an offset from an increase in working capital synonymous with improved trading.
Net cash, when including all debt except property leases at the end of the period, was £10.8m (2025: £12.3m), whilst overall net cash including property leases was £7.3m (2025: £10.8m) due to the addition of the 10-year lease agreement signed in the year for the new state-of-the-art site at Sedgefield.
The Group's banking facilities are provided by Santander UK plc ("Santander"). The Group has a £10.0m Revolving Credit Facility ("RCF") with Santander, which was uplifted from £5.0m in January 2026. This provides a high-level of cash headroom to facilitate future growth of the business should further financing be needed. As at 31 May 2026 the facility was undrawn (2025: undrawn). Our covenants under this facility are debt service cover and interest cover measures, which have both been met throughout the year with substantial headroom available.
Regular reviews take place of our foreign currency cash flows. The Group undertakes hedging only where there are highly probable future cash flows and to hedge working capital exposures. The Group does most of its trading with customers in US dollars which creates a requirement to put in place a level of hedging contracts against the US dollar surplus that is expected to arise.
Going concern
In assessing going concern, the Board have considered:
· The principal risks faced by the Group which are discussed within the 'Risk management' section of the Annual Report;
· The financial position of the Group including forecasts and financial plans;
· The healthy cash position at 31 May 2026 of £12.9m (2025: £14.5m) and the additional headroom available through the undrawn RCF of £10m (2025: undrawn); and
· Economic headwinds with the potential for customers to reassess their priorities, with opportunities postponed or curtailed.
Following the above considerations, the directors are satisfied that the Group has adequate financial resources to continue in operational existence for a period of at least 12 months from the date of this report. Accordingly, the going concern basis has been adopted in the preparation of the Annual Report for the year ended 31 May 2026.
Michael Tyerman
Chief Financial Officer
3 August 2026
The Board
The directors that served during the year ended 31 May 2026, and to the date of this announcement, and their respective roles are set out below:
|
Jonathan Neale |
(Non-Executive Chairman) |
|
Nat Edington |
(Chief Executive Officer) |
|
Michael Tyerman |
(Chief Financial Officer) |
|
Pete Magowan |
(Non-Executive Director) |
|
John Behrendt |
(Non-Executive Director) |
Consolidated Income Statement
for the year ended 31 May 2026
|
|
|
|
|
|
|||
|
|
|
2026 |
2025 |
||||
|
|
Note |
£000 |
£000 |
||||
|
|
|
|
|
||||
|
Revenue |
2 |
55,529 |
56,318 |
||||
|
|
|
====== |
====== |
||||
|
Adjusted earnings before interest, taxation, depreciation, amortisation, share-based payments and share warrant charge |
|
11,257 |
17,011 |
||||
|
Amortisation of intangible assets |
|
(586) |
(537) |
||||
|
Depreciation of property, plant and equipment and right of use assets |
|
(2,359) |
(1,315) |
||||
|
Share warrant charge |
|
(3,504) |
(1,303) |
||||
|
Share-based payments |
|
(837) |
(414) |
||||
|
|
|
---------- |
---------- |
||||
|
Operating profit |
|
3,971 |
13,442 |
||||
|
Finance costs |
3 |
(486) |
(268) |
||||
|
Finance income |
4 |
275 |
213 |
||||
|
|
|
---------- |
---------- |
||||
|
Profit before taxation |
|
3,760 |
13,387 |
||||
|
Taxation |
6 |
797 |
662 |
||||
|
|
|
---------- |
---------- |
||||
|
Profit for the year |
|
4,557 |
14,049 |
||||
|
|
|
====== |
====== |
||||
|
|
|
|
|
||||
|
|
|
---------- |
---------- |
||||
|
Basic earnings per share |
5 |
2.07p |
6.42p |
||||
|
Diluted earnings per share |
5 |
1.78p |
6.05p |
||||
|
|
|
====== |
====== |
||||
|
|
|
|
|
|
|||
The profit for the year is attributable to the equity shareholders of the parent company, Filtronic plc.
Consolidated Statement of Comprehensive Income
for the year ended 31 May 2026
|
|
|
2026 |
2025 |
|
|
|
£000 |
£000 |
|
|
|
|
|
|
Profit for the year |
|
4,557 |
14,049 |
|
|
|
---------- |
---------- |
|
Other comprehensive income Items that are or may be subsequently reclassified to profit and loss:
|
|
|
|
|
Currency translation movement arising on consolidation |
|
(5) |
154 |
|
|
|
---------- |
---------- |
|
Total comprehensive income for the year |
|
4,552 |
14,203 |
|
|
|
====== |
====== |
The total comprehensive income for the year is attributable to the equity shareholders of the parent company Filtronic plc.
All income recognised in the year was generated from continuing operations.
Consolidated Balance Sheet
at 31 May 2026
|
|
|
|
|
|
|
|
2026 |
2025 |
|
|
Note |
£000 |
£000 |
|
Non-current assets |
|
|
|
|
Goodwill and other intangible assets |
|
5,442 |
3,507 |
|
Right of use assets |
|
6,383 |
4,546 |
|
Property, plant and equipment |
|
13,054 |
4,508 |
|
Contract assets |
7 |
- |
1,302 |
|
Deferred tax assets |
|
2,810 |
1,754 |
|
|
|
---------- |
---------- |
|
|
|
27,689 |
15,617 |
|
|
|
---------- |
---------- |
|
Current assets |
|
|
|
|
Inventories |
|
3,930 |
4,010 |
|
Trade and other receivables |
|
19,370 |
12,169 |
|
Contract assets |
7 |
1,302 |
3,504 |
|
Cash and cash equivalents |
|
12,905 |
14,494 |
|
|
|
---------- |
---------- |
|
|
|
37,507 |
34,177 |
|
|
|
---------- |
---------- |
|
|
|
|
|
|
Total assets |
|
65,196 |
49,794 |
|
|
|
---------- |
---------- |
|
Current liabilities |
|
|
|
|
Trade and other payables |
|
8,877 |
9,119 |
|
Provisions |
|
687 |
516 |
|
Deferred income |
|
8,629 |
851 |
|
Tax Liabilities |
|
286 |
- |
|
Lease liabilities |
|
1,398 |
1,112 |
|
|
|
---------- |
---------- |
|
|
|
19,877 |
11,598 |
|
|
|
---------- |
---------- |
|
Non-current liabilities |
|
|
|
|
Deferred income |
|
194 |
247 |
|
Lease liabilities |
|
4,245 |
2,573 |
|
|
|
---------- |
---------- |
|
|
|
4,439 |
2,820 |
|
|
|
---------- |
---------- |
|
|
|
|
|
|
Total liabilities |
|
24,316 |
14,418 |
|
|
|
---------- |
---------- |
|
|
|
---------- |
---------- |
|
Net assets |
|
40,880 |
35,376 |
|
|
|
---------- |
---------- |
|
Equity |
|
|
|
|
Share capital |
8 |
10,801 |
10,800 |
|
Share premium |
9 |
11,458 |
11,354 |
|
Share warrant reserve |
|
6,109 |
6,109 |
|
Translation reserve |
|
(671) |
(676) |
|
Retained earnings |
|
13,183 |
7,789 |
|
|
|
---------- |
---------- |
|
Total equity |
|
40,880 |
35,376 |
|
|
|
====== |
====== |
The total equity is attributable to the equity shareholders of the parent company Filtronic plc.
Company number 2891064.
Nat Edington
Chief Executive Officer
Consolidated Statement of Changes in Equity
for the year ended 31 May 2026
|
|
Share capital |
Share premium |
Share warrant reserve |
Translation reserve |
Retained earnings |
Total equity |
|
|
£000 |
£000 |
£000 |
£000 |
£000 |
£000 |
|
Balance at 1 June 2024 |
10,798 |
11,213 |
2,605 |
(522) |
(6,674) |
17,420 |
|
Profit for the year |
- |
- |
- |
- |
14,049 |
14,049 |
|
Currency translation movement arising on consolidation |
- |
- |
- |
(154) |
- |
(154) |
|
Share-based payments |
- |
- |
- |
- |
414 |
414 |
|
New shares issued |
2 |
141 |
- |
- |
- |
143 |
|
Share warrants issued (note 10) |
- |
- |
3,504 |
- |
- |
3,504 |
|
|
---------- |
---------- |
---------- |
---------- |
---------- |
---------- |
|
Balance at 31 May 2025 |
10,800
|
11,354 |
6,109 |
(676) |
7,789 |
35,376 |
|
|
|
|
|
|
|
|
|
Profit for the year |
- |
- |
- |
- |
4,557 |
4,557 |
|
Currency translation movement arising on consolidation |
- |
- |
- |
5 |
- |
5 |
|
Share-based payments |
- |
- |
- |
- |
837 |
837 |
|
New shares issued |
1 |
104 |
- |
- |
- |
105 |
|
|
|
|
|
|
|
|
|
|
---------- |
---------- |
---------- |
---------- |
---------- |
---------- |
|
Balance at 31 May 2026 |
10,801 |
11,458 |
6,109 |
(671) |
13,183 |
40,880 |
|
|
====== |
====== |
====== |
====== |
====== |
====== |
|
|
|
|
|
|
|
|
Consolidated Cash Flow Statement
for the year ended 31 May 2026
|
|
|
2026 |
2025 |
|
|
|
£000 |
£000 |
|
Cash flows from operating activities |
|
|
|
|
Operating profit |
|
3,971 |
13,442 |
|
Share warrant charge |
|
3,504 |
1,303 |
|
Share-based payments |
|
837 |
414 |
|
Depreciation of property, plant and equipment and right of use assets |
|
2,359 |
1,315 |
|
Amortisation of intangible assets |
|
586 |
537 |
|
Movement in inventories |
|
69 |
(797) |
|
Movement in trade and other receivables |
|
(7,208) |
(5,671) |
|
Movement in trade and other payables |
|
(1,437) |
3,762 |
|
Movement in provisions |
|
1,375 |
24 |
|
Change in deferred income |
|
7,724 |
(437) |
|
Tax paid |
|
27 |
(49) |
|
|
|
---------- |
---------- |
|
Net cash generated from operating activities |
|
11,807 |
13,843 |
|
|
|
---------- |
---------- |
|
Cash flows from investing activities |
|
|
|
|
Capitalisation of development costs |
|
(2,303) |
(1,496) |
|
Acquisition of other intangible assets |
|
(226) |
(277) |
|
Acquisition of property, plant and equipment |
|
(10,312) |
(3,835) |
|
Acquisition of right of use assets |
|
- |
(177) |
|
Interest received |
|
275 |
163 |
|
|
|
---------- |
---------- |
|
Net cash used in investing activities |
|
(12,566) |
(5,622) |
|
|
|
---------- |
---------- |
|
Cash flows from financing activities |
|
|
|
|
Interest paid |
|
(476) |
(268) |
|
Proceeds from financing agreements |
|
718 |
137 |
|
Exercise of employee share options |
|
105 |
143 |
|
Repayment of principle element of lease liabilities |
|
(1,196) |
(915) |
|
|
|
---------- |
---------- |
|
Net cash used in financing activities |
|
(849) |
(903) |
|
|
|
---------- |
---------- |
|
Movement in cash and cash equivalents |
|
(1,608) |
7,318 |
|
Currency exchange movement |
|
19 |
(39) |
|
Opening cash and cash equivalents |
|
14,494 |
7,215 |
|
|
|
---------- |
---------- |
|
Closing cash and cash equivalents |
|
12,905 |
14,494 |
|
|
|
====== |
====== |
|
|
|
|
|
|
|
|
|
|
|
|
|
|
|
|
|
|
|
|
|
|
|
|
|
|
|
|
|
|
Notes to the Preliminary Financial Information
for the year ended 31 May 2026
1 Basis of Preparation
These preliminary results have been prepared on the basis of the accounting policies which are to be set out in Filtronic plc's Annual Report and financial statements for the year ended 31 May 2026.
Whilst the information included in this preliminary announcement has been prepared on the basis of International Accounting Standards in conformity of the requirements of the Companies Act 2006 as applicable to companies reporting under those standards, this announcement does not itself contain sufficient information to comply with IFRSs. The Company expects to publish full financial statements within two months of this announcement.
The financial information set out above does not constitute the Company's statutory accounts for the years ended 31 May 2026 or 31 May 2025. The financial information for 2025 is derived from the statutory accounts for 2025 which have been delivered to the registrar of companies. The auditor has reported on the 2026 accounts; their report was:
(i) unqualified
(ii) did not include a reference to any matters to which the auditor drew attention by way of emphasis without qualifying their report and
(iii) did not contain a statement under section 498 (2) or (3) of the Companies Act 2006.
The statutory accounts for FY2026 were finalised on the basis of the financial information presented by the directors in this preliminary announcement and will be delivered to the registrar of companies in due course.
Going Concern
In accordance with corporate governance requirements and the statement of directors' responsibilities, and as disclosed in the Directors' Report, the directors have undertaken a review of forecasts and the Group's cash requirements to consider whether it is appropriate that the Group continues to adopt the going concern assumption.
At 31 May 2026, the Group had cash at bank of £12.9m and access to an undrawn revolving credit facility of £10.0m.
The Board recognises the uncertain economic and political environment that the world faces and has reviewed the business outlook to reflect this uncertainty. Cash flow forecasts have been prepared to model various scenarios over a three-year period based on the Group's financial and trading position, principal risks and uncertainties and strategic plans.
A downside scenario was modelled, to stress-test the business, where programme curtailment and/or delays may adversely affect forward-looking demand to levels lower than those initially modelled in the base case scenario including reduced demand from a major customer.
A severe but plausible scenario was also modelled that took the downside scenario and modelled further programme delays.
The scenarios modelled including the severe but plausible model, demonstrate the Group has adequate cash for the next twelve months from the date of the approval accounts.
New Accounting Standards
There are a number of new standards, including, amendments to standards and interpretations that are effective for financial statements after this reporting period, but the Group has not adopted them early. None of these are expected to have a material impact on the results or financial position of the Group.
Notes to the Preliminary Financial Information
for the year ended 31 May 2026
2 Segmental analysis
IFRS 8 requires consideration of the identity of the chief operating decision maker ('CODM') within the Group. In line with the Group's internal reporting framework and management structure, the key strategic and operating decisions are made by the Board who reviews internal monthly management reports, budget and forecast information as part of this. Accordingly, the Board is deemed to be the CODM.
The CODM has identified one operating segment within the Group as defined under IFRS 8. In turn, this is the only reportable segment of the Group as the entities in the Group have similar products and services, production processes and economic characteristics. Therefore, there is no allocation of operating expenses, profit measures or assets and liabilities to specific commercial markets.
Accordingly, the CODM assesses the performance of the operating segment on financial information which is measured and presented in a manner consistent with those in the financial statements by reference to Group results against budget.
The Group profit measures are adjusted operating profit and adjusted EBITDA, both disclosed on the face of the consolidated income statement. No differences exist between the basis of preparation of the performance measures used by management and the figures in the Group financial statements.
The Group has two customers representing individually over 10% of revenue each and in aggregate 78% of revenue. This is split as follows:
• Customer A - 68% (2025: 83%)
• Customer B - 10% (2025: 6%)
|
Revenue by destination
|
Total |
|
|
|
2026 |
2025 |
|
|
£000 |
£000 |
|
|
|
|
|
United Kingdom |
6,718 |
3,946 |
|
Europe |
2,821 |
1,205 |
|
Americas |
45,865 |
51,163 |
|
Rest of the World |
125 |
4 |
|
|
---------- |
---------- |
|
|
55,529 |
56,318 |
|
|
====== |
====== |
|
Split of non-current assets by location
|
Total |
||
|
|
2026 |
2025 |
|
|
|
£000 |
£000 |
|
|
United Kingdom |
27,282 |
15,004 |
|
|
Americas |
407 |
613 |
|
|
|
---------- |
---------- |
|
|
|
27,689 |
15,617 |
|
|
|
====== |
====== |
|
Non-current assets relate to property, plant and equipment, right of use assets, goodwill and other intangible assets and deferred tax.
Notes to the Preliminary Financial Information
for the year ended 31 May 2026
3 Finance costs
|
|
|
Year |
Year |
|
|
|
|
Ended |
Ended |
|
|
|
|
31 May |
31 May |
|
|
|
|
2026 |
2025 |
|
|
|
|
£000 |
£000 |
|
|
|
|
|
|
|
|
Interest expense for lease agreements |
|
476 |
268 |
|
|
Revaluation of foreign currency denominated intercompany balance |
|
10 |
- |
|
|
|
|
---------- |
---------- |
|
|
|
|
486 |
268 |
|
|
|
|
====== |
====== |
|
4 Finance income
|
|
|
Year |
Year |
|
|
|
|
Ended |
Ended |
|
|
|
|
31 May |
31 May |
|
|
|
|
2026 |
2025 |
|
|
|
|
£000 |
£000 |
|
|
|
|
|
|
|
|
Revaluation of foreign currency denominated intercompany balance |
|
- |
50 |
|
|
Interest receipt on treasury deposits |
|
275 |
163 |
|
|
|
|
---------- |
---------- |
|
|
|
|
275 |
213 |
|
|
|
|
====== |
====== |
|
5 Earnings per share
Basic earnings per share is calculated by dividing the profit attributable to the equity holders of the Company by the weighted average number of ordinary shares issued during the year.
Diluted earnings per share is calculated by adjusting basic earnings per share for the potential dilution from share options and share warrants. For the purposes of the diluted earnings per share calculation, it is assumed that all performance conditions attached to the share option schemes have been met as of the reporting date.
The weighted average number of shares in issue during the year and the resulting earnings per share calculations are as follows:
|
|
2026 |
2025 |
|
|
£000 |
£000 |
|
|
|
|
|
Profit for the year |
4,557 |
14,049 |
|
|
====== |
====== |
|
|
|
|
|
|
'000 |
'000 |
|
Basic weighted average number of shares |
219,797 |
218,854 |
|
Dilution effect of share options and share warrants |
36,603 |
13,389 |
|
|
---------- |
---------- |
|
Diluted weighted average number of shares |
256,400 |
232,243 |
|
|
---------- |
---------- |
|
Basic earnings per share |
2.07p |
6.42p |
|
Diluted earnings per share |
1.78p |
6.05p |
|
|
====== |
====== |
Notes to the Preliminary Financial Information
for the year ended 31 May 2026
6 Taxation
The reconciliation of the effective tax rate is as follows:
|
|
|
2026 |
|
2025 |
|
|
|
£000 |
|
£000 |
|
|
|
|
|
|
|
Profit before taxation |
|
3,760 |
|
13,387 |
|
|
|
====== |
|
====== |
|
|
|
|
|
|
|
|
|
2026 |
|
2026 |
|
|
|
£000 |
|
£000 |
|
|
|
|
|
|
|
Profit before taxation multiplied by the average standard rate of corporation tax in the UK - 25% (2025: 25%) |
|
940 |
|
3,347 |
|
Disallowable items |
|
798 |
|
838 |
|
Deferred tax asset not recognised |
|
148 |
|
- |
|
Enhanced R&D tax credit |
|
- |
|
(360) |
|
Foreign tax not at UK rate |
|
6 |
|
13 |
|
Group relief from previously unrecognised deferred tax assets |
|
- |
|
(144) |
|
Recognition of deferred tax asset |
|
- |
|
(707) |
|
Recognition of previously unrecognised deferred tax assets |
|
(2,689) |
|
(3,649) |
|
|
|
---------- |
|
---------- |
|
Taxation credit |
|
(797) |
|
(662) |
|
|
|
====== |
|
====== |
The main rate of UK corporation tax was 25% for companies with profit above £250,000. The US federal corporate rate is 21%.
The deferred tax assets recognised in the year have been calculated at the rates expected to be in existence in the period of reversal.
7 Contract Assets
Contract assets relate to the share warrants issued to Space X. Full details of the share warrants can be found in note 10.
|
|
|
Year |
Year |
|
|
|
|
|
Ended |
Ended |
|
|
|
|
|
31 May |
31 May |
|
|
|
|
|
2026 |
2025 |
|
|
|
|
|
£000 |
£000 |
|
|
|
|
|
|
|
|
|
|
Opening contract assets |
|
4,806 |
2,605 |
|
|
|
New contract assets generated |
|
- |
3,504 |
|
|
|
Amortised to revenue |
|
(3,504) |
(1,303) |
|
|
|
|
|
---------- |
---------- |
|
|
|
|
|
1,302 |
4,806 |
|
|
|
|
|
====== |
====== |
|
|
Notes to the Preliminary Financial Information
for the year ended 31 May 2026
8 Share Capital
|
|
Deferred shares of 10p each |
Ordinary shares of 0.1p each issued and fully paid |
|
|
|
Number '000 |
Number '000 |
£000 |
|
|
|
|
|
|
At 31 May 2024 |
106,877 |
217,121 |
10,798 |
|
Exercise of share options |
- |
1,881 |
2 |
|
|
------------- |
------------ |
----------- |
|
At 31 May 2025 |
106,877 |
219,002 |
10,800 |
|
Exercise of share options |
- |
940 |
1 |
|
|
------------- |
------------ |
----------- |
|
At 31 May 2026 |
106,877 |
219,942 |
10,801 |
|
|
======== |
======== |
======= |
All shares are allotted, called up and fully paid. Holders of the ordinary shares are entitled to receive dividends when declared and are entitled to one vote per share at meetings of the Company.
The deferred shares have no rights to vote or receive dividends.
9 Share Premium
|
|
|
£000 |
|
|
|
|
|
|
|
At 31 May 2024 |
|
11,213 |
|
|
Exercise of share options |
|
141 |
|
|
|
|
----------- |
|
|
At 31 May 2025 |
|
11,354 |
|
|
Exercise of share options |
|
104 |
|
|
|
|
----------- |
|
|
At 31 May 2026 |
|
11,458 |
|
|
|
|
======= |
|
10 Share Warrant Reserve
Tranche 1 and 2
On 24 April 2025, the Group entered into a share warrant arrangement with SpaceX in conjunction with a
commercial agreement and strategic partnership. This related to the supply of E-band Solid State Power Amplifiers ("SSPAs") and new technology being developed for SpaceX for use in their Starlink constellation.
The warrant agreement grants SpaceX the right to acquire up to 21,712,109 shares of the Company (equivalent to 10% of the Company's total share capital at the inception of the warrant agreement). The exercise price of vested warrants is 33.0p per share, based on the closing mid-market price at 23 April 2025, which is the date prior to signing the warrant agreement. The directors assessed the warrants and made a judgement that the warrants should be treated as equity instruments as defined by IAS 32. This is because the warrants have a fixed consideration at 33.0p per share for a fixed number of units to exercise.
Notes to the Preliminary Financial Information
for the year ended 31 May 2026
10 Share Warrant Reserve (continued)
The warrants have been recognised in the financial statements based on the value at the date of signing of
the agreement. An initial entry has been made in contract assets measured at fair value, but not subsequently remeasured, with the corresponding entry to equity.
The initial fair value of the warrants at inception was £2,605,453, based on a fair value per warrant of £0.11 and the total number of warrants expected to vest over the 5-year vesting period. The directors have judged all of the warrants will vest, otherwise SpaceX and Filtronic would not have entered into the agreement. The warrants represent non-cash consideration payable to a customer under IFRS 15. Therefore, the contract asset, which effectively represents a deferred volume rebate, is amortised to revenue based on when the units are supplied to SpaceX. In the year, there was no charge to revenue in the period relating to this tranche.
The fair value of the warrants was determined using the Black-Scholes Model valuation method using a number of variables that require judgement including share price volatility, discount to the bid price, the risk-free rate and the expected life of the warrants. There are a number of variables that require judgement within this model including the risk-free rate, share price volatility, the vesting period and a bid price
discount.
Tranche 3
On 19 March 2026, the Company entered into a second warrant arrangement with SpaceX expanding the
Original strategic partnership entered into on 23 April 2025 to secure an increased allocation of business for the Group. The vesting of these warrants is dependent on certain performance conditions relating to the procurement of E-band SSPAs to support the Starlink constellation.
The warrant agreement grants SpaceX the right to acquire up to 10,949,079 at 92.8p per share. The accounting treatment of the warrants has been judged by management and has been determined to be treated the same as tranche 1 and 2. An initial entry has been made in contract assets measured at fair value, but not subsequently remeasured, with the corresponding entry to equity.
The initial fair value of the warrants at inception was £3,504,000, based on a fair value per warrant of £0.93 and the total number of warrants expected to vest over the 5-year vesting period. The directors have judged all of the warrants will vest, otherwise SpaceX and Filtronic would not have entered into the agreement. The warrants represent non-cash consideration payable to a customer under IFRS 15. Therefore, the contract asset, which effectively represents a deferred volume rebate, is amortised to revenue based on when the units are supplied to SpaceX. There was a charge to revenue for tranche 3 in the year of £3,504,000.
The fair value of the warrants was determined using the Black-Scholes Model valuation method using a number of variables that require judgement including share price volatility, discount to the bid price, the risk-free rate and the expected life of the warrants. There are a number of variables that require judgement within this model including the risk-free rate, share price volatility, the vesting period and a bid price discount.
11 Dividends
The directors are not proposing to pay a dividend for the year ended 31 May 2026 (2025: £nil).
Notes to the Preliminary Financial Information
for the year ended 31 May 2026
12 Analysis of net cash
|
|
31 May 2025 |
Cash Flow |
Other movements |
31 May 2026 |
|
|
£000 |
£000 |
£000 |
£000 |
|
|
|
|
|
|
|
Cash and cash equivalents |
14,494 |
(1,580) |
(9) |
12,905 |
|
Lease liabilities - plant and equipment |
(2,180) |
835 |
(720) |
(2,065) |
|
|
--------- |
--------- |
--------- |
--------- |
|
Net cash when including all debt except property leases |
12,314 |
(745) |
(729) |
10,840 |
|
Lease liabilities - property leases |
(1,505) |
360 |
(2,433) |
(3,578) |
|
|
--------- |
--------- |
--------- |
--------- |
|
Net cash |
10,809 |
(385) |
(3,162) |
7,262 |
|
|
====== |
====== |
====== |
====== |
Reconciliation of cash flow to movement in net cash
|
|
|
|
|
|
|
||||||
|
|
|
|
2026 |
2025 |
|
||||||
|
|
|
|
£000 |
£000 |
|
||||||
|
|
|
|
|
|
|
||||||
|
Movement in cash and cash equivalents |
|
|
(1,580) |
7,318 |
|
||||||
|
Movement in lease liabilities - plant and machinery |
|
|
115 |
(190) |
|
||||||
|
Movement in lease liabilities - property lease |
|
|
(2,073) |
(478) |
|
||||||
|
Effect of exchange rate fluctuations |
|
|
(9) |
(39) |
|
||||||
|
|
|
|
---------- |
---------- |
|
||||||
|
Movement in net cash |
|
|
(3,547) |
6,611 |
|
||||||
|
Net opening cash |
|
|
10,809 |
4,198 |
|
||||||
|
|
|
|
---------- |
---------- |
|
||||||
|
Net closing cash |
|
|
7,262 |
10,809 |
|
||||||
|
|
|
|
====== |
====== |
|
||||||
|
|
|
|
|
|
|
||||||
Cash at bank earns interest at floating rates based on daily bank deposit rates. There are no restrictions on the availability of the cash and cash equivalents at 31 May 2026 (2025: £nil).
IFRS 16 requires the recognition of property leases on the balance sheet which is classified as a debt item.
RNS may use your IP address to confirm compliance with the terms and conditions, to analyse how you engage with the information contained in this communication, and to share such analysis on an anonymised basis with others as part of our commercial services. For further information about how RNS and the London Stock Exchange use the personal data you provide us, please see our Privacy Policy.

Latest directors dealings
- 56 minutes ago Croma Security Solutions Group
- 1 hour ago Taylor Maritime Investments Limited NPV
- 2 hours ago Eurocell
- 2 hours ago Stelrad Group
- 2 hours ago Jardine Matheson Holdings Ltd (Singapore Reg)