
Interim Results
Summary by AI BETAClose X

Elixirr International plc
(“Elixirr”, the “Company” or the “Group")
INTERIM RESULTS FOR THE SIX MONTHS ENDED 30 JUNE 2026
Record first half with continued profitable growth and expanding AI opportunity
Elixirr International plc (ELIX.L), an established, global award-winning, challenger consultancy, is pleased to report its unaudited interim results for the six months ended 30 June 2026 (H1 26). Comparative unaudited results are presented for the six months ended 30 June 2025 (H1 25).
Financial Highlights
- 25% increase in revenue compared to H1 25, with revenue totalling £89.0m (H1 25: £71.4m), and 5% organic growth at constant currency
- 29% increase in adjusted EBITDA [1] compared to H1 25, totalling £27.6m (H1 25: £21.5m), with an increased adjusted EBITDA margin of 31.0% (H1 25: 30.0%)
- 25% increase in adjusted profit before tax (‘PBT’) [1], totalling £25.1m (H1 25: £20.1m)
- 18% increase in adjusted diluted earnings per share (‘EPS’) [1] compared to H1 25, totalling 34.2p (H1 25: 29.0p)
Key highlights include:
|
|
H1 26 |
H1 25 |
Change |
|
Revenue |
£89.0m |
£71.4m |
+25% |
|
Gross Profit |
£30.6m |
£24.3m |
+26% |
|
Adjusted EBITDA [1] |
£27.6m |
£21.5m |
+29% |
|
Adjusted EBITDA margin |
31.0% |
30.0% |
+1pp |
|
Adjusted profit before tax [1] |
£25.1m |
£20.1m |
+25% |
|
Adjusted diluted earnings per share [1] |
34.2p |
29.0p |
+18% |
[1] In order to provide better clarity to the underlying performance of the Group, Elixirr uses adjusted EBITDA, adjusted PBT and adjusted EPS as alternative performance measures (‘APMs’). Please refer to note 2 of the Group’s interim condensed consolidated financial statements.
Operating Highlights
Focus on higher value projects for clients delivering higher margin revenue
Continued strong growth in AI-related work, with AI-related revenue increasing by 185% to £8.1m in H1 26, compared with £2.8m in H1 25.
Deepened our largest client relationships, with 35 clients generating more than £1m of revenue, up from 31 in H1 25. Of these, 24 generated more than £2m, up from 16 in H1 25, demonstrating our ability to grow major accounts. [2]
Cross-sell revenue increased 27% to £19m (H1 25: £15m), as we unlock more value from the breadth of capabilities, expertise and client relationships across the Group.
We continued to deliver against all four pillars of our growth strategy – stretching existing Partners, hiring Partners, promoting Partners and acquiring complementary businesses:
o Significantly expanded our Partner team to increase senior capacity and support future growth, whilst maintaining revenue per Partner in line with FY 25.
o External Partner hires added expertise across corporate strategy and growth, financial services, data and AI.
o Two Elixirr Digital Principals were promoted to Partner, adding further leadership in AI, data and technology.
o The acquisition of Kvadrant Consulting established Elixirr’s first presence in the Nordics and expanded our commercial transformation, transaction services and Private Equity offering.
Further contributed to the communities in which we operate, including launching the inaugural South African Prospects Accelerator, supporting high-potential students from underserved communities through a programme focused on mathematics, physics, data and technology, alongside entrepreneurship and real-world business skills.
Elixirr received further global recognition, including being named as one of the UK’s Leading Management Consultants by the Financial Times and, shortly after the period, among Forbes' World's Best Management Consulting Firms and America's Best Management Consulting Firms – recognitions based on feedback from clients and industry peers.
We strengthened our Board with the appointment of Bill Michael as an Independent Non-Executive Director, bringing extensive professional services, governance and leadership experience to support Elixirr’s continued growth.
[2] On a 12-month trailing basis.
Commenting on the results, Stephen Newton, Founder and Chief Executive Officer, said:
“We have had another strong first half, with revenue up 25% and adjusted EBITDA up 29%, demonstrating continued profitable growth as we scale and invest in the business for our next phase of growth.
“AI is changing what our clients need from us. Businesses are moving quickly from asking what AI can do to working out how they can use it to transform the way they operate and grow. We have built a powerful combination of consulting, technology, data and AI expertise to help them do that, with AI-related revenue increasing by 185% in the first half.
“The scale of the opportunity ahead is significant. Industry research estimates that agentic AI alone could create up to $200 billion of new demand for technology services over the next five years. We have spent the last six years deliberately building our consulting, AI, data and technology capabilities to benefit from this shift.
“At the same time, we are investing in our Partner team, integrating our recent acquisitions and getting more value from the capabilities, clients and geographies they have added. We have an ambitious team and a proven growth model, and we are making the investments now that we believe will create a strong platform for the years ahead.”
Enquiries:
For enquiries, please refer to our Investor Contacts page:
https://www.elixirr.com/investors/investor-contacts
Elixirr International plc +44 (0)20 7220 5410
Stephen Newton, Chief Executive Officer
Graham Busby, Deputy Chief Executive Officer
Nick Willott, Chief Financial Officer
investor-relations@elixirr.com
Cavendish Capital Markets Ltd (Joint Broker) +44 (0)20 7220 0500
Stephen Keys, Callum Davidson (Corporate Finance)
Sunila de Silva (ECM)
Canaccord Genuity Limited (Joint Broker)
Alex Aylen (Head of Equities) +44 (0)20 7523 8000
Aimee Kerslake (Sales)
Stuart Andrews (Corporate Finance)
Notes to editors
Elixirr is an award-winning global consulting firm working with clients across a diverse range of industries, markets and geographies. Founded in 2009, the firm set out to be the 'challenger consultancy' and do things differently than the large corporate consultancies dominating the industry: working openly and collaboratively with clients from start to finish, delivering outcomes based on innovative thinking, not methodology, and treating each client's business like their own. Elixirr was quoted on the AIM market of the London Stock Exchange in 2020 and listed on the Main Market of the London Stock Exchange in July 2025. In addition to strong organic growth, Elixirr has acquired nine boutique firms – Den Creative, Coast Digital, The Retearn Group, iOLAP, Responsum, Insigniam, Hypothesis, TRC Advisory and Kvadrant Consulting – to grow the Group's capabilities, diversify the business, expand into new geographies and access new clients.
This announcement contains inside information for the purposes of Article 7 of the Market Abuse Regulation (EU) 596/2014 as it forms part of UK domestic law by virtue of the European Union (Withdrawal) Act 2018 (‘MAR’), and is disclosed in accordance with the company's obligations under Article 17 of MAR.
Disclaimer
This announcement contains certain statements that are, or may be, forward looking statements with respect to the financial condition, results of operations, business achievements and/or investment strategy of the Company. Such forward looking statements are based on the Board’s expectations of external conditions and events, current business strategy, plans and the other objectives of management for future operations, and estimates and projections of the Company’s financial performance. Though the Board believes these expectations to be reasonable at the date of this document they may prove to be erroneous. Forward looking statements involve known and unknown risks, uncertainties and other factors which may cause the actual results, achievements or performance of the Group, or the industry in which the Group operates, to be materially different from any future results, achievements or performance expressed or implied by such forward looking statements.
INTERIM MANAGEMENT REPORT
Financial Performance Review
|
|
H1 26 |
H1 25 |
Change |
|
Revenue |
£89.0m |
£71.4m |
+25% |
|
Gross profit |
£30.6m |
£24.3m |
+26% |
|
Adjusted EBITDA [1] |
£27.6m |
£21.5m |
+29% |
|
Adjusted EBITDA margin |
31.0% |
30.0% |
+1pp |
|
Adjusted profit before tax [1] |
£25.1m |
£20.1m |
+25% |
|
Adjusted diluted EPS [1] |
34.2p |
29.0p |
+18% |
|
Net debt |
(£56.5m) |
(£6.8m) |
N/A |
|
Free cash flow |
£1.8m |
£7.9m |
-78% |
[1] In order to provide better clarity to the underlying performance of the Group, Elixirr uses adjusted EBITDA, adjusted PBT and adjusted EPS as alternative performance measures (‘APMs’). Please refer to note 2 of the Group’s interim condensed consolidated financial statements.
The Board is pleased to report that the Group delivered another strong performance in H1 26, with revenue and adjusted EBITDA performance continuing our track record of profitable growth. Demand remained strong across commercial transformation, technology and AI services, supported by targeted Partner hires and promotions that further strengthen our capabilities.
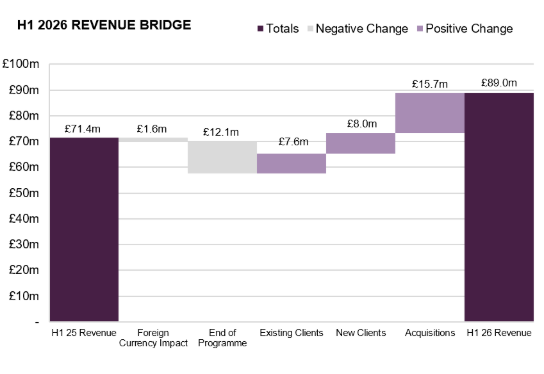
During H1 26, Group revenue increased to £89.0m. This represents 25% absolute revenue growth compared to H1 25, despite a 4% weakening in the USD/GBP exchange rate compared to the comparable period. Constant currency organic revenue growth was 5%. Growth was driven by the expansion of existing client relationships alongside new client wins, reflecting the strength of our integrated service offering and our ability to help organisations navigate increasingly complex commercial, technology and AI transformation.
The following revenue bridge displays the elements of the growth in revenue from £71.4m in H1 25 to £89.0m in H1 26.
The Group’s revenue growth was supported by continued strong profitability. Group gross profit increased by 26% to £30.6m (H1 25: £24.3m) and was delivered at a 34% gross profit margin (H1 25: 34%). Group adjusted EBITDA increased by 29% compared to H1 25, totalling £27.6m (H1 25: £21.5m), with adjusted EBITDA margin improving to 31% (H1 25: 30%). This continued margin progression reflects disciplined management of the Group’s cost base, with administrative expenses included in adjusted EBITDA increasing by only 5% during the period.
Adjusted EBITDA growth resulted in a 25% increase in adjusted profit before tax to £25.1m (H1 25: £20.1m). This growth was slightly lower than adjusted EBITDA growth primarily due to higher finance costs associated with the Group’s debt facilities that have funded inorganic growth. Adjusted diluted earnings per share increased by 18% to 34.2p (H1 25: 29.0p), reflecting strong growth in adjusted profit after tax, partially offset by an increase in the weighted average number of Ordinary Shares in issue following the acquisitions of TRC and Kvadrant.
Net debt at 30 June 2026 was £56.5m, comprising cash of £2.5m and borrowings of £59.0m across the Group’s revolving credit facility and term loan. The increase in net debt principally reflects capital deployed to support the Group’s acquisition strategy, including the acquisition of Kvadrant and earn out payments relating to TRC’s FY 25 performance.
Free cash flow was £1.8m (H1 25: £7.9m). There are always seasonal differences in free cash flow between H1 and H2 given that June is typically a higher revenue month than December, increasing trade debtors, and annual bonuses for the previous financial year are paid in H1, reducing accruals. The lower free cash flow in H1 26 compared to H1 25 also reflects the impact of legacy debtor terms in acquired businesses and the timing of tax payments. We continue to benefit from strong conversion of trade debtor balances given the blue-chip nature of our client base.
Operational Review
During the first half of FY 26, Elixirr continued to grow its existing business while integrating recent acquisitions, broadening the capabilities, client relationships and geographies available across the Group. Highlights include:
· Acquired Kvadrant Consulting, establishing Elixirr's presence in the Nordics and strengthening the Group's commercial transformation, transaction services and Private Equity offering.
· AI-related work continued to deepen across the client base, with AI-related revenue increasing by 185% to £8.1m in H1 26, compared with £2.8m in H1 25, reflecting larger client engagements and an increasing focus on embedding AI into operations and driving measurable business value.
· Generated £19m of cross-sell revenue, up 27% from H1 25, as we increasingly bring together capabilities and expertise from across the Group to serve broader client needs.
· Deepened relationships with our largest clients, with 35 clients generating more than £1m of revenue in H1 26, up from 31 in H1 25, and 24 generating more than £2m in H1 26, up from 16 in H1 25. [2]
· Increased senior capacity while maintaining revenue per Partner in line with the FY 25 level, with new hires and promotions adding expertise across AI and data, financial services, corporate strategy and growth.
· Held the Group's Executive Summit in Philadelphia and Challenger Roots event in South Africa, bringing together senior leaders to explore how AI is reshaping leadership, organisations and competitive advantage.
· Launched the inaugural South African Prospects Accelerator, supporting high-potential students from underserved communities through an intensive programme focused on STEM, entrepreneurship and real- world business skills.
· Further strengthened the Board through the appointment of Bill Michael as an Independent Non-Executive Director, bringing extensive international leadership, governance and professional services experience to the Group.
· Post-period, launched Execution Edge as Elixirr’s sixth core capability, focused on helping leadership teams turn strategy into measurable outcomes by strengthening execution and accountability.In H1 26 we helped our clients tackle a variety of challenges, including:
· Supported a multinational client in launching a new AI-native business in under six months, including the build of a new technology platform that will have more than 95% automation and is expected to reduce cost to serve by over 60%.
· Launched a quality breakthrough programme for a US automotive components manufacturer across two plants, generating 400+ solutions and putting in place a programme to deliver $5m+ in cost savings.
· Worked with a healthcare client that had deployed generative AI to identify more than 300 potential AI use cases, representing approximately $7 million of annualised effort, and developed a roadmap to prioritise and embed the highest-value opportunities across the business.
Elixirr has been acknowledged through multiple awards and accolades, including:
· Named by the Financial Times as one of the UK's Leading Management Consultants 2026 for our work across Data, Finance, Risk & Compliance, Innovation, and Growth & New Business Models
· Recognised by Consultancy.uk as a Top Consulting Firm in the UK, achieving Platinum and Gold rankings across 11 service areas, including AI & Gen AI, Data Science, Strategy, Management and Innovation
· Included in the 2026 Global Outsourcing 100®, recognising the world's leading outsourcing service providers and advisors
· Shortly after the period, recognised by Forbes as one of the World’s Best Management Consulting Firms and America’s Best Management Consulting Firms for 2026
Artificial Intelligence
AI continues to represent a significant growth opportunity for Elixirr. While the technology is automating elements of traditional consulting delivery, it is also creating new demand as organisations move from experimentation towards scaled deployment. Industry research estimates that agentic AI could create up to $200 billion of incremental technology-services demand over the next five years, with technology consulting expected to benefit as organisations require support to implement AI at scale.
This opportunity is increasingly translating into demand across the Group, with AI-related revenue increasing by 185% compared with H1 25. As adoption scales, client demand is extending beyond individual AI tools and use cases towards broader transformation programmes.
Scaled deployment requires organisations to identify where AI can create value, redesign workflows and operating models, integrate new technology and data, and manage the governance and organisational change required to deploy it effectively. These areas align closely with Elixirr's end-to-end capabilities across strategy, technology, data and transformation. The Group is therefore positioned to benefit as consulting value increasingly shifts towards higher-value strategy, transformation and implementation work.
Growth Strategy
Elixirr’s growth strategy remains focused on maximising the potential of existing Partners, promoting internal talent, attracting new Partners, and pursuing strategic acquisitions to enhance capability and market presence.
1. Stretching our existing Partners
As part of its organic growth strategy, Elixirr remains focused on maximising the performance of its Partner team while investing in additional senior capacity to support future growth. In H1 26, the Group significantly expanded its Partner team while maintaining revenue per Partner in line with the FY 25 level. This investment adds capacity and expertise in areas where client demand is growing, while supporting deeper client relationships and future growth.
2. Promoting Partners from within
In 2026, Elixirr announced the promotion of Adam Hofmann and Sam Alexander to Partner, adding further leadership across AI, data and technology. The Group also announced the promotion of Gavin Daniel to Partner, effective from 2027.
Adam brings over 15 years of experience at the intersection of business and artificial intelligence and co-leads Elixirr’s AI capability. He joined Elixirr following the acquisition of Responsum in 2023, the large language model and generative AI acceleration platform he co-founded. Since joining the Group, Adam has worked with global organisations to define and execute AI transformation strategies, build scalable operating models and deploy AI solutions that deliver measurable business impact.
Sam brings over 20 years of experience in technology consulting and engineering and joined Elixirr Digital in 2023 as a Principal. He specialises in data and analytics platforms, custom digital development and large-scale systems integration, and has played a key role in delivering complex client engagements. His promotion further strengthens Elixirr’s ability to help clients navigate increasingly complex technology landscapes and translate emerging technologies into tangible business outcomes.
Gavin has deep expertise across banking and financial market infrastructure firms spanning strategy, technology and large-scale transformation. He works with both fintechs and established financial institutions in Europe and Africa, helping them to set their direction and navigate across complex market and transformation challenges to unlock sustainable growth.
Of Elixirr’s current Partner team, thirteen have been promoted from the Principal grade. Growing our own talent is also key to our future success, and we have remained focused on developing Principal talent during the first half of the year with both hiring at this grade externally as well as promoting Managers into the Principal grade.
3. Hiring new Partners
We have progressed our third growth pillar with the appointment of new Partners during 2026.
Chris Bannocks has more than 30 years of experience at the forefront of data, analytics and AI, including as Group Chief Data, Analytics and AI Officer at ING, Danone and QBE. He adds significant expertise in enterprise data strategy, AI adoption and governance.
Hugh Aller has built a career spanning more than 25 years across global financial services, advising on and leading complex strategic and operational change. His experience includes roles at Scotiabank, Citigroup and Goldman Sachs, with particular expertise in strategy, operating model transformation and the integration of data and AI into core business models.
Tom Andrews joins with more than 25 years of experience shaping growth and transformation strategies across both consulting and industry. Having started his career at McKinsey & Company, he has since held senior leadership roles across the travel, technology and digital sectors, including at InterContinental Hotels Group, developing extensive expertise in corporate strategy, digital transformation and commercial growth.
Alongside these appointments, we are developing a strong pipeline of prospective Partner hires across our key strategic focus areas and geographies.
4. Acquiring new businesses
During H1 26, we continued to build on our acquisition strategy, bringing Kvadrant Consulting into the Group at the end of January. The acquisition established Elixirr’s first presence in the Nordics, while adding expertise in commercial transformation and transaction services and creating new opportunities across the European market, Private Equity and corporate advisory.
We have also been very pleased with the performance of TRC Advisory since its acquisition in September 2025, resulting in the business achieving its full FY 25 earnout. TRC has expanded our position in the US, bringing leading expertise in growth strategy, pricing and commercial effectiveness, alongside greater access to the industrials and manufacturing sectors.
The value of these acquisitions extends beyond the individual businesses themselves. By bringing together complementary expertise, client relationships and geographic reach, we can take more of Elixirr to their clients, introduce their expertise into our existing relationships and increasingly pursue larger opportunities together through integrated service offerings.
Acquiring high-quality businesses remains a key pillar of our growth strategy. Cross-sell revenue increased 27% to £19m during H1 26, demonstrating the opportunity created by combining businesses across the Group. We continue to assess a strong pipeline of potential acquisitions, with a disciplined focus on where we can add capability, sector expertise and geographic reach.
Post-period Events
Post-period, the Group launched Execution Edge, its sixth core capability, focused on helping leadership teams assure and accelerate the execution of their strategic priorities and turn strategy into measurable outcomes before value is lost.
Execution Edge brings together expertise from across the Group to address a challenge we increasingly see among clients: defining the right strategy is only part of the equation, with successful transformation dependent on an organisation’s ability to execute it effectively. The capability supports leadership teams in strengthening accountability, aligning their organisations behind strategic priorities and maintaining focus on the outcomes that will have the greatest impact on future business performance.
The launch reflects Elixirr’s ongoing approach to evolving its offering around the challenges facing clients and bringing together expertise from across the Group to address them. While we continue to invest significantly in our AI, technology and data capabilities, we believe the human elements of transformation – leadership, accountability and effective execution – remain equally critical to delivering sustainable business value.
Outlook
Our scalable business model supported by an increasingly diversified platform spanning capabilities, geographies and industry verticals provides multiple avenues for growth. This, combined with our focus on quality of earnings and higher margin work, gives the Board confidence that total adjusted EBITDA for FY 26 will be in line with market expectations and revenue will be broadly in line.
Gavin Patterson Stephen Newton
Chairman Chief Executive Officer
Principal Risks and Uncertainties
The Board has reviewed the Group’s principal and emerging risks in the context of its strategic objectives and developments during the period, together with the measures in place to manage or mitigate them.
The principal risks and uncertainties remain those set out on pages 52 to 56 of the FY 25 Annual Report. These relate to demand for the Group’s services; recruitment and retention of talented employees; M&A and integration; professional reputation, key client relationships and contractual terms; utilisation and profitability; and access to capital to fund inorganic expansion. The Board considers these to have the greatest potential impact on the Group and expects them to remain relevant for the remainder of the financial year.
The Group also monitors emerging areas of risk, including evolving ESG and disclosure requirements, AI-related delivery and quality, cybersecurity and talent pressures in emerging technology capabilities. These are tracked by management and reviewed through the Group’s risk management framework to assess whether they should be escalated or require changes to existing mitigations.
No new principal risks or material changes to the Group’s overall risk profile have been identified since the publication of the FY 25 Annual Report.
Directors’ Responsibility Statement
The Directors confirm, to the best of their knowledge, that the condensed consolidated set of financial statements has been prepared in accordance with International Accounting Standard 34 ‘Interim Financial Reporting’ as adopted by the United Kingdom and that the interim management report includes a fair review of the information required by:
- DTR 4.2.7R of the Disclosure Guidance and Transparency Rules, being an indication of important events that have occurred during the first six months of the financial year and their impact on the condensed set of financial statements, and a description of the principal risks and uncertainties for the remaining six months of the financial year; and
- DTR 4.2.8R of the Disclosure Guidance and Transparency Rules, being related party transactions that have taken place in the first six months of the current financial year and that have materially affected the financial position or the performance of the Group during that period; and any changes in the related party transactions described in the Annual Report 2025 that could do so.
By order of the Board
18 September 2026
Stephen Newton Graham Busby Nicholas Willott
Chief Executive Officer Deputy Chief Executive Officer Chief Financial Officer
Interim Condensed Consolidated Statement of Comprehensive Income
For the six months ended 30 June 2026
|
|
|
Six months ended 30 June 2026 Unaudited |
|
Six months ended 30 June 2025 Unaudited |
|
|
Note |
£’000s |
|
£’000s |
|
|
|
|
|
|
|
|
|
|
|
|
|
Revenue |
|
88,956 |
|
71,410 |
|
Cost of sales |
|
(58,362) |
|
(47,086) |
|
Gross profit |
|
30,594 |
|
24,324 |
|
|
|
|
|
|
|
Administrative expenses |
|
(10,101) |
|
(7,431) |
|
Operating profit before M&A and Main Market-related items |
|
20,493 |
|
16,893 |
|
|
|
|
|
|
|
Depreciation |
|
906 |
|
881 |
|
Amortisation of intangible assets |
|
3,575 |
|
1,496 |
|
Share-based payments |
14 |
2,604 |
|
2,188 |
|
Adjusted EBITDA |
|
27,578 |
|
21,458 |
|
|
|
|
|
|
|
M&A-related items |
4 |
(301) |
|
(161) |
|
Main Market listing costs |
4 |
- |
|
(795) |
|
Operating profit |
|
20,192 |
|
15,937 |
|
Net finance expense |
|
(2,228) |
|
(578) |
|
Profit before tax |
|
17,964 |
|
15,359 |
|
|
|
|
|
|
|
Taxation |
|
(5,625) |
|
(4,343) |
|
Profit for the period |
|
12,339 |
|
11,016 |
|
|
|
|
|
|
|
Exchange differences on translation of foreign operations |
|
1,877 |
|
(5,630) |
|
|
|
|
|
|
|
Total comprehensive income for the period |
|
14,216 |
|
5,386 |
|
|
|
|
|
|
|
Basic earnings per Ordinary Share (p) |
5 |
24.9 |
|
23.2 |
|
Diluted earnings per Ordinary Share (p) |
5 |
22.7 |
|
21.3 |
|
Adjusted basic earnings per Ordinary Share (p) |
5 |
37.5 |
|
31.7 |
|
Adjusted diluted earnings per Ordinary Share (p) |
5 |
34.2 |
|
29.0 |
All results relate to continuing operations.
The notes form part of these interim condensed consolidated financial statements.
Interim Condensed Consolidated Statement of Financial Position
As at 30 June 2026
|
|
|
As at 30 June 2026 Unaudited |
|
As at 31 December 2025 Audited |
|
As at 30 June 2025 Unaudited |
|
|
Note |
£’000s |
|
£’000s |
|
£’000s |
|
Assets |
|
|
|
|
|
|
|
Non-current assets |
|
|
|
|
|
|
|
Intangible assets |
6 |
211,096 |
|
197,319 |
|
121,176 |
|
Property, plant and equipment |
|
4,493 |
|
4,214 |
|
4,428 |
|
Other receivables |
8 |
3,690 |
|
3,701 |
|
3,013 |
|
Loans to shareholders |
8 |
9,510 |
|
8,566 |
|
9,093 |
|
Deferred tax asset |
|
3,733 |
|
4,704 |
|
4,177 |
|
Total non-current assets |
|
232,522 |
|
218,504 |
|
141,887 |
|
|
|
|
|
|
|
|
|
Current assets |
|
|
|
|
|
|
|
Trade and other receivables |
8 |
36,777 |
|
26,810 |
|
22,880 |
|
Corporation tax receivable |
|
1,153 |
|
716 |
|
- |
|
Cash and cash equivalents |
|
2,525 |
|
5,054 |
|
2,844 |
|
Total current assets |
|
40,455 |
|
32,580 |
|
25,724 |
|
|
|
|
|
|
|
|
|
Total assets |
|
272,977 |
|
251,084 |
|
167,611 |
|
|
|
|
|
|
|
|
|
Liabilities |
|
|
|
|
|
|
|
Current liabilities |
|
|
|
|
|
|
|
Trade and other payables |
9 |
29,203 |
|
30,316 |
|
26,641 |
|
Loans and borrowings |
11 |
7,621 |
|
10,589 |
|
1,129 |
|
Corporation tax payable |
|
- |
|
- |
|
108 |
|
Other creditors |
10 |
13,975 |
|
22,325 |
|
3,457 |
|
Total current liabilities |
|
50,799 |
|
63,230 |
|
31,335 |
|
|
|
|
|
|
|
|
|
Non-current liabilities |
|
|
|
|
|
|
|
Loans and borrowings |
11 |
55,930 |
|
22,933 |
|
13,024 |
|
Deferred tax liability |
|
1,218 |
|
666 |
|
788 |
|
Other non-current liabilities |
10 |
12,284 |
|
21,727 |
|
2,348 |
|
Total non-current liabilities |
|
69,432 |
|
45,326 |
|
16,160 |
|
|
|
|
|
|
|
|
|
Total liabilities |
|
120,231 |
|
108,556 |
|
47,495 |
|
|
|
|
|
|
|
|
|
Net assets |
|
152,746 |
|
142,528 |
|
120,116 |
|
|
|
|
|
|
|
|
|
Equity |
|
|
|
|
|
|
|
Share capital |
12 |
53 |
|
52 |
|
52 |
|
Share premium |
12 |
54,614 |
|
45,384 |
|
33,702 |
|
Capital redemption reserve |
|
2 |
|
2 |
|
2 |
|
EBT share reserve |
13 |
(4,650) |
|
(4,014) |
|
(9,641) |
|
Merger relief reserve |
12 |
46,870 |
|
46,870 |
|
46,870 |
|
Foreign currency translation reserve |
|
(1,033) |
|
(2,910) |
|
(4,176) |
|
Retained earnings |
|
56,890 |
|
57,145 |
|
53,307 |
|
Total shareholders' equity |
|
152,746 |
|
142,528 |
|
120,116 |
Interim Condensed Consolidated Statement of Changes in Equity
For the six months ended 30 June 2026
|
|
Share capital £’000s |
Share premium £’000s |
Capital redemption reserve £’000s |
EBT share reserve |
Merger relief reserve £’000s |
Foreign currency translation reserve £’000s |
Retained earnings £’000s |
Total £’000s |
|
|
|
|
|
|
|
|
|
|
|
As at 31 December 2024 and 01 January 2025 |
52 |
33,702 |
2 |
(2,897) |
46,870 |
1,457 |
52,927 |
132,113 |
|
|
|
|
|
|
|
|
|
|
|
Comprehensive income |
|
|
|
|
|
|
|
|
|
Profit for the period |
- |
- |
- |
- |
- |
- |
11,016 |
11,016 |
|
Other comprehensive income |
- |
- |
- |
- |
- |
(5,633) |
- |
(5,633) |
|
|
|
|
|
|
|
|
|
|
|
Transactions with owners |
|
|
|
|
|
|
|
|
|
Dividends |
- |
- |
- |
- |
- |
- |
(8,400) |
(8,400) |
|
Share-based payments |
- |
- |
- |
- |
- |
- |
1,894 |
1,894 |
|
Deferred tax recognised in equity |
- |
- |
- |
- |
- |
- |
227 |
227 |
|
Current tax recognised in equity |
|
|
|
|
|
|
714 |
714 |
|
Sale of Ordinary Shares |
- |
- |
- |
11,356 |
- |
- |
(5,071) |
6,285 |
|
Acquisition of Ordinary Shares |
- |
- |
- |
(18,101) |
- |
- |
- |
(18,101) |
|
|
|
|
|
|
|
|
|
|
|
As at 30 June 2025 |
52 |
33,702 |
2 |
(9,641) |
46,870 |
(4,176) |
53,307 |
120,116 |
|
|
|
|
|
|
|
|
|
|
|
Comprehensive income |
|
|
|
|
|
|
|
|
|
Profit for the period |
- |
- |
- |
- |
- |
- |
8,680 |
8,680 |
|
Other comprehensive income |
- |
- |
- |
- |
- |
1,266 |
- |
1,266 |
|
|
|
|
|
|
|
|
|
|
|
Transactions with owners |
|
|
|
|
|
|
|
|
|
Ordinary Share issues |
- |
11,682 |
- |
- |
- |
- |
- |
11,682 |
|
Dividends |
- |
- |
- |
- |
- |
- |
(2) |
(2) |
|
Share-based payments |
- |
- |
- |
- |
- |
- |
2,072 |
2,072 |
|
Deferred tax recognised in equity |
- |
- |
- |
- |
- |
- |
(220) |
(220) |
|
Current tax recognised in equity |
- |
- |
- |
- |
- |
- |
1,224 |
1,224 |
|
Sale of Ordinary Shares |
- |
- |
- |
11,423 |
- |
- |
(7,915) |
3,508 |
|
Acquisition of Ordinary Shares |
- |
- |
- |
(5,795) |
- |
- |
- |
(5,795) |
|
|
|
|
|
|
|
|
|
|
|
As at 31 December 2025 and 01 January 2026 |
52 |
45,384 |
2 |
(4,014) |
46,870 |
(2,910) |
57,145 |
142,528 |
|
|
|
|
|
|
|
|
|
|
|
Comprehensive income |
|
|
|
|
|
|
|
|
|
Profit for the period |
- |
- |
- |
- |
- |
- |
12,339 |
12,339 |
|
Other comprehensive income |
- |
- |
- |
- |
- |
1,877 |
- |
1,877 |
|
|
|
|
|
|
|
|
|
|
|
Transactions with owners |
|
|
|
|
|
|
|
|
|
Ordinary Share issues |
1 |
9,230 |
- |
- |
- |
- |
- |
9,231 |
|
Dividends |
- |
- |
- |
- |
- |
- |
(11,275) |
(11,275) |
|
Share-based payments |
- |
- |
- |
- |
- |
- |
2,900 |
2,900 |
|
Deferred tax recognised in equity |
- |
- |
- |
- |
- |
- |
(1,042) |
(1,042) |
|
Current tax recognised in equity |
- |
- |
- |
- |
- |
- |
171 |
171 |
|
Sale of Ordinary Shares |
- |
- |
- |
7,991 |
- |
- |
(3,348) |
4,643 |
|
Acquisition of Ordinary Shares |
- |
- |
- |
(8,627) |
- |
- |
- |
(8,627) |
|
|
|
|
|
|
|
|
|
|
|
As at 30 June 2026 |
53 |
54,614 |
2 |
(4,650) |
46,870 |
(1,033) |
56,890 |
152,746 |
|
|
|
|
|
|
|
|
|
|
Share capital
Share capital represents the nominal value of share capital subscribed.
Share premium
The share premium account is used to record the aggregate amount or value of premiums paid when the Company's shares are issued at a premium, net of associated share issue costs.
Capital redemption reserve
The capital redemption reserve is a non-distributable reserve into which amounts are transferred following the redemption or purchase of the Company's own shares.
EBT share reserve
The Employee Benefit Trust (‘EBT’) share reserve represents the cost of shares repurchased and held in the EBT.
Merger relief reserve
This reserve records the amounts above the nominal value received for shares sold, less transaction costs in accordance with section 610 of the Companies Act 2006.
Foreign currency translation reserve
The foreign currency translation reserve represents exchange differences that arise on consolidation from the translation of the financial statements of foreign subsidiaries.
Retained earnings
The retained earnings reserve represents cumulative net gains and losses recognised in the statement of comprehensive income and equity-settled share-based payment reserves and related tax on share-based payments.
Interim Condensed Consolidated Statement of Cash Flows
For the six months ended 30 June 2026
|
|
|
Six months ended 30 June 2026 Unaudited |
|
Six months ended 30 June 2025 Unaudited |
|
|
Note |
£’000s |
|
£’000s |
|
Cash flows from operating activities: |
|
|
|
|
|
Cash generated from operations |
16 |
8,767 |
|
11,731 |
|
Taxation paid |
|
(5,992) |
|
(2,984) |
|
Net cash generated from operating activities |
|
2,775 |
|
8,747 |
|
|
|
|
|
|
|
Cash flows from investing activities: |
|
|
|
|
|
Purchase of property, plant and equipment |
|
(12) |
|
(32) |
|
Software development costs |
|
(32) |
|
(117) |
|
Payment for acquisition of subsidiary, net of cash acquired |
|
(23,468) |
|
(4,752) |
|
Interest received |
|
30 |
|
100 |
|
Net cash utilised in investing activities |
|
(23,482) |
|
(4,801) |
|
|
|
|
|
|
|
Cash flows from financing activities: |
|
|
|
|
|
EBT Ordinary share purchases |
|
(8,392) |
|
(17,956) |
|
EBT Ordinary share sales |
|
3,998 |
|
5,878 |
|
Loans to shareholders |
|
(3,000) |
|
(2,350) |
|
Loans repaid by shareholders |
|
1,953 |
|
550 |
|
s455 tax repaid re loans to shareholders |
|
403 |
|
- |
|
Proceeds from borrowings |
|
58,745 |
|
18,782 |
|
Repayment of borrowings |
|
(29,207) |
|
(9,078) |
|
Interest and transaction costs paid on borrowings |
|
(1,486) |
|
(334) |
|
Lease liability principal payments |
|
(942) |
|
(703) |
|
Interest paid on lease liability |
|
(64) |
|
(126) |
|
Ordinary share dividends paid to shareholders |
|
(3,733) |
|
(3,007) |
|
Net cash generated/(utilised) in financing activities |
|
18,275 |
|
(8,344) |
|
|
|
|
|
|
|
Net decrease in cash and cash equivalents |
|
(2,432) |
|
(4,398) |
|
|
|
|
|
|
|
Cash and cash equivalents at beginning of the period |
|
5,054 |
|
7,527 |
|
Effects of exchange rate changes on cash and cash equivalents |
|
(97) |
|
(285) |
|
Cash and cash equivalents at the end of the period |
|
2,525 |
|
2,844 |
|
|
|
|
|
|
|
|
|
|
|
|
|
|
|
|
|
|
Notes to the Group’s Interim Condensed Consolidated Financial Statements
1. Basis of Preparation and Significant Accounting Policies
1.1. General information
Elixirr International plc (the “Company”) and its subsidiaries’ (together the “Group”) principal activities are the provision of consultancy services.
The Company is a public company limited by shares incorporated in England and Wales and domiciled in the UK. The share capital of the Company is listed on the London Stock Exchange. The address of the registered office is 12 Helmet Row, London, EC1V 3QJ and the Company number is 11723404.
The consolidated financial statements were authorised for issue in accordance with a resolution of the Directors on 18 September 2026.
1.2. Basis of preparation
These condensed consolidated financial statements have been prepared in accordance with UK-adopted International Accounting Standards (IAS) 34 ‘Interim Financial Reporting’. They do not include all disclosures that would otherwise be required in a complete set of financial statements and should be read in conjunction with the Annual Report 2025. The financial information for the half years ended 30 June 2026 and 30 June 2025 do not constitute statutory accounts within the meaning of Section 434(3) of the Companies Act 2006 and are unaudited.
The annual financial statements of Elixirr International plc are prepared in accordance with UK-adopted International Accounting Standards. The comparative financial information for the year ended 31 December 2025 included within this report does not constitute the full statutory accounts for that period. The Annual Report 2025 has been filed with the Registrar of Companies. The Independent Auditor’s Report on the Annual Report 2025 was unqualified, did not draw attention to any matters by way of emphasis, and did not contain a statement under section 498(2) and 498(3) of the Companies Act 2006.
The accounting policies adopted are consistent with those of the previous financial year except for income tax expense, which is recognised based on management’s estimate of the weighted average effective annual income tax rate expected for the full financial year. They are consistent with those of the corresponding interim reporting period.
The interim financial statements have not been audited or reviewed by the Group’s external auditor.
1.3. Basis of consolidation
These financial statements consolidate the financial statements of the Company and its subsidiary undertakings as at 30 June 2026.
Subsidiaries are fully consolidated from the date of acquisition, being the date on which the Group obtains control, and continue to be consolidated until the date that such control ceases. The acquisition method of accounting has been adopted. The financial statements of subsidiaries are prepared for the same reporting period as the parent company, using consistent accounting policies.
All intra-group balances, income and expenses and unrealised gains and losses resulting from intra-group transactions are eliminated in full.
1.4. Measurement convention
These financial statements have been prepared under the historical cost convention, except as otherwise described in the accounting policies.
The preparation of the consolidated financial information in compliance with IFRS requires the use of certain critical accounting estimates and management judgements in applying the accounting policies. The significant estimates and judgements that have been made and their effect is disclosed in note 1.6.1.
1.5. Going concern
The Directors have, at the time of approving the financial statements, a reasonable expectation that the Company and the Group have adequate resources to continue in operation for the foreseeable future. The Group's forecasts and projections, taking into account reasonable possible changes in trading performance, show that the Group has sufficient financial resources, together with assets that are expected to generate cash flow in the normal course of business. Accordingly, the Directors have adopted the going concern basis in preparing these consolidated financial statements.
1.6. Material accounting policies
Please refer to the Group's last annual consolidated financial statements for full disclosure of the principal accounting policies that have been adopted in the preparation of these interim condensed consolidated financial statements. There have been no new accounting standards or policies adopted during the period that have had a material impact on the Group. The key accounting policies that affected the Group in the period are set out below.
1.6.1. Judgements and key sources of estimation uncertainty
The preparation of the financial statements requires management to make estimates and judgements that affect the reported amounts of assets, liabilities, costs and revenue in the financial statements. Actual results could differ from these estimates. The judgements, estimates and associated assumptions are based on historical experience and other factors that are considered to be relevant.
In the process of applying the Group’s accounting policies, the Directors have made judgements which are considered to have a significant effect on the amounts recognised in the financial statements for the period ending 30 June 2026. These judgements involve estimations for contingent consideration on acquisitions and the recognition of intangibles on acquisitions, including applying the Multi-period Excess Earnings method to estimate the fair value of customer relationships and order books.
The key sources of estimation uncertainty that could cause an adjustment to be required to the carrying amount of assets or liabilities within the next accounting period is contingent consideration arising on business combinations under IFRS 3. Contingent consideration contains estimation uncertainty as the earn-out potentially payable is linked to the future performance of the acquiree. In estimating the fair value of the contingent consideration, at both the acquisition date and the period end, management has estimated the potential future cash flows of the acquirees and assessed the likelihood of an earn-out payment being made. These estimates could potentially change as a result of events over the coming years.
1.6.2. Revenue recognition
Revenue is measured as the fair value of consideration received or receivable for satisfying performance obligations contained in contracts with clients, excluding discounts and Value Added Tax. Variable consideration is included in revenue only to the extent that it is highly probable that a significant reversal will not be required when the uncertainties determining the level of variable consideration are resolved.
This occurs as follows for the Group’s various contract types:
- Time-and-materials contracts are recognised over time as services are provided at the fee rate agreed with the client where there is an enforceable right to payment for performance completed to date.
- Fixed-fee contracts are recognised over time based on the actual service provided to the end of the reporting period as a proportion of the total services to be provided where there is an enforceable right to payment for performance completed to date. This is determined based on the actual inputs of time and expenses relative to total expected inputs.
Where contracts include multiple performance obligations, the transaction price is allocated to each performance obligation based on its stand-alone selling price. Where these are not directly observable, they are estimated based on expected cost-plus margin. Adjustments are made to allocate discounts proportionately relative to the stand-alone selling price of each performance obligation.
Estimates of revenues, costs or extent of progress toward completion are revised if circumstances change. Any resulting increase or decrease in estimated revenues or costs are reflected in the statement of comprehensive income in the period in which the circumstances that give rise to the revision became known.
Fees are normally billed on a monthly basis. If the revenue recognised by the Group exceeds the amounts billed, a contract asset is recognised. If the amounts billed exceed the revenue recognised, a contract liability is recognised. Unbilled revenue is recognised at the fair value of consultancy services provided at the reporting date reflecting the stage of completion (determined by costs incurred to date as a percentage of the total anticipated costs) of each assignment. Contract assets are reclassified as receivables when billed and the consideration has become unconditional because only the passage of time is required before payment is due.
The Group’s standard payment terms require settlement of invoices within 30 days of receipt.
The Group does not adjust the transaction price for the time value of money as it does not expect to have any contracts where the period between the transfer of the promised services to the client and the payment by the client exceeds one year.
1.6.3. Business combinations, goodwill and consideration
Business combinations
The Group applies the acquisition method of accounting to account for business combinations in accordance with IFRS 3, ‘Business Combinations’.
The consideration transferred for the acquisition of a subsidiary is the fair value of the assets transferred, the liabilities incurred and the equity interests issued by the Group. The consideration transferred includes the fair value of any asset or liability resulting from a contingent consideration arrangement. Identifiable assets acquired and liabilities and contingent liabilities assumed in a business combination are measured initially at their fair values at the acquisition date. The excess of the consideration transferred over the fair value of the Group’s share of the identifiable net assets acquired is recorded as goodwill. All transaction related costs are expensed in the period they are incurred as operating expenses. If the consideration is lower than the fair value of the net assets of the subsidiary acquired, the difference is recognised in the income statement.
Goodwill
Goodwill is initially measured at cost and any previous interest held over the net identifiable assets acquired and liabilities assumed. If the fair value of the net assets acquired is in excess of the aggregate consideration transferred, the Group re-assesses whether it has correctly identified all of the assets acquired and all of the liabilities assumed and reviews the procedures used to measure the amounts to be recognised at the acquisition date. If the reassessment still results in an excess of the fair value of net assets acquired over the aggregate consideration transferred, then the gain is recognised in the income statement.
After initial recognition, goodwill is measured at cost less any accumulated impairment losses. For the purposes of impairment testing, goodwill is allocated to each of the Group’s cash-generating units expected to benefit from the synergies of the combination. Cash-generating units to which goodwill has been allocated are tested for impairment annually, or more frequently when there is an indication that the unit may be impaired.
The Group performs impairment reviews at the reporting period end to identify any goodwill or intangible assets that have a carrying value that is in excess of its recoverable amount. Determining the recoverability of goodwill and the intangible assets requires judgement in both the methodology applied and the key variables within that methodology. Where it is determined that an asset is impaired, the carrying value of the asset will be reduced to its recoverable amount with the difference recorded as an impairment charge in the income statement.
Contingent and non-contingent deferred consideration on acquisition
Contingent and non-contingent deferred consideration may arise on acquisitions. Non-contingent deferred consideration may arise when settlement of all or part of the cost of the business combination falls due after the acquisition date. Contingent deferred consideration may arise when the consideration is dependent on future performance of the acquired company.
Deferred consideration associated with business combinations settled in cash is assessed in line with the agreed contractual terms. Consideration payable is recognised as capital investment cost when the deferred or contingent consideration is not employment-linked. Alternatively, consideration is recognised as remuneration expense over the deferral or contingent performance period, where the consideration is also contingent upon future employment. Where the contingent consideration is settled in a variable number of shares or cash, the consideration is classified as a liability and measured at fair value through profit and loss.
1.6.4. Foreign currency translation
The presentational currency of these financial statements and the functional currency of the Group is pounds sterling.
Functional and presentational currency
Items included in the financial statements of each of the Group’s entities are measured using the currency of the primary economic environment in which the entity operates (‘the functional currency’). The financial statements are presented in ‘sterling’, which is the Group’s and Company’s functional currency and presentation currency.
On consolidation, the results of overseas operations are translated into sterling at rates approximating to those ruling when the transactions took place. All assets and liabilities of overseas operations are translated at the rate ruling at the reporting date. Exchange differences arising on translating the opening net assets at opening rate and the results of overseas operations at actual rate are recognised in other comprehensive income.
Transactions and balances
Foreign currency transactions are translated into the functional currency using the exchange rates prevailing at the dates of the transactions. Foreign exchange gains and losses resulting from the settlement of such transactions and from the translation at year-end exchange rates of monetary assets and liabilities denominated in foreign currencies are recognised in the income statement.
1.6.5. Intangible assets
Intangible assets are measured at cost less accumulated amortisation and any accumulated impairment losses.
Software development
Expenditure on software development activities is recognised as an intangible asset when the Group can demonstrate: the technical feasibility of completing the software so that it will be available for use or sale; its intention to complete and its ability to use or sell the asset; how the asset will generate future economic benefits; the availability of resources to complete the asset; and the ability to reliably measure the expenditure during development. Capitalised software development costs are amortised on a straight-line basis over the estimated useful life of 3 years.
Intangible assets acquired in a business combination are initially measured at fair value (which is regarded as their cost). Subsequent to initial recognition, intangible assets acquired in a business combination reported at cost less accumulated amortisation and any accumulated impairment losses.
Intangible assets acquired in a business combination are identified and recognised separately from goodwill where they satisfy the definition of an intangible asset under IAS 38. Such assets are only recognised if either:
- They are capable of being separated or divided from the company and sold, transferred, licensed, rented or exchanged, either individually or together with related contract, identified asset or liability, regardless of whether the company intends to do so; or
- They arise from contractual or other legal rights, regardless of whether those rights are transferrable or separable from the entity of from other rights and obligations.
The cost of such intangible assets is the fair value at the acquisition date. All intangible assets acquired through business combinations are amortised over their estimated useful lives. The significant intangibles recognised by the Group, their useful economic lives and the methods used to determine the cost of the intangibles acquired in business combinations are as follows:
|
Intangible Asset |
Useful Economic Life |
Valuation Method |
|
Trademark |
33.33% reducing balance |
Relief from Royalty method |
|
Customer relationships |
10 - 25% reducing balance |
Multi-Period Excess Earnings method |
|
Order book |
Over order term |
Multi-Period Excess Earnings method |
1.6.6. Tangible assets
Tangible fixed assets are stated at cost net of accumulated depreciation and accumulated impairment losses.
Costs comprise purchase costs together with any incidental costs of acquisition.
Depreciation is provided to write down the cost less the estimated residual value of all tangible fixed assets by equal instalments over their estimated useful economic lives on a straight-line basis. The following rates are applied:
|
Tangible fixed asset |
Useful economic life |
|
Leasehold improvements |
Over the life of the lease |
|
Computer equipment |
3 years |
|
Fixtures and fittings |
3 years |
The assets’ residual values, useful lives and depreciation methods are reviewed, and adjusted prospectively if appropriate, if there is an indication of a significant change since the last reporting date. Low value equipment including computers is expensed as incurred.
1.6.7. Impairments of tangible and intangible assets
At each reporting end date, the Group reviews the carrying amounts of its tangible and intangible assets (other than goodwill) to determine whether there is any indication that those assets have suffered an impairment loss. If any such indication exists, the recoverable amount of the asset is estimated in order to determine the extent of the impairment loss (if any). Where it is not possible to estimate the recoverable amount of an individual asset, the Group estimates the recoverable amount of the cash-generating unit to which the asset belongs.
The recoverable amount is the higher of fair value less costs to sell and value in use. In assessing value in use, the estimated future cash flows are discounted to their present value using a pre-tax discount rate that reflects current market assessments of the time value of money and the risks specific to the asset for which the estimates of future cash flows have not been adjusted.
If the recoverable amount of an asset (or cash-generating unit) is estimated to be less than its carrying amount, the carrying amount of the asset (or cash-generating unit) is reduced to its recoverable amount. An impairment loss is recognised immediately in profit and loss.
Where an impairment subsequently reverses, the carrying amount of the asset (or cash-generating unit) is increased to the revised estimate of its recoverable amount, but so that the increased carrying amount does not exceed the carrying amount that would have been determined had no impairment loss been recognised for the asset (or cash-generating unit) in prior years. A reversal of an impairment loss is recognised immediately in profit and loss.
1.6.8. Employee benefits
Post-retirement benefits
The Group pays into defined contribution pension schemes on behalf of employees, which are operated by third parties. The assets of the schemes are held separately from those of the Group in independently administered funds.
The amount charged to the income statement represents the contributions payable to the scheme in respect of the accounting period.
Share-based payments
The cost of share-based employee compensation arrangements, whereby employees receive remuneration in the form of equity instruments, is recognised as an employee benefit expense in the statement of profit and loss.
The total expense to be apportioned over the vesting period of the benefit is determined by reference to the fair value (excluding the effect of non-market based vesting conditions) at the grant date. For share option and employee share purchase plans fair value is measured by use of Black Scholes option valuation model.
At the end of each reporting period the assumptions underlying the number of awards expected to vest are adjusted for the effects of non-market based vesting conditions to reflect conditions prevailing at that date. The impact of any revisions to the original estimates is recognised in the statement of profit or loss, with a corresponding adjustment to equity.
The Group has the obligation to pay employers’ national insurance on the exercise of certain UK employee options. The Group has opted to account for the tax obligation under IFRS 2 as a cash-settled share-based payment arrangement as the amount of employers’ national insurance due at the time of exercise is based on the share price of the equity instruments of the Company. The cash-settled share-based payment liability is estimated at each period end using the closing share price of the Company and the prevailing employers' national insurance rate. The number of awards expected to vest are consistent with the treatment for equity-settled share-based payments. The cost of employers’ national insurance is included within share-based payments expense in the statement of comprehensive income.
Please refer to note 14 for further details.
1.6.9. Earnings per share
The Group presents basic and diluted earnings per share on both a statutory and adjusted basis.
Basic EPS is calculated by dividing the profit attributable to the Group’s Ordinary shareholders by the weighted average number of Ordinary shares outstanding during the period.
The calculation of diluted EPS assumes conversion of all potentially dilutive Ordinary shares. For share options, a calculation is performed to determine the number of share options that are potentially dilutive based on the number of shares that could have been acquired at fair value from the future assumed proceeds of the outstanding share options.
2. Alternative Performance Measures (‘APMs’)
In order to provide better clarity to the underlying performance of the Group, Elixirr uses adjusted EBITDA, adjusted profit before tax, adjusted EPS and free cash flow as alternative performance measures. These measures are not defined under IFRS. These non-GAAP measures are not intended to be a substitute for, or superior to, any IFRS measures of performance, but have been included as the Directors consider adjusted EBITDA, adjusted profit before tax, adjusted EPS and free cash flow to be key measures used within the business for assessing the underlying performance of the Group's ongoing business across periods.
Adjusted EBITDA excludes the following items from operating profit: non-cash depreciation and amortisation charges, share-based payments, non-recurring main market listing costs and non-recurring M&A-related items. Adjusted EPS excludes the following items from profit after tax: amortisation charges, share-based payments, non-recurring main market listing costs and non-recurring M&A-related items, M&A-related non-cash finance costs and their related tax impacts. Free cash flow is calculated after deducting capital expenditure and office lease costs from net cash generated from operating activities and interest received.
Amortisation of acquired intangible assets primarily relates to customer relationships and order books recognised as part of business combinations. These balances arise from purchase price allocation adjustments required under IFRS 3 and do not represent costs incurred in the period to generate revenue. The amortisation charge is therefore dependent on the valuation and useful economic lives assigned to these assets at the time of acquisition rather than the underlying operating performance of the Group’s activities. Management therefore excludes these charges when assessing the operating performance of the business and when monitoring performance against internal budgets and forecasts.
Similarly, share-based payment charges reflect the accounting valuation of long-term incentive arrangements granted to employees and senior management and do not represent cash operating costs incurred in the period. These charges can also vary significantly depending on valuation assumptions and vesting outcomes.
The table below sets out the reconciliation of the Group's adjusted EBITDA and adjusted profit before tax from profit before tax:
|
|
H1 26 |
H1 25 | |
|
|
£'000s |
£'000s | |
|
Profit before tax |
17,964 |
15,359 | |
|
Adjusting items: |
|
| |
|
M&A-related items (note 4) |
301 |
161 | |
|
Main Market listing costs (note 4) |
- |
795 | |
|
Amortisation of intangible assets |
3,575 |
1,496 | |
|
Share-based payments |
2,604 |
2,188 | |
|
Finance cost - contingent consideration |
693 |
136 | |
|
Adjusted profit before tax |
25,137 |
20,135 | |
|
Depreciation |
906 |
881 | |
|
Net finance cost - excluding contingent consideration |
1,535 |
442 | |
|
Adjusted EBITDA |
27,578 |
21,458 | |
|
|
|
|
|
The table below sets out the reconciliation of the Group's adjusted profit after tax to adjusted profit before tax:
|
|
H1 26 |
H1 25 |
|
|
£'000s |
£'000s |
|
Adjusted profit before tax |
25,137 |
20,135 |
|
Tax charge |
(5,625) |
(4,343) |
|
Tax impact of adjusting items |
(929) |
(778) |
|
Adjusted profit after tax |
18,583 |
15,014 |
Adjusted profit after tax is used in calculating adjusted basic and adjusted diluted EPS. Adjusted profit after tax is stated before adjusting items and their associated tax effects.
Adjusted EPS is calculated by dividing the adjusted profit after tax for the period attributable to Ordinary shareholders by the weighted average number of Ordinary shares outstanding during the period. Adjusted diluted EPS is calculated by dividing adjusted profit after tax by the weighted average number of shares adjusted for the impact of potential Ordinary shares.
Potential Ordinary shares are treated as dilutive when their conversion to Ordinary shares would decrease EPS. Please refer to note 5 for further detail.
|
|
H1 26 |
H1 25 |
|
|
p |
p |
|
Adjusted EPS |
37.5 |
31.7 |
|
Adjusted diluted EPS |
34.2 |
29.0 |
The table below sets out the reconciliation of the Group's net cash generated from operating activities to free cash flow:
|
|
H1 26 |
H1 25 |
|
|
£'000s |
£'000s |
|
Net cash generated from operating activities |
2,775 |
8,747 |
|
Purchase of property, plant and equipment |
(12) |
(32) |
|
Software development costs |
(32) |
(117) |
|
Interest received |
30 |
100 |
|
Lease liability principal payments |
(942) |
(703) |
|
Interest paid on lease liability |
(64) |
(126) |
|
Free cash flow |
1,755 |
7,869 |
3. Segmental Reporting
IFRS 8 requires that operating segments be identified on the basis of internal reporting and decision-making. The Group is operated as one global business by its executive team, with key decisions being taken by the same leaders irrespective of the geography where work for clients is carried out. The Directors therefore consider that the Group has one operating segment. As such, no additional disclosure has been recorded under IFRS 8.
In accordance with the entity-wide disclosure requirements of IFRS 8, revenue from contracts with customers is disaggregated by geographical market as follows:
|
|
H1 26 |
H1 25 |
|
|
£’000s |
£’000s |
|
Revenue from contracts with customers arises from: |
|
|
|
United Kingdom |
18,104 |
16,813 |
|
USA |
59,400 |
42,869 |
|
Rest of World |
11,452 |
11,728 |
|
Total Revenue |
88,956 |
71,410 |
4. M&A and Main Market-related items
|
|
H1 26 |
H1 25 |
|
|
£’000s |
£’000s |
|
M&A-related items: |
|
|
|
- Transaction costs |
279 |
10 |
|
- Employment-related contingent consideration |
22 |
151 |
|
Main Market listing costs |
- |
795 |
5. Earnings Per Share
The Group presents non-adjusted and adjusted basic and diluted EPS for its Ordinary shares. Basic EPS is calculated by dividing the profit for the period attributable to Ordinary shareholders by the weighted average number of Ordinary shares outstanding during the period.
Diluted EPS takes into consideration the Company's dilutive contingently issuable shares. The weighted average number of Ordinary shares used in the diluted EPS calculation is inclusive of the number of share options and ESPP matching awards that are expected to vest (subject to performance criteria being met) and the number of shares that may be issued to satisfy contingent M&A deferred consideration.
The profits and weighted average number of shares used in the calculations are set out below:
|
|
H1 26 |
H1 25 |
|
Basic and Diluted EPS |
|
|
|
|
|
|
|
Profit attributable to the Ordinary equity holders of the Group used in calculating basic and diluted EPS (£’000s) |
12,339 |
11,016 |
|
Basic earnings per Ordinary share (p) |
24.9 |
23.2 |
|
Diluted earnings per Ordinary share (p) |
22.7 |
21.3 |
|
|
|
|
|
|
H1 26 |
H1 25 |
|
Adjusted Basic and Diluted EPS |
|
|
|
|
|
|
|
Profit attributable to the ordinary equity holders of the Group used in calculating adjusted basic and diluted EPS (note 2) (£’000s) |
18,583 |
15,014 |
|
Adjusted basic earnings per Ordinary share (p) |
37.5 |
31.7 |
|
Adjusted diluted earnings per Ordinary share (p) |
34.2 |
29.0 |
|
|
|
|
|
|
H1 26 |
H1 25 |
|
|
Number |
Number |
|
Weighted average number of shares |
|
|
|
|
|
|
|
Weighted average number of ordinary shares used as the denominator in calculating non-adjusted and adjusted basic EPS |
49,512,521 |
47,437,162 |
|
Number of dilutive Ordinary shares |
4,851,507 |
4,335,596 |
|
Weighted average number of ordinary shares used as the denominator in calculating non-adjusted and adjusted diluted EPS |
54,364,029 |
51,772,758 |
6. Goodwill and Intangible Fixed Assets
|
|
Goodwill |
Trademarks |
Customer Relationships |
Order Book |
Software |
Total |
|
|
£’000s |
£’000s |
£’000s |
£’000s |
£’000s |
£’000s |
|
Cost |
|
|
|
|
|
|
|
At 31 December 2024 and 01 January 2025 |
118,004 |
7,135 |
10,836 |
2,349 |
736 |
139,060 |
|
Additions |
- |
- |
- |
- |
78 |
78 |
|
Losses from foreign exchange |
(5,576) |
- |
(756) |
(198) |
(60) |
(6,590) |
|
At 30 June 2025 |
112,428 |
7,135 |
10,080 |
2,151 |
754 |
132,548 |
|
Acquisition of business |
58,614 |
- |
17,457 |
1,837 |
- |
77,908 |
|
Additions |
- |
- |
- |
- |
53 |
53 |
|
Gains from foreign exchange |
1,765 |
- |
356 |
59 |
16 |
2,196 |
|
At 31 December 2025 |
172,807 |
7,135 |
27,893 |
4,047 |
823 |
212,705 |
|
Acquisition of business |
12,693 |
- |
1,557 |
281 |
- |
14,531 |
|
Additions |
- |
- |
- |
- |
33 |
33 |
|
Gains from foreign exchange |
2,395 |
- |
513 |
80 |
16 |
3,004 |
|
At 30 June 2026 |
187,895 |
7,135 |
29,963 |
4,408 |
872 |
230,273 |
|
|
|
|
|
|
|
|
|
Amortisation |
|
|
|
|
|
|
|
At 31 December 2024 and 01 January 2025 |
- |
(6,024) |
(2,539) |
(1,572) |
(116) |
(10,251) |
|
Charge for the period |
- |
(172) |
(868) |
(354) |
(102) |
(1,496) |
|
Gains from foreign exchange |
- |
- |
212 |
152 |
11 |
375 |
|
At 30 June 2025 |
- |
(6,196) |
(3,195) |
(1,774) |
(207) |
(11,372) |
|
Charge for the period |
- |
(146) |
(1,954) |
(1,773) |
(97) |
(3,970) |
|
Losses from foreign exchange |
- |
- |
(24) |
(9) |
(11) |
(44) |
|
At 31 December 2025 |
- |
(6,342) |
(5,173) |
(3,556) |
(315) |
(15,386) |
|
Charge for the period |
- |
(124) |
(2,794) |
(564) |
(93) |
(3,575) |
|
Losses from foreign exchange |
- |
- |
(112) |
(96) |
(8) |
(216) |
|
At 30 June 2026 |
- |
(6,466) |
(8,079) |
(4,216) |
(416) |
(19,177) |
|
|
|
|
|
|
|
|
|
Net book value |
|
|
|
|
|
|
|
At 30 June 2025 |
112,428 |
939 |
6,885 |
377 |
547 |
121,176 |
|
At 31 December 2025 |
172,807 |
793 |
22,720 |
491 |
508 |
197,319 |
|
At 30 June 2026 |
187,895 |
669 |
21,884 |
192 |
456 |
211,096 |
Goodwill
Goodwill arising on the acquisition of a business during the six months ended 30 June 2026 relates to the acquisition of Kvadrant and was calculated as the fair value of the purchase consideration paid less the fair value of the identifiable net assets at the date of acquisition (see note 7).
Goodwill arising on the acquisition of a business in FY 25 relates to the acquisition of TRC Advisory and was calculated as the fair value of the purchase consideration paid less the fair value of the identifiable net assets at the date of acquisition.
In line with IAS 36, the carrying value of goodwill is not subject to systematic amortisation but is reviewed at least annually for impairment. The Group performs an annual impairment assessment. At 30 June 2026, the Directors determined that there are no indications that the assets held are at risk of impairment.
Customer Relationships and Order Book
Additions during the six months ended 30 June 2026 represent the fair value of customer relationships and the order book recognised on the acquisition of Kvadrant.
Additions in FY 25 represent the fair value of customer relationships and the order book recognised on the acquisition of TRC Advisory.
The fair values were determined by applying the Multi-Period Excess Earnings method. The amortisation charge is recognised within administrative expenses.
7. Business Combinations
On 30 January 2026, the Group acquired the entire issued share capital of Kvadrant Consulting A/S ("Kvadrant"), a Denmark-based consultancy specialising in commercial transformation, go-to-market excellence and transaction services.
The acquisition fits with Elixirr's strategy to evolve its capabilities, widen its industry diversification and grow its international presence, particularly within the Nordic region, as Elixirr continues to disrupt the traditional consulting model and deliver innovative solutions for its clients globally.
The Group acquired Kvadrant for maximum equity value consideration of £16.9 million (DKK145.7 million). The consideration consists of:
- An initial cash consideration of £8.1 million (DKK69.5 million), following the purchase price adjustments under the Sale and Purchase Agreement;
- An initial share consideration of £3.3 million (DKK28.9 million), settled through the issue of 415,213 Ordinary Shares at a price of £8.04 per share; and
- Contingent consideration of up to £5.5 million (DKK47.3 million), payable over three years (FY 26, FY 27 and FY 28) subject to the achievement of agreed performance targets and, at the Company's discretion, settled in cash and/or Ordinary Shares.
Of the £8.1 million (DKK69.5 million) initial cash consideration, £7.2 million (DKK 61.7 million) was paid to the selling shareholders free of restrictions with £0.9 million (DKK 7.8 million) held back under the sale and purchase agreement pending finalisation of the acquisition balance sheet. The £0.9 million (DKK 7.8 million) holdback was paid to the sellers in July 2026 following finalisation of the acquisition balance sheet.
The total fair value of the contingent consideration payable recognised in these accounts at 30 June 2026 is £2.9 million (DKK25.5 million). This amount represents the Group's current expectation of the contingent consideration payable. As at 30 June 2026, a £2.9 million liability is recorded, with £1.0 million recorded as a current liability and £1.9 million recorded as a non-current liability.
The contingent consideration liabilities are classified as Level 3 within the IFRS 13 fair value hierarchy as the valuation incorporates significant unobservable inputs. The fair value has been determined using probability-weighted forecast scenarios for the acquired business, with expected earn-out payments discounted to present value. Significant unobservable inputs include forecast revenue growth, forecast EBITDA, probability weightings applied to forecast scenarios and the discount rate applied.
The new Ordinary Shares issued are subject to one-year lock-in arrangements and limitations on the Ordinary Shares that each seller can sell in each of the following three years under nominee agreements.
The difference between the fair value of the purchase consideration of £14.3 million and the fair value of the identifiable assets acquired and liabilities assumed of £1.6 million was recognised as goodwill of £12.7 million. The goodwill is attributable to the company's workforce and working methodologies and is not deductible for tax purposes.
Included within M&A-related items is an amount of £0.2 million for legal and advisory fees in relation to the acquisition.
Kvadrant contributed £2.4 million to the Group's revenue and £0.3 million to the Group's profit before tax (after amortisation of acquired customer intangible assets) for the period from the date of acquisition to 30 June 2026. If the acquisition of Kvadrant had been completed on 1 January 2026, Group revenues for the six months ended 30 June 2026 would have been £89.4 million and Group profit before tax would have been £18.1 million.
The purchase price allocation in respect of the acquisition remains provisional at 30 June 2026 and is subject to finalisation of the Group’s assessment of the fair values of the identifiable assets acquired and liabilities assumed.
In calculating the goodwill arising, the fair value of the net assets of Kvadrant has been assessed and fair value adjustments recognised in respect of customer relationship and order book intangible assets and the related deferred tax. Customer relationship and order book intangible assets were assessed to be separately identifiable assets, recognised at fair value and are included within the intangible assets below. Refer to note 6 for further details.
The fair value of trade and other receivables approximates carrying value and there is no material difference between fair value and the gross contractual amounts at the acquisition date.
The table below sets out the amounts recognised as of the acquisition date for each major class of assets acquired and liabilities assumed, the consideration and goodwill on the acquisition of Kvadrant:
|
|
|
|
|
Fair value |
|
|
|
|
|
|
|
£’000s |
|
|
|
Assets |
|
|
|
|
|
|
|
Non-current assets |
|
|
|
|
|
|
|
Intangible assets |
|
|
|
1,838 |
|
|
|
Property, plant and equipment |
|
|
|
462 |
|
|
|
Total non-current assets |
|
|
|
2,300 |
|
|
|
|
|
|
|
|
|
|
|
Current assets |
|
|
|
|
|
|
|
Trade and other receivables |
|
|
|
1,070 |
|
|
|
Cash and cash equivalents |
|
|
|
95 |
|
|
|
Total current assets |
|
|
|
1,165 |
|
|
|
|
|
|
|
|
|
|
|
Total assets |
|
|
|
3,465 |
|
|
|
|
|
|
|
|
|
|
|
Liabilities |
|
|
|
|
|
|
|
Current liabilities |
|
|
|
|
|
|
|
Trade and other payables |
|
|
|
1,197 |
|
|
|
Lease liability |
|
|
|
283 |
|
|
|
Total current liabilities |
|
|
|
1,480 |
|
|
|
|
|
|
|
|
|
|
|
Non-current liabilities |
|
|
|
|
|
|
|
Deferred tax liability |
|
|
|
404 |
|
|
|
Total non-current liabilities |
|
|
|
404 |
|
|
|
|
|
|
|
|
|
|
|
Total liabilities |
|
|
|
1,884 |
|
|
|
|
|
|
|
|
|
|
|
Fair value of net assets acquired |
|
|
|
1,581 |
|
|
|
Goodwill (note 6) |
|
|
|
12,693 |
|
|
|
Fair value of purchase consideration |
|
|
|
14,274 |
|
|
|
Cash and cash equivalents in subsidiary acquired |
|
|
|
95 |
|
|
8. Receivables
|
|
H1 26 |
FY 25 |
|
|
£’000s |
£’000s |
|
Non-current assets |
|
|
|
Loans to shareholders |
9,510 |
8,566 |
|
Other receivables |
3,690 |
3,701 |
|
|
13,200 |
12,267 |
|
Current assets |
|
|
|
Trade receivables |
31,491 |
23,408 |
|
Prepayments and deposits |
2,647 |
2,552 |
|
Contract assets |
2,542 |
804 |
|
Other receivables |
97 |
46 |
|
|
36,777 |
26,810 |
|
|
|
|
Loans to shareholders represent amounts owed to the Company by shareholders, who are senior employees of the Group. The loans to shareholders are interest-free and expected to be repaid beyond one year. Non-current other receivables include property deposits and s455 tax receivable.
Trade receivables are non-interest bearing and receivable under normal commercial terms. Management considers that the carrying value of trade and other receivables approximates to their fair value. The carrying value of non-current other receivables and loans to shareholders is considered to be a reasonable approximation of their fair value but has not been discounted to present value.
The expected credit loss on trade and other receivables was not material at the current or prior period ends.
9. Trade and Other Payables
|
|
H1 26 |
FY 25 |
|
|
£’000s |
£’000s |
|
Trade payables |
2,509 |
2,338 |
|
Other taxes and social security costs |
2,206 |
1,933 |
|
Accruals |
11,643 |
20,383 |
|
Dividend payable |
7,542 |
- |
|
Contract liabilities |
4,386 |
5,046 |
|
Other payables |
917 |
616 |
|
|
29,203 |
30,316 |
The fair value of trade and other payables approximates to book value at the period end. Trade payables are non-interest bearing and are normally settled monthly.
Trade payables comprise amounts outstanding for trade purchases and ongoing costs.
Contract liabilities arise from the Group's revenue-generating activities relating to payments received in advance of performance delivered under a contract. These contract liabilities typically arise from short-term timing differences between the satisfaction of performance obligations under milestone or fixed fee contracts and the related contractual payment schedules.
10. Other Creditors and Other Non-current Liabilities
|
|
H1 26 |
FY 25 |
|
|
£’000s |
£’000s |
|
|
|
|
|
Other creditors |
|
|
|
Contingent consideration |
13,975 |
22,242 |
|
Employment-related contingent consideration |
- |
83 |
|
|
13,975 |
22,325 |
|
|
|
|
|
Other non-current liabilities |
|
|
|
Dilapidations |
330 |
330 |
|
Cash-settled share-based payments |
1,114 |
1,429 |
|
Contingent consideration |
10,840 |
19,967 |
|
|
12,284 |
21,726 |
Contingent consideration comprises earn-out arrangements relating to the acquisitions of Kvadrant, TRC Advisory and Insigniam, which are contingent on the achievement of specified post-acquisition performance targets.
The employment-related contingent consideration includes post-acquisition employee benefits in relation to the Hypothesis acquisition.
Cash-settled share-based payment liabilities comprise obligations in respect of the Group's employers' National Insurance contributions on share options that have not yet vested. Refer to note 14 for further details.
Other non-current liabilities principally comprise amounts expected to be settled more than 12 months after the reporting date.
11. Loans and Borrowings
|
|
H1 26 |
FY 25 |
|
|
£’000s |
£’000s |
|
|
|
|
|
Current liabilities |
|
|
|
Right of use lease liability |
1,435 |
1,424 |
|
Term loan |
6,186 |
9,165 |
|
|
7,621 |
10,589 |
|
|
|
|
|
Non-current liabilities |
|
|
|
Right of use lease liability |
3,116 |
2,961 |
|
Term loan |
6,017 |
6,002 |
|
Revolving credit facility |
46,797 |
13,970 |
|
|
55,930 |
22,933 |
During FY 25 the Group agreed an increase in its revolving credit facility with National Westminster Bank Plc from £45 million to £65 million and a US$20.25 million term loan to support delivery of the Group's organic and inorganic growth strategy, whilst limiting dilution.
Quarterly capital repayments of the US$20.25 million term loan commenced in June 2026, with the first scheduled repayment of $4.1 million made. The loan is expected to be fully repaid by June 2027.
There were no changes to the principal terms of the revolving credit facility and term loan. Please refer to the annual report for the key terms of the facilities.
The Group’s borrowing facilities are subject to financial covenants, including a maximum leverage ratio (net debt to EBITDA) of 2.5:1 and a minimum interest cover ratio (EBITDA to finance costs) of 4.0:1. These covenants are tested on a quarterly basis based on the Group’s consolidated financial results.
At 30 June 2026, the Group had £18.3 million of the revolving credit facility unutilised and was in compliance with all covenant requirements with a leverage ratio of 1.1:1 and interest cover of 18.2:1, providing significant headroom against the required thresholds.
Revolving credit facility at 30 June 2026:
|
Currency |
Amount |
Rate |
|
|
’000s |
% |
|
GBP |
31,448 |
SONIA + margin % |
|
USD |
20,310 |
SOFR + margin % |
The margin rate ranges from 1.95% to 2.60% and is dependent on leverage.
12. Share capital, Share premium and Merger Relief Reserve
|
|
H1 26 | |||
|
|
Issued shares |
Par value |
Merger relief reserve |
Share premium |
|
|
Number |
£ |
£’000s |
£’000s |
|
£0.00005 Ordinary shares |
50,853,348 |
2,543 |
46,870 |
54,614 |
|
£1 Redeemable Preference shares |
50,001 |
50,001 |
- |
- |
|
|
50,903,349 |
52,544 |
46,870 |
54,614 |
|
|
FY 25 | |||
|
|
Issued shares |
Par value |
Merger relief reserve |
Share premium |
|
|
Number |
£ |
£’000s |
£’000s |
|
£0.00005 Ordinary shares |
49,615,941 |
2,480 |
46,870 |
45,384 |
|
£1 Redeemable Preference shares |
50,001 |
50,001 |
- |
- |
|
|
49,665,942 |
52,481 |
46,870 |
45,384 |
The total number of voting rights in the Company at 30 June 2026 was 50,853,348 (FY 25: 49,615,941).
Share issues in H1 26 represented consideration for the acquisition of Kvadrant and top-up consideration for the acquisition of TRC Advisory.
Ordinary shares
On a show of hands every holder of Ordinary shares present at a meeting, in person or by proxy, is entitled to one vote, and on a poll each share is entitled to one vote. The shares entitle the holder to participate in dividends, and to share in the proceeds of winding up the Company in proportion to the number of and amounts paid on the shares held. These rights are subject to the prior entitlements of the Redeemable Preference shareholders.
Redeemable Preference shares
The Redeemable Preference shares are entitled to dividends at a rate of 1% per annum of paid-up nominal value. The shares have preferential right, before any other class of share, to a return of capital on winding-up or reduction of capital or otherwise of the Company. The Redeemable Preference shares are redeemable 100 years from the date of issue or at any time prior at the option of the Company. The Redeemable Preference shares are held by the Company's Employee Benefit Trust.
13. Employee Benefit Trust (‘EBT’) Share Reserve
The EBT is accounted for under IFRS 10 and is consolidated on the basis that the parent has control, thus the assets and liabilities of the EBT are included in the Group statement of financial position and shares held by the EBT in the Company are presented as a deduction from equity.
The EBT share reserve comprises Ordinary and Redeemable Preference shares bought and held in the Group’s EBT.
The below table sets out the number of EBT shares held and their weighted average cost:
|
|
H1 26 | ||
|
|
Shares held in EBT |
Weighted average cost |
Total cost |
|
|
Number |
£ |
£’000s |
|
Ordinary shares |
615,315 |
7.48 |
4,600 |
|
Redeemable Preference shares |
50,001 |
1.01 |
50 |
|
|
665,316 |
|
4,650 |
|
|
|
|
|
|
|
|
|
|
|
|
FY 25 | ||
|
|
Shares held in EBT |
Weighted average cost |
Total cost |
|
|
Number |
£ |
£’000s |
|
Ordinary shares |
519,924 |
7.62 |
3,964 |
|
Redeemable Preference shares |
50,001 |
1.01 |
50 |
|
|
569,925 |
|
4,014 |
14. Share-based Payments
Share Option Plans
The Group operates EMI, CSOP and unapproved share option plans with time-based and performance-based vesting conditions.
During H1 26, a total of 4,033,691 (H1 25: 2,006,784) share options were granted to employees and senior management. The weighted average fair value of the options awarded in the period is £1.94 (H1 25: £2.13) per share, before adjustment for expected vesting.
During H1 26, 4,396,040 options with an exercise price above £6.45 (excluding those granted to key management personnel) were repriced to £6.45. The weighted average incremental fair value granted as a result of this modification was £0.47. The incremental fair value was measured as the difference between the fair value of the repriced share option and that of the original share option, both estimated as at the date of the modification. The incremental fair value is recognised as an expense over the remaining vesting period from the modification date.
Details of share option awards made are as follows:
|
|
Number of share options (000's) |
Weighted average exercise price (£) |
|
Outstanding at 31 December 2025 |
13,044 |
5.90 |
|
Granted |
4,034 |
6.79 |
|
Exercised |
(403) |
1.58 |
|
Forfeited |
(612) |
6.08 |
|
Outstanding at 30 June 2026 |
16,063 |
5.85 |
|
Exercisable at 30 June 2026 |
1,710 |
4.50 |
For the options exercised during H1 26, the weighted average share price at the date of exercise was £7.86 (H1 25: £7.34).
The options outstanding at 30 June 2026 had a weighted average remaining contractual life of 2.6 years (H1 25: 2.4 years) and a weighted average exercise price of £5.85 (H1 25: £5.20) per share.
The options were fair valued at the grant date using the Black Scholes option valuation model.
The inputs into the model were as follows:
|
|
H1 26 |
H1 25 |
|
Weighted average share price at grant date (£) |
7.13 |
7.89 |
|
Weighted average exercise price (£) |
6.79 |
8.13 |
|
Volatility (%) |
37.2% |
38.2% |
|
Weighted average vesting period (years) |
4.8 |
4.6 |
|
Risk free rate (%) |
4.3% |
4.1% |
|
Expected dividend yield (%) |
3.2% |
3.3% |
Expected volatility was determined by calculating the historic volatility of the Company's share price. The expected expense calculated in the model has been adjusted, based on management's best estimate, for the effects of non market-based performance conditions and employee attrition.
Reasonable changes in the above inputs do not have a material impact on the share-based payment charge in H1 26.
Employee Share Purchase Plan (‘ESPP’)
The Group operates an employee share purchase plan where the employees of the Group (excluding Partners) are eligible to contribute a percentage of their gross salary to purchase shares in the Company. The Company makes a matching award of shares that will vest over time dependent on continued employment.
During H1 26, the Company awarded 203,994 (H1 25: 202,139) matching shares on the basis of one matching share for every one employee share purchased during FY 25. The matching shares vest equally over a 5-year period with the first tranche vesting on 31 January 2027.
Details of ESPP awards made are as follows:
|
|
Number of ESPP awards (000's) |
|
Outstanding at 31 December 2025 |
409 |
|
Granted |
204 |
|
Vested and converted to shares |
(102) |
|
Forfeited |
(12) |
|
Outstanding at 30 June 2026 |
499 |
|
Exercisable at 30 June 2026 |
- |
15. Ordinary Dividends
The Company paid an interim Ordinary share dividend in respect of FY 25 of 7.6 pence per Ordinary Share on 24 February 2026.
The Board proposed a final Ordinary share dividend in respect of the financial year ended 31 December 2025 of 15.0 pence per Ordinary share, which was approved by shareholders at the Annual General Meeting in June 2026, and paid on 19 August 2026.
16. Cash Flow Information
Cash generated from operations:
|
|
H1 26 |
H1 25 |
|
|
£’000s |
£’000s |
|
Profit before taxation |
17,964 |
15,359 |
|
Adjustments for: |
|
|
|
Depreciation and amortisation |
4,481 |
2,377 |
|
Net finance expense |
2,228 |
578 |
|
Share-based payments |
2,495 |
2,129 |
|
Employment-related contingent consideration |
22 |
151 |
|
Increase in trade and other receivables |
(9,402) |
(4,409) |
|
Decrease in trade and other payables |
(9,086) |
(4,718) |
|
Foreign exchange losses/(gains) |
65 |
264 |
|
|
8,767 |
11,731 |
17. Related Party Disclosures
Related parties, following the definitions in IAS 24, are the Group's subsidiary companies, members of the Board, key management personnel and their families, and shareholders who have control or significant influence over the Group.
In H1 26, revenue includes £40,687 for services performed for Fish Hoek Company Investments Limited. Stephen Newton, a member of the Board, is a Director of Fish Hoek Company Investments Limited.
In H1 26, costs include £10,711 for purchases from Cape Point Wine (Pty) Ltd and £7,943 for purchases from The Alexander Accommodation (Pty) Ltd. Stephen Newton, a member of the Board, is a Director of Cape Point Wine (Pty) Ltd and The Alexander Accommodation (Pty) Ltd.
Within the shareholder loans disclosed in note 8, an amount of £413,142 is owed by Bill Michael as at 30 June 2026. This loan was advanced prior to Bill Michael’s appointment to the Board. During the period, £29,790 was repaid.
18. Events After the Reporting Date
On 19 August 2026 the Company paid the final Ordinary share dividend in respect of the financial year ended 31 December 2025. The amount paid of £7.5m represented 15.0 pence per Ordinary share.
As at 18 September 2026, in accordance with the Financial Conduct Authority's Disclosure and Transparency Rules, the Company continues to have 50,853,348 Ordinary shares in issue, of which none are held in Treasury. The total number of voting rights in the Company is 50,853,348. This figure of 50,853,348 may be used by shareholders in the Company as the denominator for the calculations by which they will determine if they are required to notify their interest in, or a change in their interest in, the share capital of the Company under the FCA's Disclosure and Transparency Rules.
RNS may use your IP address to confirm compliance with the terms and conditions, to analyse how you engage with the information contained in this communication, and to share such analysis on an anonymised basis with others as part of our commercial services. For further information about how RNS and the London Stock Exchange use the personal data you provide us, please see our Privacy Policy.

Latest directors dealings
- 19 minutes ago Eurocell
- 19 minutes ago Stelrad Group
- 47 minutes ago Jardine Matheson Holdings Ltd (Singapore Reg)
- 53 minutes ago Vodafone Group
- 4 hours ago Mcbride