
Results for the year ended 30 June 2026
Summary by AI BETAClose X

Bioventix plc
(“Bioventix” or “the Company”)
Results for the year ended 30 June 2026
Bioventix plc (BVXP), a UK company specialising in the development and commercial supply of high-affinity monoclonal antibodies for applications in clinical diagnostics, announces its audited results for the year ended 30 June 2026.
Highlights:
- Revenue down 0.8% to £13.0 million (2025: £13.1 million)
- Profit before tax up 1% to £10.2 million (2025: £10.1 million)
- Revenue £13.3m and PBT 10.5m on a constant currency basis (at average exchange rates for 2024/25)
- Tau/neuro royalties increased three-fold to £257k (2025: £75k)
- 5 Tau SMAs being produced at scale, 2 eMTBR SMAs moving into production Q4 CY 2026
- Cash at year end of £5.3 million (30 June 2025: £5.1 million)
- Second interim dividend of 80p per share (2025: 80p) total dividends 150p per share (2025: 150p)
Introduction
Our Technology and Business Model
Bioventix creates, manufactures and supplies high affinity sheep monoclonal antibodies (SMAs) for use in diagnostic applications. Bioventix antibodies are preferred for use when they confer an improved test performance compared to other available antibodies.
Most of our antibodies are used on blood-testing machines installed in hospitals and laboratories around the world. Bioventix creates antibodies using our SMA technology for supply to diagnostic companies for subsequent integration into reagent packs used on blood-testing machines in clinical settings across the world. These blood-testing machines are supplied by large multinational in vitro diagnostics (IVD) companies such as Roche Diagnostics, Siemens Healthineers, Abbott Diagnostics & Beckman Coulter. Antibody-based blood tests are currently used to help diagnose many different conditions including, amongst others, heart disease, thyroid function, fertility, infectious disease and cancer.
Testosterone is an example of a blood test where a Bioventix SMA facilitated an improved test. In 2003, it became clear that testosterone tests performed on automated IVD platforms were deficient. Whilst the higher levels of testosterone in healthy adult males were accurately reported, the lower levels of testosterone in pre-pubescent boys and women were inaccurately reported. In 2005, Bioventix created an antibody called testo3.6A3 which was evaluated by customers during 2006. Evaluations were successful and following the necessary regulatory approvals, the first testosterone assays based on testo3.6A3 were launched in 2009. A number of IVD companies still use this antibody for tests that more accurately measure lower levels of testosterone.
Over the past 20 years, we have created and supplied approximately 30 different SMAs that are used by IVD companies around the world in their blood test panels for diagnosis of various conditions including cardiac, thyroid, fertility and vitamin D deficiency. We currently sell a total of 15-20 grams of purified physical antibody per year which accounts for 25-33% of our annual revenue. In addition to revenues from these physical antibody supplies, the sale by our customers of diagnostic products (based on our antibodies) to their downstream end-users attracts a modest percentage royalty payable to Bioventix. These downstream royalties currently account for the remaining 67-75% of our annual revenue.
Bioventix adopts different commercial and scientific approaches when creating new antibodies. The first is own-risk antibody creation projects prompted by our evaluation of the need and commercial use opportunity for an antibody; this provides Bioventix with the complete freedom to commercialise the antibodies produced. The second approach is contract antibody creation projects prompted by, and in partnership with, customers who supply materials, know-how and funding to create antibodies that can only be commercialised with the partner company. More recently our third approach, to product development, has been through collaborative research. In the increasingly significant field of neurological conditions, this approach has become important and is exemplified by our work on Alzheimer’s blood tests with the University of Gothenburg. Considerable progress has been made in the treatment of Alzheimer’s patients with newly approved and licensed therapeutics. The consequent need and opportunity for diagnostics in this area is substantiated by the activity of, and considerable investment being made by, major pharmaceutical companies in the specialism and there are currently 350 drugs undergoing trial with 20% of those Phase III trials. We anticipate that collaboration with academic researchers will play an increasingly important role in the identification and subsequent creation of SMAs for use in diagnosing neurological conditions and the development by IVD manufacturers of neurological panels of assays for their customers.
In all cases, after initiation of a new project, it takes around a year for our scientists to create a panel of purified antibodies for evaluation by our customers or academic partners. The evaluation process at their laboratories generally requires the fabrication of prototype tests which can be compared to other tests, for example the customer’s existing commercial test or perhaps another “gold standard” method, on the assay machine platform being considered. The process of subsequent development thereafter by our customers can take many years before registration or approval from the relevant authority. Only once approval from the US Food and Drug Administration (FDA) or EU authorities is obtained can products then be sold to the benefit of the customers, and of course Bioventix, through the agreed sales royalty. This does mean that there is a lead time of 4-10 years between our own research work and the receipt by Bioventix of royalty revenue from product sales. However, because of the resource required to gain such approvals, after having achieved approval for an accurate diagnostic test using a Bioventix antibody, there is a natural incentive for continued antibody use. This results in a significant barrier to entry for potential replacement antibodies which would require at least partial repetition of the approval process arising on a change from one antibody to another. This barrier to antibody replacement arises from a combination of factors driven by the clinical criticality of the test and the potential consequences of making such a change which include the time and cost to register any changes required to validate the performance of the replacement antibody.
Another consequence of the lengthy approval process is that the revenue for the current accounting period is derived largely from antibodies created many years ago.
In the fast-moving field of neurological assays, this dynamic has evolved with the relatively rapid launch of “research use only” (RuO) products not only by our historic customers but also by newer high sensitivity platform companies who have now become customers.
2025/2026 Financial Results
Bioventix continues to evolve from the generation of value from our historical product portfolio of core antibodies into a business with increasing expertise and reach in the creation of antibodies for application in the diagnosis of a range of neurological conditions and diseases. Total revenues for the year of £13 million were similar to the previous reporting period (2024/25: £13.1 million) and slightly ahead of market expectations. Profits after tax at £7.6 million were also similar to last year (2024/25: £7.6million) and again ahead of expectation. Cash balances at the year-end were £5.3 million (30 June 2025 £5.1 million).
These results reflect the growing importance of neurology in our product portfolio with royalty revenues from our Tau/neuro SMAs increasing from £75k in 2024/25 to £257k for 2025/26. The three-fold increase in Tau/neuro royalty revenues has been driven by increased use of our antibodies in research use only (RuO) assays at three of the newer high sensitivity platform companies active in Alzheimer’s diagnostics. We expect these royalties to increase further as our historic customer base of established IVD companies (e.g. Roche, Siemens, Beckman, Abbott, Mindray, Fujirebio) launch p-Tau217 assays, not only RuO assays in research settings but also, in time, assays for routine clinical use on their platforms, we believe some of these assays will feature Bioventix SMAs.
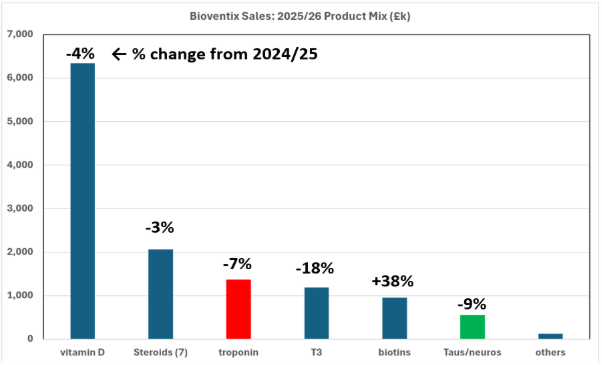
Within our historic core business, vitamin D continues to be very important and sales of vitD3.5H10 decreased by 4% to £6.35 million due to a difficult downstream market, in particular in China.
We have explained previously that important aspects of the Chinese commercial landscape are changing. The “China First” policy, Chinese Central Government procurement strategy and increased activity from local Chinese antibody suppliers remain significant factors. Our sales to Chinese customers have reduced slightly in 2025/26 and, whilst we would anticipate a continuing diminution in revenue from these customers, we anticipate China will continue to be a significant source of revenue in future years.
Troponin sales for the year were c.£1.4 million in line with 2024/25 and we have not yet seen any impact from an increased use of troponin testing as part of monitoring patients who had previously suffered a cardiac event. As previously disclosed, Siemens troponin revenues will terminate for contractual reasons in June 2032.
The sales portfolio mix for 2025/26 appears below together with the increase/decrease (+/-) in sales compared to the previous year 2024/25:
In addition to the impact of external factors such as dynamics in the Chinese market there will also be changes reflecting our historic commercial structure and success built on supply and royalty contracts with lifetimes of between 10 and 15 years from the first use of our antibodies by our customers. One such contract for a progesterone antibody terminated in 2025/26 and the annual sales of approximately £400k will therefore not be in our revenue in future.
We estimate that 50-60% of our total sales are directly linked to US Dollars either directly through physical product pricing in US Dollars or indirectly linked to US Dollars through royalties based on downstream US Dollar sales. The remainder of the currency split is dominated by Euros and important Asian currencies. Currency effects in the financial year reduced turnover on a constant currency basis by approximately £300k. In addition, there was also a gain of approximately £62k due to favourable currency movements between invoicing and settlement. Our view continues to be that hedging mechanisms would not, in the longer term, add value and may have the potential to add risk to our business. Consequently, future movements in exchange rates may therefore affect our Sterling revenues.
Cash Flows and Dividends
The business generated c £8 million of cash during the year of which almost all was returned to shareholders as dividends. The business retained cash balances at the year-end of £5.3 million and royalties received, in respect of the second half of 2025/26, during July to September of 2026 have added to this balance.
In consideration of our established dividend policy and the available cashflows, the Board is pleased to announce a second interim dividend of xx pence per share which, when added to the first interim dividend of 70 pence per share makes a total of 150 pence per share for the current year.
Accordingly, a dividend of 80 pence per share will be paid in November 2026. The shares will be marked ex-dividend on 5 November 2026 and the dividend will be paid on 20 November 2026 to shareholders on the register at close of business on 6 November 2026.
Research and Future Developments
A significant scientific development during the year has been the emergence of “eMTBR-Tau” immunoassays from Alamar Biosciences and Spear Bio. Whilst p-Tau217 tracks AD through early amyloid pathology and later Tau tangle pathology, eMTBR-Tau is more specific for later stage disease caused by Tau tangles. eMTBR-Tau assays could therefore be useful to confirm clinical assessment of cognition in later stage disease. In addition, eMTBR-Tau could be helpful in ruling out candidates for clinical trials and future therapeutic options.
We believe we have made excellent eMTBR SMAs and are delighted to have played our part in the eMTBR-Tau discovery process.
The overall response from customers to our various Tau evaluation samples of SMAs supplied for RuO assays has been positive and we are encouraged by our growing footprint in these areas.
We have previously described how neuroscientists use the Amyloid, Tau, Neurological degeneration (“A/T/N”) framework to define the AD pathway and the blood-based biomarker tests being developed to supplement or replace more expensive, low throughput brain scans. Our footprint in the field is described in the table below.
Alzheimer’s SMAs commercialisation
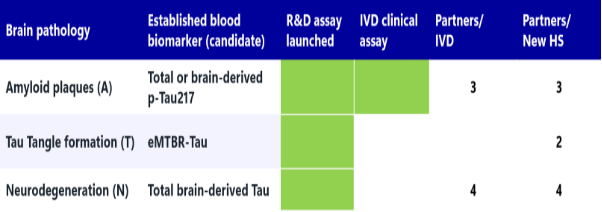
“Partners” have either launched an RuO or IVD assay or we believe have imminent plans to launch an assay that uses at least one SMA
“Partners/IVD” a top 10 global IVD company
“New HS” a newer high sensitivity platform company
Following the success above, we now have five Tau antibodies being made at scale in our manufacturing facility. In addition to this, two newer eMTBR antibodies are currently moving into large scale production. This demonstrates the significant momentum in our neurology opportunity.
In addition to the Tau/neuro commercial developments above, our research continues and we are making new antibodies that could feature in additional blood tests to better assess neurological diseases. In addition to Alzheimer’s disease, we have projects running in the field of vascular dementia, rarer dementias and peripheral neuropathies.
Bioventix has been working with the University of Gothenburg since early 2020 to create new antibodies to Tau and to develop prototype assays for use in Alzheimer’s disease. This collaboration has been a key to our growing success in this field, and we plan to continue our work with this world-leading research facility into the future. The view of many neurological opinion leaders, shared by our IVD customers, is that blood-testing machines will soon offer a panel of new neurological tests that will reveal information about patient brain health which will be useful for screening and therapy monitoring purposes.
Whilst not of the same potential value as our activities in neurology diagnostics, we have continued our work on sewage contamination of rivers and lakes. We hope to have a lateral flow assay for paracetamol before the year end which is intended to calibrate to 0.1-1.0% of raw sewage contamination in “fresh” waters. We plan to work with volunteer groups to conduct field trials aimed at better understanding the link between paracetamol levels and Escherichia coli (“E.coli”), a significant concern for sewage contamination in waterways.
Pre-Diagnostics (in Oslo) and their clinical collaborators have two amyloid beta assays based on Bioventix antibodies available for research use. A current focus for Pre-Diagnostics is ARIA (amyloid related imaging abnormality) which is an important side-effect of new anti-amyloid drugs for Alzheimer’s. Pre-Diagnostics assays relate to amyloid metabolism and could help screen for ARIA vulnerable patients, before or during treatment.
Our pyrene lateral flow system for industrial pollution biomonitoring is proceeding steadily as planned. We plan to continue field trials with firefighters during 2027.
Future Strategy
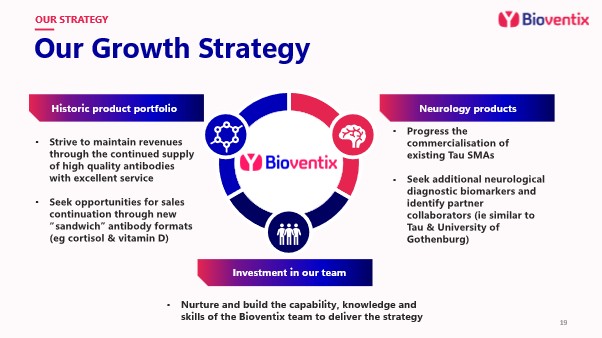
Our historic core business has continued to perform well and we will strive to maintain revenues through the continued supply of high-quality SMAs accompanied by excellent customer service and response. We believe that any new opportunities, outside of our neurology related work, are likely to come from our new “sandwich” formats for small molecules. We have had some encouraging customer feedback from a cortisol sandwich pair and this has prompted us to create a similar sandwich format for our vitamin D product offering.
The next few years will be exciting for our emerging Tau/neuro SMAs. We plan to develop our neurological pipeline further through our on-going collaboration with the University of Gothenburg. In addition, as the frontier of neuroscience and the blood-based biomarker field evolves, we will seek additional opportunities that may emerge from other collaborators in this rapidly developing area.
The success of our business is closely linked to the dedication, hard work and skill of our team of scientists and support staff. We will continue to nurture and invest in the team to build both our and their skills, knowledge and capabilities.
The Bioventix Team and Facility
The composition of the Bioventix team remains at 12 full-time equivalents (14 staff in total). During the year one long serving employee retired and we recruited an additional graduate. This level of stability has formed an excellent base upon which we have been able to build our new products moving into the exciting new areas described above. We are very fortunate to have such a dedicated and loyal team and we are grateful to them for their continued enthusiastic input and support.
Conclusion and Outlook
This year has been particularly noteworthy as our historic core business has faced some challenges in downstream markets, particularly in China. Despite these headwinds, we have delivered a marginally better set of results whilst maintaining dividend levels and a healthy cash balance, demonstrating the robustness of the business.
Meanwhile, our research and commercialisation of antibodies in the field of neurology have yielded significant progress. The vision of our customers for growth in this exciting field together with the performance of our antibodies at many of our customers points to future success in this area.
We expect that the year to 30 June 2027 will follow a similar pattern to this year. Revenue generation from our historic core business will be subject to headwinds and be replaced and increasingly augmented by sales from our growing Tau and neurology portfolio of antibodies. Longer term we expect the neurology portfolio to deliver growth to offset the challenges that our legacy antibodies will continue to face. The timing of that growth is difficult to forecast but our level of confidence in the opportunity is undiminished.
|
P Harrison Chief Executive Officer |
I J Nicholson Non‑Executive Chairman |
|
|
|
|
For further information please contact:
|
|
STATEMENT OF COMPREHENSIVE INCOME
FOR THE YEAR ENDED 30 JUNE 2026

|
|
2026 |
2025 | |
|
Note |
£ |
£ | |
|
|
|
|
|
|
Turnover |
4 |
12,971,744 |
13,115,869 |
|
Cost of sales |
|
(1,109,210) |
(1,198,877) |
|
Gross profit |
|
11,862,534 |
11,916,992 |
|
Administrative expenses |
|
(2,042,493) |
(2,051,446) |
|
Difference on foreign exchange |
|
62,410 |
(170,006) |
|
Research and development tax credit |
|
291,636 |
297,249 |
|
Share option charge |
|
(86,648) |
(89,223) |
|
Operating profit |
5 |
10,087,439 |
9,903,566 |
|
Interest receivable and similar income |
8 |
140,125 |
192,349 |
|
Interest payable and expenses |
9 |
(140) |
- |
|
Profit before tax |
|
10,227,424 |
10,095,915 |
|
Tax on profit |
10 |
(2,612,771) |
(2,511,473) |
|
Profit for the financial year |
|
7,614,653 |
7,584,442 |
|
|
|
|
|
|
Total comprehensive income for the year |
|
7,614,653 |
7,584,442 |
|
The notes on pages 21 to 37 form part of these financial statements.
| |||
|
|
Earnings per share:
| ||
|
|
|
2026 |
2025 |
|
|
|
|
|
|
|
Basic (pence per share)
|
145.74
|
145.27
|
|
|
Diluted (pence per share)
|
143.62
|
143.35
|
STATEMENT OF FINANCIAL POSITION
AS AT 30 JUNE 2026
|
|
|
2026 |
|
2025 | |
|
Note |
|
£ |
|
£ | |
|
Fixed assets |
|
|
|
|
|
|
Tangible assets |
12 |
|
429,903 |
|
404,357 |
|
Investments |
13 |
|
426,733 |
|
426,733 |
|
|
|
|
856,636 |
|
831,090 |
|
Current assets |
|
|
|
|
|
|
Stocks |
14 |
707,045 |
|
689,404 |
|
|
Debtors: amounts falling due within one year |
15 |
5,998,601 |
|
6,263,980 |
|
|
Cash at bank and in hand |
16 |
5,264,706 |
|
5,079,295 |
|
|
|
|
11,970,352 |
|
12,032,679 |
|
|
Creditors: amounts falling due within one year |
17 |
(1,404,106) |
|
(1,312,052) |
|
|
Net current assets |
|
|
10,566,246 |
|
10,720,627 |
|
Total assets less current liabilities |
|
|
11,422,882 |
|
11,551,717 |
|
Creditors: amounts falling due after more than one year |
|
|
(7,154) |
|
- |
|
|
|
|
|
|
|
|
Net assets |
|
|
11,415,728 |
|
11,551,717 |
|
|
|
|
|
|
|
|
Capital and reserves |
|
|
|
|
|
|
Called up share capital |
20 |
|
261,243 |
|
261,243 |
|
Share premium account |
21 |
|
1,541,309 |
|
1,541,309 |
|
Capital redemption reserve |
21 |
|
1,231 |
|
1,231 |
|
Profit and Loss Account |
21 |
|
9,611,945 |
|
9,747,934 |
|
|
|
|
11,415,728 |
|
11,551,717 |
|
|
|
|
|
|
|
The financial statements were approved and authorised for issue by the board and were signed on its behalf on
|
Director |
The notes on pages 21 to 37 form part of these financial statements.
STATEMENT OF CHANGES IN EQUITY
FOR THE YEAR ENDED 30 JUNE 2026
|
|
Called up share capital |
Share premium account |
Capital redemption reserve |
Profit and loss account |
Total equity |
|
|
£ |
£ |
£ |
£ |
£ |
|
At 1 July 2025 |
261,243 |
1,541,309 |
1,231 |
9,747,934 |
11,551,717 |
|
Comprehensive income for the year |
|
|
|
|
|
|
Profit for the year
|
-
|
-
|
-
|
7,614,653
|
7,614,653
|
|
Other comprehensive income for the year |
- |
- |
- |
- |
- |
|
Total comprehensive income for the year |
- |
- |
- |
7,614,653 |
7,614,653 |
|
Contributions by and distributions to owners |
|
|
|
|
|
|
Dividends: Equity capital |
- |
- |
- |
(7,837,290) |
(7,837,290) |
|
Share option charge |
- |
- |
- |
86,648 |
86,648 |
|
Total transactions with owners |
- |
- |
- |
(7,750,642) |
(7,750,642) |
|
At 30 June 2026 |
261,243 |
1,541,309 |
1,231 |
9,611,945 |
11,415,728 |
|
|
|
|
|
|
|
|
The notes on pages 21 to 37 form part of these financial statements. |
STATEMENT OF CHANGES IN EQUITY
FOR THE YEAR ENDED 30 JUNE 2025
|
|
Called up share capital |
Share premium account |
Capital redemption reserve |
Profit and loss account |
Total equity |
|
|
£ |
£ |
£ |
£ |
£ |
|
At 1 July 2024 |
260,983 |
1,471,315 |
1,231 |
10,269,129 |
12,002,658 |
|
Comprehensive income for the year |
|
|
|
|
|
|
Profit for the year
|
-
|
-
|
-
|
7,584,442
|
7,584,442
|
|
Other comprehensive income for the year |
- |
- |
- |
- |
- |
|
Total comprehensive income for the year |
- |
- |
- |
7,584,442 |
7,584,442 |
|
Contributions by and distributions to owners |
|
|
|
|
|
|
Dividends: Equity capital |
- |
- |
- |
(8,194,860) |
(8,194,860) |
|
Shares issued during the year |
260 |
69,994 |
- |
- |
70,254 |
|
Share option charge |
- |
- |
- |
89,223 |
89,223 |
|
Total transactions with owners |
260 |
69,994 |
- |
(8,105,637) |
(8,035,383) |
|
At 30 June 2025 |
261,243 |
1,541,309 |
1,231 |
9,747,934 |
11,551,717 |
|
|
|
|
|
|
|
|
The notes on pages 21 to 37 form part of these financial statements. |
STATEMENT OF CASH FLOWS
FOR THE YEAR ENDED 30 JUNE 2026
|
|
|
|
2026 |
2025 |
|
|
|
|
£ |
£ |
|
Cash flows from operating activities |
|
| ||
|
Profit for the financial year |
7,614,653 |
7,584,442 | ||
|
Adjustments for: |
|
| ||
|
Depreciation of tangible assets |
57,023 |
92,829 | ||
|
Interest paid |
140 |
- | ||
|
Interest received |
(140,125) |
(192,349) | ||
|
Taxation charge |
2,612,771 |
2,511,473 | ||
|
(Increase) in stocks |
(17,641) |
(74,059) | ||
|
Decrease/(increase) in debtors |
261,853 |
(34,105) | ||
|
Increase/(decrease) in creditors |
223,196 |
(98,131) | ||
|
Corporation tax (paid) |
(2,744,203) |
(2,847,536) | ||
|
Share option charge |
86,648 |
89,223 | ||
|
Net cash generated from operating activities
|
7,954,315
|
7,031,788
| ||
|
|
|
| ||
|
Cash flows from investing activities |
|
| ||
|
Purchase of tangible fixed assets |
(71,599) |
(19,189) | ||
|
Interest received |
140,125 |
192,349 | ||
|
Net cash from investing activities
|
68,526
|
173,160
| ||
|
Cash flows from financing activities |
|
| ||
|
Issue of ordinary shares |
- |
70,254 | ||
|
Interest paid |
140 |
- | ||
|
Dividends paid |
(7,837,290) |
(8,194,860) | ||
|
Net cash used in financing activities |
(7,837,430) |
(8,124,606) | ||
|
Net increase/(decrease) in cash and cash equivalents |
185,411 |
(919,658) | ||
|
Cash and cash equivalents at beginning of year |
5,079,295 |
5,998,953 | ||
|
Cash and cash equivalents at the end of year |
5,264,706 |
5,079,295 | ||
|
Cash and cash equivalents at the end of year comprise: |
|
| ||
|
Cash at bank and in hand |
5,264,706 |
5,079,295 | ||
|
|
5,264,706 |
5,079,295 | ||
|
|
|
| ||
|
The notes on pages 21 to 37 form part of these financial statements.
|
ANALYSIS OF NET DEBT
FOR THE YEAR ENDED 30 JUNE 2026
|
|
|
|
|
|
|||||
|
|
At 1 July 2025 |
Cash flows |
New finance leases |
At 30 June 2026 |
|||||
|
|
£
|
£
|
£
|
£
|
|||||
|
Cash at bank and in hand
|
5,079,295
|
185,411
|
-
|
5,264,706
| |||||
|
Finance leases due within 1 year
|
-
|
-
|
(3,816)
|
(3,816)
| |||||
|
Finance leases due in more that one year |
|
|
(7,154) |
(7,154) | |||||
|
|
5,079,295 |
185,411 |
(10,970) |
5,253,736 | |||||
|
The notes on pages 21 to 37 form part of these financial statements. |
|
1.
|
NOTES TO THE FINANCIAL STATEMENTS FOR THE YEAR ENDED 30 JUNE 2026
General information
|
Bioventix Plc (04923945) is a public limited company registered in England and Wales. The Registered Office is 27‑28 Eastcastle Street, London, W1W 8DH.
2. Accounting policies
|
|
2.1
|
Basis of preparation of financial statements
|
The financial statements have been prepared under the historical cost convention unless otherwise specified within these accounting policies and in accordance with Financial Reporting Standard 102, the Financial Reporting Standard applicable in the UK and the Republic of Ireland (September 2024) (‘FRS 102’) and the Companies Act 2006.
The company has elected to early adopt the amendments to FRS102 arising from the Periodic Review 2024, as incorporated into the September 2024 edition of FRS102. These amendments are otherwise effective for accounting periods beginning on or after 1 January 2026.
The amendments have been applied in accordance with the applicable transitional provisions of FRS102. The adoption of the amendments has not had a material impact on the amounts recognised in the financial statements nor have they impacted the comparative year.
The financial statements have been prepared on a going concern basis. The directors have assessed the company’s ability to continue as a going concern and have no material uncertainties in this regard.
The figures in the accounts have been rounded to the nearest £1.
The preparation of financial statements in compliance with FRS 102 requires the use of certain critical accounting estimates. It also requires management to exercise judgment in applying the Company's accounting policies (see note 3).
The following principal accounting policies have been applied:
|
|
2.2 |
Revenue |
Revenue is recognised when control of the promised goods or services is transferred to the customer in an amount that reflects the consideration to which the company expects to be entitled in exchange for those goods or services. Revenue excludes value added tax and is stated net of discounts, rebates and other sales taxes. The company applies the five-step model set out in Section 23 of FRS 102 to determine when revenue should be recognised.
The company recognises revenue by:
- Identifying the contract with a customer;
- Identifying the performance obligations within the contract;
- Determining the transaction price;
- Allocating the transaction price to the performance obligations; and
- Recognising revenue when, or as, the performance obligations are satisfied.
Licence fees
Annual licence fee revenue is recognised, in full, when the control of the licence is given over to the licensee.
Royalties
Royalties are accrued over the period to which they relate and revenue is recognised based upon returns
and notifications received from customers. In the event that subsequent adjustments to royalties are identified they are recognised in the period in which they are identified.
Direct sales
Direct sales are generally recognised at the date of dispatch unless contractual terms with customers state that risk and title pass on delivery of goods, in which case revenue is recognised on delivery.
R&D income
Subcontracted R&D income is recognised based upon the stage of completion at the year‑end.
|
|
2.3
|
Foreign currency translation
|
Functional and presentation currency
The Company's functional and presentational currency is GBP.
Transactions and balances
Foreign currency transactions are translated into the functional currency using the spot exchange rates at the dates of the transactions.
At each period end foreign currency monetary items are translated using the closing rate. Non‑monetary items measured at historical cost are translated using the exchange rate at the date of the transaction and non‑monetary items measured at fair value are measured using the exchange rate when fair value was determined.
|
|
2.4
|
Right of use assets
|
The company recognises a right-of-use asset and a corresponding lease liability at the commencement date of a lease.
The right-of-use asset is initially measured at cost, comprising:
- the amount of the initial measurement of the lease liability;
- any lease payments made at or before the commencement date less any lease incentives received;
- any initial direct costs incurred; and
- an estimate of costs to be incurred in dismantling and removing the underlying asset or restoring the site on which it is located, where applicable.
Subsequent to initial recognition, right-of-use assets are measured at cost less accumulated depreciation and accumulated impairment losses.
Right-of-use assets are depreciated on a straight-line basis over the shorter of the lease term and the useful economic life of the underlying asset. Where ownership of the underlying asset transfers to the company by the end of the lease term, or the cost of the right-of-use asset reflects that the company will exercise a purchase option, depreciation is charged over the useful economic life of the underlying asset.
|
|
2.5
|
Interest income
|
Interest income is recognised in profit or loss using the effective interest method.
|
|
2.6
|
Finance costs
|
Finance costs are charged to profit or loss over the term of the debt using the effective interest method so that the amount charged is at a constant rate on the carrying amount. Issue costs are initially recognised as a reduction in the proceeds of the associated capital instrument.
|
|
2.7
|
Pensions
|
Defined contribution pension plan
The Company operates a defined contribution plan for its employees. A defined contribution plan is a pension plan under which the Company pays fixed contributions into a separate entity. Once the contributions have been paid the Company has no further payment obligations.
The contributions are recognised as an expense in profit or loss when they fall due. Amounts not paid are shown in accruals as a liability in the Statement of financial position. The assets of the plan are held separately from the Company in independently administered funds.
|
|
2.8
|
Current and deferred taxation
|
Current and deferred tax are recognised as an expense or income in the Statement of Comprehensive Income, except when they relate to items credited or debited directly to equity, in which case the tax is also recognised directly in equity. The current income tax charge is calculated on the basis of tax rates and laws that have been enacted or substantively enacted by the reporting date in the countries where the Company operates and generates income.
Deferred tax balances are recognised in respect of all timing differences that have originated but not reversed by the reporting date, except that:
-
The recognition of deferred tax assets is limited to the extent that it is probable that they will be recovered against the reversal of deferred tax liabilities or other future taxable profits; and
- Any deferred tax balances are reversed if and when all conditions for retaining associated tax allowances have been met.
Deferred tax balances are not recognised in respect of permanent differences except in respect of business combinations, when deferred tax is recognised on the differences between the fair values of assets acquired and the future tax deductions available for them and the differences between the fair values of liabilities acquired and the amount that will be assessed for tax. Deferred tax is determined using tax rates and laws that have been enacted or substantively enacted by the reporting date.
|
|
2.9 |
Research and development |
Research and development expenditure is written off in the year in which it is incurred.
|
|
2.10
|
Tangible fixed assets
|
Tangible fixed assets under the cost model are stated at historical cost less accumulated depreciation and any accumulated impairment losses. Historical cost includes expenditure that is directly attributable to bringing the asset to the location and condition necessary for it to be capable of operating in the manner intended by management.
Land is not depreciated. Depreciation on other assets is charged so as to allocate the cost of assets less their residual value over their estimated useful lives, as follows:
|
|
|
|
|
Freehold property |
‑ |
2% |
straight line |
|
|
|
|
|
Plant & machinery |
‑ |
15% |
straight line |
|
|
|
|
|
Motor Vehicles |
‑ |
25% |
straight line |
|
|
|
|
|
Fixtures & Fittings |
‑ |
15% |
straight line |
|
|
|
|
|
Office equipment |
‑ |
25% |
straight line |
|
|
|
|
|
Right of use assets |
- |
33% |
straight line |
|
|
2.11
|
Valuation of investments
|
Investments in unlisted company shares, whose market value can be reliably determined, are remeasured to market value at each reporting date. Gains and losses on remeasurement are recognised in the Statement of comprehensive income for the period. Where market value cannot be reliably determined, such investments are stated at historic cost less impairment.
|
|
2.12 |
Stocks |
Stocks are stated at the lower of cost and net realisable value, being the estimated selling price less costs to complete and sell. Cost includes all direct costs and an appropriate proportion of fixed and variable overheads.
At each balance sheet date, stocks are assessed for impairment. If stock is impaired, the carrying amount is reduced to its selling price less costs to complete and sell. The impairment loss is recognised immediately in profit or loss.
|
|
2.13
|
Debtors
|
Short‑term debtors are measured at transaction price, less any impairment. Loans receivable are measured initially at fair value, net of transaction costs, and are measured subsequently at amortised cost using the effective interest method, less any impairment.
|
|
2.14
|
Cash and cash equivalents
|
Cash is represented by cash in hand and deposits with financial institutions repayable without penalty on notice of not more than 24 hours. Cash equivalents are highly liquid investments that mature in no more than twelve months from the date of acquisition and that are readily convertible to known amounts of cash with insignificant risk of change in value.
In the Statement of cash flows, cash and cash equivalents are shown net of bank overdrafts that are
repayable on demand and form an integral part of the Company's cash management.
|
|
2.15
|
Creditors
|
Short‑term creditors are measured at the transaction price. Other financial liabilities, including bank loans, are measured initially at fair value, net of transaction costs, and are measured subsequently at amortised cost using the effective interest method.
|
|
2.16
|
Provisions for liabilities
|
Provisions are recognised when an event has taken place that gives rise to a legal or constructive obligation, a transfer of economic benefits is probable and a reliable estimate can be made.
Provisions are measured as the best estimate of the amount required to settle the obligation, taking into account the related risks and uncertainties.
Increases in provisions are generally charged as an expense to profit or loss.
|
|
2.17
|
Financial instruments
|
The Company has elected to apply the provisions of Section 11 “Basic Financial Instruments” of FRS 102 to all of its financial instruments.
Basic financial assets
Basic financial assets, which include trade and other debtors, cash and bank balances, are initially measured at their transaction price including transaction costs and are subsequently carried at their amortised cost using the effective interest method, less any provision for impairment, unless the arrangement constitutes a financing transaction, where the transaction is measured at the present
value of the future receipts discounted at a market rate of interest.
Discounting is omitted where the effect of discounting is immaterial. The Company's cash and cash equivalents, trade and most other receivables due within the operating cycle fall into this category of financial instruments.
Financial liabilities
Financial liabilities and equity instruments are classified according to the substance of the contractual arrangements entered into. An equity instrument is any contract that evidences a residual interest in the assets of the Company after the deduction of all its liabilities.
Basic financial liabilities, which include trade and other creditors, bank loans and other loans are initially measured at their transaction price after transaction costs. When this constitutes a financing transaction, the debt instrument is measured at the present value of the future payments discounted at a market rate of interest. Discounting is omitted where the effect of discounting is immaterial.
Debt instruments are subsequently carried at their amortised cost using the effective interest rate method.
Trade payables are obligations to pay for goods and services that have been acquired in the ordinary course of business from suppliers. Trade payables are classified as current liabilities if the payment is due within one year. If not, they represent non‑current liabilities. Trade payables are initially recognised at their transaction price and subsequently are measured at amortised cost using the effective interest method. Discounting is omitted where the effect of discounting is immaterial.
|
|
2.18
|
Dividends
|
Equity dividends are recognised when they become legally payable. Interim equity dividends are recognised when paid. Final equity dividends are recognised when approved by the shareholders at an annual general meeting.
|
|
2.19 |
Employee benefits‑share‑based compensation |
The Company operates an equity‑settled, share‑based compensation plan. The fair value of the employee services received in exchange for the grant of the options is recognised as an expense over the vesting period. The total amount to be expensed over the vesting period is determined by reference to the fair value of the options granted. At each balance sheet date, the Company will revise its estimates of the number of options expected to be exercisable. It will recognise the impact of the revision of original estimates, if any, in the profit and loss account, with a corresponding adjustment to equity. The proceeds received net of any directly attributable transaction costs are credited to share capital (nominal value) and share premium when the options are exercised.
|
3.
|
Judgments in applying accounting policies and key sources of estimation uncertainty
|
In the application of the Company's accounting policies (as described in note 2), management is required to make judgments, estimates and assumptions. These estimates and underlying assumptions are reviewed on an ongoing basis.
Carrying value of unlisted investments
The Company holds two unlisted investments in companies carrying out research in identifying biomarkers for diagnosing health conditions. The directors have continued to review the progress of this research over the last year.
In common with much scientific research, there is uncertainty, both in relation to the science and to the commercial outcomes, and no information to reliably calculate a fair value for these investments.
An impairment provision against the value of the investment in shares of CardiNor AS was made in the year to 30 June 2024.
The carrying value of the other investment in Pre Diagnostics will continue to be the historic cost of £426,733.(2025: £426,733)
Royalty revenue accrual
The Company is notified and receives royalty revenue from one customer on a calendar year basis annually in arrears; it is therefore necessary to estimate this revenue for the first six months of the calendar year and to process an accrual of £200,000 (2025: £323,000) in respect of it.
|
4.
|
Turnover
| |||||
|
|
An analysis of turnover by class of business is as follows:
| |||||
|
|
|
|
|
|
2026 |
2025 |
|
|
|
|
|
|
£ |
£ |
|
|
Product revenue and R&D income |
4,138,064 |
4,163,845 | |||
|
|
Royalty and licence fee income |
8,833,680 |
8,952,024 | |||
|
|
|
12,971,744 |
13,115,869 | |||
|
|
|
|
| |||
|
|
|
|
|
|
2026 |
2025 |
|
|
|
|
|
|
£ |
£ |
|
|
United Kingdom |
742,785 |
798,661 | |||
|
|
Other EU |
1,507,180 |
1,640,397 | |||
|
|
Rest of the world |
10,721,779 |
10,676,811 | |||
|
|
|
12,971,744 |
13,115,869 | |||
|
|
|
|
| |||
|
5.
|
Operating profit
| |||||
|
|
The operating profit is stated after charging:
| |||||
|
|
|
|
|
|
2026 |
2025 |
|
|
|
|
|
|
£ |
£ |
|
|
Depreciation of tangible fixed assets |
57,023 |
92,829 | |||
|
|
Fees payable to the Company's auditor for the audit of the Company's annual financial statements |
36,000 |
34,500 | |||
|
|
Exchange differences |
(62,410) |
170,006 | |||
|
|
Research and development costs |
1,458,180 |
1,486,245 | |||
|
6.
|
Employees
| |||||
|
|
Staff costs, including directors' remuneration, were as follows:
| |||||
|
|
|
|
|
|
2026 |
2025 |
|
|
|
|
|
|
£ |
£ |
|
|
Wages and salaries |
1,184,678 |
1,152,613 | |||
|
|
Social security costs |
155,384 |
147,097 | |||
|
|
Share option charge |
86,648 |
89,223 | |||
|
|
Cost of defined contribution scheme |
95,876 |
91,942 | |||
|
|
|
1,522,586 |
1,480,875 | |||
|
|
|
|
| |||
|
|
The average monthly number of employees, including the directors, during the year was as follows:
| ||||
|
|
|
|
2026 |
2025 | |
|
|
|
|
No. |
No. | |
|
|
|
|
|
| |
|
|
|
Management and administration |
4 |
5 | |
|
|
|
Scientific |
12 |
11 | |
|
|
|
|
|
| |
|
|
|
|
16 |
16 | |
|
7.
|
Directors' remuneration
| |||||
|
|
|
|
|
|
2026 |
2025 |
|
|
|
|
|
|
£ |
£ |
|
|
Directors' emoluments |
510,316 |
523,004 | |||
|
|
Company contributions to defined contribution pension schemes |
55,328 |
47,984 | |||
|
|
|
565,644 |
570,988 | |||
|
|
|
|
| |||
|
|
During the year retirement benefits were accruing to 2 directors (2025 ‑ 2) in respect of defined contribution pension schemes.
| |||||
|
|
The highest paid director received remuneration of £367,368 (2025 ‑ £317,845).
| |||||
|
|
The value of the Company's contributions paid to a defined contribution pension scheme in respect of the highest paid director amounted to £51,431 (2025 ‑ £44,498).
| |||||
|
8.
|
Interest receivable
| |||||
|
|
|
|
|
|
2026 |
2025 |
|
|
|
|
|
|
£ |
£ |
|
|
Other interest receivable |
140,125 |
192,349 | |||
|
9.
|
Interest payable and similar expenses
| |||||
|
|
|
|
|
|
2026 |
2025 |
|
|
|
|
|
|
£ |
£ |
|
|
Finance leases and hire purchase contracts |
140 |
- | |||
|
|
|
140 |
- | |||
|
10.
|
Taxation | |||||
|
|
| |||||
|
|
|
|
|
|
2026 |
2025 |
|
|
|
|
|
|
£ |
£ |
|
|
Corporation tax |
|
| |||
|
|
Current tax on profits for the year |
2,580,341 |
2,554,501 | |||
|
|
Adjustments in respect of previous periods |
28,904 |
(25,071) | |||
|
|
Total current tax |
2,609,245 |
2,529,430 | |||
|
|
Deferred tax |
|
| |||
|
|
Origination and reversal of timing differences |
3,526 |
(17,957) | |||
|
|
|
|
| |||
|
|
Taxation on profit on ordinary activities |
2,612,771 |
2,511,473 | |||
|
|
Factors affecting tax charge for the year
| |||||
|
|
The tax assessed for the year is higher than (2025 ‑ lower than) the standard rate of corporation tax in the UK of 25% (2025 ‑ 25%). The differences are explained below:
| |||||
|
|
|
|
|
|
2026 |
2025 |
|
|
|
|
|
|
£ |
£ |
|
|
Profit on ordinary activities before tax |
10,227,424 |
10,095,915 | |||
|
|
Profit on ordinary activities multiplied by standard rate of corporation tax in the UK of 25% (2025 ‑ 25%) |
2,556,856 |
2,523,979 | |||
|
|
Effects of: |
|
| |||
|
|
Expenses not deductible for tax purposes, other than goodwill amortisation and impairment |
24,745 |
2,789 | |||
|
|
Capital allowances for year in excess of depreciation |
(2,177) |
16,707 | |||
|
|
Adjustments to tax charge in respect of prior periods |
28,904 |
(25,071) | |||
|
|
Changes in provisions leading to an increase (decrease) in the tax charge |
917 |
3,031 | |||
|
|
Share based payments |
- |
7,995 | |||
|
|
Deferred tax movement |
3,526 |
(17,957) | |||
|
|
Total tax charge for the year |
2,612,771 |
2,511,473 | |||
|
|
Factors that may affect future tax charges
|
There were no factors that may affect future tax charges.
|
11.
|
Dividends
| |||||
|
|
|
|
|
|
2026 |
2025 |
|
|
|
|
|
|
£ |
£ |
|
|
Dividends paid 150 pence per share (2025:157 pence per share) |
7,837,290 |
8,194,860 | |||
|
|
|
7,837,290 |
8,194,860 | |||
|
12.
|
Tangible fixed assets
|
||||||
|
|
Freehold property |
Plant & Machinery |
Motor Vehicles |
Fixtures & Fittings |
Office Equipment | ||
|
|
£ |
£ |
£ |
£ |
£ | ||
|
Cost or valuation |
|
|
|
|
| ||
|
At 1 July 2025 |
475,000 |
509,302 |
13,090 |
410,551 |
21,191 | ||
|
Additions |
- |
45,323 |
- |
- |
13,940 | ||
|
At 30 June 2026
|
475,000
|
554,625
|
13,090
|
410,551
|
35,131
| ||
|
Depreciation |
|
|
|
|
| ||
|
At 1 July 2025 |
171,000 |
459,220 |
13,090 |
362,239 |
19,228 | ||
|
Charge for the year on owned assets |
7,125 |
20,352 |
- |
25,324 |
2,280 | ||
|
Charge for the year on financed assets |
- |
- |
- |
- |
- | ||
|
At 30 June 2026
|
178,125
|
479,572
|
13,090
|
387,563
|
21,508
| ||
|
Net book value |
|
|
|
|
| ||
|
At 30 June 2026 |
296,875 |
75,053 |
- |
22,988 |
13,623 | ||
|
At 30 June 2025 |
304,000 |
50,082 |
- |
48,312 |
1,963 | ||
|
|
|
|
|
|
| ||
|
|
Right of use assets |
Total |
|
|
£ |
£ |
|
Cost or valuation |
|
|
|
At 1 July 2025 |
- |
1,429,134 |
|
Additions |
23,306 |
82,569 |
|
At 30 June 2026
|
23,306
|
1,511,703
|
|
Depreciation |
|
|
|
At 1 July 2025 |
- |
1,024,777 |
|
Charge for the year on owned assets |
- |
55,081 |
|
Charge for the year on financed assets |
1,942 |
1,942 |
|
At 30 June 2026
|
1,942
|
1,081,800
|
|
Net book value |
|
|
|
At 30 June 2026 |
21,364 |
429,903 |
|
At 30 June 2025 |
- |
404,357 |
|
|
The Right of use Assets are depreciated in line with the length of the lease. | |||||
|
|
The net book value of land and buildings may be further analysed as follows:
| |||||
|
|
|
|
|
|
2026 |
2025 |
|
|
|
|
|
|
£ |
£ |
|
|
Freehold |
296,875 |
304,000 | |||
|
|
|
296,875 |
304,000 | |||
|
|
|
|
| |||
|
13.
|
Fixed asset investments
|
|||||
|
|
|
|
|
|
||
|
|
Unlisted Investments | |||||
|
|
£ | |||||
|
Cost or valuation |
| |||||
|
At 1 July 2025 |
610,039 | |||||
|
At 30 June 2026
|
610,039
| |||||
|
Impairment |
| |||||
|
At 1 July 2025 |
183,306 | |||||
|
At 30 June 2026
|
183,306
| |||||
|
Net book value |
| |||||
|
At 30 June 2026 |
426,733 | |||||
|
At 30 June 2025 |
426,733 | |||||
|
|
| |||||
|
14.
|
Stocks
| |||||
|
|
|
|
|
|
2026 |
2025 |
|
|
|
|
|
|
£ |
£ |
|
|
Finished goods and goods for resale |
707,045 |
689,404 | |||
|
|
|
|
| |||
|
|
| |||||
|
15.
|
Debtors
| |||||
|
|
|
|
|
|
2026 |
2025 |
|
|
|
|
|
|
£ |
£ |
|
|
|
|
| |||
|
|
Trade debtors |
1,425,733 |
1,031,762 | |||
|
|
Other debtors |
26,240 |
29,855 | |||
|
|
Prepayments and accrued income |
4,529,708 |
5,181,917 | |||
|
|
Deferred taxation |
16,920 |
20,446 | |||
|
|
|
5,998,601 |
6,263,980 | |||
|
|
|
|
| |||
|
16.
|
Cash and cash equivalents
| |||||
|
|
|
|
|
|
2026 |
2025 |
|
|
|
|
|
|
£ |
£ |
|
|
Cash at bank and in hand |
5,264,706 |
5,079,295 | |||
|
|
|
|
| |||
Cash is held in both current accounts and interest earning deposit accounts with UK High Street Banks; such deposits are made for varying terms.
|
17.
|
Creditors: Amounts falling due within one year
| |||||
|
|
|
|
|
|
2026 |
2025 |
|
|
|
|
|
|
£ |
£ |
|
|
Trade creditors |
271,004 |
77,948 | |||
|
|
Corporation tax |
701,752 |
836,710 | |||
|
|
Other taxation and social security |
34,728 |
32,425 | |||
|
|
Obligations under finance lease and hire purchase contracts |
3,816 |
- | |||
|
|
Accruals and deferred income |
392,806 |
364,969 | |||
|
|
|
1,404,106 |
1,312,052 | |||
|
|
|
|
| |||
|
18.
|
Creditors: Amounts falling due after more than one year
| |||||||
|
|
|
|
|
|
2026 |
2025 | ||
|
|
|
|
|
|
£ |
£ | ||
|
|
Net obligations under finance leases and hire purchase contracts |
7,154 |
- | |||||
|
|
|
7,154 |
- | |||||
|
|
|
|
| |||||
|
19.
|
Deferred taxation
| |||||||
|
|
|
|
|
|
|
| ||
|
|
2026 |
2025 | ||||||
|
|
£
|
£
| ||||||
|
|
|
| ||||||
|
At beginning of year |
20,446 |
2,489 | ||||||
|
(Charged)/credited to profit or loss |
(3,526) |
17,957 | ||||||
|
At end of year |
16,920 |
20,446 | ||||||
|
|
The deferred tax asset is made up as follows:
| |||||
|
|
|
|
|
|
2026 |
2025 |
|
|
|
|
|
|
£ |
£ |
|
|
Accelerated capital allowances |
16,920 |
20,446 | |||
|
|
|
16,920 |
20,446 | |||
|
20.
|
Share capital
| |||||||
|
|
|
|
|
|
2026 |
2025 | ||
|
|
|
|
|
|
£ |
£ | ||
|
|
|
Allotted, called up and fully paid |
|
| ||||
|
|
|
|
|
| ||||
|
|
|
5,224,860 (2025 ‑ 5,224,860) Ordinary shares of £0.05 each |
261,243 |
261,243 | ||||
|
|
The holders of ordinary shares are entitled to receive dividends as declared and are entitled to one vote per share at meetings of the Company. All ordinary shares rank equally with regard to the Company's residual assets.
|
|
21.
|
Reserves
|
Share premium account
The share premium reserve contains the premium arising on issues of equity shares, net of issue expenses.
Capital redemption reserve
The capital redemption reserve arose on the buy‑back of shares by the company.
Profit & loss account
The profit and loss reserve represents cumulative profits or losses, net of dividends paid and other adjustments.
|
22.
|
Share‑based payments
| |||||||
|
|
During the year the Company operated 2 share option schemes; an Approved EMI Share Option Scheme and an Unapproved Share Option Scheme to incentivise employees.
| |||||||
|
|
|
|
|
|
| |||
|
|
|
|
|
|
| |||
|
|
|
|
|
| ||||
|
|
|
|
|
| ||||
|
|
The number and weighted average exercise price of share options during the year are as follows:
| ||||
|
|
|
Weighted average exercise price (pence) 2026 |
Number 2026 |
Weighted average exercise price 2025 |
Number 2025 |
|
|
|
|
|
|
|
|
|
Outstanding at the beginning of the year
|
3816
|
72,077
|
3544
|
77,281
|
|
|
Granted during the year
|
1582
|
118,953
|
|
-
|
|
|
Forfeited during the year
|
3855
|
(1,349)
|
|
-
|
|
|
Exercised during the year
|
|
-
|
1350
|
(5,204)
|
|
|
Outstanding at the end of the year |
2415
|
189,681
|
3816
|
72,077
|
|
|
|
|
|
|
2026 |
2025 |
|
|
|
|
|
|
|
|
|
|
Option pricing model used
|
Black Scholes
|
Black Scholes
| |||
|
|
Issue price
|
£13.50‑£38.50
|
£13.50‑£38.50
| |||
|
|
Exercise price
|
£13.50‑£38.50
|
£13.50‑£38.50
| |||
|
|
Option life
|
10 years
|
10 years
| |||
|
|
Expected volatility
|
2.63%
|
7.459%
| |||
|
|
Fair value at measurement date
|
£4.66 ‑ £26.91
|
£4.66 ‑ £26.91
| |||
|
|
Risk‑free interest rate
|
4.9%
|
1.5%
| |||
|
|
The expected volatility for the options issued in the year to 30 June 2026 was based upon the volatility over that 12 month period.
| |||||
|
|
During the year, there were no modifications to the terms and conditions of share‑based payment arrangements.
| |
|
23. |
Earnings per share |
|
The weighted average number of shares in issue for the basic earnings per share calculation is 5,224,860 (2025: 5,220,811) and for the diluted earnings per share, assuming the exercise of all share options excluding the underwater options, is 5,302,036 (2025: 5,292,888).
The calculation of the basic earnings per share is based on the profit for the period of £7,614,653 (2025: £7,584,442) divided by the weighted average number of shares in issue of 5,224,860 (2025: 5,220,811), the basic earnings per share is 145.74p (2025: 145.27p). The diluted earnings per share, assuming the exercise of all share options excluding the underwater options is based on 5,302,036 (2025: 5,290,539 shares and is 143.62p (2025: 143.35p).
|
24.
|
Pension commitments
|
The Company operates a defined contribution pension scheme. The assets of the scheme are held separately from those of the Company in an independently administered fund. The pension charge represents contributions payable by the Company to the fund and amounted to £95,876 (2025: £91,942). No contributions were owing at the year end (2025: £nil).
|
25.
|
Related party transactions
|
|
|
During the year a dividend of £445,632 (2025: £466,428) was paid to a director and his wife.
|
|
26.
|
Controlling party
|
During the year there has not been an individual controlling party.
RNS may use your IP address to confirm compliance with the terms and conditions, to analyse how you engage with the information contained in this communication, and to share such analysis on an anonymised basis with others as part of our commercial services. For further information about how RNS and the London Stock Exchange use the personal data you provide us, please see our Privacy Policy.

Latest directors dealings
- 23 minutes ago Foxtons Group
- 25 minutes ago Aberdeen Asian Income Fund Limited
- 1 hour ago Literacy Capital
- 2 hours ago South32 Limited (DI)
- 2 hours ago Corero Network Security