
Results for the year ended 30 June 2026
Summary by AI BETAClose X

30 September 2026
Thor Energy Plc
("Thor" or the "Company")
Results for the year ended 30 June 2026
The directors of Thor Energy Plc (AIM/ASX: THR) are pleased to provide the Company's audited annual financial results for the year ended 30 June 2026.
The annual report will be posted to shareholders shortly.
The Board of Thor Energy Plc has approved this announcement and authorised its release.
For further information on the Company, please visit the website or please contact the following:
Thor Energy PLC
Andrew Hume, Managing Director
Alastair Clayton, Non-Executive Chairman
Rowan Harland, Company Secretary
Tel: +61 (8) 6555 2950
Zeus Capital Limited (Nominated Adviser and Joint Broker)
Antonio Bossi / Darshan Patel
Tel: +44 (0) 203 829 5000
SI Capital Limited (Joint Broker)
Nick Emerson
Tel: +44 (0) 1483 413 500
Yellow Jersey (Financial PR)
Dom Barretto / Shivantha Thambirajah / Ranulf Prentis
thor@yellowjerseypr.com
Tel: +44 (0) 20 3004 9512
Competent Person Statement
The information in this report that relates to exploration results and exploration targets is based on information compiled by Andrew Hume, who holds a BSc in Geology (Hons). Mr Hume is an employee of Thor Energy PLC. He has sufficient experience which is relevant to the style of mineralisation and type of deposit under consideration and to the activity which he is undertaking to qualify as a Competent Person as defined in the 2012 Edition of the 'Australasian Code for Reporting of Exploration Results, Mineral Resources and Ore Reserves' and is a qualified person under AIM Rules. Andrew Hume consents to the inclusion in the report of the matters based on his formation in the form and context in which it appears.
About Thor Energy Plc
The Company is focused on both hydrogen and helium exploration, along with the exploration for copper, gold, uranium, and other energy metals.
2026 ANNUAL REPORT
Chairman’s Message
Dear Shareholders,
On behalf of the Board of Thor Energy Plc, I am pleased to report on activities of the Company for the year ended 30 June 2026. This has been a defining year for the Company, in which we have continued to advance our flagship HY-Range natural hydrogen and helium project in South Australia towards a maiden drilling programme and augmented our portfolio with the addition of new strategic acreage in the Otway Basin. Meanwhile, Thor Energy has completed the rationalisation of our legacy metals portfolio, to deliver significant upfront and trailing cash, optimised cost reduction and preservation of high-value mineral exploration acreage in South Australia. Thor’s portfolio is now more focused in South Australia alongside a rationalised, non-operated, low-cost US portfolio.
HY-Range Project – South Australian Natural Hydrogen and Helium
Our 80.2%-owned HY-Range Project (RSEL 802), held through our subsidiary Go Exploration Pty Ltd, remains the Company's core focus. During the year we completed our Phase 2 soil air geochemistry survey, an extended monitoring campaign that commenced in November 2025 and ran through the first quarter of 2026. The results, announced in June 2026, were excellent: natural hydrogen readings of up to 3% (30,000ppm) were recorded, approximately 60,000 times background levels, and materially exceeded the already encouraging Phase 1 results. The survey validated three of our highest priority focus areas; Mallala, Lochiel and Crystal and significantly increased our confidence in the scale and continuity of the underlying natural hydrogen system.
Following these highly encouraging results, the Company began planning for a large-scale 2D seismic acquisition programme designed to image the subsurface geology, refine structural interpretations and identify priority drilling targets across the HY-Range Project. The programme marks the next critical step towards testing the project's natural hydrogen and helium potential through drilling. A comprehensive bid evaluation was undertaken toward the end of the year resulting in the Company signing a Letter of Award with Velseis Pty Ltd, a leading Australian seismic contractor, for an onshore 2D seismic acquisition survey across RSEL 802. The programme will acquire approximately 464 line-kilometres of 2D seismic data, targeting the Company’s highest-priority zones within the Torrens Hinge Zone, with the surveys expected to begin in Q4 2026.
Beyond the HY-Range project, Thor Energy holds a leading natural hydrogen and helium portfolio with more than 37,000 km² of South Australian applications secured as part of the Go Exploration deal which concluded in February 2025. The first two applications, located adjacent to the mining and industrial hub of Whyalla, commenced native title processes during the reporting period. Furthermore, following a competitive bidding process, Thor was subsequently offered two bid licence applications (RSELA 810 and 811) in February 2026, which are now expected to be awarded as active licences, post-period, during 2026 H2.
Alongside natural hydrogen and helium, Thor’s Gas Storage Exploration Licences (GSEL 804, 805 and 806) are being analysed to assess the potential for hydrogen storage which could add additional value and differentiation to Thor’s hydrogen and helium business streams or alternatively could deliver high-value natural gas or long-term gas sequestration.
Collectively, our gas-oriented business streams and associated portfolio is highly synergistic, facilitating efficient exploration, and delivering both opportunity range and portfolio risk tolerance.
Copper – EnviroCopper Limited
Alongside our hydrogen and helium ambitions, the Board continues to see significant embedded value in our copper interests, held both as direct equity within Thor Energy’s project portfolio and indirectly, through our investment in EnviroCopper Limited ("ECL"), in which Thor is the largest individual shareholder, with a stake of just over 24% as at 30 June 2026.
ECL is a specialist in-situ recovery ("ISR") copper company focused on its Alford West and Kapunda projects in South Australia. In October 2025, we announced that a large international energy company had agreed to invest A$3.5 million (£1.75 million) into ECL to collaborate on its ISR technology and on the Kapunda and Alford copper projects, with the option to convert that investment into a shareholding in ECL. This is a strong external endorsement of the technology and the underlying asset base, and in March 2026 Thor further strengthened its involvement by appointing a director to the ECL board. The Company looks forward to reporting on ECL's continued progress and believes this holding gives shareholders meaningful, low-cost exposure to a re-emerging South Australian copper story alongside our core hydrogen and helium strategy.
Immediately adjacent to ECL’s Alford West project, Thor holds 80% of metal oxides in Alford East, EL 6529. Collectively, the Alford system represents a significant resource with the potential with the potential to deliver and scale economic production by low impact, environmentally sound, and scalable production systems.
Portfolio Rationalisation and Non-Core Assets
The Board's strategy of simplifying the portfolio and sharpening our focus on core assets has continued at pace. In September 2025 we signed a Term Sheet for the sale of our 75% interest in the Molyhil Tungsten Project (held via the FRAM Joint Venture) to ASX-listed Tivan Limited for total consideration of up to A$8.75 million(£4.375 million)with Molyhil’s 75% share worth $6,562,500 (£3,281,250). The first cash payment of A$2.25 million (£1,125 million) was received in January 2026, and we received the first of three further annual deferred completion payments of A$1,312,500 (£656,000), post period, in September 2026 with Tivan electing to pay 50% in cash and 50% in shares.
In August 2025, the Group also successfully sold its 75% stake in its US assets to Metals One Plc (AIM:MET1). In October 2025 via our retained 25% interest in the above we signed a binding agreement with DISA Technologies, Inc. to evaluate and potentially develop historically abandoned uranium mine waste at our Colorado Projects, with the potential to generate a fully carried gross revenue share of 2.5% to 4.0% for Thor, requiring no capital or operating expenditure from the Company and delivering socio-environmental improvements to the area. Together, these transactions continue to deliver a meaningful, non-dilutive boost to Thor's cash position, enabling us to dedicate an increasing proportion of our resources to advancing HY-Range and our core projects.
Outlook
The Board believes Thor is well positioned as an early mover in the natural hydrogen and helium sector, with a fully funded seismic programme underway at HY-Range and a maiden drill decision now firmly in sight. We have also reinforced our leading natural hydrogen and helium position with high-value follow-up projects. At the same time, our retained interests in EnviroCopper's ISR copper projects and our other energy metals assets, such as Alford East, provide shareholders with valuable optionality beyond our core strategy. On behalf of the Board, I would like to thank our shareholders for their continued support, and I look forward to updating you on our progress as we advance towards drilling at HY-Range.

Yours faithfully
Alastair Clayton
Chairman
29 September 2026
REVIEW OF OPERATIONS AND STRATEGIC REPORT
OPERATIONS REVIEW
The financial year 2025–2026 was dominated by the strategic pivot towards natural hydrogen and helium and curated retention of high-value, strategic assets, to significantly reshape the Group's portfolio and exploration focus.
Exploration and operational highlights 2025-2026:
• Outstanding geochemical results announced from the licence-wide Phase 1 soil-gas survey at HY-Range (RSEL 802), hydrogen locally exceeding 1,000ppm and reaching 3,000ppm at one site, with helium up to 27ppm, high-grading four focus areas: Mallala, Lochiel, Crystal and Mt Lock.
• Completed the sale of a 75% interest in the Company's US uranium and vanadium subsidiaries (Standard Minerals Inc. and Cisco Minerals Inc.) to Metals One PLC for an exclusivity fee of £100,000 cash plus £761,024 in Metals One shares; Thor retained a fully carried 25% interest and granted Metals One a 12-month option to buy the remaining balance.
• Signed a binding Term Sheet with ASX-listed Tivan Limited for the sale of Thor's 75% interest in the Molyhil Tungsten-Molybdenum-Copper JV (FRAM JV) for total consideration of A$6.56 million (£3.28 million).
• Binding Term Sheet signed with DISA Technologies, Inc. for a gross revenue share (2.5%–4.0%) from processing abandoned uranium mine waste at Thor's Colorado projects, at no capital or operating cost to Thor.
• Phase 2 extended soil-gas monitoring campaign commenced at HY-Range in November 2025 and concluded through to March 2026 to ground-truth Phase 1 anomalies ahead of seismic design.
• Full binding agreement executed with DISA Technologies (23 October 2025); DISA received its final U.S. Nuclear Regulatory Commission Service Providers Licence during the quarter.
• EnviroCopper Limited (Thor's South Australian copper-gold investee) entered a binding agreement for a A$3.5 million (£1.75 million) investment by a large international energy company into the Alford West and Kapunda projects (announced 27 October 2025); If converted to equity then Thor's holding is set to dilute to approximately 20%
• Preliminary Phase 2 geochemistry results announced natural hydrogen readings of up to 3% (30,000ppm), around 60,000 times background, validating three priority focus areas (Mallala, Lochiel and Crystal).
• Letter of Award signed with Velseis Pty Ltd for a 464 line-kilometre 2D seismic acquisition survey across RSEL 802, targeting the Torrens Hinge Zone, with acquisition planned for Q4 2026 and fully funded from existing cash reserves.
HY-RANGE PROJECT: RSEL 802, SOUTH AUSTRALIAN NATURAL HYDROGEN AND HELIUM
The HY-Range Project (RSEL 802), held through the Company's 80.2%-owned subsidiary Go Exploration Pty Ltd, remained Thor's flagship asset throughout FY26. The licence sits adjacent to Gold Hydrogen Limited's Ramsay-1 and Ramsay-2 discoveries and is co-located with three Gas Storage Exploration Licences (GSEL 804, 805 and 806) held by Go Exploration, which offer potential synergies for hydrogen, natural gas or greenhouse-gas storage serving the Adelaide urban centre and nearby industry.
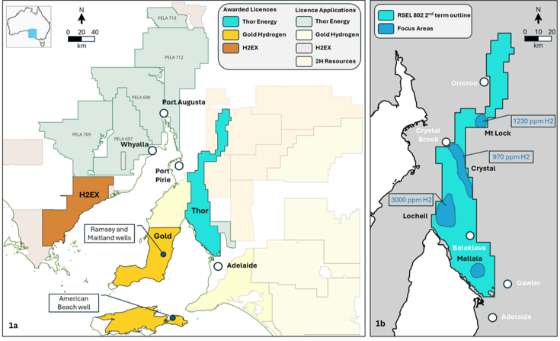
Figure 1: RSEL 802 in the context of nearby Petroleum Exploration Licences (left) and the four priority focus areas: Mt Lock, Crystal, Lochiel and Mallala identified from Phase 1 geochemistry (right). Source: Company announcements, Q1 FY26.
Phase 1: Licence-wide geochemical survey
The Phase 1 full-licence soil-gas geochemical programme, upsized to 103 sample locations and using field-based gas chromatography equipment (understood to be a first for natural hydrogen and helium exploration in Australia), was completed ahead of FY26 and reported to market on 7 July 2025. Results announced early in Q1 FY26 confirmed elevated hydrogen readings locally exceeding 1,000ppm and reaching 3,000ppm at one location, against a typical atmospheric background of 0.5ppm, together with helium readings up to 27ppm against a background of around 5ppm. The distribution of results correlated with mapped geological features, supporting a natural origin, and the elevated helium was assessed as unambiguous evidence of a working helium system. The data was used to high-grade four principal focus areas: Mallala, Lochiel, Crystal and Mt Lock.
Phase 2: Extended monitoring campaign
Building on the Phase 1 results, the Company commenced Phase 2 fieldwork in November 2025 (Q2 FY26). Unlike the Phase 1 spot-sampling approach, Phase 2 was designed as an extended monitoring campaign, planned to run through to March 2026, to measure gas flux over time, ground-truth the Phase 1 anomalies, and determine source-to-trap migration pathways ahead of seismic design and final prospect maturation.
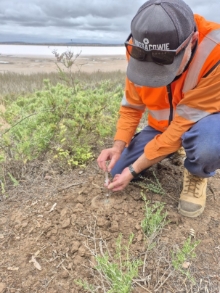
Figure 2: Phase 2 soil-air geochemistry sample collection, HY-Range Project. Source: Company announcement, Q4 FY26.
Preliminary Phase 2 results were announced during Q4 FY26 (April–June 2026), recording natural hydrogen readings of up to 3% (30,000ppm), approximately 60,000 times background levels, and validating three of the Company's highest-priority focus areas: Mallala, Lochiel and Crystal. Evolved sampling techniques, testing depth, duration and material variables against controls, indicated highly active natural hydrogen generation and reduced the risk of sampling error or anthropogenic contamination. The results were assessed as materially exceeding Phase 1 and were considered by the Company to further validate its exploration model ahead of drill targeting.
2D seismic acquisition
Following the encouraging Phase 2 results, the Company ran a competitive bid process and, during Q4 FY26, signed a Letter of Award with Velseis Pty Ltd, a leading Australian seismic contractor, for an onshore 2D seismic acquisition survey of approximately 464 line-kilometres across RSEL 802, targeting the Torrens Hinge Zone. Work is scheduled for Q4 calendar 2026 and is fully funded from existing cash reserves following the Company's non-core asset divestments. The seismic data is intended to be integrated with existing gravity, magnetic, passive and Phase 2 geochemistry datasets to provide depth control, characterise the hydrogen/helium-generating basement rocks, map migration-controlling faulting and mature targets for future exploration drilling.
STRATEGIC METALS PORTFOLIO
In parallel with advancing HY-Range, Thor executed a non-dilutionary monetisation strategy across its legacy uranium, vanadium and tungsten interests during FY26, converting non-core, costly to hold exploration assets into cash and deferred consideration to fund the Company's natural hydrogen and helium programme without shareholder dilution.
Uranium and Vanadium Projects, Colorado & Utah, USA
During Q1 FY26, Thor completed the sale of its 75% interest holdings in its US uranium and vanadium subsidiaries, Standard Minerals Inc. and Cisco Minerals Inc. (which hold the Groundhog, Radium Mountain and Vanadium King claim groups in Colorado and Utah), to London-listed Metals One PLC (AIM: MET1). Consideration comprised an exclusivity fee of £100,000 paid on execution of the initial Term Sheet, plus £761,024 (approximately A$1,400,000) of Metals One shares issued on completion, calculated at the closing share price on completion. Thor retained a fully carried 25% interest and granted Metals One a 12-month option to acquire the remaining 25%, with Metals One funding all exploration during the option period.
In Q2 FY26, on 23 October 2025, Standard Minerals Inc., a company in which Thor has a 25% stake, executed a full binding agreement with DISA Technologies, Inc., a US private-equity-backed materials technology company, to evaluate and treat historically abandoned uranium mine waste at the Colorado projects using DISA's patented High-Pressure Slurry Ablation (HPSA) process. Under the agreement, Standard Minerals (in which Thor now holds 25%) is entitled to a sliding-scale gross revenue share of 2.5% to 4.0% from any recovered uranium and critical minerals, with no capital or operating expenditure required from Thor. DISA received its final U.S. Nuclear Regulatory Commission Service Providers Licence during the quarter, clearing the way for future deployment of the technology.
Molyhil Tungsten-Molybdenum-Copper Project, Northern Territory (FRAM JV, Thor 75%)
The Molyhil deposit, held 75% by Thor through the FRAM JV with Investigator Resources Limited (operating as Fram Ltd, ASX: IVR), comprises the Yacht Club and Southern skarn lodes located approximately 220km north-east of Alice Springs. During Q1 FY26 (September 2025), Thor signed a binding Term Sheet with ASX-listed Tivan Limited (ASX: TVN) for the sale of the FRAM JV, structured as an initial deposit, a completion payment and three annual deferred payments, payable in cash or Tivan shares at Tivan's election, for total consideration of A$6.56 million (£3.28 million) net to Thor (A$8.75 million (£4.875 million) gross FRAM JV consideration).
The sale completed on 19 January 2026 (Q3 FY26), with Thor receiving a A$2,250,000 (£1.125 million) completion payment. Three further annual deferred payments of A$1,312,500 (£656,000) each (A$3,937,500 (£1.968 million) in total) are due from September 2026. On 15 September 2026 the Company received the first payment with Tivan electing to settle the amount 50% in cash and 50% in shares.
SOUTH AUSTRALIAN COPPER-GOLD AND REE ASSETS
Thor retained its exposure to copper, gold and rare earth element potential in South Australia's historic copper districts through its equity holding in EnviroCopper Limited (ECL) and its direct 80% interest in the Alford East Copper-Gold Project, while minimising direct holding costs. The Alford West (ECL) and Alford East (Thor, 80% and Operator) projects sit within the Copper Coast area of the Yorke Peninsula, part of the Olympic Copper-Gold Province, while the Kapunda Project (ECL) represents a separate historic mining centre; both settings host oxide mineralisation potentially amenable to in-situ recovery.
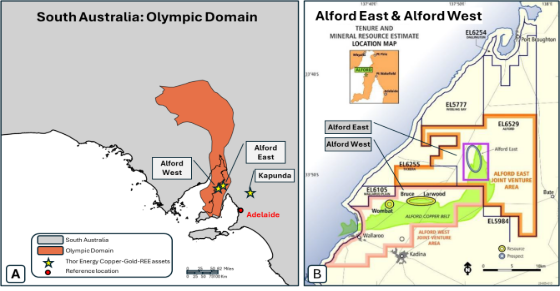
Figure 3: Location of Thor's South Australian copper-gold assets within the Olympic Copper-Gold Province (left) and the Alford East / Alford West tenure area (right). Source: Company announcement, Q2 FY26.
On 27 October 2025 (Q2 FY26), ECL entered a binding agreement for a A$3.5 million (£1.75 million) investment by a large international energy company to advance the Alford West and Kapunda projects, with the investor able to elect to convert the investment into ECL shares at A$3.60 per share. If converted then Thor's holding in ECL, previously just over 24%, is expected to dilute to approximately 20%, while the investment removes funding requirements from Thor and validates the quality of the underlying assets. As at the date of this report the amount has not been converted to equity.
JORC (2012) COMPLIANT MINERAL RESOURCES AND RESERVES
Table A: Alford East Mineral Resource Estimate (Reported 22 January 2021)
Domain |
Tonnes (Mt) |
Cu % |
Au g/t |
Contained Cu (t) |
Contained Au (oz) |
AE_1 |
24.6 |
0.12 |
0.021 |
30,000 |
16,000 |
AE_2 |
6.8 |
0.13 |
0.004 |
9,000 |
1,000 |
AE_3 |
34.9 |
0.09 |
0.022 |
33,000 |
25,000 |
AE_4 |
8.0 |
0.11 |
0.016 |
8,000 |
4,000 |
AE_5 |
11.0 |
0.22 |
0.030 |
24,000 |
11,000 |
AE-8 |
31.3 |
0.19 |
0.008 |
61,000 |
8,000 |
AE-7 |
7.7 |
0.14 |
0.025 |
10,000 |
6,000 |
AE-6 |
1.3 |
0.13 |
0.011 |
2,000 |
500 |
Total |
125.6 |
0.14 |
0.018 |
177,000 |
71,500 |
Notes:
- Thor has an 80% interest in oxide material with Spencer Metals.
- MRE reported on oxide material only, at a cut-off grade of 0.05% copper which is consistent with the assumed ISR technique.
- Minor rounding errors may occur in compiled totals.
- The Company is not aware of any information or data which would materially affect this previously announced resource estimate, and all assumptions and technical parameters relevant to the estimate remain unchanged.
Table B: Alford West Copper Mineral Resource Estimate (Reported 15 August 2019)
Resource Classification |
COG (Cu %) |
Deposit |
Volume (Mm3) |
Tonnes (Mt) |
Cu (%) |
Cu metal (t) |
Au (g/t) |
Au (Oz) |
Inferred |
0.05 |
Wombat |
20.91 |
46.5 |
0.17 |
80,000 |
|
|
Bruce |
5.51 |
11.8 |
0.19 |
22,000 |
|
| ||
Larwood |
3.48 |
7.8 |
0.15 |
12,000 |
0.04 |
10,000 | ||
Total |
29.9 |
66.1 |
0.17 |
114,000 |
|
| ||
Notes:
- EnviroCopper is earning a 75% interest in this resource, and Thor holds 24% equity in EnviroCopper.
- All figures are rounded to reflect the appropriate levels of confidence. Apparent differences may occur due to rounding.
- Cut-off grade used of 0.05% Cu.
- The Company is not aware of any information or data which would materially affect this previously announced resource estimate, and all assumptions and technical parameters relevant to the estimate remain unchanged.
Table C: Kapunda Resource Summary 2018 (Reported 12 February 2018)
Resource |
Copper | |||
Mineralisation |
Classification |
MT |
Grade % |
Contained Cu (t) |
Copper Oxide |
Inferred |
30.3 |
0.24 |
73,000 |
Secondary copper sulphide |
Inferred |
17.1 |
0.27 |
46,000 |
Total |
47.4 |
0.25 |
119,000 | |
Notes:
- EnviroCopper is earning a 75% interest in this resource, and Thor holds 24% equity in EnviroCopper.
- All figures are rounded to reflect the appropriate levels of confidence. Apparent differences may occur due to rounding.
- Cut-off of 0.05% Cu.
- The Company is not aware of any information or data which would materially affect this previously announced resource estimate, and all assumptions and technical parameters relevant to the estimate remain unchanged.
Table E: Natural Hydrogen and Helium Prospective Resource (Reported 31 March 2026)
Unrisked Recoverable Prospective Resources on RSEL 802 | |||||||
|
|
Hydrogen (Bcf) |
Helium (Bcf) | ||||
|
|
1U |
2U |
3U |
1U |
2U |
3U |
RSEL 802 (net) |
|
275 |
1,050 |
3,511 |
25 |
115 |
427 |
Thor (net) |
|
221 |
842 |
2,816 |
20 |
90 |
343 |
Notes:
- The estimated quantities of hydrogen and helium that may potentially be recovered by the application of a future development project(s) relate to undiscovered accumulations. These estimates have risks relating to both discovery and development. Further exploration appraisal and evaluation is required to determine the existence of a significant quantity of potentially recoverable hydrogen and helium.
- The prospective resources are based on the entrapment model for natural hydrogen and helium in the free gas phase.
- The assessment was undertaken by RISC Advisory Pty Ltd.
Any information contained in this report that relates to Mineral or Prospective Resources has been extracted from a previously released announcements dated 12/02/2018, 26/11/2018, 15/08/2019, 29/01/2020, 22/01/2022, 31/05/2024 and 31/03/2026 (“Announcements”). The Company confirms that it is not aware of any new information or data that materially affects the information included in the Announcements, and that all material assumptions and technical parameters underpinning the estimates in the Announcements continue to apply and have not materially changed.
CORPORATE
The Company's FY26 strategy prioritised non-dilutionary funding: the divestment of 75% of the US uranium and vanadium projects to Metals One PLC and 75% of the Molyhil FRAM JV to Tivan Limited together funded the Company's exploration programme, including the fully funded 2D seismic acquisition at HY-Range, without any new funding through equity issuance during the year.
Cash and cash equivalents rose from £686,000 at 1 July 2025 to £1,453,000 at 30 June 2026. Net cash used in operating activities was £791,000, more than offset by net cash inflows from investing activities of £1,581,000, principally the Tivan/Molyhil deposit and completion payment of £1,343,000. The first of three annual deferred completion payments of A$1,312,500 (£656,000) under the Tivan transaction was received in September 2026 with the Company electing to pay 50% in shares and 50% in cash.
The management of the business and the execution of the Group’s strategy are subject to a number of risks. The key business risks affecting the Group are set out below.
Risks are formally reviewed by the Board, and appropriate processes are put in place to monitor and mitigate them. If more than one event occurs, it is possible that the overall effect of such events would compound the possible adverse effects on the Group.
Exploration risks
The exploration and mining business is controlled by a number of global factors, principally supply and demand which in turn is a key driver of global mineral prices; these factors are beyond the control of the Group. Exploration is a high-risk business and there can be no guarantee that any mineralisation discovered will result in proven and probable reserves or go on to be an operating mine. At every stage of the exploration process the projects are rigorously reviewed to determine if the results justify the next stage of exploration expenditure ensuring that funds are only applied to high-priority targets.
The principal assets of the Group comprising the various exploration licences are subject to certain financial and legal commitments. If these commitments are not fulfilled the licences could be revoked. They are also subject to legislation defined by the Government; if this legislation is changed it could adversely affect the value of the Group’s assets.
The Group's natural hydrogen and helium portfolio consists of its 80.2% ownership of Go Exploration and associated operatorship of all licences and licence applications contained within this portfolio. The portfolio consists of South Australian licences:
- Regulated Substance Exploration Licence (RSEL) 802 which provides exploration rights to explore for natural hydrogen and helium.
- The licence was awarded on 26 March 2025, derived from and inheriting the associated licence period and timeline of its former/progenitor licence - Petroleum Exploration Licence (PEL) 120. Specifically, RSEL 802 was awarded within the final year of the penultimate 5-year licence period, ending July 1st, 2025.
- All 5-year licence period work commitments have been fulfilled.
At the date of this report the renewal application has been submitted (On 16 June 2025) to seek continuation into the final 5-year licence period; the South Australian Government's, Department of Energy and Mining (‘DEM’) are currently reviewing the application. The licence continues by default and, based on the Group's history of successful renewals of licences and through positive dialogue with DEM, the Directors have a reasonable expectation that this licence will continue into the final 5-year licence period, as required for ongoing exploration activities on the licence.
Dependence on key personnel
The Group and Company are dependent upon their executive management team and various technical consultants. Whilst it has entered into contractual agreements with the aim of securing the services of these personnel, the retention of their services cannot be guaranteed. The development and success of the Group depends on its ability to recruit and retain high-quality and experienced staff. The loss of the service of key personnel or the inability to attract additional qualified personnel as the Group grows could have an adverse effect on future business and financial conditions.
Uninsured risk
The Group, as a participant in exploration and development programmes, may become subject to liability for hazards that cannot be insured against or third-party claims that exceed the insurance cover. The Group may also be disrupted by a variety of risks and hazards that are beyond control, including geological, geotechnical and seismic factors, environmental hazards, industrial accidents, occupational and health hazards and weather conditions or other acts of God.
Funding risk
The only sources of funding currently available (other than the deferred consideration) to the Group are through the issue of additional equity capital in the parent company or through bringing in partners to fund exploration and development costs. The Company’s ability to raise further funds will depend on the success of the Group’s exploration activities and its investment strategy. The Company may not be successful in procuring funds on terms which are attractive and, if such funding is unavailable, the Group may be required to reduce the scope of its exploration activities or relinquish some of the exploration licences held for which it may incur fines or penalties.
Financial risks
The Group’s operations expose it to a variety of financial risks that can include market risk (including foreign currency, price and interest rate risk), credit risk, and liquidity risk. The Group has a risk management programme in place that seeks to limit the adverse effects on the financial performance of the Group by monitoring levels of financial commitments. The Group does not use derivative financial instruments to manage interest rate costs and, as such, no hedge accounting is applied. Refer to note 19.2 for further information.
Section 172(1) Statement - Promotion of the Company for the benefit of the members as a whole
Section 172 of the Companies Act 2006 requires Directors to take into consideration the interests of stakeholders and other matters in their decision making. The Directors continue to have regard to the interests of the Group's employees and other stakeholders, the impact of its activities on the community, the environment and the Group 's reputation for good business conduct, when making decisions and they are addressed in detail below:
Stakeholders |
Impact |
Strategy & decision making |
Employees |
Thor recognises that an organisation in its life cycle relies heavily on a few key employees to determine the success of the Group. Other than the Directors the Group only has one employee. |
It has put in place a remuneration committee that reviews the performance and salary of Directors annually to ensure they are properly remunerated. |
Shareholders |
Thor is committed to maintaining regular dialogue with shareholders and implementing apparatus that allows two-way communication. |
Sale of non-core assets During the year the Group reviewed its asset portfolio and continued to streamline its operations to focus on its core natural hydrogen and helium assets. As part of this strategy the Group sold its entire 75% interest in the Molyhil Tungsten-Molybdenum-Copper Project (the FRAM JV) to ASX-listed Tivan Limited for total consideration of A$6.56 million (£3.28 million) net to Thor, comprising an initial deposit, a completion payment received on completion on 19 January 2026, and three annual deferred payments of A$1,312,500 (£656,000) each.
The Group also sold a 75% interest in its US uranium and vanadium subsidiaries, Standard Minerals Inc. and Cisco Minerals Inc., to Metals One PLC, retaining a fully carried 25% interest and granting Metals One a 12-month option over the balance. The Board believes these divestments have freed up significant capital to allocate to the Group's HY-Range natural hydrogen and helium project, including the fully funded 2D seismic acquisition programme, without shareholder dilution. |
Governance |
The Board is committed to maintaining the highest standard of governance within the Group including but not limited to: |
The Board has processes in place specifically to oversee Governance being the audit Committee and remuneration committee that meet regularly throughout the year to oversee their designated portfolios.
|
Environmental |
The Board is aware of the changing landscape in which the Group operates and must look to regularly assess and mitigate its environmental impact |
The Group's main environmental footprint occurs in Australia where operations occur. Operations are overseen by State Authorities, and the Group complies with all necessary operational requirements.
|
We aim to work responsibly with our stakeholders, including suppliers. The key Board decisions made during the period and post period end are set out in the Chairman’s statement.
Other information
Other information that is usually found in the Strategic report has been included in the Directors report.
This report was approved by the Board on 29 September 2026.

Andrew Hume
Managing Director
DIRECTORS’ REPORT
The Directors are pleased to present this year’s annual report together with the consolidated financial statements for the year ended 30 June 2026.
Review of Operations
The net result of operations for the year was a loss of £1,427,000 (2025 loss: £7,441,000). A comprehensive review of operations can be found on page 2 of this report.
Directors and Officers
The names and details of the Directors and officers of the company during the year and as at the current date are:
- Alastair Clayton - Non-Executive Chairman
- Andrew Hume - Managing Director and CEO
- Tim Armstrong - Non-Executive Director
- Lincoln Moore - Non-Executive Director
Alastair Clayton - Non-Executive Chairman
Mr Clayton is a financier and geologist, has over 30 years’ experience in the mining and exploration industry, identifying, financing and developing mineral, energy and materials processing projects in Australia, Europe and Africa. He was previously a Director of ASX100-list Uranium Developer Extract Resources where he represented major shareholder AIM-listed Kalahari Minerals on the Board. He was part of the team responsible for the eventual A$2.2B sale to CGNPC in 2012. He was also Chairman of ASX-listed Uranium Developer Bannerman Resources Limited and was a founding Director of ASX-listed Universal Coal which was sold to Terracom in 2021 for A$175m.
Andrew Hume - Managing Director and CEO
Mr Hume has a 29-year career in the energy sector, holding key roles in multinational companies. He commenced at Thales Group (previously known as Racal Electronics), advancing to Geosciences Manager, USA. At Shell and Murphy Oil Corp, he contributed to geoscience analysis, drilling, asset management, and portfolio growth. At Maersk Oil and Gas, he led regional new ventures before steering strategy and performance across exploration and appraisal. Following the acquisition by Total Energies, he led regional strategy, portfolio, planning and performance, before delivering business development, leading joint ventures and managing a multiparty decarbonisation and renewables project.
Andrew's career is marked by global experience and leadership across business and technical disciplines, principally in the USA, Australia, Denmark, and the UK. He holds an Executive MBA with distinction from the University of Cambridge and BSc (Hons) Geology from the University of St. Andrews.
Tim Armstrong - Non-Executive Director
Mr Armstrong is an Institutional financial advisor at Prenzler Group, a Sydney based boutique advisory firm with an extensive institutional network across the broking and investment banking industries in Australia and abroad. He previously worked in financial PR in Australia and London, which entailed advising numerous listed and private companies on their corporate strategies predominantly in the resources sector. Tim is also a former professional sports person, spending five years as a first-class cricketer representing NSW, WA and Australia. He is currently Non- Executive Director at Cooper Metals Limited (ASX:CPM) and Charger Metals NL (ASX: CHR).
Lincoln Moore - Non-Executive Director
For the past 15 years, Mr. Moore has been actively involved in establishing and raising finance for mining and agriculture projects. Lincoln is the co-founder and corporate advisor of Firering Strategic Minerals plc which is in the process of commissioning the largest quicklime processing operation in Zambia. He also currently serves as an Executive Director of Ivory Coast based AIM-quoted, Dekel AgriVision plc, which produces palm oil and cashews, with primary responsibilities for the corporate finance activities of the organisation. Mr. Moore also previously served as a Director of the London Standard listed company, Dial Square Investments plc (now Energy Pathways plc), which is currently undertaking detailed feasibility to establish a hydrogen storage operation in the UK. Lincoln was a Senior Manager in the restructuring division of Deloitte Australia and London, with significant experience in operational and corporate restructuring.
Non-Executive Director Service contracts
All Non-Executive Directors are appointed under the terms of a letter of appointment. Each appointment provides for annual fees of A$60,000 (Approximately £30,000) for services as a Non-Executive Director, inclusive of the 15%(2025:12%) statutory superannuation scheme applicable to Australian Directors. The agreement allows that any services supplied by the Non-Executive Directors to the Company and any of its subsidiaries in excess of two days in any calendar month, may be invoiced to the Company at market rate, currently at A$1,000(£500) per day.
Principal activities and review of the business
The principal activities of the Group are the exploration of Hydrogen and Helium assets that are crucial in the shift to a ‘green’ energy economy.
The Group’s existing exploration project portfolio comprises:
- 80.2% of the share capital of Go Exploration Pty Ltd. The Project holds the RSEL 802 exploration licence which will be used to explore for Hydrogen and Helium reserves in South Australia.
- 25% owned mineral claims in the US states of Colorado and Utah within the Uravan Mineral Belt, with historical high-grade uranium and vanadium production results.
- Thor has an 80% interest in the Alford East Copper-Gold Project in South Australia. The project contains copper-gold oxide mineralisation considered amenable to extraction via In Situ Recovery techniques. Alford East has an Inferred Mineral Resource Estimate of 177,000 tonnes contained copper & 71,500 oz of contained gold.
- Thor holds a 24% investment in EnviroCopper Limited. ECL holds 1) an agreement to earn, in two stages, up to 75% of the rights over metals from Terramin Ltd ,which may be recovered via In-Situ Recovery contained in the Kapunda deposit, with in-ground lixiviant trials now underway and copper recoveries to be reported in 2026, and 2) an agreement with Andromeda Metals to acquire the Alford West EL 5984 tenement.
Business Review and future developments
A review of the current and future development of the Group’s business is provided in the Review of Operations & Strategic Report.
Results and dividends
The Group incurred a loss after taxation of £1,427,000 (2025 loss: £7,441,000). The key movements at Group level were the loss on disposal of Standard and Cisco (£469,000), the share based payment expense (£147,000) and the revaluation of listed investments (£248,000). The reduction against the prior year reflects the absence of the exploration asset write-offs and impairments of £5,026,000 and the £977,000 loss on sale of exploration assets recognised in 2025, together with a £371,000 fair value adjustment on financial assets held at FVTPL in that year. No dividends have been paid or are proposed.
Key Performance Indicators (‘KPIs’)
Given the nature of the business and that the Group is in the exploration and development phase of operations, the Directors are of the opinion that analysis using KPIs is not appropriate for an understanding of the development, performance or position of our businesses at this time.
At this stage, management believe that the carrying value of exploration assets and the management of cash are the main performance indicator, which are monitored closely to ensure the group has sufficient funds to advance its exploration assets.
Events occurring after the reporting period
Refer to note 21 for subsequent events.
Substantial Shareholdings
As at 18 September 2026, the below shareholders had 3% or more of the nominal value of the Company’s shares:
|
Number of shares |
% |
Black Lantern Investments Pty Ltd |
108,841,270 |
10.57% |
Trent Spry |
135,496,274 |
13.15% |
Jayleaf Holdings Pty Ltd |
49,454,610 |
4.8% |
|
|
|
Directors & Officers Shareholdings
The Directors and Officers who served during the period and their interests in the share capital of the Company at 30 June 2026 or their date of resignation if prior to 30 June 2026, were as follows:
|
Ordinary Shares/Chess depository interests (CDIs) |
Options/Performance Shares | ||||
|
30 June 2026 |
30 June 2025 |
30 June 2026 |
30 June 2025 | ||
Alastair Clayton |
18,192,308 |
7,692,308 |
28,846,154 |
40,146,154 | ||
Andrew Hume |
- |
- |
75,000,000 |
45,000,000 | ||
Tim Armstrong |
4,500,000 |
- |
10,500,000 |
15,000,000 | ||
Lincoln Moore |
1,333,333 |
1,333,333 |
15,000,000 |
- | ||
Directors’ Remuneration
The remuneration arrangements in place for directors and other key management personnel of Thor Energy Plc, are outlined below.
All Directors are appointed under the terms of a Directors letter of appointment. Each appointment, with the exception of Mr Andrew Hume and Mr Alastair Clayton, provides for annual fees of A$60,000 (£30,000) for services as Directors. The agreement allows for services supplied by any Directors to the Company and any of its subsidiaries in excess of two days in any calendar month, to be processed through the Company’s payroll at market rate, currently at A$1,000 per day.
From 1 October 2024 to 30 July 2025 Alastair Clayton received an annual salary of A$200,000 (Approximately £100,000) in his role as Chairman. On 1 August Alastair Clayton’s salary changed to £60,000 per annum.
Per the terms of his appointment Andrew Hume is paid an annual salary of A$260,000 (Approximately £130,000) plus statutory superannuation contributions of 15%. In October 2025 Andrew’s salary was increased to A$300,000 (Approximately £150,000).
Directors and Officers
Summary of amounts paid to Key Management Personnel
The following table discloses the compensation of the Directors and the key management personnel of the Group during the year. Further information can be found in Notes 4 and 16 of the annual financial statements.
2026 |
Salary and Fees |
Post Employment Superannuation |
Total Fees for Services rendered |
|
£’000 |
£’000 |
£’000 |
Directors |
|
|
|
Alastair Clayton |
55 |
- |
55 |
Tim Armstrong |
32 |
- |
32 |
Lincoln Moore |
32 |
- |
32 |
Andrew Hume |
153 |
18 |
171 |
2026 Total |
272 |
18 |
290 |
2025 |
Salary and Fees |
Post Employment Superannuation |
Total Fees for Services rendered |
|
£’000 |
£’000 |
£’000 |
Directors |
|
|
|
Alastair Clayton |
102 |
- |
102 |
Nicole Galloway Warland 1 |
64 |
7 |
71 |
Mark McGeough 2 |
13 |
- |
13 |
Tim Armstrong |
28 |
- |
28 |
Lincoln Moore 3 |
18 |
- |
18 |
Andrew Hume 4 |
54 |
6 |
60 |
Key Personnel |
|
|
|
Ray Ridge 5 |
22 |
- |
22 |
2025 Total |
301 |
13 |
314 |
- Resigned 8th October 2024
- Resigned 4th December 2024
- Appointed 4th December 2024
- Appointed 5th February 2025
- Resigned 4th December 2024
Directors’ Meetings
The Directors hold meetings on a regular basis, and special meetings as required, to deal with items of business from time to time. Board meetings held and attended by each Director during the year of review were:
2026 |
Meetings held whilst in Office |
Meetings attended |
Alastair Clayton |
6 |
5 |
Tim Armstrong |
6 |
5 |
Lincoln Moore |
6 |
5 |
Andrew Hume |
6 |
6 |
Corporate Governance
The Board applies the ASX Corporate Governance Principles and Recommendations (ASX Corporate Governance Council, 4th Edition) as the framework for the Company’s corporate governance arrangements. Consistent with ASX listing rule 4.10.3, this document details the extent to which the Company has followed the recommendations set by the ASX Corporate Governance Council during the reporting period. A separate disclosure is made where the Company has not followed a specific recommendation, together with the reasons and any alternative governance practice, as applicable. Following the revised AIM Rules for Companies which took effect on 5 August 2026, AIM companies are no longer required to adopt a recognised corporate governance code or to comply or explain against one; AIM Rule 26 instead requires disclosure of the Company’s approach to board composition, director roles and responsibilities, remuneration and performance, its risk and controls framework, and investor relations. The Board has retained the ASX Principles as its framework and considers the arrangements described below, together with the information published on the Company’s website, appropriate to the size, stage of development and circumstances of the Company. This information is reviewed annually.
The Company does not have a formal nomination committee, however it does formally consider board succession issues and whether the board has the appropriate balance of skills, knowledge, experience, and diversity. This evaluation is undertaken collectively by the Board, as part of the annual review of its own performance.
Whilst a separate Remuneration Committee has not been formed, the Company undertakes alternative procedures to ensure a transparent process for setting remuneration for Directors and Senior staff, that is appropriate in the context of the current size and nature of the Company’s operations.
The full Board fulfils the functions of a Remuneration Committee, and considers and agrees remuneration and conditions as follows:
- All Director Remuneration is set against the market rate for Independent Directors for ASX- listed companies of a similar size and nature.
- The financial package for the Managing Director is established by reference to packages prevailing in the employment market for executives of equivalent status both in terms of level of responsibility of the position and their achievement of recognised job qualifications and skills.
The Audit Committee comprised Alastair Clayton and Lincoln Moore. It meets formally at least twice a year. The Committee is responsible for reviewing the Group's financial statements and the judgements in them, monitoring internal controls and risk management, and managing the relationship with the external auditor, including their independence and fees .Further information on the Company’s corporate governance policies is available on the Company’s website www.thorenergyplc.com.
Environmental Responsibility
The Company is aware of the potential impact that its subsidiary companies may have on the environment. The Company ensures that it and its subsidiaries at a minimum comply with the local regulatory requirements with regards to the environment.
Employment Policies
The Group will be committed to promoting policies which ensure that high-calibre employees are attracted, retained and motivated, to ensure the ongoing success of the business. Employees and those who seek to work within the Group are treated equally regardless of gender, age, marital status, creed, colour, race or ethnic origin.
Health and Safety
The Group will aim to achieve and maintain a high standard of workplace safety. To achieve this objective, the Group will provide training and support to employees and set demanding standards for workplace safety.
Payment to Suppliers
The Group’s policy is to agree terms and conditions with suppliers in advance; payment is then made in accordance with the agreement provided the supplier has met the terms and conditions. Under normal operating conditions, suppliers are paid within 60 days of receipt of invoice.
Political Contributions and Charitable Donations
During the period the Group did not make any political contributions or charitable donations.
Annual General Meeting (“AGM”)
This report and financial statements will be presented to shareholders for their approval at the AGM. The Notice of the AGM will be distributed to shareholders together with the Annual Report.
Auditors
A resolution to reappoint PKF Littlejohn LLP will be considered at the Company’s next Annual General Meeting expected to be held in, or prior to, November 2026.
Statement of disclosure of information to auditors
As at the date of this report, the serving Directors confirm that:
- So far as each Director is aware, there is no relevant audit information of which the Group and Parent Company’s auditors are unaware, and
- They have taken all the steps that they ought to have taken as a Director in order to make themselves aware of any relevant audit information and to establish that the Group’s and Parent Company’s auditors are aware of that information.
Going Concern
The Directors note the losses that the Group has made for the Year Ended 30 June 2026. The Directors have prepared cash flow forecasts for the period ending 30 September 2027 which take account of the current cost and operational structure of the Group.
The cost structure of the Group comprises a high proportion of discretionary spend and therefore in the event that cash flows become constrained, some costs can be reduced to enable the Group to operate with a lower level of available funding. As a junior exploration company, the Directors are aware that the Company must go to the marketplace to raise cash to meet its exploration and development plans, and/or consider liquidation of its investments and/or assets as is deemed appropriate.
The Directors expect that further funds can be raised, and it is appropriate to prepare the financial statements on a going concern basis, however, there can be no certainty that any fundraise will be completed. These conditions indicate existence of a material uncertainty related to events or conditions that may cast significant doubt about the Group’s ability to continue as a going concern, and, therefore, that it may be unable to realise its assets and discharge its liabilities in the normal course of business. These financial statements do not include the adjustments that would be required if the Group could not continue as a going concern.
Statement of Directors’ Responsibilities
The Directors are responsible for preparing the financial statements in accordance with applicable law and regulations.
Company law requires the Directors to prepare group and parent company financial statements for each financial year. Under that law the Directors have prepared the group and parent company financial statements in accordance with and UK-adopted international accounting standards. Under company law the Directors must not approve the financial statements unless they are satisfied that they give a true and fair view of the state of affairs of the group and parent company and of the profit or loss of the group and the parent company for that period. In preparing those financial statements, the Directors are required to:
- select suitable accounting policies and then apply them consistently;
- make judgments and accounting estimates that are reasonable and prudent;
- state whether applicable UK-adopted international accounting standards have been followed, subject to any material departures disclosed and explained in the financial statements; and
- prepare the financial statements on the going concern basis unless it is inappropriate to presume that the group and the parent company will continue in business.
The Directors confirm that they have complied with the above requirements in preparing the financial statements.
The Directors are responsible for keeping adequate accounting records that are sufficient to show and explain the Company’s transactions and disclose with reasonable accuracy at any time the financial position of the Company and enable them to ensure that the financial statements comply with the Companies Act 2006. They are also responsible for safeguarding the assets of the Company and hence for taking reasonable steps for the prevention and detection of fraud and other irregularities.
Electronic communication
The maintenance and integrity of the Company’s website is the responsibility of the Directors: the work carried out by the auditors does not involve consideration of these matters and, accordingly, the auditors accept no responsibility for any changes that may have occurred to the financial statements since they were initially presented on the website.
The Company’s website is maintained in accordance with AIM Rule 26.
Legislation in the United Kingdom governing the preparation and dissemination of the financial statements may differ from legislation in other jurisdictions.
This report was approved by the Board on 29 September 2026.
Alastair Clayton
Non-Executive Chairman
INDEPENDENT AUDITOR’S REPORT TO THE MEMBERS OF THOR ENERGY PLC
Opinion
We have audited the financial statements of Thor Energy Plc (the ‘Parent Company’ or the ‘Company’) and its subsidiaries (the ‘Group’) for the year ended 30 June 2026 which comprise the Consolidated Statement of Comprehensive Income, the Consolidated and Parent Company Statements of Financial Position, the Consolidated and Parent Company Statements of Changes in Equity, the Consolidated and Parent Company Statements of Cashflows and notes to the financial statements, including significant accounting policies. The financial reporting framework that has been applied in their preparation is applicable law and UK-adopted international accounting standards and as regards the Parent Company financial statements, as applied in accordance with the provisions of the Companies Act 2006.
In our opinion:
- the financial statements give a true and fair view of the state of the Group’s and of the Parent Company’s affairs as at 30 June 2026 and of the Group’s loss for the year then ended;
- the Group financial statements have been properly prepared in accordance with UK-adopted international accounting standards;
- the Parent Company financial statements have been properly prepared in accordance with UK-adopted international accounting standards and as applied in accordance with the provisions of the Companies Act 2006; and
- the financial statements have been prepared in accordance with the requirements of the Companies Act 2006.
Basis for opinion
We conducted our audit in accordance with International Standards on Auditing (UK) (ISAs (UK)) and applicable law. Our responsibilities under those standards are further described in the Auditor’s responsibilities for the audit of the financial statements section of our report. We are independent of the Group and Parent Company in accordance with the ethical requirements that are relevant to our audit of the financial statements in the UK, including the FRC’s Ethical Standard as applied to listed entities, and we have fulfilled our other ethical responsibilities in accordance with these requirements. We believe that the audit evidence we have obtained is sufficient and appropriate to provide a basis for our opinion.
Material uncertainty related to going concern
We draw attention to Note 1c in the financial statements, which explains that the Group remains reliant on securing additional funding in order to meet its working capital requirements as they fall due and to continue advancing its operations. There can be no assurance that such funding will be obtained within the required timeframes or at the required amount. As stated in Note 1c, these events or conditions, along with the other matters as set forth in that Note, indicate that a material uncertainty exists that may cast significant doubt on the Group’s and Parent Company’s ability to continue as a going concern. Our opinion is not modified in respect of this matter.
In auditing the financial statements, we have concluded that the directors’ use of the going concern basis of accounting in the preparation of the financial statements is appropriate. Our evaluation of the directors’ assessment of the Group’s and Parent Company’s ability to continue to adopt the going concern basis of accounting included:
- Reviewing management’s assessment of going concern and discussing with management the future strategic plans of the Group and sources of funding that are expected to be available, as well as available paths for cash preservation;
- Obtaining and reviewing management-prepared cashflow forecasts for the period to 30 September 2027, including confirmation of mathematical accuracy, and assessing the reasonableness of inputs through comparison to current period actual financial information;
- Reviewing historical accuracy of management-prepared forecasts through comparing actuals to forecasts;
- Obtaining corroborative evidence for, and providing appropriate challenge to, the key assumptions and inputs used in the cashflow forecast;
- Performing appropriate stress testing of the cashflow forecast prepared by management based on reasonably possible scenarios;
- Confirming post-year end cash position as at 31 August 2026 to bank statements;
- Reviewing the adequacy and completeness of disclosures surrounding going concern in the financial statements; and
- Reviewing and corroborating post balance sheet events in relation to the Group’s and Parent Company’s cash position and any impact on the assumptions used in the forecast.
Our responsibilities and the responsibilities of the directors with respect to going concern are described in the relevant sections of this report.
Our application of materiality
We apply the concept of materiality both in planning and throughout the course of our audit, and in evaluating the effect of identified misstatements and forming our opinion on the financial statements. Materiality is used to determine the financial statements areas that are included within the scope of our audit and the extent of sample sizes during the audit. Misstatements, including omissions, are considered to be material if they, individually or in aggregate, could reasonably be expected to influence the economic decisions of users taken on the basis of the financial statements.
We also determine a level of performance materiality which we use to assess the extent of testing needed to reduce to an appropriately low level the probability that the aggregate of uncorrected and undetected misstatements exceeds materiality for the financial statements as a whole.
In determining materiality and performance materiality, we considered the following factors:
- our cumulative knowledge of the Group and its environment;
- the change in the level of judgement required in respect of the key accounting estimates;
- significant transactions during the period; and
- the level of misstatements identified in prior periods.
The materiality applied to the Group financial statements as a whole was £128,000 (2025: £94,300). This was calculated at 1.5% of Group net assets (2025: 1% of Group total assets). In determining materiality, we deemed net assets to be the main driver of the business. The Group has rationalised its asset portfolio during the year, and it is considered that net assets will produce a more stable year on year metric whilst the Group remains in the exploration stage with no revenue being generated. Performance materiality of £89,700 (2025: £66,000) was set at 70% (2025: 70%) of headline materiality, a level considered appropriate due to current size and level of complexity and our assessment of inherent risk of the Group.
Materiality for the Parent Company financial statements as a whole was set at £105,700 (2025: £75,500). This was calculated based on 1.5% of net assets (2025: 1% of total assets) and capped below Group materiality at a level deemed appropriate, taking into account both risk and net asset contribution to the Group. Performance materiality was set at £74,000 (2025: £52,800) based on 70% (2025: 70%) of headline materiality. The significant judgements used in determining this threshold were the same as those applied to the Group as detailed above.
In addition to the Parent Company, a full scope audit was performed on one additional component (2025: two additional components), and audit procedures were performed on certain balances or classes of transaction for a further three components (2025: three components). The scoping was determined having regard to the risks associated with each component, the presence of material balances, and other relevant qualitative factors. Performance materiality ranged between £10,000-£74,000 (2025: £52,800-£73,920) for these components, based on an appropriate percentage of Group performance materiality taking into account both risk and net asset contribution to the Group.
We agreed to report to those charged with governance any individual audit misstatements exceeding £6,410 (2025: £4,700) for the Group and £6,300 (2025: £4,700) for the Parent Company, in addition to other identified misstatements that warranted reporting on qualitative grounds.
Our approach to the audit
Our audit was risk based and was designed to focus our efforts on the areas at greatest risk of material misstatement, as well as aspects subject to significant management judgement or greatest complexity, risk and size.
In designing our audit, we determined materiality and assessed the risk of material misstatement in the financial statements. In particular, we looked at areas involving significant accounting estimates and judgements by the directors, including the carrying value of intangible assets in the Group and the carrying value of investments in subsidiaries and loans to subsidiaries in the Parent Company, and considered future events that are inherently uncertain.
As in all of our audits, we also addressed the risk of management override of internal controls, including among other matters consideration of whether there was evidence of bias by the directors that represented a risk of material misstatement due to fraud.
The Group includes the listed Parent Company and its subsidiaries, which are based in the United Kingdom, United States of America and Australia. Of the Group’s seven components, we performed a full scope audit on two components, including the Parent Company, and performed audit procedures on certain balances or classes of transaction on a further three.
The Group’s and Parent Company’s accounting function is based in the United Kingdom and the audit was performed by us as Group auditor.
Key audit matters
Key audit matters are those matters that, in our professional judgment, were of most significance in our audit of the financial statements of the current period and include the most significant assessed risks of material misstatement (whether or not due to fraud) we identified, including those which had the greatest effect on: the overall audit strategy, the allocation of resources in the audit; and directing the efforts of the engagement team. These matters were addressed in the context of our audit of the financial statements as a whole, and in forming our opinion thereon, and we do not provide a separate opinion on these matters. In addition to the matter described in the Material uncertainty related to going concern section, we have determined the matters described below to be the key audit matters to be communicated in our report.
Key Audit Matter |
How our scope addressed this matter |
Recoverability of intangible assets - deferred exploration costs (Group) (Refer Note 7) |
|
The Group holds intangible assets with a significant account balance with a carrying value of £4.7m at the year-end which relate to the following exploration projects:
This balance primarily comprises licence acquisition costs and capitalised exploration costs.
Management capitalises costs in respect of exploration activities in accordance with IFRS 6 Exploration for and Evaluation of Mineral Resources.
The recoverability of these assets depends on the Group’s ability to develop the projects through to revenue generation and profitability or recover value through sale. Management is required to assess annually whether indicators of impairment are present. The assessment of impairment is inherently judgemental and therefore there is a risk that these assets are overstated.
This is considered to be a Key audit matter due to the material nature of the balance as well as the level of management judgement required in considering whether an impairment is deemed to arise.
|
Our work in this area included:
Key Observation
We draw attention to the disclosures in the Principal Risks and Uncertainties section of the Strategic Report and the Critical Accounting Estimates and Judgements accounting policy regarding the Group’s exploration tenements. The Group has submitted a renewal application for Regulated Substance Exploration Licence (‘RSEL’) 802 relating to its HY-Range Project on 16 June 2025, which is currently under review by the South Australian Department of Energy and Mining. Should the renewal not be forthcoming, this may result in impairment to the related intangible assets.
|
Recoverability and Valuation of Parent Company’s Investments in, and Loans to subsidiaries
Refer (Notes 8(a) and 8(b)) |
|
The carrying value of investments in subsidiaries and loans to subsidiaries is £3.2m and £3.8m respectively, and is dependent on the value of the underlying assets.
The valuation and recoverability of the exploration projects and other assets held by the subsidiaries is based on judgements and estimates made by the Directors. The exploration projects are at an early stage of exploration and therefore there are continued risks pertaining to the successful development as well as the assessment of the commercial viability of the exploration assets.
There is a risk that the judgements and estimates made by the Directors may not be reliable, which could result in a material misstatement in the carrying value of the investments in subsidiaries and related intercompany receivables.
Given the financial significance and the estimation/judgement required by management, we have identified the risk of recoverability of investments in, and loans to, subsidiaries as a key audit matter. |
Our work in this area included:
Key Observation We draw attention to the disclosures in the Principal Risks and Uncertainties section of the Strategic Report and the Critical Accounting Estimates and Judgements accounting policy regarding the Group’s exploration tenements. The Group has submitted a renewal application for Regulated Substance Exploration Licence (‘RSEL’) 802 relating to its HY-Range Project on 16 June 2025, which is currently under review by the South Australian Department of Energy and Mining. Should the renewal not be forthcoming, this may result in impairment to the investment in subsidiary and loans to subsidiaries balances relating to the Parent Company’s 80.2% owned subsidiary Go Exploration Pty Ltd, which is the owner of the licence. |
Other information
The other information comprises the information included in the annual report, other than the financial statements and our auditor’s report thereon. The directors are responsible for the other information contained within the annual report. Our opinion on the Group and Parent Company financial statements does not cover the other information and, except to the extent otherwise explicitly stated in our report, we do not express any form of assurance conclusion thereon. Our responsibility is to read the other information and, in doing so, consider whether the other information is materially inconsistent with the financial statements or our knowledge obtained in the course of the audit, or otherwise appears to be materially misstated. If we identify such material inconsistencies or apparent material misstatements, we are required to determine whether this gives rise to a material misstatement in the financial statements themselves. If, based on the work we have performed, we conclude that there is a material misstatement of this other information, we are required to report that fact.
We have nothing to report in this regard.
Opinions on other matters prescribed by the Companies Act 2006
In our opinion, based on the work undertaken in the course of the audit:
- the information given in the strategic report and the directors’ report for the financial year for which the financial statements are prepared is consistent with the financial statements; and
- the strategic report and the directors’ report have been prepared in accordance with applicable legal requirements.
Matters on which we are required to report by exception
In the light of the knowledge and understanding of the Group and the Parent Company and their environment obtained in the course of the audit, we have not identified material misstatements in the strategic report or the directors’ report.
We have nothing to report in respect of the following matters in relation to which the Companies Act 2006 requires us to report to you if, in our opinion:
- adequate accounting records have not been kept by the Parent Company, or returns adequate for our audit have not been received from branches not visited by us; or
- the Parent Company financial statements are not in agreement with the accounting records and returns; or
- certain disclosures of directors’ remuneration specified by law are not made; or
- we have not received all the information and explanations we require for our audit.
Responsibilities of directors
As explained more fully in the Statement of Directors’ Responsibilities, the directors are responsible for the preparation of the Group and Parent Company financial statements and for being satisfied that they give a true and fair view, and for such internal control as the directors determine is necessary to enable the preparation of financial statements that are free from material misstatement, whether due to fraud or error.
In preparing the Group and Parent Company financial statements, the directors are responsible for assessing the Group and the Parent Company’s ability to continue as a going concern, disclosing, as applicable, matters related to going concern and using the going concern basis of accounting unless the directors either intend to liquidate the Group or the Parent Company or to cease operations, or have no realistic alternative but to do so.
Auditor’s responsibilities for the audit of the financial statements
Our objectives are to obtain reasonable assurance about whether the financial statements as a whole are free from material misstatement, whether due to fraud or error, and to issue an auditor’s report that includes our opinion. Reasonable assurance is a high level of assurance but is not a guarantee that an audit conducted in accordance with ISAs (UK) will always detect a material misstatement when it exists. Misstatements can arise from fraud or error and are considered material if, individually or in the aggregate, they could reasonably be expected to influence the economic decisions of users taken on the basis of these financial statements.
Irregularities, including fraud, are instances of non-compliance with laws and regulations. We design procedures in line with our responsibilities, outlined above, to detect material misstatements in respect of irregularities, including fraud. The extent to which our procedures are capable of detecting irregularities, including fraud is detailed below:
- We obtained an understanding of the Group and the Parent Company and the sector in which it operates to identify laws and regulations that could reasonably be expected to have a direct effect on the financial statements. We obtained our understanding in this regard through discussions with management, industry research and experience of the sector. We also selected a specific audit team with experience of auditing entities facing similar audit and business risks.
-
We determined the principal laws and regulations relevant to the Parent Company and Group in this regard to be those arising from:
- Companies Act 2006;
- AIM Rules for Companies, ASX & OTCQB listing rules;
- ASX corporate governance principles; and
- Local laws and regulations in UK, Australia and USA where the Group operates.
-
We designed our audit procedures to ensure the audit team considered whether there were any indications of non-compliance by the Group with those laws and regulations. These procedures included, but were not limited to:
- Making enquiries of management;
- Reviewing Board minutes;
- Reviewing the nature of legal and professional fees;
- Reviewing Regulatory News Service announcements and ASX announcements; and
- Reviewing post balance sheet events.
- We also identified the risks of material misstatement of the financial statements due to fraud. We considered, in addition to the non-rebuttable presumption of a risk of fraud arising from management override of controls, that there is a potential for management bias in relation to the going concern assumption, and areas of judgement including the valuation of exploration and evaluation intangible assets in the Group, and investments in, and loans to, subsidiaries in the Parent Company. As detailed above, we addressed this by challenging the assumptions and judgements made by management.
- As in all of our audits, we addressed the risk of fraud arising from management override of controls by performing audit procedures, which included, but were not limited to: the testing of journals; reviewing accounting estimates for evidence of bias; and evaluating the business rationale of any significant transactions that are unusual or outside the normal course of business.
- Our review of non-compliance with laws and regulations incorporated all Group entities.
Because of the inherent limitations of an audit, there is a risk that we will not detect all irregularities, including those leading to a material misstatement in the financial statements or non-compliance with regulation. This risk increases the more that compliance with a law or regulation is removed from the events and transactions reflected in the financial statements, as we will be less likely to become aware of instances of non-compliance. The risk is also greater regarding irregularities occurring due to fraud rather than error, as fraud involves intentional concealment, forgery, collusion, omission or misrepresentation.
A further description of our responsibilities for the audit of the financial statements is located on the Financial Reporting Council’s website at: www.frc.org.uk/auditorsresponsibilities. This description forms part of our auditor’s report.
Use of our report
This report is made solely to the Company’s members, as a body, in accordance with Chapter 3 of Part 16 of the Companies Act 2006. Our audit work has been undertaken so that we might state to the Company’s members those matters we are required to state to them in an auditor’s report and for no other purpose. To the fullest extent permitted by law, we do not accept or assume responsibility to anyone, other than the Company and the Company's members as a body, for our audit work, for this report, or for the opinions we have formed.
Imogen Massey (Senior Statutory Auditor) 30 Churchill Place
For and on behalf of PKF Littlejohn LLP London
Statutory Auditor E14 5RE
29 September 2026
|
|
Consolidated | |
|
Note |
£'000 |
£'000 |
|
|
2026 |
2025 |
|
|
|
|
|
|
|
|
Administrative expenses |
|
(864) |
(897) |
Share based payments expense |
16 |
(147) |
(50) |
Realised gain/(loss) on financial assets |
|
2 |
(18) |
Exploration expenses |
|
(8) |
(2) |
Write off of bond |
|
(19) |
- |
Write off/Impairment of exploration assets |
7 |
(42) |
(5,026) |
Operating Loss |
3 |
(1,078) |
(5,993) |
Finance income |
|
102 |
3 |
Interest paid
|
|
- |
(5) |
Share of loss in associate, accounted for using the equity method |
8d |
(99) |
(63) |
Loss on disposal of other assets |
|
(248) |
(39) |
Loss on disposal of subsidiary |
8f |
(469) |
- |
Fair value gain/(loss) on financial assets at FVTPL |
8c |
365 |
(371) |
Loss on sale of exploration assets |
7 |
- |
(977) |
Other income |
|
- |
4 |
Loss before Taxation |
|
(1,427) |
(7,441) |
Taxation |
5 |
- |
- |
Loss for the year attributable to the equity holders |
|
(1,427) |
(7,441) |
|
|
|
|
Other comprehensive income: |
|
|
|
Items that may be subsequently reclassified to profit or loss: |
|
|
|
Exchange differences on translating foreign operations |
|
473 |
(839) |
Other comprehensive income for the year, net of income tax |
|
473 |
(839) |
Total comprehensive income for the year attributable to the owners of the Group |
|
(954) |
(8,280) |
|
|
|
|
Basic & diluted loss per share attributable to the equity holders |
6 |
(0.14) |
(0.9) |
|
|
|
|
Total comprehensive income attributable to: |
|
|
|
Owners of the parent |
|
(954) |
(8,280) |
Non-controlling interest |
|
- |
- |
|
|
(954) |
(8,280) |
The accompanying notes form an integral part of these financial statements
|
|
Consolidated |
Company | ||
|
Note |
£'000 |
£'000 |
£'000 |
£'000 |
|
|
2026 |
2025 |
2026 |
2025 |
ASSETS |
|
|
|
|
|
Non-current assets |
|
|
|
|
|
Intangible assets - deferred exploration costs |
7 |
4,723 |
8,478 |
- |
- |
Investment in subsidiaries |
8a |
- |
- |
3,244 |
3,244 |
Loans to subsidiaries |
8b |
- |
- |
3,822 |
11,306 |
Financial assets at fair value through profit or loss |
8c |
287 |
131 |
- |
- |
Investments accounted for using the equity method |
8d |
407 |
- |
- |
- |
Deposits |
9 |
40 |
80 |
- |
- |
Right of use asset |
10 |
- |
10 |
- |
- |
Trade receivables & other assets |
12 |
1,011 |
- |
- |
- |
Total non-current assets |
|
6,468 |
8,699 |
7,066 |
14,550 |
Current assets |
|
|
|
|
|
Cash and cash equivalents |
17 |
1,453 |
686 |
41 |
673 |
Trade receivables & other assets |
12 |
695 |
50 |
34 |
14 |
Total current assets |
|
2,148 |
736 |
75 |
687 |
Total assets |
|
8,616 |
9,435 |
7,141 |
15,237 |
|
|
|
|
|
|
LIABILITIES |
|
|
|
|
|
Current liabilities |
|
|
|
|
|
Trade and other payables |
13 |
(118) |
(194) |
(67) |
(164) |
Employee annual leave provision |
|
(25) |
(4) |
- |
- |
Lease Liability |
14 |
- |
(10) |
- |
- |
Total current liabilities |
|
(143) |
(208) |
(67) |
(164) |
|
|
|
|
|
|
Total liabilities |
|
(143) |
(208) |
(67) |
(164) |
|
|
|
|
|
|
Net assets |
|
8,473 |
9,227 |
7,074 |
15,073 |
|
|
|
|
|
|
Equity |
|
|
|
|
|
Issued share capital |
15 |
4,640 |
4,615 |
4,640 |
4,615 |
Share premium |
15 |
32,515 |
32,457 |
32,515 |
32,457 |
Foreign exchange reserve |
|
639 |
166 |
- |
- |
Merger reserve |
|
405 |
405 |
405 |
405 |
Share based payments reserve |
16 |
596 |
715 |
596 |
715 |
Retained losses |
|
(30,354) |
(29,163) |
(31,082) |
(23,119) |
Equity attributable to equity holders of the parent |
|
8,441 |
9,195 |
7,074 |
15,073 |
Non-controlling interest |
|
32 |
32 |
- |
- |
Total equity |
|
8,473 |
9,227 |
7,074 |
15,073 |
|
|
|
|
|
|
The Company has taken advantage of section 408 of the Companies Act 2006 and consequently a profit and loss account has not been presented for the Company. The Company’s loss for the financial period was £8,199,000 (2025: £2,412,000).
The accompanying notes form part of these financial statements. These Financial Statements were approved by the Board of Directors on 29 September 2026 and were signed on its behalf by:

Alastair Clayton
Non-Executive Chairman
|
|
Consolidated |
Company | ||
|
Note |
£'000 |
£'000 |
£'000 |
£'000 |
Cash flows from operating activities |
|
2026 |
2025 |
2026 |
2025 |
Operating Loss |
|
(1,427) |
(7,441) |
(8,199) |
(2,412) |
Decrease/(Increase) in trade and other receivables |
|
76 |
(21) |
(16) |
(15) |
(Decrease)/increase in trade and other payables |
|
(88) |
10 |
(97) |
90 |
Depreciation |
10 |
10 |
26 |
- |
- |
Interest receivable |
|
(72) |
- |
- |
- |
Fair value (gain)/loss on Financial Asset at FVTPL |
8 |
(365) |
371 |
- |
- |
Loss on disposal of subsidiary |
|
469 |
- |
- |
|
Impairment of subsidiary loans |
8 |
- |
- |
7,581 |
1,831 |
Share of loss in associate |
8 |
99 |
63 |
- |
- |
Exploration expenditure impairment |
7 |
42 |
5,026 |
- |
- |
Write off of bond |
|
19 |
- |
- |
- |
Loss on disposal of tenements |
7 |
- |
977 |
- |
- |
Loss on disposal of other assets |
|
248 |
39 |
- |
- |
Share based payment expense |
16 |
198 |
50 |
198 |
50 |
Net cash outflow from operating activities |
|
(791) |
(900) |
(533) |
(456) |
|
|
|
|
|
|
Cash flows from investing activities |
|
|
|
|
|
Cash on acquisition of Go Exploration |
8 |
- |
9 |
- |
- |
Sale of Group of Companies |
8 |
100 |
- |
100 |
- |
Sale of listed assets |
8 |
586 |
- |
- |
- |
Interest received |
|
- |
4 |
- |
- |
Interest paid |
|
- |
(5) |
- |
- |
R&D and Grants for exploration expenditure |
7 |
- |
103 |
- |
- |
Payments for exploration expenditure |
7 |
(476) |
(332) |
- |
- |
Loans to controlled entities |
8b |
- |
- |
(199) |
(126) |
Refunds for bonds |
|
28 |
- |
- |
- |
Proceeds from the sale of tenements |
7 |
1,343 |
134 |
- |
- |
Net cash inflow/(outflow) from investing activities |
|
1,581 |
(87) |
(99) |
(126) |
|
|
|
|
|
|
Cash flows from financing activities |
|
|
|
|
|
Finance lease repaid |
14 |
(11) |
(20) |
- |
- |
Net issue of ordinary share capital |
15 |
- |
938 |
- |
938 |
Net cash (outflow)/inflow from financing activities |
|
(11) |
918 |
- |
938 |
|
|
|
|
|
|
Net increase/(decrease) in cash and cash equivalents |
|
779 |
(69) |
(632) |
356 |
Exchange loss on cash and cash equivalents |
|
(12) |
(50) |
- |
- |
Cash and cash equivalents at beginning of period |
|
686 |
805 |
673 |
317 |
Cash and cash equivalents at end of period |
17 |
1,453 |
686 |
41 |
673 |
Major non-cash transactions
- On disposal of the Molyhil Joint Venture interest to Tivan Limited, part of the consideration is payable in three annual instalments to September 2028. The deferred consideration was recognised at its present value at the disposal date and £1,688,000 remained receivable as at 30 June 2026 (notes 7 and 12). Cash consideration of £1,343,000 was received during the year and is shown within investing activities.
- On disposal of 75% of Standard Minerals Inc. and Cisco Minerals Inc., consideration of £761,000 was satisfied by the issue to the Group of 14,224,751 ordinary shares in Metals One Plc (note 8(f)). Those shares were sold during the year for cash proceeds of £586,000, which is included within investing activities together with the £100,000 cash element of the consideration. The Group also recognised its retained 25% interest in each entity, measured at fair value, on loss of control.
- 10,000,000 ordinary shares with a value of £53,000 were issued on 29 July 2025 in satisfaction of deferred consideration arising on the 2020 acquisition of American Vanadium Pty Ltd (note 15).
- 15,000,000 performance shares vested and converted into ordinary shares on 29 July 2025. £30,000 was transferred from the share based payments reserve to share capital and share premium (notes 15 and 16).
Consolidated |
Issued share capital |
Share premium |
Retained losses |
Foreign Currency Translation Reserve |
Merger Reserve |
Share Based Payment Reserve |
Non-Controlling interest |
Total | ||
|
Note 15 |
Note 15 |
Note 1(u) |
Note 1(t) |
Note 1(o) |
Note 16 |
Note 1(v) |
| ||
|
£'000 |
£'000 |
£'000 |
£'000 |
£'000 |
£'000 |
£'000 |
£'000 | ||
Balance at 1 July 2024 |
3,989 |
28,916 |
(21,990) |
1,005 |
405 |
933 |
- |
13,258 | ||
Loss for the year |
- |
- |
(7,441) |
- |
- |
- |
- |
(7,441) | ||
Foreign currency translation reserve |
- |
- |
- |
(839) |
- |
- |
- |
(839) | ||
Total comprehensive (loss) for the year |
- |
- |
(7,441) |
(839) |
- |
- |
- |
(8,280) | ||
Transactions with owners in their capacity as owners |
|
|
|
|
| |||||
Shares issued |
135 |
875 |
- |
- |
- |
- |
- |
1,010 | ||
Cost of shares issued |
- |
(62) |
- |
- |
- |
- |
- |
(62) | ||
Acquisition of subsidiary |
491 |
2,728 |
- |
- |
- |
- |
32 |
3,251 | ||
Securities exercised/lapsed |
- |
- |
268 |
- |
- |
(268) |
- |
- | ||
Securities issued |
- |
- |
- |
- |
- |
50 |
- |
50 | ||
Total transactions with owners |
626 |
3,541 |
268 |
- |
- |
(218) |
32 |
4,249 | ||
At 30 June 2025 |
4,615 |
32,457 |
(29,163) |
166 |
405 |
715 |
32 |
9,227 | ||
|
|
|
|
|
|
|
|
| ||
Balance at 1 July 2025 |
4,615 |
32,457 |
(29,163) |
166 |
405 |
715 |
32 |
9,227 | ||
Loss for the year |
- |
- |
(1,427) |
- |
- |
- |
- |
(1,427) | ||
Foreign currency translation reserve |
- |
- |
- |
473 |
- |
- |
- |
473 | ||
Total comprehensive (loss) for the year |
- |
- |
(1,427) |
473 |
- |
- |
- |
(954) | ||
|
|
|
|
|
| |||||
Shares issued |
25 |
58 |
- |
- |
- |
- |
- |
83 | ||
Cost of shares issued |
- |
- |
- |
- |
- |
- |
- |
- | ||
Securities exercised/lapsed |
- |
- |
236 |
- |
- |
(266) |
- |
(30) | ||
Securities issued |
- |
- |
- |
- |
- |
147 |
- |
147 | ||
Total transactions with owners |
25 |
58 |
236 |
- |
- |
(119) |
- |
200 | ||
At 30 June 2026 |
4,640 |
32,515 |
(30,354) |
639 |
405 |
596 |
32 |
8,473 | ||
|
Issued share capital |
Share premium |
Retained losses |
Foreign Currency Translation Reserve |
Merger Reserve |
Share Based Payment Reserve |
Total | |
|
Note 15 |
Note 15 |
Note 1(u) |
Note 1(t) |
Note 1(o) |
Note 16 |
| |
Company |
£'000 |
£'000 |
£'000 |
£'000 |
£'000 |
£'000 |
£'000 | |
Balance at 1 July 2024 |
3,989 |
28,916 |
(20,975) |
- |
405 |
933 |
13,268 | |
Loss for the period |
- |
- |
(2,412) |
- |
- |
- |
(2,412) | |
Total comprehensive (loss) for the period |
- |
- |
(2,412) |
- |
- |
- |
(2,412) | |
Transactions with owners in their capacity as owners |
|
|
|
| ||||
Shares issued |
135 |
875 |
- |
- |
- |
- |
1,010 | |
Cost of shares issued |
- |
(62) |
- |
- |
- |
- |
(62) | |
Acquisition of subsidiary |
491 |
2,728 |
- |
- |
- |
- |
3,219 | |
Securities exercised/lapsed |
- |
- |
268 |
- |
- |
(268) |
- | |
Securities issued |
- |
- |
- |
- |
- |
50 |
50 | |
Total transactions with owners |
626 |
3,541 |
268 |
- |
- |
(218) |
4,217 | |
At 30 June 2025 |
4,615 |
32,457 |
(23,119) |
- |
405 |
715 |
15,073 | |
|
|
|
|
|
|
|
| |
Balance at 1 July 2025 |
4,615 |
32,457 |
(23,119) |
- |
405 |
715 |
15,073 | |
Loss for the period |
- |
- |
(8,199) |
- |
- |
- |
(8,199) | |
Total comprehensive (loss) for the period |
- |
- |
(8,199) |
- |
- |
- |
(8,199) | |
|
|
|
|
| ||||
Shares issued |
25 |
58 |
- |
- |
- |
- |
83 | |
Cost of shares issued |
- |
- |
- |
- |
- |
- |
- | |
Securities exercised/lapsed |
- |
- |
236 |
- |
- |
(266) |
(30) | |
Securities issued |
- |
- |
- |
- |
- |
147 |
147 | |
Total transactions with owners |
25 |
58 |
236 |
- |
- |
(119) |
200 | |
At 30 June 2026 |
4,640 |
32,515 |
(31,082) |
- |
405 |
596 |
7,074 | |
Notes to the Accounts for the year ended 30 June 2026
1 Principal accounting policies
a) Authorisation of financial statements
The Group financial statements of Thor Energy Plc for the year ended 30 June 2026 were authorised for issue by the Board on 29 September 2026 and the Statements of Financial Position signed on the Board's behalf by Alastair Clayton and Andrew Hume. The Company's ordinary shares are traded on the AIM Market operated by the London Stock Exchange, on the Australian Securities Exchange and on the OTCQB market in the United States.
b) Statement of compliance with IFRS
The Consolidated Financial Statements of Thor Energy Plc (the “Group”) have been prepared in accordance with UK-adopted international accounting standards (“UK-IAS”). These accounting policies comply with each IAS that is mandatory for accounting periods ending on 30 June 2026.
c) Basis of preparation and Going Concern
The consolidated financial statements have been prepared on the historical cost basis, except for the measurement of assets and financial instruments to fair value as described in the accounting policies below, and on a going concern basis.
The financial report is presented in Sterling and all values are rounded to the nearest thousand pounds (“£‘000”) unless otherwise stated.
The consolidated entity incurred a net loss before tax of £1,427,000 during the period ended 30 June 2026 and had a net cash inflow of £791,000 from operating and investing activities. The consolidated entity continues to be reliant upon capital raisings for continued operations and the provision of working capital.
The Group’s cash flow forecast for the 12 months ending 30 September 2027, highlight the fact that the Company is expected to continue to generate negative cash flow over that period, inclusive of the discretionary exploration spend. The Board of Directors are of the view that the injection of funds into the Group during the next 12 months need to be undertaken, and based on the history of successfully raising funds, the Directors believe that any further necessary funds will be raised in order for the Group to remain cash positive for the whole period. If additional capital is not obtained, the going concern basis may not be appropriate, with the result that the Group may have to realise its assets and extinguish its liabilities, other than in the ordinary course of business and at amounts different from those stated in the financial report.
In assessing going concern the Directors have taken into account the deferred consideration receivable under the sale of the Group's 75% interest in the Molyhil FRAM JV to Tivan Limited, which completed on 19 January 2026 for total consideration of A$6.56 million (£3.28 million) net to Thor. Three annual deferred payments of A$1,312,500 (£656,000) each (A$3,937,500 (£1,969,000) in aggregate) remain receivable, the first of which was received in mid September 2026 with Tivan electing to pay 50% in shares and 50% in cash.
The Directors expect that further funds can be raised, and it is appropriate to prepare the financial statements on a going concern basis, however there can be no certainty that any fundraise will complete. These conditions indicate existence of a material uncertainty related to events or conditions that may cast significant doubt about the Group’s ability to continue as a going concern, and, therefore, that it may be unable to realise its assets and discharge its liabilities in the normal course of business. These financial statements do not include the adjustments that would be required if the Group could not continue as a going concern.
d) Basis of consolidation
The consolidated financial statements comprise the financial statements of Thor Energy Plc and its controlled entities. The financial statements of controlled entities are included in the consolidated financial statements from the date control commences until the date control ceases.
The Group applies the acquisition method of accounting to account for business combinations where the acquisition meets the definition of a business combination under IFRS 3. The consideration transferred for the acquisition of a subsidiary is the fair values of the assets transferred, the liabilities incurred to the former owners of the acquiree and the equity interests issued by the Group. The consideration transferred includes the fair value of any asset or liability resulting from a contingent consideration arrangement. Identifiable assets acquired and liabilities and contingent liabilities assumed in a business combination are measured initially at their fair values at the acquisition date.
Acquisition-related costs are expensed as incurred unless they result from the issuance of shares, in which case they are offset against the premium on those shares within equity.
The financial statements of subsidiaries are prepared for the same reporting period as the parent company, using consistent accounting policies.
All intercompany balances and transactions have been eliminated in full.
e) Intangible assets – deferred exploration costs
Exploration, evaluation and development expenditure incurred is accumulated in respect of each identifiable area of interest. These costs are only carried forward to the extent that they are expected to be recouped through the successful development of the area or where activities in the area have not yet reached a stage which permits reasonable assessment of the existence of economically recoverable reserves.
Exploration, evaluation and development expenditure are not amortised, as all areas of interest remain in the pre-production phase.
Accumulated costs in relation to an abandoned area are written off in full against the income statement in the year in which the decision to abandon the area is made.
A review is undertaken of each area of interest to determine the appropriateness of continuing to carry forward costs in relation to that area of interest.
Restoration, rehabilitation and environmental costs necessitated by exploration and evaluation activities are expensed as incurred and treated as exploration and evaluation expenditure.
Exploration and evaluation assets recorded at fair-value on acquisition
Exploration assets which are acquired are recognised at fair value. When an acquisition of an entity whose only significant assets are its exploration asset and/or rights to explore, the Directors consider that the fair value of the exploration assets is equal to the consideration. Any excess of the consideration over the capitalised exploration asset is attributed to the fair value of the exploration asset.
f) Interest Income
Interest income is recognised as it accrues using the effective interest rate method.
g) Deferred taxation
Deferred income tax is provided on all temporary differences at the balance sheet date between the tax bases of assets and liabilities and their carrying amounts for financial reporting purposes.
Deferred income tax assets are recognised for all deductible temporary differences, carry-forward of unused tax assets and unused tax losses, to the extent that it is probable that taxable profit will be available against which the deductible temporary differences and the carry-forward of unused tax credits and unused tax losses can be utilised.
Unrecognised deferred income tax assets are reassessed at each balance sheet date and are recognised to the extent that it has become probable that future taxable profit will allow the deferred tax asset to be recovered.
Deferred income tax assets and liabilities are measured at the tax rates that are expected to apply to the year when the asset is realised or the liability is settled, based on tax rates (and tax laws) that have been enacted or substantively enacted at the balance sheet date.
The amount of any claim received during the year from the Australian Government for eligible exploration expenditure claimed as a Research & Development Tax Incentive and other grants are treated as an offset or reduction of the deferred exploration costs. The amounts received in the year ended 30 June 2026 was £nil (30 June 2025: A$207,000 or approximately £103,000). Due to the uncertainty around the final quantum of the refund it was recognised when received in the bank rather than accrued.
h) Financial liabilities
Financial liabilities are classified at initial recognition as either financial liabilities at fair value through profit or loss or financial liabilities measured at amortised cost, as appropriate. All financial liabilities are recognised initially at fair value and, where applicable, net of directly attributable transaction costs. Subsequent to initial recognition, financial liabilities are measured at amortised cost using the effective interest method (‘EIR’) unless they are required to be measured at fair value through profit or loss. The Group's financial liabilities comprise trade and other payables and lease liabilities.
Subsequent measurement
The measurement of financial liabilities depends on their classification, as described below:
Trade and other payables
After initial recognition, trade and other payables are subsequently measured at amortised cost using the EIR method. Gains and losses are recognised in the statement of profit or loss and other comprehensive income when the liabilities are derecognised, as well as through the EIR amortisation process.
Amortised cost is calculated by taking into account any discount or premium on acquisition and fees or costs that are an integral part of the EIR. The EIR amortisation is included as finance costs in the statement of profit or loss and other comprehensive income.
Derecognition
A financial liability is derecognised when the associated obligation is discharged or cancelled or expires.
When an existing financial liability is replaced by another from the same lender on substantially different terms, or the terms of an existing liability are substantially modified, such an exchange or modification is treated as the derecognition of the original liability and the recognition of a new liability. The difference in the respective carrying amounts is recognised in profit or loss and other comprehensive income.
Liabilities within the scope of IFRS 9 are classified as financial liabilities at fair value through profit and loss or other liabilities, as appropriate.
A financial liability is derecognised when the obligation under the liability is discharged or cancelled or expires.
Financial liabilities included in trade and other payables are recognised initially at fair value and subsequently at amortised cost.
i) Foreign currencies
The Company’s functional currency, and the Group’s presentational currency, is Sterling (“£”). Each entity in the Group determines its own functional currency and items included in the financial statements of each entity are measured using that functional currency. As at the reporting date the assets and liabilities of these subsidiaries are translated into the presentation currency of Thor Energy Plc at the rate of exchange ruling at the balance sheet date and their Income Statements are translated at the average exchange rate for the year. The exchange differences arising on the translation are taken directly to a separate component of equity.
All other differences are taken to the Income Statement.
j) Share based payments
The Company does regularly provide share-based remuneration to Directors, employees, service providers and/or for the acquisition of assets, in the form of share options and performance rights. For further information refer to Note 16.
The cost of equity-settled transactions is measured by reference to the fair value of the services provided. If a reliable estimate cannot be made, the fair value of the Options granted is based on the Black-Scholes model, or where there are market based vesting hurdles the valuation is undertaken a Monte Carlo or similar method.
In valuing equity-settled transactions, no account is taken of any performance conditions, other than conditions linked to the price of the shares of Thor Energy Plc (market conditions) if applicable.
The cost of equity-settled transactions is recognised, together with a corresponding increase in equity, over the period in which the performance and/or service conditions are fulfilled, ending on the date on which the relevant holders become fully entitled to the award (the vesting period).
The cumulative expense recognised for equity-settled transactions at each reporting date until vesting date reflects (i) the extent to which the vesting period has expired and (ii) the Group’s best estimate of the number of equity instruments that will ultimately vest. No adjustment is made for the likelihood of market performance conditions being met as the effect of these conditions is included in the determination of fair value at grant date. The Income Statement charge or credit for a period represents the movement in cumulative expense recognised as at the beginning and end of that period.
No expense is recognised for awards that do not ultimately vest, except for awards where vesting is only conditional upon a market condition.
If the terms of an equity-settled award are modified, as a minimum an expense is recognised as if the terms had not been modified. In addition, an expense is recognised for any modification that increases the total fair value of the share-based payment arrangement, or is otherwise beneficial to the holder, as measured at the date of modification.
If an equity-settled award is cancelled, it is treated as if it had vested on the date of cancellation, and any expense not yet recognised for the award is recognised immediately. However, if a new award is substituted for the cancelled award and designated as a replacement award on the date that it is granted, the cancelled and new award are treated as if they were a modification of the original award, as described in the previous paragraph.
Where equity-settled awards expire or lapse without being exercised, the amount previously recognised in the share based payments reserve in respect of those instruments is transferred to retained earnings. No adjustment is made to the cumulative expense previously recognised in profit or loss, as the services to which the awards related have already been received.
- Cash and cash equivalents
Cash and short-term deposits in the balance sheet comprise cash at bank and in hand and short-term deposits with an original maturity of three months or less.
For the purposes of the Cash Flow Statement, cash and cash equivalents consist of cash and cash equivalents as defined above, net of outstanding bank overdrafts.
- Fair value measurement
IFRS 13 establishes a single source of guidance for all fair value measurements. IFRS 13 does not change when an entity is required to use fair value, but rather provides guidance on how to measure fair value under IFRS when fair value is required or permitted. IFRS 13 mainly impacts the disclosures of the Company. It requires specific disclosures about fair value measurements and disclosures of fair values.
Fair value is the price that would be received to sell an asset or paid to transfer a liability in an orderly transaction between market participants at the measurement date. The fair value measurement is based on the presumption that the transaction to sell the asset or transfer the liability takes place either:
- In the principal market for the asset or liability; or
- In the absence of a principal market, in the most advantageous market for the asset or liability
The principal or the most advantageous market must be accessible by the Group.
The fair value of an asset or a liability is measured using the assumptions that market participants would use when pricing the asset or liability, assuming that market participants act in their economic best interest.
A fair value measurement of a non-financial asset takes into account a market participant's ability to generate economic benefits by using the asset in its highest and best use or by selling it to another market participant that would use the asset in its highest and best use.
The Company uses valuation techniques that are appropriate in the circumstances and for which sufficient data are available to measure fair value, maximising the use of relevant observable inputs and minimising the use of unobservable inputs.
All assets and liabilities for which fair value is measured or disclosed in the financial statements are categorised within the fair value hierarchy, described as follows, based on the lowest level input that is significant to the fair value measurement as a whole:
Level 1 — Quoted (unadjusted) market prices in active markets for identical assets or liabilities
Level 2 — Valuation techniques for which the lowest level input that is significant to the fair value measurement is directly or indirectly observable
Level 3 — Valuation techniques for which the lowest level input that is significant to the fair value measurement is unobservable
For assets and liabilities that are recognised in the financial statements on a recurring basis, the Company determines whether transfers have occurred between levels in the hierarchy by re-assessing categorisation (based on the lowest level input that is significant to the fair value measurement as a whole) at the end of each reporting period.
For the purpose of fair value disclosures, the Company has determined classes of assets and liabilities on the basis of the nature, characteristics and risks of the asset or liability and the level of the fair value hierarchy, as explained above.
- Financial assets
- Classification
The Group classifies its financial assets at amortised cost and at fair value through profit or loss. The classification depends on the purpose for which the financial assets were acquired. Management determines the classification of its financial assets at initial recognition.
- Recognition and measurement
Amortised cost
Regular purchases and sales of financial assets are recognised on the trade date at cost – the date on which the Group commits to purchasing or selling the asset. Financial assets are derecognized when the rights to receive cash flows from the assets have expired or have been transferred, and the Group has transferred substantially all of the risks and rewards of ownership.
Fair value through profit or loss (FVTPL)
Financial assets that do not meet the criteria for being measured at amortised cost or Fair Value through other comprehensive income (FVTOCI) are measured at FVTPL.
Financial assets at FVTPL, are measured at fair value at the end of each reporting period, with any fair value gains or losses recognised in profit or loss. Fair value is determined by using market observable inputs and data as far as possible. Inputs used in determining fair value measurements are categorised into different levels based on how observable the inputs used in the valuation technique utilised are (the ‘fair value hierarchy’):
- Level 1: Quoted prices in active markets for identical items (unadjusted)
- Level 2: Observable direct or indirect inputs other than Level 1 inputs
- Level 3: Unobservable inputs (i.e. not derived from market data).
The classification of an item into the above levels is based on the lowest level of the inputs used that has a significant effect on the fair value measurement of the item. Transfers of items between levels are recognised in the period they occur.
The Group measures its investments in quoted shares using the quoted market price which is considered to be a Level 1 input.
The Group’s investments in Standard Minerals Inc. and Cisco Minerals Inc. are unlisted and there is no quoted price in an active market, nor observable market data for comparable entities or for the underlying exploration assets. Fair value is therefore determined by reference to the consideration attributable to the 75% interest in each entity disposed of during the year, grossed up pro rata to the retained 25% holding. That input is unobservable and the measurement is accordingly classified as Level 3.
- Impairment of financial assets
The Group recognises an allowance for expected credit losses (‘ECLs’) for all debt instruments not held at fair value through profit or loss. ECLs are based on the difference between the contractual cash flows due in accordance with the contract and all the cash flows that the Group expects to receive, discounted at an approximation of the original EIR. The expected cash flows will include cash flows from the sale of collateral held or other credit enhancements that are integral to the contractual terms.
At each reporting date, the Group assesses whether financial assets carried at amortised cost are credit impaired. A financial asset is credit-impaired when one or more events that have a detrimental impact on the estimated future cash flows of the financial asset have occurred.
- Derecognition
The Group derecognises a financial asset only when the contractual rights to the cash flows from the asset expire, or when it transfers the financial asset and substantially all the risks and rewards of ownership of the asset to another entity.
On derecognition of a financial asset measured at amortised cost, the difference between the asset’s carrying amount and the sum of the consideration received and receivable is recognised in profit or loss. This is the same treatment for a financial asset measured at FVTPL.
- Investments
Investments in subsidiary undertakings are stated at cost less any provision for impairment in value, prior to their elimination on consolidation.
Investments in associates are initially recognised at cost and subsequently accounted for using the equity method “Equity accounted investments”. Any goodwill or fair value adjustment attributable to the Group’s share in the associate is not recognised separately and is included in the amount recognised as investment in associate. The carrying amount of the investment in associates is increased or decreased to recognise the Group’s share of the profit or loss and other comprehensive income of the associate, adjusted where necessary to ensure consistency with the accounting policies of the Group. Unrealised gains and losses on transactions between the Group and its associates are eliminated to the extent of the Group’s interest in those entities. Where unrealised losses are eliminated, the underlying asset is also tested for impairment.
When the Group loses significant influence over an associate, the investment is reclassified to a financial asset and measured at fair value in accordance with IFRS 9. On the date of reclassification, any difference between the fair value of the retained interest (and any proceeds received) and the carrying amount of the associate is recognised in profit or loss, and any amounts previously recognised in other comprehensive income in relation to that associate are reclassified to profit or loss.
- Merger reserve
The difference between the fair value of an acquisition and the nominal value of the shares allotted in a share exchange have been credited to a merger reserve account, in accordance with the merger relief provisions of the Companies Act 2006 and accordingly no share premium for such transactions is set-up. Where the assets acquired are impaired, the merger reserve value is reversed to retained earnings to the extent of the impairment.
- Impairment of assets
The Group assesses at each reporting date whether there is an indication that an asset may be impaired. If any such indication exists, or when annual impairment testing for an asset is required, the Group makes an estimate of the asset’s recoverable amount. An asset’s recoverable amount is the higher of its fair value less costs to sell and its value in use and is determined for an individual asset, unless the asset does not generate cash inflows that are largely independent of those from other assets or Groups of assets and the asset's value in use cannot be estimated to be close to its fair value. In such cases the asset is tested for impairment as part of the cash-generating unit to which it belongs. When the carrying amount of an asset or cash-generating unit exceeds its recoverable amount, the asset or cash-generating unit is considered impaired and is written down to its recoverable amount.
In assessing value in use, the estimated future cash flows are discounted to their present value using a pre-tax discount rate that reflects current market assessments of the time value of money and the risks specific to the asset. Impairment losses relating to continuing operations are recognised in those expense categories consistent with the function of the impaired asset unless the asset is carried at its revalued amount (in which case the impairment loss is treated as a revaluation decrease).
An assessment is also made at each reporting date as to whether there is any indication that previously recognised impairment losses may no longer exist or may have decreased. If such indication exists, the recoverable amount is estimated. A previously recognised impairment loss is reversed only if there has been a change in the estimates used to determine the asset’s recoverable amount since the last impairment loss was recognised. If that is the case the carrying amount of the asset is increased to its recoverable amount.
That increased amount cannot exceed the carrying amount that would have been determined, net of depreciation, had no impairment loss been recognised for the asset in prior years. Such reversal is recognised in the Income Statement unless the asset is carried at its revalued amount, in which case the reversal is treated as a revaluation increase. After such a reversal the depreciation charge is adjusted in future periods to allocate the asset’s revised carrying amount, less any residual value, on a systematic basis over its remaining useful life.
- Provisions
Provisions are recognised when the Group has a present obligation (legal or constructive) as a result of a past event, it is probable that an outflow of resources embodying economic benefits will be required to settle the obligation and a reliable estimate can be made of the amount of the obligation.
When the Group expects some or all of a provision to be reimbursed, for example under an insurance contract, the reimbursement is recognised as a separate asset but only when the reimbursement is virtually certain. The expense relating to any provision is presented in the Income Statement net of any reimbursement.
If the effect of the time value of money is material, provisions are discounted using a current pre-tax rate that reflects the risks specific to the liability.
- Earnings per share
Basic earnings per share is calculated as loss for the financial year attributable to members of the parent, adjusted to exclude any costs of servicing equity (other than dividends) and preference share dividends, divided by the weighted average number of ordinary shares, adjusted for any bonus element.
Diluted earnings per share is calculated as loss for the financial year attributable to members of the parent, adjusted for:
- costs of servicing equity (other than dividends) and preference share dividends;
- the after tax effect of dividends and interest associated with dilutive potential ordinary shares that have been recognised as expenses; and
- other non-discretionary changes in revenues or expenses during the period that would result from the dilution of potential ordinary shares;
divided by the weighted average number of ordinary shares and dilutive potential ordinary shares, adjusted for any bonus element.
- Share based payments reserve
This reserve is used to record the value of equity benefits provided to employees, consultants and directors as part of their remuneration and provided to consultants and advisors hired by the Group from time to time as part of the consideration paid. The reserve is reduced by the value of equity benefits which have lapsed during the year.
- Foreign currency translation reserve
The foreign currency translation reserve is used to record exchange differences arising from the translation of the financial statements of foreign subsidiaries.
- Retained earnings
Retained earnings represent the cumulative profits and losses attributable to equity holders of the Company, net of dividends paid and other transfers from reserves.
- Non-controlling interest
Non-controlling interest represents the equity in subsidiaries not attributable, directly or indirectly, to the Company. It is allocated its share of profit or loss and other comprehensive income, even if this results in a deficit balance.
- Lease accounting
The Company as Lessee
At the inception of a contract, the Group assesses if the contract is a lease or contains a lease. If there is a lease present, a right-of-use asset and a corresponding lease liability are recognised by the Group where the Group is a lessee. However, all contracts that are classified as short-term leases (i.e. a lease with a term of 12 months or less) and leases of low-value assets are recognised as an operating expense on a straight-line basis over the term of the lease.
Initially the lease liability is measured at the present value of the lease payments still to be paid at the commencement date. The lease payments are discounted at the interest rate implicit in the lease. If this rate cannot be readily determined, the Group uses the incremental borrowing rate.
Lease payments included in the measurement of the lease liability are as follows:
- fixed lease payments less any lease incentives;
- variable lease payments that depend on an index or rate, initially measured using the index or rate at the commencement date;
- the amount expected to be payable by the lessee under residual value guarantees;
- the exercise price of purchase options, if the lessee is reasonably certain to exercise the options;
- lease payments under extension options, if the lessee is reasonably certain to exercise the options; and
- payments of penalties for terminating the lease, if the lease term reflects the exercise of an option to terminate the lease.
The right-of-use assets comprise the initial measurement of the corresponding lease liability, any lease payments made at or before the commencement date and any initial direct costs. The subsequent measurement of the right-of-use assets is at cost less accumulated depreciation and impairment losses.
Right-of-use assets are depreciated over the lease term or useful life of the underlying asset, whichever is the shortest.
Where a lease transfers ownership of the underlying asset or the cost of the right-of-use asset reflects that the Group anticipates to exercise a purchase option, the specific asset is depreciated over the useful life of the underlying asset.
As at 30 June 2026 the Group does not have any leases.
The Company as Lessor
As the Group has no contracts as a lessor, the provisions of IFRS 16 relating accounting for lease contracts as a lessor are not applicable.
- New standards, amendments and interpretations not yet adopted
At the date on which these Financial Statements were authorised, the following Standards and Amendments had been issued but were not yet effective for the year ended 30 June 2026 and have not been applied by the Group:
Standard or Amendment |
Effective for annual periods beginning on or after |
Amendments to IFRS 9 and IFRS 7 – Classification and Measurement of Financial Instruments |
1 January 2026 |
Annual Improvements to IFRS Accounting Standards – Volume 11 |
1 January 2026 |
IFRS 18 Presentation and Disclosure in Financial Statements
|
1 January 2027 |
- Critical accounting estimates and judgements
The preparation of the Financial Statements in conformity with UK-IAS requires management to make estimates and assumptions that affect the reported amounts of assets and liabilities and disclosure of contingent assets and liabilities at the date of the financial statements and the reported amount of expenses during the period. Actual results may vary from the estimates used to produce these Financial Statements.
Estimates and judgements are regularly evaluated and are based on historical experience and other factors, including expectations of future events that are believed to be reasonable under the circumstances.
Items subject to such estimates and assumptions, that have a significant risk of causing a material adjustment to the carrying amounts of assets and liabilities within the next financial years, include but are not limited to:
Impairment of intangible assets – exploration and evaluation costs (Note 7)
The Group assesses impairment at each reporting date by evaluating conditions specific to the group that may lead to impairment of exploration and evaluation assets. Where an impairment trigger exists, the recoverable amount of the asset is determined.
The Group capitalises expenditure relating to exploration and evaluation where it is considered likely to be recoverable or where the activities have not reached a stage which permits a reasonable assessment of the existence of reserves. While there are certain areas of interest from which no reserves have been extracted, the Directors are of the continued belief that such expenditure should not be written off since feasibility studies in such areas have not yet concluded.
Renewal of RSEL 802 (Note 7 and 8)
The carrying value of the HY-Range Project depends on RSEL 802 continuing into its third and final 5-year licence period. The Group applied for renewal on 16 June 2025, before the deadline, and the South Australian Department of Energy and Mining (DEM) has not yet issued the formal renewal. The licence continues by default while the application is pending, and DEM has not indicated that the renewal will be refused. Given this, the Group's record of successful licence renewals and its ongoing dialogue with DEM, the Directors have judged that renewal is reasonably expected. They have therefore concluded that no impairment indicator arises under IFRS 6 for the related exploration asset, or for the Company's investment in and loans to Go Exploration. If the renewal were not granted, these balances could be impaired.
Share based payment transactions (Note 16)
The Group awarded shares, options (warrants) and performance shares to Directors.
The valuation of these securities involves making a number of critical estimates relating to price volatility, future dividend yields, expected life of the options, forfeiture rates, vesting period and expected vesting amount. These assumptions have been described in more detail in Note 16.
Classification, valuation and recoverability of investment in EnviroCopper (ECL) (Note 8)
During the year, the Company's investment in ECL was reclassified from a financial asset measured at fair value through profit or loss (FVTPL) to an investment in associate. This reclassification was necessitated by the Company regaining significant influence over ECL, following the appointment of Lincoln Moore as a director on 2 March 2026. As a result, the investment met the criteria for accounting as an associate under IAS 28. The fair value of the investment at the date of reclassification was determined based on the relative proportion of net assets at that date, which became the deemed cost on transition to equity accounting. From that date the Group has recognised its share of ECL's results, and at year end reviewed the carrying value for indicators of impairment based on the current net asset position.
The recoverability of the carrying amount of the investment is assessed at each reporting date. ECL is an unlisted, pre-revenue company with no quoted price and no recent arm's length transaction in its shares, so its recoverable amount cannot be observed directly and is estimated by management by reference to the Group's share of ECL's net assets and the underlying value of its exploration interests. That estimate is inherently judgemental and a different view of the value of those interests could result in an impairment.
Impairment of investments in subsidiaries (Note 8)
Management assesses impairment of each investment with respect to the net asset position of each investment. Any impairment charge recorded does not automatically indicate that the underlying assets of the Group need to be impaired as well.
Estimated credit loss (ECL) on intercompany loans
Management assesses the expected credit loss on intercompany loans with reference to the financial position and funding outlook of each borrower. The loans are repayable on demand, and the allowance is measured by assuming repayment is demanded at the reporting date and that the borrower would be unable to repay in full from its own resources. The loss against each loan is therefore the amount by which the carrying value exceeds the borrower's net assets, excluding the loan itself, at their estimated realisable value. The principal judgement is the realisable value of each borrower's exploration interests, which are early stage and not supported by observable market evidence. Any provision recognised does not automatically indicate that the Group has ceased to support the subsidiary, but rather reflects the application of forward-looking credit risk assumptions.
Classification of Standard Minerals Inc and Cisco Minerals Inc
Following the disposal of 75% of Standard Minerals Inc. and Cisco Minerals Inc. on 12 August 2025, the Group retains a 25% shareholding in each entity. A holding of 20% or more gives rise to a rebuttable presumption of significant influence under IAS 28, however the Directors consider the presumption rebutted on the basis that the Group has no board representation and does not intend to exercise its option to appoint one, takes no part in policy-making or in operating and financial decisions, and has no material transactions with either entity; the interests are held passively and free of holding and administration costs. The retained interests are therefore classified as financial assets at fair value through profit or loss under IFRS 9. Fair value is a Level 3 measurement determined by reference to the consideration attributable to the 75% interest disposed, grossed up pro-rata to the retained 25% holding, no observable market data being available.
Deferred consideration on the disposal of the Molyhil Joint Venture (notes 7 and 12)
Consideration for the disposal of the Group's 75% interest in the Molyhil Joint Venture to Tivan Limited is payable in instalments to September 2028. The Directors have judged the deferred instalments to be contractual amounts receivable rather than contingent consideration, as they fall due on the passage of time and are not conditional on any future event, and they are therefore recognised in full as a financial asset at amortised cost. They have been discounted at 13% per annum, being the Directors' estimate of the rate at which the Group could obtain financing of a similar amount and duration; no observable market rate exists for an instrument of this nature. At 30 June 2026 the carrying amount was £1,688,000 against undiscounted instalments of A$3,937,500 (£1,969,000), and discount unwinding of £72,000 was recognised in interest during the year.
The receivable is unsecured and due from a single counterparty. In assessing expected credit losses the Directors have had regard to Tivan Limited's listing on the ASX, receipt of the September and December 2025 instalments in full and on time, the counterparty's option to settle in cash or its own shares, and the absence of any past due amount; on that basis credit risk has not increased significantly since initial recognition and the loss allowance is not material. The judgement remains sensitive: the final two instalments fall due in September 2027 and 2028, and a deterioration in the counterparty's position, or settlement in shares worth less than the instalment, could result in recovery below the carrying amount, which at £1,688,000 is 19% of Group total assets and represents the maximum exposure to credit loss. During September 2026 the Group received the first instalment of £656,000 with Tivan electing to pay 50% in cash and 50% in shares.
2. Segmental analysis – Group
Operating segments are reported in a manner consistent with the internal reporting provided to the chief operating decision-maker. The chief operating decision-maker, who is responsible for allocating resources and assessing performance of the operating segments, has been identified as the Board of Directors that makes strategic decisions.
The Group’s operations are located in Australia and the United States of America, with the head office located in the United Kingdom. The main tangible assets of the Group, cash and cash equivalents, are held in the United States of America and Australia. The Board ensures that adequate amounts are transferred internally to allow all companies to carry out their operational on a timely basis.
The Directors are of the opinion that the Group is engaged in a single segment of business being the exploration for commodities. The Group currently has two geographical reportable segments – United States of America and Australia.
|
£'000 |
£'000 |
£'000 |
£'000 |
Year ended 30 June 2026 |
Head office/ Unallocated |
Australia |
United States |
Consolidated |
Revenue |
|
|
|
|
Sundry Income |
- |
- |
- |
- |
Profit/(loss) on sale of investments |
- |
- |
- |
- |
Loss on revaluation of assets |
- |
|
(248) |
(248) |
Loss on disposal of subsidiaries |
- |
- |
(469) |
(469) |
Interest received |
- |
102 |
- |
102 |
Share of Profit/Loss of associate |
- |
(99) |
- |
(99) |
Fair Value movement |
- |
365 |
- |
365 |
Impairment of exploration assets |
- |
(42) |
- |
(42) |
Write off of bond |
|
- |
(19) |
(19) |
Total Segment Expenditure |
(617) |
(400) |
- |
(1,017) |
(Loss) from Ordinary Activities before Income Tax |
(617) |
(74) |
(736) |
(1,427) |
Income Tax (Expense) |
- |
- |
- |
- |
Retained (loss) |
(617) |
(74) |
(736) |
(1,427) |
|
|
|
|
|
Assets and Liabilities |
|
|
|
|
Segment assets |
- |
8,255 |
287 |
8,542 |
Corporate assets |
74 |
- |
- |
74 |
Total Assets |
74 |
8,255 |
287 |
8,616 |
|
|
|
|
|
Segment liabilities |
- |
(76) |
- |
(76) |
Corporate liabilities |
(67) |
- |
- |
(67) |
Total Liabilities |
(67) |
(76) |
- |
(143) |
|
|
|
|
|
Net Assets |
7 |
8,179 |
287 |
8,473 |
|
£'000 |
£'000 |
£'000 |
£'000 |
Year ended 30 June 2025 |
Head office/ Unallocated |
Australia |
United States |
Consolidated |
Revenue |
|
|
|
|
Sundry Income |
- |
4 |
- |
4 |
Loss on sale of exploration assets |
|
(977) |
|
(977) |
Loss on sale of assets |
- |
(39) |
- |
(39) |
Interest received |
- |
3 |
- |
3 |
Interest paid |
- |
(5) |
- |
(5) |
Share of Profit/Loss of associate |
- |
(63) |
- |
(63) |
Fair value adjustment on financial assets FVTPL |
- |
(371) |
- |
(371) |
Impairment of exploration assets |
- |
(5,026) |
- |
(5,026) |
Total Segment Expenditure |
(593) |
(380) |
6 |
(967) |
(Loss) from Ordinary Activities before Income Tax |
(593) |
(6,854) |
6 |
(7,441) |
Income Tax (Expense) |
- |
- |
- |
- |
Retained (loss) |
(593) |
(6,854) |
6 |
(7,441) |
|
|
|
|
|
Assets and Liabilities |
|
|
|
|
Segment assets |
- |
7,212 |
1,536 |
8,748 |
Corporate assets |
687 |
- |
- |
687 |
Total Assets |
687 |
7,212 |
1,536 |
9,435 |
|
|
|
|
|
Segment liabilities |
- |
(44) |
- |
(44) |
Corporate liabilities |
(164) |
- |
- |
(164) |
Total Liabilities |
(164) |
(44) |
- |
(208) |
|
|
|
|
|
Net Assets |
523 |
7,168 |
1,536 |
9,227 |
3. Expenses by nature
|
2026 |
2025 |
|
£’000 |
£’000 |
Items of expenditure not otherwise disclosed on the Statement of Comprehensive Income: |
|
|
Depreciation |
10 |
26 |
Auditors’ remuneration – audit services |
90 |
105 |
Auditors’ remuneration – non audit services |
12 |
12 |
Employment costs (excluding share based payments) |
178 |
242 |
Contractor costs |
126 |
142 |
Listing costs (ASX, AIM, registry, investor relations) |
67 |
90 |
Legal costs |
22 |
25 |
A breakdown of salary and wages is below:
|
|
2026 |
2025 |
|
|
£’000 |
£’000 |
Salary and wages |
|
375 |
297 |
Social security costs |
|
7 |
13 |
Superannuation & Pension |
|
29 |
7 |
Share based payments |
|
131 |
42 |
Less: Capitalised to exploration |
|
(233) |
(75) |
|
|
309 |
284 |
The average number of employees during the year was 5 which is broken down into: Directors: 4, Operations: 1 (2025: Directors :4 , Operations 1).
4. Directors and executive disclosures – Group
The highest paid director, being the Managing Director (2025: Chairman), received fees of A$290,000 (£153,000) (2025: £102,000).
(a) Details of Key Management Personnel (KMP) during the year ended 30 June 2026
(i) Chairman |
||
Alastair Clayton |
Non-executive Chairman | |
|
| |
(ii) Directors |
| |
Andrew Hume |
Managing Director | |
Lincoln Moore |
Non-Executive Director | |
Tim Armstrong |
Non-Executive Director
| |
|
| |
(b) Compensation of Key Management Personnel
2026 |
Salary and Fees |
Shares issued
|
Post Employment Super |
Total Fees for Services rendered |
Short-term employee benefits |
Total Benefit
|
|
£’000 |
£’000 |
£’000 |
£’000 |
£’000 |
£’000 |
Directors |
|
|
|
|
|
|
Alastair Clayton |
55 |
- |
- |
55 |
- |
55 |
Tim Armstrong |
32 |
- |
- |
32 |
- |
32 |
Lincoln Moore |
32 |
- |
- |
32 |
- |
32 |
Andrew Hume* |
153 |
- |
18 |
171 |
- |
171 |
2026 Total |
272 |
- |
18 |
290 |
- |
290 |
During the year Andrew Humes salary fit the recognition criteria under IFRS 6 and was capitalised into the exploration asset. A total cost of £136,861 was capitalised in the current year.
2025 |
Salary and Fees |
Shares issued
|
Post Employment Super |
Total Fees for Services rendered |
Short-term employee benefits |
Total Benefit
|
|
£’000 |
£’000 |
£’000 |
£’000 |
£’000 |
£’000 |
Directors |
|
|
|
|
|
|
Alastair Clayton |
102 |
- |
- |
102 |
- |
102 |
Nicole Galloway Warland 1 |
64 |
- |
7 |
71 |
- |
71 |
Mark McGeough 2 |
13 |
- |
- |
13 |
- |
13 |
Tim Armstrong |
28 |
- |
- |
28 |
- |
28 |
Lincoln Moore 3 |
18 |
- |
- |
18 |
- |
18 |
Andrew Hume 4 |
54 |
- |
6 |
60 |
- |
60 |
Key Personnel |
|
|
|
|
|
|
Ray Ridge 5 |
22 |
- |
- |
22 |
- |
22 |
2025 Total |
301 |
- |
13 |
314 |
- |
314 |
During the year Andrew Humes, Nicole Garland and Mark McGeough’s salary fit the recognition criteria under IFRS 6 and was capitalised into the exploration asset. A total cost of £75,000 was capitalised in the current year.
- Resigned 8th October 2024
- Resigned 4th December 2024
- Appointed 4th December 2024
- Appointed 5th February 2025
- Resigned 4th December 2024
(c) Equity and rights over equity instruments granted as remuneration
Award |
Granted |
Tranche |
Number |
Vesting condition |
Performance rights — A Clayton granted on 7 September 2023 |
7 September 2023 |
- |
500,000 |
100,000 vest when the ASX traded CDI Price is A$0.25, plus an additional 16,000 for each A$0.01 that the ASX traded CDI Price exceeds A$0.25, to a maximum total of 500,000 Thor shares. The relevant CDI Price is the highest closing CDI price for CDIs traded on the ASX in the twelve months prior to the relevant first, second or third anniversary of the issuance of the Performance Shares |
Performance rights — A Clayton and T Armstrong, approved by shareholders on 28 November 2024 |
24 Nov 2024 |
1 |
20,000,000 |
Share price greater than or equal to A$0.05 |
2 |
15,000,000 |
Share price greater than or equal to A$0.05 and fully diluted market capitalisation exceeding A$65 million | ||
3 |
15,000,000 1 |
Establishment of a prospective resource of 300 billion cubic feet of helium and/or 800 billion cubic feet of hydrogen at any majority-owned project | ||
Warrants — A Hume, on appointment as Managing Director |
5 Feb 2025 |
A |
15,000,000 |
Vests immediately on commencement; exercisable at A$0.03, expiring two years from the date of issue |
B |
15,000,000 |
Vests six months from grant; exercisable at A$0.05, expiring three years from the date of issue | ||
C |
15,000,000 |
Vests eighteen months from grant; exercisable at A$0.07, expiring four years from the date of issue | ||
Performance rights — A Hume |
11 Nov 2025 |
1 |
15,000,000 |
Spudding of the first well to test for hydrogen and/or helium at the HY-Range Project expiring one month and 3 years after the grant date |
2 |
9,000,000 |
Grant of any additional licence at the HY-Range Project expiring one month and 3 years after the grant date | ||
3 |
6,000,000 |
Achievement of a technical milestone relating to potential resource or volumes expiring one month and 3 years after the grant date | ||
Performance rights — L Moore |
11 Nov 2025 |
1 |
4,500,000 |
Volume weighted average price of A$0.02 maintained for 20 consecutive days |
2 |
4,500,000 |
Volume weighted average price of A$0.05 maintained for 20 consecutive days | ||
3 |
6,000,000 |
Volume weighted average price of A$0.05 maintained for 20 consecutive days and fully diluted market capitalisation exceeding A$65 million | ||
Total |
140,500,000 |
| ||
- Exercised into ordinary shares in the current year
Share options were valued using a Black-Scholes methodology and are expensed over the vesting period above. Lincoln Moore’s performance rights were valued using a Parisian Barrier methodology to approximate the share price conditions.
(d) Options and Performance Shares holdings of Key Management Personnel
The movement during the reporting period in the number of options and performance shares that are convertible to ordinary shares in Thor Energy Plc held, directly, indirectly or beneficially, by key management personnel, including their personally related entities, is shown below.
Year Ended 30 June 2026
| |||||
Key Management Personnel |
Held at 30/6/25 or appointment date |
Options & Performance Shares Granted (Note D) |
Options & Performance Shares Lapsed/exercised (Note D) |
Held at 30/6/26 or retirement date |
Vested and exercisable at 30/6/26 |
Alastair Clayton |
40,146,154 |
|
(11,300,000) |
28,846,154 |
4,346,154 |
Andrew Hume |
45,000,000 |
30,000,000 |
|
75,000,000 |
30,000,000 |
Lincoln Moore |
|
15,000,000 |
|
15,000,000 |
|
Tim Armstrong |
15,000,000 |
|
(4,500,000) |
10,500,000 |
|
|
100,146,154 |
45,000,000 |
(15,800,000) |
129,346,154 |
34,346,154 |
Year Ended 30 June 2025
| |||||
Key Management Personnel |
Held at 30/6/24 or appointment date |
Options & Performance Shares Granted (Note D) |
Options & Performance Shares Lapsed (Note D) |
Held at 30/6/25 or retirement date |
Vested and exercisable at 30/6/25 |
Alastair Clayton |
5,146,154 |
35,000,000 |
- |
40,146,154 |
5,146,154 |
Nicole Galloway Warland |
3,700,000 |
- |
(2,000,000) |
1,700,000 |
1,700,000 |
Mark McGeough |
1,300,000 |
- |
(500,000) |
800,000 |
- |
Ray Ridge |
240,000 |
- |
(240,000) |
- |
- |
Andrew Hume |
- |
45,000,000 |
- |
45,000,000 |
15,000,000 |
Lincoln Moore |
- |
- |
- |
- |
- |
Tim Armstrong |
- |
15,000,000 |
- |
15,000,000 |
- |
|
10,386,154 |
95,000,000 |
(2,740,000) |
102,646,154 |
21,846,154 |
5. Taxation - Group
|
2026 |
2025 |
|
£’000 |
£’000 |
Analysis of charge in year |
- |
- |
Tax on profit on ordinary activities |
- |
- |
Factors affecting tax charge for year
The differences between the tax assessed for the year and the standard rate of corporation tax are explained as follows:
|
2026 |
2025 |
|
£’000 |
£’000 |
Loss on ordinary activities before tax |
(1,427) |
(7,441) |
Effective rate of corporation tax in the UK |
25% |
25.0% |
|
|
|
Loss on ordinary activities multiplied by the standard rate of corporation tax |
(357) |
(1,860) |
Effects of: |
|
|
Costs disallowable for tax purposes |
52 |
1,268 |
Future tax benefit not brought to account |
305 |
592 |
Current tax charge for year |
- |
- |
No deferred tax asset has been recognised because there is insufficient evidence of the timing of suitable future profits against which they can be recovered.
6. Earnings per share
|
2026 |
2025 |
Loss for the year (£ 000’s) |
(1,427) |
(7,441) |
|
|
|
Weighted average number of Ordinary shares in issue |
1,028,149,557 |
823,977,284 |
Loss per share (pence) – basic |
(0.14) |
(0.9) |
The basic earnings per share is derived by dividing the loss for the period attributable to ordinary shareholders by the weighted average number of shares in issue.
As the inclusions of the potential Ordinary Shares would result in a decrease in the loss per share they are considered to be anti-dilutive and as such not included.
7. Intangible fixed assets – Group
Deferred exploration costs
|
£'000 |
£'000 |
|
2026 |
2025 |
Cost |
|
|
At 1 July |
8,478 |
11,949 |
Exploration expenditure |
476 |
228 |
Acquired through acquisitions |
- |
3,274 |
Exchange gain/(loss) |
503 |
(795) |
Exploration expenditure write off |
(42) |
(5,026) |
Disposals |
(4,692) |
(1,152) |
At 30 June |
4,723 |
8,478 |
The Directors undertook an assessment of the following areas and circumstances that could indicate the existence of impairment:
- The Group’s right to explore in an area has expired, or will expire in the near future without renewal;
- No further exploration or evaluation is planned or budgeted for;
- A decision has been taken by the Board to discontinue exploration and evaluation in an area due to the absence of a commercial level of reserves; or
- Sufficient data exists to indicate that the book value will not be fully recovered from future development and production.
In the year ended 30 June 2026, this impairment assessment resulted in an impairment expense of £42,000 (2025: £5,026,000) from the disposal of its remaining Molyhil tenements and the write-down of EL30821, EL28948 and EL24392.
During the year, Thor entered into a term sheet with ASX-listed Tivan Limited (“Tivan”) for the sale of the tenements and associated mining information comprising the Molyhil Joint Venture, which holds the Molyhil Tungsten/Molybdenum/Copper Project (the “Project”) in the Northern Territory, Australia. Thor held a 75% interest through its subsidiary Molyhil Mining Pty Ltd (“Molyhil”), with ASX-listed Investigator Resources Limited (“Investigator” or “IVR”) (ASX: IVR) held the remaining 25%. Consideration is payable in the following tranches:
Milestone |
Estimated payment date |
Thor (75%) |
IVR(25%) |
Cash Non-Refundable Exclusivity (60 days) |
Sep-25 |
$375,000 (£187,500) |
$125,000 (£62,500) |
Cash Completion Payment |
Dec-25 |
$2,250,000 (£1,125,000) |
$750,000 (£375,000) |
Initial Deferred Completion Payment |
Sep-26 |
$1,312,500 (£656,250) |
$437,500 (£218,750) |
Second Deferred Completion Payment |
Sep-27 |
$1,312,500 (£656,250) |
$437,500 (£218,750) |
Final Deferred Completion Payment |
Sep-28 |
$1,312,500 (£656,250) |
$437,500 (£218,750) |
Total |
|
$6,562,500 (£3,281,250) |
$2,187,500 (£1,093,750) |
The future consideration has been discounted to present value using the Group’s estimated current borrowing cost, reflecting the cost of capital and the timing of the receipts, which extend to September 2028. The resulting net present value of the consideration was A$5.74 million (£2.78 million). Interest income of A$137,191 (£72,260) was recognised in the year in respect of the unwinding of that discount. The carrying value of £4,692,000, relating to the Molyhil project and the 60% interest in the Bonya tenements, was derecognised on disposal. The second payment was received in September 2026 with Tivan electing to pay 50% in cash and 50% in shares
8. Investments
The Company holds 20% or more of the share capital of the following companies:
Company |
Principal Activity |
Country of registration or incorporation |
Shares held Class |
% |
|||||
Molyhil Mining Pty Ltd |
Exploration |
Australia |
Ordinary |
100 |
|||||
Go Exploration Pty ltd |
Exploration |
Australia |
Ordinary |
80.2 |
|||||
Hale Energy Pty Ltd |
Exploration |
Australia |
Ordinary |
100 |
|||||
Hammersley Metals Pty Ltd |
Dormant |
Australia |
Ordinary |
100 |
|||||
Pilbara Goldfields Pty Ltd |
Exploration |
Australia |
Ordinary |
100 |
|||||
American Vanadium Pty Ltd |
Exploration |
Australia |
Ordinary |
100 |
|||||
Standard Minerals Inc |
Exploration |
United States |
Ordinary |
25 |
|||||
Cisco Minerals Inc |
Exploration |
United States |
Ordinary |
25 |
|||||
EnviroCopper Limited |
Exploration |
Australia |
Ordinary |
24 |
|||||
The registered office for Molyhil Mining Pty Ltd, Hale Energy, Hammersley Metals Pty Ltd, Pilbara Goldfields Pty Ltd and American Vanadium Pty ltd is 1/295 Rokeby Rd, Subiaco WA 6008.
The registered office for Go Exploration Pty Ltd is 194 Hay Street, Subiaco, WA 6008. The registered office of Standard Minerals Inc and Cisco Minerals Inc is 3500 Washington Avenue, Ste 200, Houston, TX 77007, United States. | |||||||||
|
|||||||||
(a) Investments Subsidiary companies: |
|
|
|
|
|||||
|
|
Company |
|||||||
|
|
|
£'000 |
£'000 |
|||||
|
|
|
2026 |
2025 |
|||||
Investment in subsidiary undertakings |
|
|
5,881 |
5,881 |
|||||
Less: Impairment provision against investment |
|
|
(2,637) |
(2,637) |
|||||
|
|
|
3,244 |
3,244 |
|||||
|
|
|
|
|
|||||
(b) Loans to subsidiaries: |
|
|
|
|
|||||
|
|
Company |
|||||||
|
|
|
£'000 |
£'000 |
|||||
|
|
|
2026 |
2025 |
|||||
Loans to subsidiary undertakings |
|
|
19,324 |
19,227 |
|||||
Less: Impairment provision against loan |
|
|
(15,502) |
(7,921) |
|||||
|
|
|
3,822 |
11,306 |
|||||
The current investment balance relates solely to the Company’s investment in Go Exploration. The remaining investments have been impaired to nil.
The loans to subsidiaries are non-interest bearing, unsecured and are repayable upon reasonable notice having regard to the financial stability of the company. During the year an net impairment charge of £7,581,000 was recorded against the Company’s loan to Molyhil Mining to reflect the sale of its core assets.
|
|
| ||
(c) Financial assets at fair value through profit or loss:
|
Consolidated |
Company | ||
|
£'000 |
£'000 |
£'000 |
£'000 |
|
2026 |
2025 |
2026 |
2025 |
|
|
|
|
|
Non-current |
- |
|
- |
- |
Investment in EnviroCopper Limited (ECL) |
- |
131 |
|
- |
Investment in Standard Minerals (STD) |
246 |
- |
- |
- |
Investment in Cisco Minerals (CML) |
41 |
- |
- |
- |
Total financial assets |
287 |
131 |
|
- |
|
Consolidated |
Company | ||
|
£'000 |
£'000 |
£'000 |
£'000 |
|
2026 |
2025 |
2026 |
2025 |
A reconciliation of the carrying amount of the investments in the company is set out below: |
|
|
|
|
|
|
|
|
|
|
|
|
|
|
Opening balance |
131 |
- |
|
|
Amount reclassified from/(to) equity accounted investments 1 |
(502) |
535 |
- |
- |
Amount reclassified from investments 2 |
287 |
- |
- |
- |
Fair value revaluation |
365 |
(371) |
- |
- |
Exchange movements |
6 |
(33) |
- |
- |
|
287 |
131 |
- |
- |
- The Group's investment in EnviroCopper Limited ("ECL") has been reclassified in both periods presented. In the prior year, on 28 November 2024 the Group's representative on the ECL board resigned and was not replaced and, following a series of share issues by ECL which diluted the Group's interest from 30% to 24%, the Directors concluded that the Group had lost significant influence. The investment was reclassified from an investment accounted for using the equity method to a financial asset at fair value through profit or loss from that date, the carrying amount at the date of reclassification of £535,000 being taken as its fair value on initial recognition, ECL being an early stage company for which no market comparatives are available. In the current year, on 2 March 2026 the Group regained significant influence on the appointment of a Director of the Group to the ECL board, and the investment was reclassified from a financial asset at fair value through profit or loss to an investment accounted for using the equity method from that date, its fair value at that date being taken as the deemed cost of the associate (refer notes 1 and 8(d)).
- The Group's financial assets at fair value through profit or loss comprise its retained 25% interests in Standard Minerals Inc. and Cisco Minerals Inc., following the disposal of 75% of each to Metals One Plc on 12 August 2025 (refer note 8(f)). A holding of 20% or more gives rise to a presumption of significant influence. The Directors have rebutted that presumption on the following grounds: the Group has no representation on the board of either company; although the Group holds an option to appoint a Director, it has not exercised that option and does not intend to do so; the Group takes no part in the operating or financial policy decisions of either entity, and no management, technical or operational information is exchanged beyond that available to shareholders generally; and the remaining 75% of each company is held by a single shareholder, whose majority position allows it to determine all matters reserved to the board and to shareholders without the Group's support. The Directors have therefore concluded that the Group does not have the power to participate in the financial and operating policy decisions of either entity, and the interests are measured at fair value through profit or loss under IFRS 9. Fair value is a Level 3 measurement determined by reference to the consideration attributable to the 75% interest disposed, grossed up pro rata to the retained holding, no observable market data being available.
(d) Investments accounted for using the equity method: |
|
|
|
|
|
Consolidated |
Company | ||
|
£'000 |
£'000 |
£'000 |
£'000 |
|
2026 |
2025 |
2026 |
2025 |
A reconciliation of the carrying amount of the investments in the company is set out below: |
|
|
|
|
EnviroCopper Ltd |
|
|
|
|
Amount reclassified from FVTPL |
502 |
- |
|
|
Initial cost of the equity accounted investment |
- |
599 |
- |
- |
Share of loss of associate, accounted for using the equity method |
(99) |
(63) |
- |
- |
Share of foreign currency translation reserve |
4 |
(1) |
- |
- |
Amount reclassified to financial assets through profit and loss |
- |
(535) |
- |
- |
|
407 |
- |
- |
- |
At the commencement of the year ended 30 June 2024, Thor held a 30% equity interest in private Australian company, EnviroCopper Limited (“ECL”). ECL had agreed to earn, in two stages, up to 75% of the rights over metals which may be recovered via ISR contained in the Kapunda deposit from Australian listed company, Terramin Australia Limited (“Terramin” ASX: “TZN”), and rights to 75% of the Alford West copper project comprising the northern portion of exploration licence EL5984 held by Andromeda Metals Limited (ASX: AND, “Andromeda”).
During the year ended 30 June 2024, ECL signed an agreement to acquire the remaining 25% of exploration Licence 5984 from Andromeda. As part of the acquisition consideration, ECL issued Andromeda 203,008 ECL shares equivalent to 5% of the current ECL capitalisation. This issue of ECL shares diluted Thor’s equity interest in ECL to 28.6%. ECL then issued a further 101,504 ECL shares upon successful completion of a Site Environmental Lixiviant Test to dilute Thor’s holdings to 26.3%. On 7th October 2024 there was an additional allotment to dilute Thor’s ownership to 25.8%. On 31 December 2024 ECL then issued a further 321,405 shares to Aligator Energy diluting Thor’s Ownership to 24%. On 28th November 2024 the Thor representative on the ECL board resigned and was not replaced. At this point it was determined that Thor energy did not have significant influence over the decision making of ECL and the investment was reclassified as a Financial asset held at fair value through profit and loss. On 2 March 2026 Lincoln Moore, a Director of the Group, was appointed as a Director to ECL. The Directors assessed the same indicators in combination: Thor holds 24%, above the 20% level at which significant influence is presumed; board representation, although non-executive, restores Thor's vote on matters reserved to the ECL board and its access to board information; and technical information is again exchanged in respect of the project. Therefore on appointment date the investment was reclassified from fair value through profit or loss to an equity accounted investee from that date.
During the year, ECL raised A$3.5 million (£1.75 million). This funding is convertible to equity shares at the option of the investor and therefore ECL has not issued shares till date. This could potentially dilute the holding to 20%. As management cannot reliably estimate the occurrence of the issue of shares and therefore investment in ECL is computed based on 24% of the net assets of the ECL
See note 22 for summarised financial information for the investment
(e) Acquisition of Go Exploration Pty Ltd:
On 17 February 2025, Thor acquired 80.2% of the equity instruments of Go Exploration Pty Ltd (GOX) an Australian based company with rights to the PEL 120 Hydrogen exploration licence.
Under IFRS 3, a business must have three elements: inputs, processes and outputs to constitute a business combination.
At acquisition GOX was a largely dormant exploration company with little underlying assets. Whilst the entity had titles to mineral properties this could not be considered inputs because of their early stage of development.
Additionally, the Company had no processes including no workforce to produce outputs and had not completed a feasibility study or a preliminary economic assessment on any of their properties and had no infrastructure or assets that could produce outputs. Therefore, the Directors’ conclusion was that the transactions were asset acquisitions and not business combinations.
The details of Thor’s acquisition of GOX are as follows:
Net assets acquired |
£'000 |
Exploration assets |
3,274 |
Cash and cash equivalents |
9 |
Other current liabilities |
(6) |
Non-controlling interest |
(32) |
Total |
3,245 |
Total purchase price |
£'000 |
Amount settled in shares |
3,032 |
Transaction costs |
213 |
Total |
3,245 |
(f) Disposal of Standard Minerals and Cisco Minerals:
On 12th August 2025, the Group completed the disposal of 75% of its remaining U.S. subsidiaries Standard Minerals Inc. and Cisco Minerals Inc., which held the Group’s vanadium and uranium projects, resulting in a loss of control due to disposal of a majority stake. Total consideration received was £100,000 cash together with the issue of freely tradable shares in Metals One Plc with a fair value of approximately £761,024. Following the disposal, the Group retained a 25% interest in both entities. A reconciliation to the loss recorded in the profit and loss is below:
|
£ |
Cash consideration (exclusivity payment) |
100,000 |
Fair value of Metals One Plc shares received (14,224,751 shares at £.0535) |
761,000 |
Total consideration |
861,000 |
Fair value of retained 25% interest 1 |
287,000 |
Less: carrying value of net liabilities disposed |
(1,617,000) |
(Loss) recognised in profit or loss |
(469,000) |
1 -The fair value of the retained 25% interest in each Subsidiary (£287,000) in aggregate) has been determined by the Directors based on the implied value of the disposal transaction, being the total consideration attributed to a 75% interest grossed up pro-rata to reflect the retained 25% holding. No independent valuation was obtained. The Directors consider this basis to be a reasonable approximation of fair value at the disposal date.
- Deposits
|
Consolidated |
Company | ||
|
£'000 |
£'000 |
£'000 |
£'000 |
|
2026 |
2025 |
2026 |
2025 |
Deposits with banks and Government agencies |
40 |
80 |
- |
- |
|
40 |
80 |
- |
- |
|
|
|
|
|
- Right of use asset
Options to extend or terminate
The Company's lease contains no option to extend.
Variable lease payments
The company does not have any variable lease payments.
|
|
|
Consolidated |
Company | |||||
|
|
|
£'000 |
£'000 |
£'000 |
£'000 | |||
|
|
|
2026 |
2025 |
2026 |
2025 | |||
|
|
|
|
|
|
| |||
Leased building |
|
|
- |
69 |
|
- | |||
Less: accumulated depreciation |
|
|
- |
(59) |
|
- | |||
Right of use asset |
|
|
- |
10 |
|
- | |||
Movements in Carrying Amount |
|
|
|
|
|
| |||
Opening balance |
|
|
10 |
35 |
|
- | |||
Depreciation expense |
|
|
(10) |
(23) |
|
- | |||
Foreign exchange translation gain / (loss) |
|
|
- |
(2) |
|
- | |||
|
|
|
- |
10 |
|
- | |||
|
|
|
|
|
|
| |||
(ii) IFRS 16 related amounts recognised in the Statement of Comprehensive Income/(Loss) |
|
|
|
|
|
| |||
Depreciation charge related to right of use asset |
|
|
(10) |
(23) |
|
- | |||
Interest expense on lease liabilities |
|
|
- |
(5) |
|
- | |||
Short term lease expenses |
|
|
- |
- |
|
- | |||
|
|
|
|
|
|
- | |||
(iii) Total Full Year cash outflows for leases |
|
|
(10) |
(25) |
|
- | |||
11. Property, plant and equipment
|
Consolidated |
Company | ||
|
£'000 |
£'000 |
£'000 |
£'000 |
Plant and Equipment: |
2026 |
2025 |
2026 |
2025 |
At cost |
- |
- |
- |
- |
Accumulated depreciation |
- |
- |
- |
- |
Total Property, Plant and Equipment |
- |
- |
- |
- |
Movements in Carrying Amounts
Movement in the carrying amounts for each class of property, plant and equipment between the beginning and the end of the current financial year.
|
Consolidated |
Company | ||
|
£'000 |
£'000 |
£'000 |
£'000 |
|
2026 |
2025 |
2026 |
2025 |
- |
7 |
- |
- | |
Additions |
- |
- |
- |
- |
Disposals |
- |
(4) |
- |
- |
Foreign exchange impact, net |
- |
- |
- |
- |
Depreciation expense |
- |
(3) |
- |
- |
At 30 June |
- |
- |
- |
- |
12. Trade receivables and other assets
|
Consolidated |
Company | ||
|
£'000 |
£'000 |
£'000 |
£'000 |
Non-current |
|
|
|
|
Deferred consideration |
1,011 |
- |
- |
- |
|
1,011 |
- |
- |
- |
|
|
|
|
|
Current |
2026 |
2025 |
2026 |
2025 |
Trade and other receivables |
9 |
24 |
6 |
2 |
Prepayments |
9 |
26 |
28 |
12 |
Deferred consideration |
677 |
- |
- |
- |
|
695 |
50 |
34 |
14 |
Deferred consideration is the staged payments owed for the Group’s disposal of its Molyhil tenements to Tivan. Refer to Note 7 and 19.2 for further information.
At 30 June 2026 all trade and other receivables were fully performing. No ageing analysis is considered necessary as the Group has no significant trade receivables which would require such an analysis to be disclosed under the requirements of IFRS 9.
The above trade receivables and other assets are held predominantly in Australian Dollars.
The maximum exposure to credit risk at the reporting date is the carrying value of each class of receivable mentioned above. The Group does not hold any collateral as security.
13. Current trade and other payables
|
Consolidated |
Company | ||
|
£'000 |
£'000 |
£'000 |
£'000 |
|
2026 |
2025 |
2026 |
2025 |
Trade payables |
(61) |
(28) |
(12) |
(15) |
Other payables |
(57) |
(166) |
(55) |
(149) |
|
(118) |
(194) |
(67) |
(164) |
The carrying amounts of trade and other payables are denominated in the following currencies:
UK Pounds |
(67) |
(164) |
(67) |
(164) |
Australian Dollars |
(51) |
(30) |
- |
- |
|
(118) |
(194) |
(67) |
(164) |
14. Lease liability | |||||||||
|
Consolidated |
Company |
|||||||
|
|
|
£'000 |
£'000 |
£'000 |
£'000 |
|||
|
|
|
2026 |
2025 |
2026 |
2025 |
|||
Lease Liability is represented by: |
|
|
|
|
|||||
Current |
- |
(10) |
-- |
- |
|||||
Non-Current |
- |
- |
- |
- |
|||||
Total Lease Liability |
- |
(10) |
- |
- |
|||||
15. Issued share capital
|
2026 |
2025 | ||||||||
|
£'000 |
£'000 | ||||||||
Issued up and fully paid: |
|
| ||||||||
982,870,766 ‘Deferred Shares’ of £0.0029 each (1) |
2,850 |
2,850 | ||||||||
7,928,958,500 ‘A Deferred Shares’ of £0.000096 each (1) |
761 |
761 | ||||||||
1,005,072 Ordinary shares of £0.001 each |
1,029 |
1,004 | ||||||||
(2025: 982,870,766 ‘Deferred Shares’ of £0.0029 each, 7,928,958,500 ‘A Deferred Shares’ of £0.000096 each and 1,030,072,634 ordinary shares of £0.0001 each) |
|
| ||||||||
|
4,640 |
4,615 | ||||||||
Movement in share capital |
|
|||||||||
|
2025 |
|||||||||
Ordinary shares of £0.001 |
Number |
Share capital |
Share Premium |
Total |
||||||
|
# |
£’000 |
£’000 |
£’000 |
||||||
At 1 July |
378,610,068 |
3,989 |
28,916 |
32,905 |
||||||
Shares issued for cash (2) |
133,333,316 |
134 |
866 |
1,000 |
||||||
Shares issued for asset acquisition (3) |
466,462,584 |
466 |
2,566 |
3,032 |
||||||
Fee shares (4) |
25,000,000 |
25 |
162 |
187 |
||||||
Fee shares (5) |
1,666,666 |
1 |
9 |
10 |
||||||
Share issue costs |
- |
- |
(62) |
(62) |
||||||
At 30 June |
1,005,072,634 |
4,615 |
32,457 |
37,072 |
||||||
|
|
|
|
|
||||||
At 1 July |
1,005,072,634 |
4,615 |
32,457 |
37,072 |
||||||
Deferred consideration shares (6) |
10,000,000 |
10 |
43 |
53 |
||||||
Exercise of performance rights (7) |
15,000,000 |
15 |
15 |
30 |
||||||
Share issue costs |
- |
- |
- |
- |
||||||
At 30 June |
1,030,072,634 |
4,640 |
32,515 |
37,155 |
||||||
Nominal Value
- ‘Deferred Shares’ and ‘A Deferred Shares’ were created through a shareholder approved re-organisation of the Company’s capital in September 2013 and November 2016 respectively. The ‘Deferred Shares’ and ‘A Deferred Shares’ may, subject to the provisions of the Companies Act 2006, may be cancelled by the Company, or bought back for £1 and then cancelled. These deferred shares are not quoted and carry no rights whatsoever.
- In October 2024 the Company has raised, in aggregate, gross proceeds of GBP£1,000,000 (~A$1,958,097) via the placing of 133,333,316 new ordinary shares of 0.1p each (Ordinary Shares) (Placing Shares) at a price of 0.75 pence (approx. AUD$0.015) per Ordinary share.
- On 17th February 2025 Thor completed its acquisition of 80.2% of the share capital of Go Exploration. To complete its acquisition Thor granted 466,462,584 consideration shares at £.0065 being the closing share price at the date of completion.
- As part of the Go Exploration acquisition, Orana Corporate was awarded 25,000,000 fee shares at £0.0075 per share.
- 1,666,666 ordinary shares were issued at £0.006 to settle an outstanding liability.
- On 29 July 2025 the Company issued 4,200,000 shares in satisfaction of a performance milestone relating to the 2020 acquisition of American Vanadium Pty Ltd. Under the terms of the agreement the shares vested following the completion of the reverse drilling campaign completed in February 2024. An additional 5,800,000 shares were also awarded as additional consideration between the two parties.
- On 31 March 2025 one of the vesting conditions for director performance shares issued to Mr Alastair Clayton and Mr Tim Armstrong, as approved at the 2024 Annual General Meeting (“Performance Shares”), have been met being the establishment of a prospective resource of 300 billion cubic feet of Helium and/or 800 billion cubic feet of Hydrogen across the Company’s majority-owned projects. Accordingly on 29 July 2025 Alastair Clayton and Tim Armstrong were awarded 10,500,000 and 4,500,000 ordinary shares respectively. As a result, the remaining fair value was recognised as a share based payment and the balance was transferred from the reserve into share premium.
Warrants and performance shares in issue
The following warrants (termed ‘options in Australia) and performance shares have been granted by the Company and have not been exercised as at 30 June 2026.
Number |
Grant Date |
Expiry Date |
Exercise Price |
3,125,0001 |
26 Nov 2021 |
25 Nov 2026 |
A$0.300 |
18,518,5202 |
3 Nov 2023 |
3 Nov 2028 |
A$0.300 |
50,000,0003 |
27 & 28 Jun 2026 |
27 Jun 2027 |
A$0.026 |
20,000,0004 |
27 Jun 2026 |
27 Jun 2027 |
A$0.026 |
500,0005 |
7 Sep 2023 |
7 Sep 2026 |
- |
35,000,000 6 |
24 Nov 2024 |
23 Nov 2027 |
- |
45,000,000 7 |
05 Feb 2025 |
05 Feb 2027 05 Feb 2029 |
- A$0.07 |
10,000,000 8 |
24 Mar 2025 |
24 Mar 2027 |
A$0.03 |
10,000,000 8 |
24 Mar 2025 |
24 Mar 2028 |
A$0.03 |
15,000,000 9 |
11 Nov 2025 |
11 Dec 2028 |
- |
30,000,000 10 |
11 Nov 2025 |
11 Dec 2028 |
- |
237,143,520 Total outstanding |
|
|
|
Share warrants and performance rights carry no rights to dividends and no voting rights, one option or performance share converts to one ordinary share.
- Warrants granted as part of the consideration for an acquisition.
- Warrants granted as consideration for the acquisition of an exploration asset
- Warrants granted to investors as part of a capital raise.
- Warrants granted to the lead broker of a capital raise.
- Performance rights granted to Directors, following shareholder approval. Vesting is subject to the achievement of price hurdles measured against the traded price of ordinary shares quoted on the ASX as CDIs.
- 50,000,000 performance rights issued to Directors of the Company. During the year 15,000,000 performance shares converted into ordinary shares in the Company with 35,000,000 remaining unexercised
- 45,000,000 warrants issued to the Managing Director as approved by shareholders.
- 20,000,000 warrants issued to the Broker of the Company.
- 15,000,000 performance rights were issued to a director of the Company vesting over three market price conditions.
- 30,000,000 performance rights were issued to the Managing Director of the Company vesting upon the completion of three technical milestones.
The following reconciles the outstanding warrants at the beginning and end of the financial year:
Number |
Number |
Weighted Average Exercise Price (GBP) |
Balance at 1 July 2024 |
164,150,166 |
0.049 |
Granted during the year |
65,000,000 |
0.021 |
Lapsed post consolidation |
(68,906,646) |
0.045 |
Balance as at 30 June 2025 |
160,243,520 |
0.036 |
Balance exercisable as at 30 June 2025
|
160,243,520 |
0.036 |
Number |
Number |
Weighted Average Exercise Price (GBP) |
Balance as at 1 July 2025 |
160,243,520 |
0.036 |
Granted during the year |
- |
- |
Lapsed during the year |
(3,600,000) |
0.13 |
Balance as at 30 July 2026 |
156,643,520 |
0.036 |
Balance exercisable as at 30 July 2026 |
156,643,520 |
0.036 |
The warrants outstanding at 30 June 2026 had a weighted average remaining number of days until expiry of 504 days (2025: 776 days).
The following reconciles the outstanding performance rights at the beginning and end of the financial year:
Number |
Number |
Balance at the beginning of the year |
3,000,000 |
Granted during the year |
50,000,000 |
Lapsed/exercised during the year |
(2,500,000) |
Balance as at 30 June 2025 |
50,500,000 |
Balance exercisable as at 30 June 2025
|
- |
Number |
Number |
Balance at the beginning of the year |
50,500,000 |
Granted during the year |
45,000,000 |
Lapsed/exercised during the year |
(15,000,000) |
Balance as at 30 July 2026 |
80,500,000 |
Balance exercisable as at 30 July 2026 |
- |
The performance shares outstanding at 30 June 2026 had a weighted average remaining number of days until expiry of 706 days (2025: 871 days).
16. Share based payments reserve
|
2026 |
2025 |
£’000 |
£’000 | |
|
|
|
Opening balance |
715 |
933 |
|
|
|
Warrants and performance rights exercised or lapsed |
|
|
Lapsed 480,000 @£0.0767 |
- |
(30) |
Lapsed 480,000 @£0.0767 |
- |
(30) |
Lapsed 480,000 @£0.0767 |
- |
(30) |
Lapsed 9,464,285 @ £0.0473 |
- |
(152) |
Lapsed 5,800,000 @ £0.0473 |
- |
(19) |
Lapsed 2,500,000 performance rights @£0.16 |
- |
(7) |
Exercise 15,000,000 performance rights @ £0.003339 2 |
(30) |
- |
Lapsed 3,600,000 warrants @ £0.0656 |
(236) |
- |
|
(266) |
(268) |
Warrants and performance rights expensed through the Statement of comprehensive income |
|
|
Issued 3,000,000 performance shares @ £0.01841 1 |
- |
4 |
Issued 20,000,000 performance shares @ £0.001792 2 |
24 |
11 |
Issued 15,000,000 performance shares @ £0.000777 2 |
8 |
5 |
Issued 15,000,000 performance shares @ £0.003339 2 |
24 |
6 |
Issued 15,000,000 warrants @ £0.00249 3 |
- |
5 |
Issued 15,000,000 warrants @ £0.000957 3 |
3 |
11 |
Issued 15,000,000 warrants @ £0.000774 3 |
8 |
3 |
Issued 10,000,000 warrants @0.000777 4 |
5 |
3 |
Issued 10,000,000 warrants @0.001291 4 |
10 |
2 |
Issued 4,500,000 performance shares @ 0.006364 5 |
6 |
- |
Issued 4,500,000 performance shares @ 0.003510 5 |
3 |
- |
Issued 6,000,000 performance shares @ 0.003432 5 |
4 |
- |
Issued 15,000,000 performance shares @ 0.003345 6 |
2 |
- |
Issued 9,000,000 performance shares @ 0.001672 6 |
1 |
- |
Issued 6,000,000 performance shares @ 0.000669 6 |
1 |
- |
Correction of prior period under-recognition |
48 |
- |
|
147 |
50 |
|
|
|
|
|
|
Closing balance |
596 |
715 |
1) 3,000,000 Performance shares issued to directors on 7 September 2024, following shareholder approval on 23 August 2024. The 2,000,000 performance shares issued to Ms Galloway Warland vest as follows: 400,000 when the ASX traded CDI Price is A$0.25 plus an additional 64,000 for each A$0.01 that the ASX traded CDI Price exceeds A$0.25, to the maximum 2,000,000 Thor shares. For the 500,000 performance shares issued to each of Messrs Clayton and McGeough, 100,000 vest to each of them when the ASX traded CDI Price is A$0.25 plus an additional 16,000 for each A$0.01 that the ASX traded CDI Price exceeds A$0.25, to a maximum total of 500,000 Thor shares each. The relevant CDI Price is the highest closing CDI price for CDIs traded on the ASX in the twelve months prior to the relevant first, second or third anniversary of the issuance of the Performance Shares. During the prior year the performance rights to Ms Galloway Warland and Mr McGeough lapsed after both left the Company.
2) 50,000,000 Performance Shares issued to directors following shareholder approval on 28 November 2024. The 35,000,000 performance shares issued to Mr Alastair Clayton and the 15,000,000 performance shares issued to Mr Tim Armstrong vest as follows:
- 40% convert to ordinary shares if the ASX traded CDI Price is A$0.05 or higher.
- 30% convert if the ASX traded CDI Price is A$0.05 or higher and the fully diluted market capitalisation of the Company exceeds A$65 million (£32.5 million).
- 30% convert if the Company establishes a prospective resource of 300 billion cubic feet of helium or 800 billion cubic feet of hydrogen at any of its majority-owned projects.
The relevant CDI Price is the highest closing CDI price for CDIs traded on the ASX in each six-monthly interval over the three years following issuance. Any unvested performance shares lapse one month after the third anniversary of issuance, or earlier in the event of cessation of office or winding up, subject to Board discretion. During the year 15,000,000 performance rights were issued upon the publication of a prospective resource.
3) 45,000,000 warrants issued to Mr Andrew Hume on his appointment as Managing Director on 5 February 2025. The warrants were granted under three tranches as follows: 15,000,000 Series A Options exercisable at A$0.03 each expiring 2 years from the date of issue, vesting immediately on commencement; 15,000,000 Series B warrants exercisable at A$0.05 each expiring 3 years from the date of issue, vesting 6 months after commencement; and 15,000,000 Series C Options exercisable at A$0.07 each expiring 4 years from the date of issue, vesting 18 months after commencement. All unvested options lapse on termination of employment unless otherwise agreed by the Company, with all options vesting on a change of control of Thor Energy Plc
4) 20,000,000 Corporate Advisor warrants issued to Prenzler Group (or its nominee) pursuant to an Investor Relations and Corporate Advisory engagement dated 24 March 2026. The options were granted in two tranches: 10,000,000 unlisted warrants exercisable at A$0.03 on or before 27 June 2027, vesting 6 months after commencement of the engagement, and 10,000,000 unlisted options exercisable at A$0.03 on or before 27 June 2028, vesting 11 months after commencement of the engagement
5)15,000,000 performance rights issued to Lincoln Moore vesting on the following milestones:
- 30% vesting upon the company’s share price maintaining a volume weighted average price of $A0.02 for 20 consecutive days;
- 30% vesting upon the company’s share price being greater or equal than $A0.05; and
- 40% vesting upon the company’s share price being greater of equal than $A0.05 and the fully diluted market capitalisation of the Company exceeds A$65m (£32.5 million)
The performance rights expire one month after the third annual anniversary of the issuance of the performance shares
6) 30,000,000 performance shares were issued to Andrew Hume vesting upon the following mile technical milestones:
- 50% upon the Company achieving spudding of the first well in the HY Range Project;
- 30% vesting upon any additional licenses being granted at the above project; and
- 20% vesting upon the establishment of a either 25bcf or 300MMcF of either Hydrogen and Helium at the HY Range Project.
The performance rights expire one month after the third year anniversary of the grant date.
Options are valued at an estimate of the cost of the services provided. Where the fair value of the services provided cannot be estimated, the value of listed options granted is calculated by reference to the last traded price, or for unlisted options by using the Black-Scholes model taking into account the terms and conditions upon which the options are granted. Where the options contain market based vesting conditions a Monte Carlo options valuation or Parisian barrier calculation is undertaken. The following table lists the inputs calculations used for the share options in the balance of the Share Based Payments Reserve as at 30 June 2026 or lapsed during the year ended 30 June 2026.
Warrants and options issued as at 30 June 2026:
Grant Date |
Number |
Dividend yield |
Underlying Security spot price |
Exercise price |
Standard deviation of returns |
Risk free rate |
Expiration period |
valuation per option |
26 /11/2021 |
3,125,000 |
0.00% |
A$0.15 |
A$0.30 |
126% |
1.44% |
5yrs |
£0.06463 |
03/11/2023 |
18,518,520 |
0.00% |
A$0.0240 |
A$0.300 |
115% |
4.36% |
5.2yrs |
£0.0060 |
05/01/2023 |
20,000,000 |
0.00% |
A$0.016 |
A$0.026 |
110% |
3.85% |
5yr |
£0.00501 |
05/02/2025 |
15,000,000 |
0.00% |
£.012 |
A$0.03 |
45% |
4.5% |
2yr |
£0.00249 |
05/02/2025 |
15,000,000 |
0.00% |
£.012 |
A$0.05 |
71% |
4.5% |
3yr |
£0.000957 |
05/02/2025 |
15,000,000 |
0.00% |
£.012 |
A$0.07 |
64% |
4.5% |
4yr |
£0.000774 |
24/03/2025 |
10,000,000 |
0.00% |
£.011 |
A$0.03 |
71% |
4.5% |
2yr |
£0.000777 |
24/03/2025 |
10,000,000 |
0.00% |
£.011 |
A$0.03 |
71% |
4.5% |
3yr |
£0.001291 |
|
|
|
|
|
|
|
|
|
|
|
|
|
|
|
|
|
|
Performance rights as at 30 June 2026:
|
Grante Date |
Number |
Dividend yield |
Underlying Security spot price |
Exercise price |
Standard deviation of returns |
Risk free rate |
Expiration period |
Valuation per option |
Director Performance rights1 |
07/09/2023 |
500,000 |
0.00% |
A$0.050 |
A$0.000 |
125.43% |
3.87% |
3yrs |
£0.01841 |
Performance rights T1 |
24/11/2024 |
20,000,000 |
0.00% |
£0.0066 |
A$0.000 |
72.5% |
4% |
3yrs |
£0.0036 |
Performance rights T2 |
24/11/2024 |
15,000,000 |
0.00% |
£0.0066 |
A$0.000 |
72.5% |
4% |
3yrs |
£0.00155 |
LM T1 |
11/11/2025 |
4,500,000 |
0.00% |
A$0.0135 |
A$0.000 |
70% |
4% |
3yrs |
£0.0064 |
LM T2 |
11/11/2025 |
4,500,000 |
0.00% |
A$0.0135 |
A$0.000 |
70% |
4% |
3yrs |
£0.0035 |
LM T3 |
11/11/2025 |
6,000,000 |
0.00% |
A$0.0135 |
A$0.000 |
70% |
4% |
3yrs |
£0.0034 |
AH T1 3 |
11/11/2025 |
15,000,000 |
0.00% |
A$0.0135 |
A$0.000 |
N/A |
N/A |
3yrs |
£0.0033 |
AH T2 3 |
11/11/2025 |
9,000,000 |
0.00% |
A$0.0135 |
A$0.000 |
N/A |
N/A |
3yrs |
£0.0017 |
AH T3 3 |
11/11/2025 |
6,000,000 |
0.00% |
A$0.0135 |
A$0.000 |
N/A |
N/A |
3yrs |
£0.0007 |
1 3,000,000 performance rights were issued to Directors of the Company in September 2023. In the current year 2,500,000 performance rights
2 - For the performance shares issued during the year , the Company estimated the vesting period to be the exercise period and applied probability of vesting to performance shares issued to Andrew Hume of 50%, 25% and 10%.
17. Cash and Cash Equivalents
|
Consolidated |
Company | ||
|
£'000 |
£'000 |
£'000 |
£'000 |
|
2026 |
2025 |
2026 |
2025 |
Cash at bank |
1,453 |
686 |
41 |
673 |
|
1,453 |
686 |
41 |
673 |
The majority of the Group’s cash at bank is held in licenced banks in the UK and Australia.
The carrying amounts of the Group’s and Company’s cash and cash equivalents are denominated in the following currencies:
|
Consolidated |
Company | ||
|
£'000 |
£'000 |
£'000 |
£'000 |
|
2026 |
2025 |
2026 |
2025 |
GBP |
9 |
588 |
9 |
588 |
AUD |
1,415 |
98 |
5 |
85 |
USD |
29 |
- |
27 |
- |
|
1,453 |
686 |
41 |
673 |
18. Contingent liabilities and commitments
- Exploration commitments
Ongoing exploration expenditure is required to maintain title to the Group’s mineral exploration permits. The Group’s total annual exploration commitments, including rent, at 30 June 2026 were £25,000 (2025: £72,000). No provision has been made in the financial statements for these amounts, as the expenditure is expected to be fulfilled in the normal course of the operations of the Group.
- Claims of native title
The Directors are aware of native title claims which cover certain tenements. The Group’s policy is to operate in a mode that takes into account the interests of all stakeholders including traditional owners’ requirements and environmental requirements. At the present date no claims for native title have seriously affected exploration by the Company.
- Contingent Liability
As at 30 June 2026, the Group had no contingent liabilities.
19. Financial instruments
The Group uses financial instruments comprising cash, liquid resources and debtors/creditors that arise from its operations.
A financial instrument is any contract that gives rise to both a financial asset of one enterprise and a financial liability or equity instrument of another enterprise.
The Group’s exposure to currency and liquidity risk is not considered significant. The Group’s cash balances are held in Pounds Sterling and in Australian Dollars, the latter being the currency in which the significant operating expenses are incurred.
To date the Group has relied upon equity funding to finance operations. The Directors are confident that they will be able to raise additional equity capital to finance operations to commercial exploitation but controls over expenditure are carefully managed.
The Group does not generally enter into derivative transactions (such as interest rate swaps and forward foreign currency contracts) and it is, and has been throughout the period under review, the Group’s policy that no trading in financial instruments shall be undertaken.
The net fair value of financial assets and liabilities approximates the carrying values disclosed in the financial statements.
Refer to note 17 for a breakdown of Group cash.
The financial assets comprise interest earning bank deposits and a bank operating account.
19.1 Financial instruments by category
Set out below is a comparison by category of carrying amounts and fair values of all of the Group’s financial instruments recognised in the financial statements. The fair value of cash and cash equivalents, trade receivables and payables approximate to book value due to their short-term maturity.
For investments in unlisted shares, the fair values have been determined using the most recently observed purchase price. Investments held (refer to note 8) are classified as level 3 assets on the fair-value hierarchy with regards to value.
|
2026 |
2025 | ||
|
Carrying Amount £’000 |
Fair Value £’000 |
Carrying Amount £’000 |
Fair Value £’000 |
Financial assets measured at fair value: |
|
|
|
|
Investment in ECL |
- |
- |
131 |
131 |
Investment in Standard & Cisco |
287 |
287 |
- |
- |
Financial assets at amortised costs |
|
|
|
|
Cash and cash equivalents |
1,453 |
1,453 |
686 |
686 |
Trade & other receivables |
9 |
9 |
24 |
24 |
Deposits supporting performance guarantees |
40 |
40 |
80 |
80 |
Deferred consideration |
1,688 |
1,688 |
- |
- |
|
|
|
|
|
Financial liabilities at amortised cost: |
|
|
|
|
Trade and other payables |
143 |
143 |
208 |
208 |
19.2 Financial instruments objectives and policies
The Company’s activities expose it to a variety of financial risks: currency risk, credit risk, liquidity risk and cash flow interest-rate risk. These risks are limited by the Group’s financial management policies and practices described below:
- Foreign currency exchange risks
The Group does not hedge its foreign currencies. Transactions with vendors are mainly denominated in a small number of currencies, predominantly Australian Dollar, US Dollar and British Pounds. Therefore, the directors consider that the currency exposure arising from these transactions is not significant to the Group.
At present the Group does not have any formal policy for hedging against exchange exposure. The Group may, when necessary, enter into foreign currency forward contracts to hedge against exposure from currency fluctuations, however, the Group has not entered into any currency forward contracts to date.
- Credit risk
As the Group had no turnover during the year, its credit risk arises principally on cash and cash equivalents held with banks and on the deferred consideration receivable from the disposal of the Molyhil FRAM JV. The Group does not have written credit risk management policies or guidelines. The Group’s cash is held in reputable banks. The carrying amount of these financial assets represent the maximum credit exposure. No collateral was held as security and other credit enhancements during the period. No financial assets are impaired or past due at the end of the reporting period.
The Group's principal concentration of credit risk at 30 June 2026 is the deferred consideration receivable from Tivan under the sale of the Group's 75% interest in the FRAM JV, comprising three annual instalments of A$1,312,500(£656,000) ( each (A$3,937,500 (£1,968,750) in aggregate) falling due in September 2026, 2027 and 2028 and carried at present value. The Directors do not consider this to represent a significant credit risk. The instalments are fixed contractual amounts under a binding sale agreement that completed on 19 January 2026, payable in cash or in Tivan shares at Tivan's election; the initial deposit and the A$2,250,00(£1,125,000) completion payment were received in full when due; the first payment of the three deferred consideration was received in September 2026 with Tivan electing to pay 50% in cash and 50% in shares. The Directors monitor the counterparty's ASX announcements and financial position and have recognised no expected credit loss against the receivable.
- Liquidity risks
To ensure liquidity, the Group maintains sufficient cash and cash equivalents to meet its obligations as and when they fall due. All amounts included in liabilities are expected to fall due within one year.
- Interest rate risk
The Group has no interest-bearing liabilities. Interest rates on bank deposits are based on the relevant national interbank offered rates. The Group has no fixed interest rate assets.
|
|
|
|
|
|
- Capital Risk management
The Group’s objectives when managing capital are to safeguard the Group’s ability to continue as a going concern, in order to provide returns for shareholders and benefits for other stakeholders, and to maintain an optimal capital structure to reduce the cost of capital.
In order to maintain or adjust the capital structure, the Group may adjust the amount of dividends paid to shareholders, return capital to shareholders, issue new shares, or sell assets to reduce debt.
20. Related party transactions
There is no ultimate controlling party.
Thor has lent funds to its wholly owned subsidiaries to enable those companies to carry out their operations. At 30 June 2026, the estimated recoverable amount converted to £3,822,000 (2025: £11,306,000) (refer Note 8(b)).
In the prior year the Group engaged the services of Prenzler Group, a Company in which Tim Armstrong is employed. During the year the Group paid £nil (2025: £58,000) for broking services however a share based payment charge of £15,000 was recognised for warrants issued in 2025.
Transactions with Directors and Director related entities are disclosed in Note 4. Tim Armstrong is paid via two personal services companies (PSI) , TST Consulting and TJA Assets Pty LTD for a total expense of $60,000 AUD £32,000) for the year.
21. Subsequent events
First Annual A$1.3m Deferred Payment for Molyhil
On 15 September 2026 The Group received the second payment of A$1,312,500 (£684,501) for the sale of its Molyhill assets. The Group received of 50% cash (A$656,250) and 50% in Tivan ordinary shares (A$656,250), half of the shares are in six-month voluntary escrow.
22. Investment in associate - summarised financial information
Summarised financial information in respect of EnviroCopper Ltd ("ECL"), the Group's material associate, is set out below. The information is based on ECL's unaudited consolidated management accounts:
Statement of financial position at 30 June 2026 |
A$ |
£'000 |
Cash and cash equivalents |
1,685,228 |
876 |
Other current assets |
42,375 |
22 |
Current assets |
1,727,603 |
898 |
Investment in Andromeda Metals Ltd shares |
600,152 |
312 |
Term deposit |
1,000,000 |
520 |
Environmental bonds |
40,000 |
21 |
Property, plant and equipment |
73,902 |
38 |
Right-of-use assets |
64,427 |
34 |
Non-current assets |
1,778,481 |
925 |
Trade and other payables |
(92,139) |
(48) |
Employee provisions |
(72,694) |
(38) |
Lease liabilities |
(31,045) |
(16) |
Current liabilities |
(195,878) |
(102) |
Non-current liabilities – lease liabilities |
(59,890) |
(31) |
Net assets |
3,250,316 |
1,690 |
Statement of comprehensive income for the period 1 March to 30 June 2026 |
A$ |
£'000 |
Revenue |
– |
– |
Loss for the period |
(779,324) |
(410) |
Other comprehensive income |
– |
– |
Total comprehensive loss for the period |
(779,324) |
(410) |
Dividends received from ECL |
– |
– |
Reconciliation to carrying amount |
|
£'000 |
Net assets of ECL at 2 March(reclassification from financial assets) |
|
2,095 |
Group's ownership interest |
|
24% |
Group's share of net assets |
|
502 |
Share of net loss |
|
(99) |
Exchange movement |
|
4 |
Carrying amount of the investment at 30 June 2026 |
|
407 |
ASX ADDITIONAL INFORMATION (unaudited)
Additional information required by the Australian Stock Exchange Limited Listing Rules and not disclosed elsewhere in this report.
Date and Place of Incorporation, and Application of Takeover Provisions
- The Company was incorporated in England on 3 November 2004 and reregistered as a public company on 6 June 2005.
- The Company is not subject to Chapters 6, 6A, 6B and 6C of the Australian Corporations Act dealing with the acquisition of shares (including substantial shareholdings and takeovers).
-
As a public company incorporated in England and Wales, Thor Energy Plc is subject to the City Code on Takeovers and Mergers (the Code). Subject to certain exceptions and limitations, a mandatory offer is required to be made under Rule 9 of the Code broadly where:
- a bidder and any persons acting in concert with it acquire shares carrying 30% or more of the voting rights of a target company; or
- if a bidder, together with any concert parties, increases its holding where its holding is not less than 30% but not more than 50% of the voting rights.
Rule 9 requires a mandatory offer to be made in cash and at the highest price paid by the bidder (or any persons acting in concert with it) for any interest in shares of the relevant class during the 12 months prior to the announcement of the offer.
In addition, save in certain specified circumstances, rule 5 of the code imposes restrictions on acquisitions which increase a person’s total number of voting rights in Thor Energy Plc (when aggregated with those of his concert parties) to 30% or more of the total voting rights of the company or if he, together with his concert parties, having an interest in 30% or more of such voting rights, acquires more voting rights up to (and including) a total of 50%.
Where a bidder obtains acceptances of at least 90% of the shares subject to a takeover offer (which excludes any shares held by it or its concert parties) and acceptances of at least 90% of the voting rights carried by the shares subject to the offer, it can require the remaining shareholders who have not accepted the offer to sell their shares on the terms of the offer.
Shareholdings (as at 1 September 2026)
Class of shares and voting rights
- at meetings of members or classes of members each member entitled to vote may vote in person or by proxy or attorney; and
- on a show of hands every person present who is a member has one vote, and on a poll every person present in person or by proxy or attorney has one vote for each Ordinary Share held.
On-market buy-back
There is no current on-market buy-back.
Securities in issue as at 1 September 2026
Total shares and CDIs on issue are 1,030,072,634.
Total unlisted options/warrants are 156,643,520.
Total performance shares/rights are 81,000,000.
Distribution of equity securities
Category (number of shares/CDIs) |
Number of Shareholders |
Units |
1 – 1,000 |
328 |
58,729 |
1,001 – 5,000 |
452 |
1,370,164 |
5,001 – 10,000 |
324 |
2,524,725 |
10,001 – 100,000 |
857 |
35,087,680 |
100,001 and over |
384 |
991,031,336 |
|
2,345 |
1,030,072,634 |
The number of Australian shareholders (CDI holders) holding less than a marketable parcel is 1,508.
Substantial holder notifications
On 21 February 2026, the Company lodged a substantial holder notice received from Ross Warner, Black Lantern Investments Pty Ltd atf Signal Super Fund, noting an interest of 135,496,275 Ordinary Shares (held as CDIs) being 13.50% in the total ordinary shares on issue at that time.
On 21 February 2026, the Company lodged a substantial holder notice received from Trent Spry, Brian Vivian SPRY & Trent Benjamin SPRY atf The Spry Superannuation Fund, noting an interest of 135,496,274 Ordinary Shares (held as CDIs) being 13.50% in the total ordinary shares on issue at that time.
Twenty largest shareholders (Ordinary Shares and CDI’s) as at 1 September 2026
Name |
Number of shares held |
Percentage of shares held |
BLACK LANTERN INVESTMENTS PTY LTD <SIGNAL SUPER FUND A/C> |
108,841,270 |
10.57% |
TRENT SPRY |
79,965,014 |
7.76% |
THE BANK OF NEW YORK (NOMINEES) LIMITED <672938> |
69,288,297 |
6.73% |
MR TRENT SPRY + MR BRIAN VIVIAN SPRY <THE SPRY SUPER FUND A/C> |
55,531,260 |
5.39% |
JAYLEAF HOLDINGS PTY LTD <THE POLLOCK INVESTMENT A/C> |
49,454,610 |
4.80% |
BARNARD NOMINEES LTD <OBNOMEX> |
36,063,880 |
3.50% |
MR FRANK LA PEDALINA |
30,478,635 |
2.96% |
BARCLAYS DIRECT INVESTING NOMINEES LIMITED <CLIENT1> |
30,049,818 |
2.92% |
ROSS MICHAEL WARNER |
26,655,005 |
2.59% |
GLOBAL INVESTMENT STRATEGY UK LIMITED <GISCLT> |
21,333,333 |
2.07% |
DAMOST PTY LTD <JESSIMAN SUPER FUND A/C> |
20,900,000 |
2.03% |
BARNARD NOMINEES LTD <OBNOMDIS> |
20,250,000 |
1.97% |
SUPER SECRET PTY LIMITED <TKOCZ SF A/C> |
20,000,000 |
1.94% |
MR ALASTAIR RAOUL CLAYTON |
18,192,308 |
1.77% |
HARGREAVES LANSDOWN (NOMINEES) LIMITED <15942> |
17,274,820 |
1.68% |
INTERACTIVE INVESTOR SERVICES NOMINEES LIMITED <SMKTISAS> |
15,280,789 |
1.48% |
BARNARD NOMINEES LTD <OBISA> |
13,698,762 |
1.33% |
SPENCER METALS PTY LTD <YORKSTONE UNIT A/C> |
10,821,760 |
1.05% |
INTERACTIVE INVESTOR SERVICES NOMINEES LIMITED <SMKTNOMS> |
10,699,605 |
1.04% |
BARNARD NOMINEES LTD <OBADV> |
10,669,180 |
1.04% |
TOTAL |
665,448,646 |
64.60% |
Unquoted Equity Securities
Class |
Units | |
Performance Rights/Shares |
80,500,000 | |
Unquoted Option exercisable at A$0.03 on or before 5 February 2027 |
15,000,000 | |
Unquoted Option exercisable at A$0.05 on or before 5 February 2028 |
15,000,000 | |
Unquoted Option exercisable at A$0.07 on or before 5 February 2029 |
15,000,000 | |
Unquoted Option exercisable at A$0.03 on or before 27 June 2027 |
10,000,000 | |
Unquoted Option exercisable at A$0.03 on or before 27 June 2028 |
10,000,000 | |
Unquoted Option exercisable at A$0.30 on or before 3 November 2028 |
18,518,520 | |
Unquoted Option exercisable at A$0.026 on or before 27 June 2027 |
70,000,000 | |
Unquoted Option exercisable at £0.1575 on or before 15 November 2026 |
3,125,000 | |
TOTAL |
237,643,520 | |
|
| |
Voting rights
The voting rights attached to ordinary shares are set out below:
Ordinary shares/CDIs
On a show of hands every member present at a meeting in person or by proxy shall have one vote and upon a poll each share shall have one vote.
There are no other classes of equity securities.
On Market Buy Back
There are no current on market buy backs.
Company Secretary
The Australian and UK joint company secretaries of the Company are Mr Rowan Harland and Mr Stephen Ronaldson respectively.
Principle Place of Business and Registered Office
Suite 1, 295 Rokeby Road Subiaco WA 6008
Phone Number:
Phone: +61 (0) 8 655 2950
Securities held on Escrow
No shares or CDIs are held in escrow.
Stock Exchanges
Thor Energy Plc shares are dual listed on the AIM market and the Australian Stock Exchange. On the ASX they are traded as CDIs.
ASX CORPORATE GOVERNANCE DISCLOSURE
The Board applies the ASX Corporate Governance Principles and Recommendations (ASX Corporate Governance Council, 4th Edition) as the framework for the Company’s corporate governance arrangements. Consistent with ASX listing rule 4.10.3, the Corporate Governance Statement details the extent to which the Company has followed the recommendations set by the ASX Corporate Governance Council during the reporting period. A separate disclosure is made where the Company has not followed a specific recommendation, together with the reasons and any alternative governance practice, as applicable. Following the revised AIM Rules for Companies which took effect on 5 August 2026, AIM companies are no longer required to adopt a recognised corporate governance code or to comply or explain against one; AIM Rule 26 instead requires disclosure of the Company’s approach to board composition, director roles and responsibilities, remuneration and performance, its risk and controls framework, and investor relations. The Board has retained the ASX Principles as its framework and considers the arrangements described in this statement, together with the information published on the Company’s website, appropriate to the size, stage of development and circumstances of the Company. This information is reviewed annually.
A copy of the Company’s corporate governance policy is available on the Company’s website https://thorenergyplc.com/about-us/#corporate-governance.
Skills, experience, expertise and term of office of each Director
A profile of each Director containing the applicable information is set out on the Company’s website and elsewhere within this document.
Identification of Independent Directors
Messrs Clayton, Armstrong and Moore are independent Directors in accordance with the criteria set out in the ASX Principles and Recommendations.
Statement concerning availability of independent professional advice
Subject to the approval of the Chairman, an individual Director may engage an outside adviser at the expense of Thor Energy Plc for the purposes of seeking independent advice in appropriate circumstances.
Names of nomination committee members and their attendance at committee meetings
Whilst the Company does not have a formal nomination committee, it does formally consider Board succession issues and whether the Board has the appropriate balance of skills, knowledge, experience, independence and diversity.
Names and qualifications of audit committee members
Alastair Clayton and Lincoln Moore make up the audit committee. All directors are considered financially literate.
TENEMENT SCHEDULE
Go Exploration, natural hydrogen, helium and coincident gas storage portfolio
Project |
Tenement |
Area kms2 |
Holders |
Company Interest |
HY-Range |
RSEL 802 * |
6332 |
Go Exploration |
80.2% |
Geo-Range |
GSEL 804 |
2368 |
Go Exploration |
80.2% |
Geo-Range |
GSEL 805 |
2389 |
Go Exploration |
80.2% |
Geo-Range |
GSEL 806 |
1558 |
Go Exploration |
80.2% |
Project |
Tenement |
Area kms2 |
Holders |
Company Interest |
Alford East |
EL6529 |
315.1 |
Hale Energy Pty Ltd |
80% oxide interest |
USA mineral exploration licence portfolio
As of 30 June 2026, the consolidated entity holds 25% interest in the uranium and vanadium projects in USA States of Colorado and Utah as follows:
Claim Group |
Serial Number |
Claim Name |
Area |
Holders |
Company Interest |
Vanadium King (Utah) |
UMC445103 to UMC445202 |
VK-001 to VK-100 |
100 blocks (2,066 acres) |
Cisco Minerals Inc |
25% |
Radium Mountain (Colorado) |
CMC292259 to CMC292357 |
Radium-001 to Radium-099 |
99 blocks (2,045 acres) |
Standard Minerals Inc |
25% |
Groundhog (Colorado) |
CMC292159 to CMC292258 |
Groundhog-001 to Groundhog-100 |
100 blocks (2,066 acres) |
Standard Minerals Inc |
25% |


RNS may use your IP address to confirm compliance with the terms and conditions, to analyse how you engage with the information contained in this communication, and to share such analysis on an anonymised basis with others as part of our commercial services. For further information about how RNS and the London Stock Exchange use the personal data you provide us, please see our Privacy Policy.

Latest directors dealings
- 1 minute ago BioPharma Credit
- 22 minutes ago NATWEST GROUP
- 41 minutes ago Persimmon
- 52 minutes ago M&G
- 52 minutes ago Centrica