Kasiya Definitive Feasibility Study Results
Summary by AI BETAClose X

NEWS RELEASE I 16 APRIL 2026
KASIYA DEFINITIVE FEASIBILITY STUDY RESULTS
DFS Confirms Potential for Sovereign to Redefine Titanium Metal and Graphite Supply Chains
Rio Tinto Technical Expertise | Real-World Pilot Mining Validation
OUTSTANDING FINANCIAL RETURNS
4 Steady State annual EBITDA US$476M and Free Cash Flow (pre-tax, unlevered) US$452M
4 Total revenue of US$16.2Bn over 25-year initial mine life, with potential for mine life extensions
4 Pre-tax NPV₈ of US$2.2 billion
4 NPV/Capex ratio of 3.0x - capital expenditure to first production of US$727 million
4 Operating cost of just US$450/t product (FOB Nacala) - underpinning strong margin resilience across commodity cycles
GLOBAL LEADER ACROSS TWO CRITICAL MINERALS SUPPLY CHAINS
4 Positioned to become the world's largest producer of both natural rutile (222ktpa) and natural flake graphite (275ktpa)
4 Lowest-cost graphite producer globally at or beyond pre-feasibility stage - including China
4 Titanium and graphite both designated as Critical Minerals by the United States and the European Union, highlighting their strategic importance to Western supply chains
4 Free-dig orebody requiring no pre-strip, drilling or blasting with a simple low-energy processing flowsheet
4 Established export infrastructure: hydropower grid, heavy-haul rail, port at Nacala
BANKABLE DEVELOPMENT PATHWAY
4 DFS completed under the oversight of the Sovereign-Rio Tinto Technical Committee
4 Data obtained from Pilot Mining Program, completed with technical input from Rio Tinto, provided real-world inputs across key DFS workstreams
4 DFS incorporates environmental and social workstreams aligned with IFC performance standards; World Bank/IFC Collaboration Agreement in place as potential co-lead mandated lead arranger for project financing
4 Non-binding offtake MOUs covering over 50% of Stage 1 rutile production (Mitsui) and over 35% of coarse flake graphite sales (Traxys)
HEAVY RARE EARTH POTENTIAL NOT INCLUDED IN DFS - EVALUATION UNDERWAY
4 Monazite concentrate recovered from rutile processing circuit with exceptionally elevated levels of heavy rare earths Dysprosium, Terbium and Yttrium
4 Potential third revenue stream at minimal incremental cost - all three elements subject to Chinese export restrictions
4 Dedicated monazite evaluation program now underway to assess scale, recovery and economic potential
Sovereign Metals Limited (ASX:SVM; AIM:SVML; OTCQX:SVMLF) (Sovereign or the Company) is delighted to announce the results of the Definitive Feasibility Study (DFS or the Study) for its Kasiya Rutile-Graphite Project (Kasiya or the Project) in Malawi. The DFS builds on the outcomes of the Optimised Pre-feasibility Study (OPFS) and on empirical data from the Pilot Mining and Rehabilitation Program (Pilot Mining). The DFS was undertaken in accordance with a scope of work approved by, and with technical input and oversight from, the Sovereign-Rio Tinto Technical Committee and, where applicable, conforms to the World Bank Group's International Finance Corporation (IFC) Performance Standards to enhance bankability of the Project.
Managing Director and CEO Frank Eagar commented:
"The completion of this DFS marks a defining milestone for Kasiya and for the global titanium and graphite supply chains. To deliver a DFS of this quality, depth and confidence, rarely achieved by a pre-production company, reflects the calibre of partnerships that Sovereign has assembled around this project: Rio Tinto's technical expertise, alignment with IFC Performance Standards under our Collaboration Agreement, and offtake interest driven by U.S. and Japanese supply chain security priorities. The successful completion of large-scale field trials, combined with the expertise of our experienced owner's team and the technical support provided by Rio Tinto, reinforces Kasiya's potential to be a long-life, low-cost, and reliable source of two critical and globally strategic minerals. Kasiya is not simply a mining project - it is a globally strategic asset."
TABLE 1: Key DFS Metrics (Steady State)
|
OPERATING METRICS |
Units |
Results |
|
Initial Life of Mine (LOM) |
Yrs |
25 |
|
Total Ore Mined |
Mt |
536 |
|
Phase 1 Plant Throughput (Yrs 1-4) |
Mtpa |
12 |
|
Phase 2 Plant Throughput (Yrs 5-25) |
Mtpa |
24 |
|
Annual Rutile Production (95%+ TiO2) |
ktpa |
222 |
|
Annual Graphite Production (96% TGC) |
ktpa |
275 |
|
FINANCIAL PERFORMANCE |
||
|
Total Revenue |
US$M |
16,210 |
|
Annual Revenue |
US$M |
728 |
|
Annual EBITDA |
US$M |
476 |
|
Annual Free Cash Flow (pre-tax, unlevered) |
US$M |
452 |
|
NPV8 (real, pre-tax) |
US$M |
2,204 |
|
IRR (pre-tax) |
% |
23% |
|
OPERATING AND CAPITAL EXPENDITURE |
||
|
Capex to First Production |
US$M |
727 |
|
Total LOM Development Capex |
US$M |
1,239 |
|
Total LOM Sustaining Capex |
US$M |
431 |
|
Operating Costs (FOB Nacala) |
US$/t product |
450 |
Note: Steady State is defined as years of operation during which total run-of-mine is at full capacity of 24 Mtpa (i.e., years 5 to 23). All results are presented on a 100% project basis.
DFS CONFIRMS SOVEREIGN TO REDEFINE TITANIUM METAL AND GRAPHITE SUPPLY CHAINS
Kasiya, located in central Malawi, hosts the world's largest natural rutile deposit and the second-largest flake graphite deposit. Both titanium and graphite are officially classified as Critical Minerals by the United States and the European Union. At steady-state, Kasiya is forecast to deliver approximately 222 kt of rutile and 275 kt of graphite annually - positioning Sovereign as potentially the world's largest producer of both natural rutile and natural flake graphite.
Natural Rutile - Addressing Titanium Supply Chain Vulnerability
Natural rutile is the purest and highest-grade form of naturally occurring titanium feedstock, with titanium dioxide (TiO₂) content typically exceeding 95%. It is the preferred feedstock for titanium sponge production and high-specification titanium alloy applications in aerospace, defence and medical industries.
According to the United States Geological Survey (USGS), the United States currently produces zero titanium sponge domestically and is 100% import-reliant, with record imports of 44,000 tonnes in 2025. Japan supplies over 70% of the US's titanium sponge imports, and Japanese producers themselves depend on securing reliable natural rutile feedstock. Meanwhile, Western-qualified titanium sponge production has declined 9% to approximately 81,000 tonnes, while China's share of global sponge production has risen to 70%.
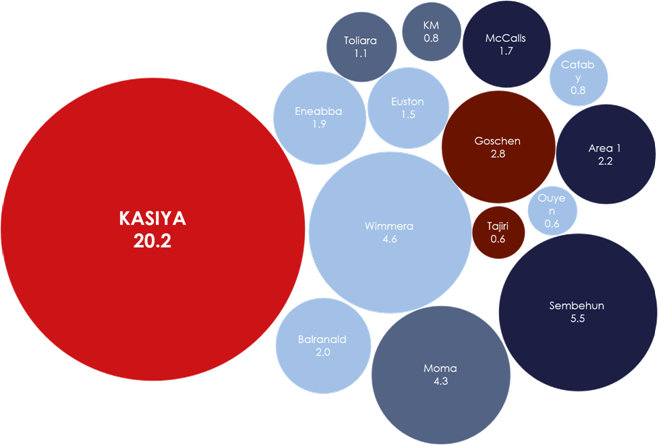
Figure 1: Kasiya contained rutile resource vs. other rutile-bearing titanium deposits (Mt)
(Source: See Appendix 2)
Global primary rutile supply is in structural decline. Rutile reserves at Leonoil Company Limited's Area 1 Mine are expected to be depleted within the next 2-3 years, and Energy Fuels Inc. has recently ceased operations at its Kwale Mine in Kenya. With no other large-scale primary rutile developments at an advanced stage, Sovereign is positioned to become the only large-scale primary producer of natural rutile globally.
Kasiya's natural rutile has demonstrated premium chemical characteristics and suitability across all major end-use applications, with high TiO₂ content, low impurity levels, and favourable particle size distribution - positioning it as a preferred high-purity feedstock within a structurally undersupplied market.
Kasiya's 222ktpa of natural rutile would represent a significant addition to Western-accessible non-pigment rutile supply, directly addressing the structural feedstock deficit facing the US, Japanese and European titanium industries.

Natural Flake Graphite - Lowest-Cost Producer Outside Chinese Control
Graphite is essential to lithium-ion battery anodes, refractories and a range of advanced industrial applications. China currently dominates global natural graphite production and processing, accounting for approximately 77% of worldwide output and an even larger share of battery-grade anode material³. The US has designated graphite as a critical mineral and is actively seeking to diversify supply away from Chinese-controlled sources, including through the US$12 billion Project Vault strategic reserve initiative.
Kasiya's incremental cost of graphite production is estimated at US$216/t. Based on public disclosures by listed graphite developers with studies at or beyond the pre-feasibility stage, this positions Sovereign as the lowest-cost graphite producer globally, including China (see Appendix 3).
Compared with single-commodity hard-rock graphite operations, Kasiya benefits from a soft, free-dig orebody and a simple processing flowsheet. The majority of operating costs are allocated to the primary rutile stream, enabling the production of high-purity, coarse-flake graphite at materially lower costs. Independent testing has confirmed that Kasiya graphite performs exceptionally well as an anode material for lithium-ion batteries, while also meeting specifications for traditional industrial markets such as refractories.
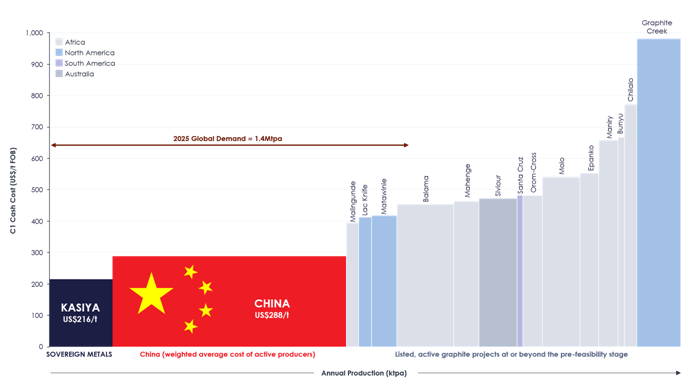
Figure 3: Natural flake graphite C1 cash costs. (Source: See Appendix 3. China cost from Benchmark Minerals Intelligence)
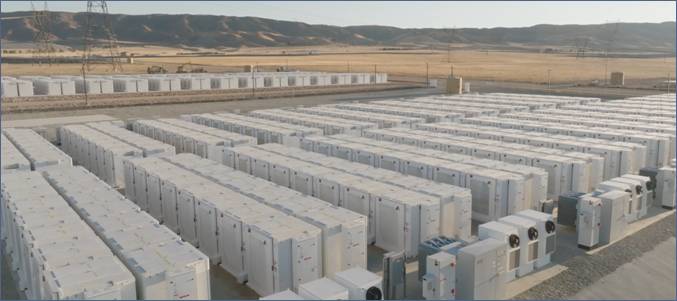
Figure 4: Utility-scale battery energy storage system using graphite anodes - California, USA.
SUMMARY OF KEY DFS WORKSTREAMS
Following input from world-class consultancies, Sovereign's highly experienced owners' team, and subject matter experts from Rio Tinto, the DFS has reconfirmed that Kasiya will be a leading future supplier to two distinct strategic critical minerals supply chains and outside of Chinese control - natural rutile for the titanium industry and natural flake graphite.
The DFS outlines a large-scale, long-life operation that delivers substantial volumes of premium-quality natural rutile and graphite while generating significant returns across a range of price scenarios.
The DFS for Kasiya has been prepared in accordance with the JORC Code (2012), with an estimated accuracy range of ±15% for Capital Expenditure (Capex) and ±10% for Operating Costs (Opex).
Dry Mining Method Confirmed
Using real-world data collected from the Pilot Mining, the DFS confirms a dry mechanical mining method using draglines and 100t rigid dump trucks. The soft, free-dig saprolite orebody requires no drilling, blasting, crushing or milling. A two-bench approach (5m top cut, up to 15m bottom cut) keeps the draglines above the water table, eliminating the need for production equipment below groundwater level. This represents a significant de-risking step from the hydro-mining method originally considered in the original Pre-feasibility Study (PFS).
No Conventional Tailings Storage Facility
A major advancement in the DFS is the elimination of the conventional Tailings Storage Facility (TSF) leading to a significant reduction in the mining footprint and providing a flexible, lower-risk tailings management solution. All tailings will be stored via hydraulic co-disposal backfilling of mined-out pits, designed in compliance with the Global Industry Standard on Tailings Management (GISTM), aiming for zero harm to people and the environment. The 50:50 fines-to-sand backfill ratio closely matches the existing soil profile, supporting progressive rehabilitation. This has also reduced the raw water dam wall height from 23m to 20.7m and storage capacity from 16.4 to 11Mm³.
Hydropower-Sourced Grid Electricity
The DFS is based on connection to Malawi's national hydropower grid via a 132kV overhead line to the Nkhoma substation. Electricity Supply Corporation of Malawi Limited (ESCOM) has confirmed significant grid expansion is underway, including a 400kV Mozambique interconnector (2025) and the 375MW IFC/World Bank-funded Mpatamanga hydropower station (2030). Grid connection delivers substantially lower power costs and a favourable emissions profile.
Processing Flowsheet
Ore will be trucked to the processing plant for scrubbing and screening before entering the Wet Concentration Plant (WCP). The WCP employs a low-energy gravity separation process to produce a Heavy Mineral Concentrate (HMC). The HMC is then fed to the Mineral Separation Plant (MSP), where electrostatic and magnetic separation yield premium-quality rutile (+95% TiO₂), suitable as a direct feedstock for titanium sponge production or use in high-end titanium alloy applications, including aerospace and defence. Graphite-rich concentrate recovered from the spirals is processed in a dedicated flotation plant, producing a high-purity, high-crystallinity, coarse-flake graphite product. Independent testing has confirmed that Kasiya graphite performs exceptionally well as an anode material for lithium-ion batteries and meets specifications for traditional industrial markets such as refractories.
Dual Plant Configuration
The DFS confirms a staged development with two 12Mtpa processing plants - South Plant from Year 1 and North Plant from Year 5 - positioned at the respective resource centres of gravity to minimise haulage distances and costs. The configuration provides operational flexibility and a phased capital profile.
Logistics and Export Infrastructure
Kasiya's products will be railed directly from a purpose-built dry port at the mine site eastward along the Nacala Logistics Corridor to the container terminal at the Port of Nacala on the Indian Ocean. The existing heavy-haul rail line and deep-water port provide a proven, operational export route - a significant infrastructure advantage over comparable undeveloped projects. Product transport cost is estimated at US$117/t product (FOB Nacala).
Rutile and Graphite Pricing
The DFS adopts a life-of-mine weighted-average realised rutile price of US$1,670/t (real, FOB Nacala), based on an independent TZMI market study. Japanese titanium metal producers OSAKA Titanium Technologies Co., Ltd. (Osaka Titanium) and Toho Titanium Co., Ltd. (Toho Titanium) are expected to drive the growth in rutile demand for titanium manufacturing over the next 10 years. Graphite pricing is based on an independent Benchmark Minerals Intelligence (BMI) price forecast, resulting in a life-of-mine average price of approximately US$1,288/t (FOB Nacala) - effectively in line with the OPFS assumption of US$1,290/t. The graphite basket price is derived from FOB China benchmarks, adjusted for an East Africa premium and weighted by Kasiya's concentrate flake size distribution.
IFC Performance Standards Integrated into Design
The DFS has been prepared in alignment with IFC Performance Standards, with a comprehensive Environmental and Social Impact Assessment (ESIA) nearing completion and the full suite of environmental and social specialist studies completed. Sovereign's established on-the-ground social team of 22 core staff and 90-member Community Liaison Team represent a level of social preparedness rarely achieved at DFS stage.
Mining and Rehabilitation Trials - Proven in Practice
Large-scale mining and rehabilitation trials were completed during the DFS period, covering excavation, backfilling, soil remediation and crop establishment. During Pilot Mining, the Company successfully completed dry and hydraulic mining trials, excavating a test pit at Kasiya. The test pit covered the planned area of 120 metres by 110 metres and was excavated to a depth of 20 metres through the weathered ore at Kasiya.
Post mining, the rehabilitated pit has achieved maize yields of 5.2 tonnes per hectare within six months of backfilling - over five times the local community average of approximately 1 tonne per hectare. The Pilot Mining validated the progressive rehabilitation approach and confirmed that mined land can be returned to productive agricultural use within one to two years.
|
Enquiries |
|
|
Frank Eagar, Managing Director & CEO South Africa / Malawi +27 21 140 3190
|
Sapan Ghai, CCO London +44 207 478 3900 |
|
Nominated Adviser on AIM and Joint Broker |
|
|
SP Angel Corporate Finance LLP |
+44 20 3470 0470 |
|
Ewan Leggat Charlie Bouverat |
|
|
|
|
|
Joint Broker |
|
|
Stifel |
+44 20 7710 7600 |
|
Varun Talwar |
|
|
Ashton Clanfield |
|
To view this announcement in full, including the Summary Section of the DFS and all images and figures, please refer to: https://api.investi.com.au/api/announcements/svm/b6f76c34-dfa.pdf.
SUMMARY OF MATERIAL ASSUMPTIONS
Material assumptions used in the estimation of the production target and associated financial information are set out in the following table.
TABLE 2: Material assumptions of the Kasiya DFS
|
Assumption |
Units |
Inputs / Outcome |
|
Maximum accuracy variation - Capital costs |
% |
±15% |
|
Maximum accuracy variation - Operating costs |
% |
±10% |
|
Minimum Life of Mine |
Years |
25 years |
|
Annual average throughput - Phase 1 |
tpa |
12,000,000 |
|
Annual average throughput - Phase 2 |
tpa |
24,000,000 |
|
Head grade - rutile |
% |
0.95% |
|
Recovery - rutile |
% |
97.6% |
|
Product grade (TiO2) - rutile |
% |
95%+ |
|
Head grade - graphite |
% |
1.56% |
|
Recovery - graphite1 |
% |
71.9% |
|
Product grade (TGC) - graphite |
% |
96% |
|
Annual production (average steady state LOM) - rutile |
tpa |
222,000 |
|
Annual production (average steady state LOM) - graphite |
tpa |
275,000 |
|
Sales Price - rutile (average LOM) |
US$/t FOB |
1,670 |
|
Sales Price - graphite (average LOM) |
US$/t FOB |
1,288 |
|
Government Royalty |
% |
5% of gross revenue |
|
Vendor Royalty |
% |
2% of gross profit |
|
Community Development Fund |
% |
0.45% of gross revenue |
|
Phase 1 Capital (12Mtpa South Plant) |
US$M |
727 |
|
Phase 2 Capital (12Mtpa North Plant) |
US$M |
511 |
|
Sustaining Capital |
US$M |
431 |
|
Operating Costs excluding royalties (LOM) - FOB Nacala |
US$/t |
450 |
|
Operating Costs including royalties (LOM) - FOB Nacala |
US$/t |
517 |
|
Discount Rate |
% |
8% |
1 Graphite recovery is 71.9% total, which is discounted by 3% in the first two years of operation, 2.5% in year 3, 2.0% in year 4, and 1.5% in year 5 thereafter.
ORE RESERVE STATEMENT
The information that relates to Ore Reserves was compiled by Mr Frikkie Fourie (BEng, Pr. Eng, MSAIMM) of Moletech, who takes overall responsibility for the Ore Reserve as Competent Person (refer to Competent Persons Statement below). Mr Fourie is a Member of The South African Institute of Mining and Metallurgy, also a member of the Engineering Council of South Africa (ECSA) and has sufficient experience, which is relevant to the style of mineralisation and type of deposit under consideration, and to the activity he is undertaking, to qualify as Competent Person in terms of the JORC Code (2012).
Mr Fourie has been engaged by Sovereign and consulted on the PFS, OPFS, DFS, and trial mining program completed in 2024-2025, including approximately two months spent on site at Kasiya in 2024.
The updated MRE was used as the basis for the DFS Ore Reserve Estimate and was prepared by Sovereign under the guidance and review of Independent Competent Person, Mr Jeremy Witley of MSA Group South Africa. The updated MRE followed additional drilling, which significantly upgraded the Indicated to Measured Mineral Resource Estimate. This new geological model also includes moisture percentages from each respective lithology so that the moisture can be accounted for in the equipment selection to ensure the production target of 12Mtpa of dry ore can be achieved at each of the two plants.
Mineral Resources were converted to Ore Reserves in line with the material classifications which reflect the level of confidence within the resource estimate. The Ore Reserve reflects that portion of the Mineral Resource which can be economically extracted by open pits utilising mechanical mining methodologies.
In accordance with the JORC Code (2012), the Kasiya Proved and Probable Ore Reserve is based on only Measured and Indicated classified Mineral Resources.
The reported MRE is inclusive of the resources converted to Ore Reserves.
The Ore Reserve has no allowance for mining dilution and ore loss on the basis that all material within the shells is classified and extracted as ore.
The open pit geometries developed for the purposes of mine planning, and which define the subsequent Ore Reserve, are based on NPVS pit shells edited to comply with practical mining requirements and identified exclusion zones. Due to the shallow nature of the geometries, and there being no requirements for ramp access to the bottom of the pits, traditional mine designs were not developed. The final geometries were developed on the basis of applying a rutile cut-off grade ranging from 0.7% to 1.5% RUT95. These cut-offs are all considerably higher than the Project breakeven cut-off grade which lies between 0.4% and 0.5% RUT95.
The Ore Reserve estimate comprises 536Mt of Proven and Probable Ore grading at 0.95% RUT95 and 1.56% TGC.
The Ore Reserve estimate is summarised in Table 1 below, along with the associated cut-off grade used to define the shell.
TABLE 1: Kasiya March 2026 Model - Ore Reserve - Rutile (Rut95) + Graphite (TGC)
|
Class |
Tonnes |
Rutile Grade |
Rutile |
TGC |
TGC |
Rutile Eq. |
Dry BD |
|
(Mt) |
(%) |
(Mt) |
(%) |
(Mt) |
(%) |
||
|
Proved |
78 |
1.03 |
0.80 |
1.65 |
1.28 |
1.87 |
1.67 |
|
Probable |
458 |
0.94 |
4.29 |
1.54 |
7.07 |
1.47 |
1.62 |
|
Total |
536 |
0.95 |
5.09 |
1.56 |
8.35 |
1.39 |
1.62 |
The Total Ore Reserve is all rutile and graphite mineralisation within an optimised open pit shell using a Rut95 concentrate revenue price of net US$1,286.81/t and a Graphite product price of net US$1,099.51/t; Mine Opex US$1.35/t; Process Opex US$5.44/t; Rutile recovery of 97.6%; Average Graphite recovery of 70.4%.
Pit Optimisation
Open pit optimisation utilising NPVS software was carried out on the Kasiya deposit using Measured and Indicated Mineral Resources only (in accordance with the JORC Code (2012)). The latest parameters available were used to determine the economic extent of the open pit excavation. The process plant production parameters were supplied by Sovereign with an initial rate of 12Mtpa from year 3 to the South MSP and an additional 12Mtpa to the North MSP from year 7 for a total annual processing rate of 24Mtpa.
The intention to dry mining the defined Ore Reserve means that there is the ability to selectively mine, stockpile ore and all material can be selectively trucked to the plant as feed. Therefore, all material within the "shell" will be extracted and fed to the plant as ore and any interstitial waste and/or sub-economic grade material will be likewise treated as diluent material.
For the production schedule on which the Ore Reserve is based all material within the shell was treated as "ore" to ensure the appropriate dilution was captured.
Mineable Pit Geometries
Based on the cut-off grades applied the mining areas were further interrogated to determine the potential recoverable mining inventory. The interrogation process applied the following constraints to determine the bulk mining boundaries:
· A minimum depth of 2m and a maximum of 20m for the dry mining method.
· Removal of any small, isolated pits.
· Pit extents limited to mineable areas and to remain outside of identified exclusion areas wherever reasonably possible. Sovereign identified all local village areas and areas of cultural or environmental significance within the potential mining envelope that should not be disturbed during the mining phase of the Project.
Ore Reserve Notes
The 2026 Ore Reserves for the Kasiya deposits have been reported according to the JORC Code (2012).
The estimation of the Ore Reserves followed a process of pit optimisation, final pit shell selection and production scheduling:
· The Mineral Resource Estimation model was prepared by Sovereign under guidance and review of Competent Person Jeremy Witley of MSA Group South Africa.
· Due to the nature of the deposit and all mined material from the pits being sent to the MSP (except for a small portion of material (8.4Mt), that can easily be isolated and removed as waste from the pits), no ore losses or dilution was applicable.
· For the same reason, no cut-off is applied in the pits, as all material is sent to the MSP. Cut-offs were only used in selecting the appropriate pits for final LOM production scheduling.
· Using the models and input parameters, pit optimisations were completed in Studio NPVS software (Datamine).
· Using the final selected pit shells as templates, a monthly LOM production schedule was completed in Deswik IS (Interactive Scheduler) software.
· The schedule economics was verified through a financial analysis and proved to be economically viable.
The independent Competent Person for the Ore Reserve estimates is Mr Frikkie Fourie (BEng, Pr. Eng, MSAIMM) of Moletech.
DISCLOSURES & DISCLAIMERS
The information in this announcement that relates to Production Targets and Ore Reserves is based on and fairly represents information provided by Mr Frikkie Fourie, a Competent Person, who is an Associate Member of The South African Institute of Mining and Metallurgy and a Registered Professional Engineer with the Engineering Council of South Africa, a Recognised Professional Organisation (RPO), included in a list promulgated by ASX from time to time. Mr Fourie is employed by Moletech Consulting Pty Ltd, an independent consulting company. Mr Fourie has sufficient experience, which is relevant to the style of mineralisation and type of deposit under consideration, and to the activities undertaken, to qualify as a Competent Person as defined in the 2012 Edition of the 'Australasian Code for Reporting of Exploration Results, Mineral Resources and Ore Reserves'. Mr Fourie consents to the inclusion in the Announcement of the matters based on his information in the form and context in which it appears.
The information in this announcement that relates to the DFS (including Mine Engineering, mine Scheduling, Processing, Infrastructure, Capital and Operating Costs is based on and fairly represents information compiled or reviewed by Mr James Gemmel, a Competent Person, who is a Registered Professional Engineer with the Engineering Council of South Africa, a RPO included in a list promulgated by ASX from time to time. Mr Gemmel is employed by DRA Limited, an independent consulting company. Mr Gemmel has sufficient experience, which is relevant to the style of mineralisation and type of deposit under consideration, and to the activities undertaken, to qualify as a Competent Person as defined in the 2012 Edition of the 'Australasian Code for Reporting of Exploration Results, Mineral Resources and Ore Reserves'. Mr Gemmel consents to the inclusion in the Announcement of the matters based on his information in the form and context in which it appears.
The information in this announcement that relates to Metallurgy - rutile and graphite is extracted from announcements dated 28 September 2023, 8 May 2024, 15 May 2024 and 4 September 2024, which are available to view at www.sovereignmetals.com.au. Sovereign confirms that a) it is not aware of any new information or data that materially affects the information included in the original announcement; b) all material assumptions included in the original announcement continue to apply and have not materially changed; and c) the form and context in which the relevant Competent Persons' findings are presented in this report have not been materially changed from the announcement.
The information in this announcement that relates to the Mineral Resource Estimate is extracted from Sovereign's announcement dated 18 March 2026 entitled 'Kasiya Mineral Resource Estimate Significantly Upgraded Ahead of DFS' (original announcement), which is available to view at www.sovereignmetals.com.au, and is based on, and fairly represents information compiled by Mr Jeremy Witley, a Competent Person, who is a member of the South African Council for Natural Scientific Professions (SACNASP Pr. Sci. Nat.), a RPO included in a list promulgated by ASX from time to time. Mr Witley is a principal of MSA Group, an independent consulting company. Sovereign confirms that a) it is not aware of any new information or data that materially affects the information included in the original announcement; b) all material assumptions included in the original announcement continue to apply and have not materially changed; and c) the form and context in which the relevant Competent Persons' findings are presented in original announcement have not been materially changed from the disclosure in the original announcement.
Forward Looking Statement
This release may include forward-looking statements, which may be identified by words such as "expects", "anticipates", "believes", "projects", "plans", and similar expressions. These forward-looking statements are based on Sovereign's expectations and beliefs concerning future events. Forward looking statements are necessarily subject to risks, uncertainties and other factors, many of which are outside the control of Sovereign, which could cause actual results to differ materially from such statements. There can be no assurance that forward-looking statements will prove to be correct. Sovereign makes no undertaking to subsequently update or revise the forward-looking statements made in this release, to reflect the circumstances or events after the date of that release.
The information contained within this announcement is deemed by the Company to constitute inside information as stipulated under the Market Abuse Regulations (EU) No. 596/2014 as it forms part of UK domestic law by virtue of the European Union (Withdrawal) Act 2018 (MAR). Upon the publication of this announcement via Regulatory Information Service ('RIS'), this inside information is now considered to be in the public domain.
MODIFYING FACTORS
The Modifying Factors included in the JORC Code (2012) have been assessed as part of the Definitive Feasibility Study (DFS), including mining, processing, metallurgical, infrastructure, economic, marketing, legal, environmental, social and government factors. The Company has received advice from appropriate experts when assessing each Modifying Factor.
A summary assessment of each relevant Modifying Factor is provided below.
Mining
Refer to Section 5.0 Mining in the Announcement.
The Company engaged independent consultants, Moletech Consulting Pty Ltd to carry out the pit optimisations, mine design, scheduling, mining cost estimation and Ore Reserves for the DFS.
The DFS draws on empirical data collected through a comprehensive pilot mining program covering excavation, backfilling, rehabilitation with mixed crops, and post-harvest assessment.
Metallurgy and Processing
Refer to Section 6.0 Processing and Metallurgy in the Announcement.
Rutile
The Company completed bulk rutile testwork programs at globally recognised Allied Mineral Laboratories (AML) in Perth, Australia. Testwork programs were supervised by Sovereign's Head of Development, Mr Paul Marcos. Mr Marcos is a metallurgist and mineral sands industry veteran. Bulk test-work programs have confirmed that premium-grade rutile can be produced via a simple, conventional process flow sheet.
Process engineering was completed by DRA, who developed the process plant design and associated cost estimates for the OPFS. During the DFS, further metallurgical testwork was performed to complement the testwork completed during the previous studies. Testwork across all programs has concluded that a product with an average grade specification of 95.3% TiO2 can be successfully produced with the application of an average 97.6% recovery-to-product factor.
Graphite
The Company has conducted graphite testwork in multiple laboratories, including ALS Laboratory in Perth, SGS Lakefield in Canada, Core Resources Queensland and ProGraphite GmbH in Germany.
Graphite product testwork conducted during the DFS was a continuation and an increase in scale of testwork completed during the PFS and the OPFS. The DFS testwork campaign was overseen by Dr Surinder Ghag, Chief Technology Officer for Sovereign and Mr Oliver Peters, the Competent Person appointed by DRA. The testwork provided sufficient data to address potential variability in graphite quality and product recovery.
Process engineering was completed by DRA who further developed the process plant design in conjunction with Dr Ghag, while DRA were responsible for the associated capital and operating cost estimates. Graphite recovery is 71.9% total, discounted by 3% in the first two years of operation, 2.5% in year 3, 2.0% in year 4, and 1.5% in year 5 thereafter. This has been conservatively adjusted to reflect scale-up from laboratory to plant conditions, with recoveries expected to improve over the first five years as operations are optimised. DFS variability testwork gravity recovery average was 73.8% and flotation plant recovery average 97.4%. The average combined gravity and flotation recovery is 71.9%. Overall concentrate grades average 95.5% TGC with over 62% of the graphite flake product being larger than 180µm.
Rutile & Graphite
It is acknowledged that laboratory scale testwork will not always represent actual results achieved from a production plant in terms of grade, chemistry, sizing and recovery. Further testwork will continue to build confidence in specifications and recoveries that will be achieved at full-scale production.
Overall, the process flowsheet is conventional for both rutile and graphite with no novel features or specialised equipment incorporated.
Infrastructure
Refer to Sections 9.0 Infrastructure and 10.0 Transport and Logistics in the Announcement.
Kasiya is located approximately 40km northwest of Lilongwe, Malawi's capital, and boasts excellent access to services and infrastructure. The proximity to Lilongwe gives the project a number of benefits, including access to a large pool of professionals and skilled tradespeople, as well as industrial services.
Logistics cost estimates, including rail and port infrastructure and handling, were provided by Nacala Logistics and Grindrod based on market data, suppliers' quotations, industry databases, industry contacts and consultants' existing knowledge of southern African transport infrastructure and freight markets. All consultants are independent with substantial experience in the management of transport logistics studies in southern Africa.
Powerline Funding
The Company entered into a non-binding MOU with a European-backed Private Equity Fund (PE fund) that invests in the Southern African Power Pool and power reticulation infrastructure across Sub-Saharan Africa. The MOU is an undertaking to fund the development and construction of a 132kV transmission line connecting Kasiya to the Malawi national grid. The powerline project is estimated to cost approximately US$40.7 million, with the PE fund expected to provide development funding and construction financing of up to ~US$40 million, subject to due diligence and investment committee approvals. The structure contemplates funding at the project special purpose vehicle level, with repayment from project financing at Financial Close, and provides Sovereign with a clear, funded pathway to secure grid power. This materially de-risks a key enabling infrastructure component of the Project, reduces upfront capital burden at the Company level, and aligns with broader ESG objectives through connection to stable grid power rather than standalone generation.
Marketing
Refer to subsections 12.4 and 13.4 Marketing Strategy in the Announcement.
Rutile
During the DFS, the Company engaged TZMI to provide a bespoke marketing report to support the DFS. TZMI is a global, independent consulting and publishing company which specialises in technical, strategic and commercial analyses of the opaque (non-terminal market) mineral, chemical and metal sectors.
TZMI's assessment has confirmed that, based upon their high-level view on global demand and supply forecasts for natural rutile, and with reference to the specific attributes of Kasiya, there is a reasonable expectation that the product will be able to be sold into existing and future rutile markets.
Included in the Investment Agreement between Rio Tinto and Sovereign, Rio Tinto undertook to provide assistance and advice on technical and marketing aspects under the oversight from a Sovereign-Rio Tinto technical committee.
Also, included in the Investment Agreement, Rio Tinto holds the option to become the operator of Kasiya on commercial arm's-length terms.
In the event, Rio Tinto elects to become the operator of Kasiya, and for so long as Rio Tinto remain the operator, Rio Tinto shall have exclusive marketing rights to 40% of the annual production of all products from the Project as identified in this DFS, and on an arm's-length terms.
Rio Tinto's option over operatorship and 40% marketing rights lapse if not exercised by the earlier of (i) 90 days after the announcement of this DFS or 180 days after this announcement if Rio Tinto advises it needs additional time to consider the exercise; or (ii) Rio Tinto ceasing to hold voting power in the Company of at least 10%.
Irrespective of whether Rio Tinto exercises its option to become operator, the Company has engaged in numerous preliminary off-take, financing and strategic discussions over recent months, including executing an MOU with Mitsui & Co as follows:
Mitsui non-binding MOU
In March 2026, Sovereign executed a non-binding offtake MOU with Mitsui & Co. for up to 70,000 tonnes per annum of Kasiya natural rutile concentrate (TiO₂ >95%) over an initial four-year term (with extension potential), supporting Japan's titanium industry amid strengthening US-EU-Japan critical minerals cooperation. The initial 70ktpa offtake equates to over 50% of Phase 1 rutile production.
Prior to Rio Tinto's investment, Sovereign had established several non-binding MOUs with key industry players, including:
· Mitsui & Co - global trading and investment company headquartered in Japan (30ktpa)
· The Chemours Company - one of the world's largest producers of high-quality titanium dioxide (20ktpa)
· Hascor International - global processor and distributor of rutile for the welding industry (25ktpa)
Other than renewing and revising the Mitsui & Co offtake MOU as discussed above, the Company did not progress with definitive offtake agreements due to Rio Tinto's rights under the Investment Agreement.
However, several third parties continue to express interest in entering into offtake agreements in order to secure U.S. and "Western-aligned" titanium supply chains, and the Company remains confident that binding offtake agreements for Kasiya's natural rutile concentrate will be entered into in due course, should Rio Tinto not exercise its rights under the Investment Agreement.
Graphite
The Company engaged Fastmarkets, a specialist international publisher and information provider for the global steel, non-ferrous and industrial minerals markets, to prepare a marketing report for graphite.
Fastmarkets' assessment has confirmed that based upon their high-level view on global demand and supply forecasts for natural flake graphite, and with reference to the specific attributes of Sovereign's project, there is a reasonable expectation that the product from Sovereign's Kasiya project will be able to be sold into existing and future graphite markets. Given the extremely low-cost profile and high-quality product, it is expected that output from Kasiya will be able to fill new demand or substitute existing lower quality / higher cost supply.
Project considerations taken by Fastmarkets in forming an opinion about the marketability of product include:
· Low capital costs (incremental)
· Low operating costs
· High quality concentrate specifications
Industry participants confirm that the highest value graphite concentrates remain the large, jumbo and super-jumbo flake fractions, primarily used in industrial applications such as refractories, foundries and expandable products. These sectors currently make up the significant majority of total global natural flake graphite market by value.
Fastmarkets have formed their opinion based solely upon project information provided by Sovereign to Fastmarkets and have not conducted any independent analysis or due diligence on the information provided.
As noted above, Sovereign and Rio Tinto have been working together to qualify Kasiya's graphite product with a particular focus on supplying the spherical purified graphite segment of the lithium-ion battery anode market.
In September 2024, Sovereign announced an update on the downstream testwork which demonstrated that Coated Spherical Purified Graphite (CSPG) produced from Kasiya natural flake graphite has performance characteristics comparable to the leading Chinese natural graphite anode materials manufacturers such as BTR New Material Group (BTR). Electrochemical testing of the CSPG samples at a leading German institute achieved first cycle efficiencies (FCE) of 94.2% to 95.8%, with results above 95%, a key specification for highest quality natural graphite anode materials under the Chinese standard.
BTR has a 20-year track record in the production of lithium-ion battery anode materials, is a dominant player in the market and has recently concluded anode material offtake agreements with global automotive companies including Ford. BTR's highest specification CSPG materials, that have low swelling, long cycle life, good processability and outstanding electrochemical performance include their GSN17 and LSG17 products (with D50 of 17.0+/- 1.5μm).
Traxys non-binding MoU
In February 2026, Sovereign executed a non-binding MOU with Traxys North America for the marketing of graphite from the Kasiya Project, targeting 40,000 tonnes per annum during Phase 1 (Years 1-5) and up to 80,000 tonnes per annum thereafter, supporting supply into US critical minerals stockpiling initiatives, with an initial focus on high-value flake graphite for the refractory market.
Other than this graphite offtake MOU, the Company did not progress with definitive graphite offtake agreements due to Rio Tinto's rights under the Investment Agreement. Several U.S. / "Western-aligned" potential offtakers continue to express interest in entering into offtake agreements for Sovereign's graphite product and the Company continues to advance these discussions. The Company remains confident that binding offtake agreements for Kasiya's natural flake graphite concentrate will be entered into in due course, should Rio Tinto not exercise its rights under the Investment Agreement.
Economic
Also refer to Sections 14.0 Cost Estimations and 15.0 Financial & Economic Analysis in the Announcement.
Capital estimates for the process plant have been prepared by PCC, together with input from the Company and other contributing consultants using combinations of cost estimates from suppliers, historical data, benchmarks and other independent sources. The accuracy of the initial capital cost estimate for the Project is ±15%.
Capital costs include the cost of all services, direct costs, contractor indirects, EPCM expenses, non-process infrastructure, sustaining capital and other facilities used for the mine. Capital costs make provision for mitigation expenses and mine closure and environmental costs.
Working capital requirements (including contingency) for plant commissioning and full ramp-up have been included in the headline capital estimate reported under construction, owner's and start-up costs.
Mining costs have been estimated by DRA, a regional leader in conventional open pit mining and materials handling. Life cycle costs for mining capital and operating cost have been built up from first principles based on equipment, vendor, and contractor quotations, local unit cost rates, and benchmarked costs.
Labor costs have been developed based on a first-principles build-up of staffing requirements with labour rates benchmarked in Malawi and expatriate rates benchmarked for professionals from South Africa and other jurisdictions.
A Government royalty of 5% (applied to revenue) and a vendor profit share of 2% (applied to gross profit) have been included in all project economics. A 0.45% royalty (applied to revenue) has been applied for the community development fund.
Rehabilitation and mine closure costs are included within the reported operating cost and sustaining capital figures.
A detailed financial model and discounted cash flow (DCF) analysis has been built and prepared by an independent specialist advisory firm, Practara Metals and Mining Advisory (Practara), in order to demonstrate the economic viability of the Project. The financial model and DCF were modelled with conservative inputs to provide management with a baseline valuation of the Project.
The DCF analysis demonstrated compelling economics of the prospective Project, with an NPV (ungeared, pre-tax, at an 8% discount rate) of US$2,204 million, and an (ungeared) IRR of 23%.
Sensitivity analysis was performed on all key assumptions used. The robust project economics insulate the Kasiya Project from variations in market pricing, capital expense, or operating expenses.
Sensitivity analysis with both rutile and graphite concentrate prices simultaneously 25% lower than the DFS selected prices, the Project still displays a positive NPV (ungeared, pre-tax, 8% discount rate) of US$913 million and pre-tax IRR of 15.2%.
The Project's payback period is 6.2 years from the start of production. The payback period is based on unlevered, pre-tax free cashflow.
Sovereign estimates the total capital cost to construct the mine to be US$727m (which includes a contingency of US$43 million.
Key parameters are disclosed in the body of the announcement, and include:
· Life of Mine: 25 years
· Discount rate: 8%
· Royalty rate: 5% royalty (Government), 2% of gross profit (Original Project Vendor) and 0.45% Community Development Fund.
· Pricing: Rutile average price of US$1,670 per tonne and Graphite average basket price of US$1,288 per tonne
There is uncertainty in some respects of the tax law applicable to mining companies in Malawi. Specifically with regard to the calculation of and the application of the RRT. The 2023 Mines Act, further provides for the holder of large-scale mining licenses to enter into a fiscal stability agreement, known as a Mine Development Agreement (MDA) with the Government of Malawi. These MDAs provide the opportunity to agree and clarify the application of taxation. At the date of the DFS announcement, Sovereign has not applied for a large-scale mining license or entered into an MDA.
In 2024, mining companies Lotus Resources Limited (Lotus) and Mkango Resources Limited (Mkango) each entered into separate MDAs with the Government of Malawi. These MDAs have deviated from the enacted mining taxation laws and, specifically, the levying of the RRT, with no RRT payable as part of the MDAs. The Government has since proposed an alternative supernormal profits tax (SPT) to replace the current RRT. Profits of up to MWK 10 billion (~US$6 million at the time of writing) are taxed at the standard income tax rate of 30%. Any profits which exceed MWK 10 billion are taxed at a higher rate of 40%. Mkango and Lotus are exempt of SPT under their existing MDAs. As such, and until such time Sovereign has sight of what actual fiscal terms would apply to the Kasiya Project in terms of its own fiscal stability agreement with the Government of Malawi, results for the DFS have been reported on a pre-tax basis only.
Notwithstanding this uncertainty, scenario analysis has been undertaken to indicate a range of potential post-tax outcomes. This analysis considered the impact of key fiscal variables, including RRT, SPT, and capital allowances, on project returns, with the resulting post-tax NPV8% estimated to range between US$1,065 million and US$1,448 million.
The financial model has been built and prepared by Practara using inputs from the various expert consultants and has been reviewed by SP Angel Corporate Finance LLP (SPA), the Company's Nominated Advisor and Corporate Broker as defined by the AIM Rules for Companies set out by the London Stock Exchange, to validate the functionality and accuracy of the model.
The Company considers that, given the nature of the Project, funding is likely to be sourced from specialist investors. Potential funding sources include, but are not limited to, traditional equity and debt, royalty financing, and off-take agreements at either the corporate and/or Project level.
In this regard, the Company has already engaged in numerous preliminary off-take, financing and strategic discussions over recent months. Interested parties are global in nature and include companies from the titanium, graphite, mining, industrial, battery, automotive, government and private equity sectors.
In particular, the Company has entered a non-binding offtake MOU with Mitsui & Co. for up to 70,000 tonnes per annum of Kasiya natural rutile concentrate (TiO₂ >95%) over an initial four-year term (with extension potential), supporting Japan's titanium industry amid strengthening US-EU-Japan critical minerals cooperation.
Further, in February 2026, Sovereign executed a non-binding MOU with Traxys North America for the marketing of graphite from the Kasiya Project, targeting 40,000 tonnes per annum during Stage 1 (Years 1-5) and up to 80,000 tonnes per annum thereafter, supporting supply into US critical minerals stockpiling initiatives, with an initial focus on high-value flake graphite for the refractory market.
The Company intends to negotiate and convert these MOUs into definitive offtake agreements, which will assist in securing future debt facilities to finance the Project.
The Company has also had preliminary financing discussions with a number of other institutional investors, development finance institutions, U.S. and "Western-aligned" government agencies, end-user customers, and other strategic investors, regarding potential equity and/or debt funding at the Company and/or Project level.
Since July 2023, leading global mining company Rio Tinto has made an investment in Sovereign for A$60 million, resulting in a shareholding of 18.5%. The investment proceeds have been used to advance Kasiya, including completion of the Pilot Mining and Rehabilitation Program and DFS. Under the Investment Agreement with Rio Tinto, it was agreed with Rio Tinto that if Sovereign is raising debt finance for the development of the Project, Sovereign and Rio Tinto will negotiate, in good faith, financing arrangements in order to put in place an acceptable mine construction funding package. Further, Rio Tinto has the option to become operator of Kasiya on commercial arm's-length terms. Rio Tinto's option over operatorship lapses if not exercised by the earlier of:
i) 90 days after the announcement of this DFS or 180 days after this announcement if Rio Tinto advises it needs additional time to consider the exercise; or ii) Rio Tinto ceasing to hold voting power in the Company of at least 10%.
Irrespective of whether Rio Tinto exercises its option to become operator, the Company has entered into multiple agreements that may provide alternative sources of financing, as set out below:
· A Collaboration Agreement with the International Finance Corporation (IFC), a member of the World Bank Group, which provides a clear pathway to international project financing for Kasiya, with a particular focus on debt funding. Through the Collaboration Agreement, IFC holds rights to participate as lender, mandated co-lead arranger and/or investor in the project financing structure, supporting the development of a robust and bankable funding package. As a leading global development finance institution with extensive experience in mining projects in emerging markets, IFC's involvement is expected to enhance lender confidence, support access to competitive long-term debt, and underpin the overall financing strategy for the Project;
· Further and as discussed above, the Company has entered into a non-binding MOU with a PE fund to fund the development and construction of a 132kV transmission line connecting Kasiya to the Malawi national grid. Refer to discussion above in Infrastructure Modifying Factor; and
· MOU offtake agreements with Mitsui & Co and Traxys North America as discussed above.
The Company also engaged the services of SPA with regard to project economics. SPA is a financial advisory firm that offers full-service advisory, corporate broking and research, which specialises in the resources sector. SPA is well regarded as a specialist capital markets service provider and has raised funding for companies across a range of commodities including the industrial and speciality minerals sector.
In this regard and after the services provided by SPA, the assessment and advice indicates that financing for industrial mineral companies often involves a broader mix of funding sources than just traditional debt and equity. SPA considers that given the nature of the Project, funding is likely to involve specialist funds, with potential funding sources including, but not limited to, traditional equity and debt, royalty financing and off-take agreements, at either the corporate or project level. It is important to note that no funding arrangements have yet been put in place, as discussions continue with potential funders. The composition of the funding arrangements ultimately put in place may also vary, so it is not possible at this stage to provide any further information about the composition of potential funding arrangements. Following the assessment of a number of key criteria, and after the services provided by SPA which states that, irrespective of whether or not Rio Tinto exercises any of its rights under the Investment Agreement, on the basis that the DFS outcomes are consistent with any future technical study (e.g. a Front-End Engineering Design), all in-country government and regulatory approvals are received, commercial offtake agreements are in place for the majority of Rutile and Graphite production for at least the first five years of mine life, and that there has not been any material adverse change in financial condition, results of operations, business or prospects of the Company/or political and business environment in Malawi and/or financial or capital markets in general, Sovereign believes that it should be able to raise sufficient funding to develop the Project..
SPA, which is authorised and regulated by the Financial Conduct Authority (FCA) in the United Kingdom, is acting exclusively for the Company and no one else in connection with the matters referred to in this announcement and will not be responsible to anyone other than the Company for providing the protections afforded to the customers of SPA or for providing advice in relation to the matters described in this announcement. No liability whatsoever is accepted by SPA for the accuracy of any information or opinions contained in this announcement or for the omission of any material information. The responsibilities of SPA as the Company's Nominated Adviser under the AIM Rules for Companies and the AIM Rules for Nominated Advisers are owed solely to London Stock Exchange plc and are not owed to the Company or to any director or shareholder of the Company or any other person, in respect of its decision to acquire shares in the capital of the Company in reliance on any part of this announcement, or otherwise. SPA will not be responsible to anyone other than the Company for providing the protections afforded to its clients or for providing advice in relation to the Project economics or any other matters referred to in this announcement.
Since commencing exploration at Kasiya in November 2019, the Company has completed extensive drilling, sampling, metallurgical test work, and geological modelling, and has defined a Measured and Indicated Mineral Resource Estimate that has been converted to Ore Reserves as part of this DFS. The Company is also in a unique position, having collected real-world data through the Pilot Mining Program, which has significantly validated and de-risked the Project. Over this period, and with these key milestones being achieved, the Company's market capitalisation has increased from approximately A$18m to over A$450m.
The Company has a simple and clean corporate and capital structure, is debt-free, and is in a strong financial position, with approximately A$29.2 million in cash on hand as at 31 March 2026 (unaudited). This financial position means the Company is well funded to continue key post-DFS workstreams, including the permitting and financing activities required to advance the Project to a final investment decision.
The Company's shares are listed on the ASX and AIM which are premier markets for growth companies and provide increased access to capital from institutional and retail investors in Australia and the UK. The Company's shares are also quoted on the OTCQX and Frankfurt Stock Exchange.
Sovereign has a strong track record of successfully raising equity funds for Kasiya plus it has an experienced and high-quality Board and management team comprising highly respected resource executives with extensive technical, financial, commercial and capital markets experience. The directors have previously raised more than A$2.5 billion from capital markets for a number of exploration and development companies.
As discussed above, and taking into account the following additional factors: 1) Recently completed funding arrangements for similar or larger scale development projects; 2) The range of potential funding options available; 3) The favourable key metrics generated by the Kasiya Project; 4) Investor interest to date; 5) The Company owns 100% of Kasiya which is highly attractive to potential financiers; and 6) The DFS demonstrates that the Project is commercially viable and provides justification to progress to the final investment decision and project finance stages, the Board has a high level of confidence that the Project will be able to secure funding in due course.
Environmental, Social, Legal and Governmental
Refer to Section 11.0 Environmental & Social Impact in the Announcement.
Sovereign is committed to conduct its activities in full compliance to the requirements of national regulations, its obligations under international conventions and treaties and giving due consideration to international best practices and policies. The Company has appointed an experienced environmental consultant to manage the ESIA process, and environmental and social baseline studies have commenced with appropriately qualified independent experts. The Company has also completed a high-level risk assessment to identify major environmental and social risks which could affect the development of the Project, along with mitigating strategies to allow identified risks to be addressed early in the project design phase.
The Company has embarked on several community engagement exercises in the area and there is a general positive acceptance of the Project. Social responsibility/RAP costs totalling US$40m have been included in this Study, as well as a 0.45% revenue royalty for the community development fund.
Based on the current assessments and commenced ESIA, the Company believes there are no environmental issues currently identified that cannot be appropriately mitigated in accordance with standard practices adopted for the development of mining projects.
Following the completion of this DFS, Sovereign intends to apply for a Mining Licence (ML) to secure mineral deposits for mining. At this point of Kasiya's development, the Company notes no known issues or impediments obtaining a ML under normal course of business.
Under the 2023 Mines Act, the Government of Malawi has a right to equity ownership for large-scale mining licences (>5Mt mined per annum or >US$250m Capex) with the right a negotiation matter, likely as part of any future MDA. The Mkango and Lotus MDAs included a 10% non-diluting equity interest to the Malawi Government.
Following successful completion of the Pilot Mining program, the test pit mined at Kasiya has been successfully backfilled which has allowed Sovereign to commence with on-site soil remediation and land rehabilitation activities, testing our proposed rehabilitation approach and demonstrating that the mined land can support sustainable farming post-closure.
During the Pilot Mining program, 170,000m3 was mined using a conventional excavator fleet. The fleet was then used to place mined material back into the pit, filling the pit to the original ground level in less than two months and ahead of schedule.
The rehabilitation approach has been based on agronomic principles, including promoting sustainable farming practices and providing various end-land uses. Rehabilitation is underway through a five-step process:
Step 1: Introduce Lime
The land rehabilitation demonstration commenced with the application and incorporation of locally sourced dolomitic lime (calcium and calcium-magnesium-carbonate) to improve naturally low PH levels.
Step 2: Introduce Carbon and Basic Nutrients
Sovereign is augmenting the mined area with organic carbon and basic nutrients to support post-closure farming. The Company is testing the application of biochar (to provide carbon) and fertiliser (in the form of potash (MOP), phosphate (MAP) and a blend of nitrogen, potash, and sulphur (NPK) 15:23:16).
Step 3: Grading, Ripping and Discing
Lime, biochar, and fertiliser are incorporated into the soil through grading, ripping, and discing using graders and locally sourced farming equipment. This ensures the land is level and safe and that essential inputs are incorporated into the soil.
Step 4: Planting of Rehabilitation Crops
Sovereign planted it first round of rehabilitation crops in the 2024/2025 cropping season, and it second round of crops in the 2025/2026 cropping season. Giant bamboo has been introduced in 4 by 8-metre blocks and will act as the primary crop to enhance carbon and bioactivity in the remediated soils. To return the land to farmers, maize and other cover crops have be intercropped between the giant bamboo in formalised farm blocks.
Step 5: Monitoring and Evaluation
Sovereign continues to monitor soil remediation, plant growth and crop yields. As part of stakeholder engagement, the Company has worked with local farmers to improve results through conservation farming, composting operations, testing new seed varieties and establishing an indigenous, fruit and farming nursery. This serves as an active and live demonstration of rehabilitation and timely return of land to pre-mining use.
APPENDIX 1 - JORC CODE, 2012 EDITION - TABLE 1
Section 1 - Sampling Techniques and Data
|
Criteria |
JORC Code explanation |
Commentary |
|||||||||||||||||||||||||||||||||||||||||||||||||||||||||||||||||||||||||||
|
Sampling Techniques |
Nature and quality of sampling (e.g. cut channels, random chips, or specific specialised industry standard measurement tools appropriate to the minerals under investigation, such as down hole gamma sondes, or handheld XRF instruments, etc). These examples should not be taken as limiting the broad meaning of sampling. |
Hand Auger (HA) samples are composited based on regolith boundaries and sample chemistry generated by hand-held XRF (pXRF). Each 1m of sample is dried and riffle-split to generate a total sample weight of 3kg for analysis, generally at 2 - 5m intervals. Spiral Auger (SA) samples are mechanical auger bulk samples collected at 1m intervals. Each 1m of sample is dried and riffle-split to generate a total sample weight of 3kg for analysis. Push-Tube and/or Diamond Core (PTDD) core drilling is sampled routinely at 2m intervals by compositing dried and riffle-split half core. Several PTDD holes were sampled on 1m intervals in a twinning campaign with HA and AC. Air-Core (AC) samples are generally composited on 2m intervals. Each 1m of sample is dried and riffle-split to generate a total sample weight of 3kg for analysis. For all sampling methods the primary sample (nominally 3kg) is split to provide two 1.5kg samples for both and graphite analyses. |
|||||||||||||||||||||||||||||||||||||||||||||||||||||||||||||||||||||||||||
|
|
Include reference to measures taken to ensure sample representivity and the appropriate calibration of any measurement tools or systems used. |
Drilling and sampling activities are supervised by a suitably qualified company geologist who is present at all times. All drill samples are geologically logged by the geologist at the drill site/core yard. Each sample is sun dried and homogenised. Sub-samples are carefully riffle split to ensure representivity. The 1.5kg composite samples are then processed. An equivalent mass is taken from each sample to make up the composite. A calibration schedule is in place for laboratory scales, sieves and field XRF equipment. Prior to June 2024 Placer Consulting Pty Ltd (Placer), then post June2024 MSA Group Resource Geologists completed site visits and reviewed Standard Operating Procedures (SOPs) for the collection and processing of drill samples and found them to be fit for purpose and support the resource classifications as applied to the MRE. The primary composite sample is considered representative for this style of rutile and graphite mineralisation. |
|||||||||||||||||||||||||||||||||||||||||||||||||||||||||||||||||||||||||||
|
|
Aspects of the determination of mineralisation that are Material to the Public Report. In cases where 'industry standard' work has been done this would be relatively simple (e.g. 'reverse circulation drilling was used to obtain 1 m samples from which 3 kg was pulverised to produce a 30 g charge for fire assay'). In other cases more explanation may be required, such as where there is coarse gold that has inherent sampling problems. Unusual commodities or mineralisation types (e.g. submarine nodules) may warrant disclosure of detailed information. |
Logged mineralogy percentages, lithology/regolith information and TiO2% obtained from pXRF are used to assist in determining compositing intervals. Care is taken to ensure that only samples with similar geological characteristics are composited together. |
|||||||||||||||||||||||||||||||||||||||||||||||||||||||||||||||||||||||||||
|
Drilling Techniques |
Drill type (e.g. core, reverse circulation, open‐hole hammer, rotary air blast, auger, Bangka, sonic, etc) and details (e.g. core diameter, triple or standard tube, depth of diamond tails, face‐sampling bit or other type, whether core is oriented and if so, by what method, etc). |
Several sampling methods have been tested at Kasiya. The drill types deemed suitable for use in the MRE are Hand Auger (HA 62mm), Air Core (AC 75 and 115mm), Push Tube and/or Diamond Core (PTDD 61 and 88mm) and Spiral Mechanical Auger (SA 300 and 700mm). Other sampling methods used for geological and verification purposes included open pit bulk samples (PIT 1x1m), Channel samples (CH 62 and 100mm) from bulk sample pits, the trial mining open pit and rehabilitation trial pits. All sampling was carried out vertically to best intersect the horizontal weathering and grade layers. All material of interest is in the weathered zones located above the saprock boundary, so no collection of oriented core was possible or warranted. |
|||||||||||||||||||||||||||||||||||||||||||||||||||||||||||||||||||||||||||
|
|
|
Two similar designs of HA drilling equipment are employed. HA drilling with 75mm diameter enclosed spiral bits (SOS) with 1m long steel rods and with 62mm diameter open spiral bits (SP) with 1m long steel rods. The SP bit accounts for less than 10% of the HA drilling, as the enclosed spiral proved to be the more effective tool. Drilling is oriented vertically by eye. Each 1m of drill sample is collected into separate sample bags and set aside. The auger bits and flights are cleaned between each metre of sampling to avoid contamination. Core-drilling is undertaken using a drop hammer, Dando Terrier MK1. The drilling generated 1m runs of 88mm PQ core in the first 2m and then transitioned to 61mm core for the remainder of the hole. Core drilling is oriented vertically by spirit level. AC drilling was completed by Thompson Drilling utilising a Smith Capital 10R3H compact track-mounted drill. Each 1m sample bag is immediately transported back to Sovereign's secure field laydown yard for processing. |
|||||||||||||||||||||||||||||||||||||||||||||||||||||||||||||||||||||||||||
|
Drill Sample Recovery |
Method of recording and assessing core and chip sample recoveries and results assessed. |
Samples are assessed visually for recoveries. The configuration of drilling and nature of materials encountered results in negligible sample loss or contamination. HA and PT drilling is ceased when recoveries become poor once the water table has been reached. Water table and recovery information is included in lithological logs. Core drilling samples are actively assessed by the driller and geologist onsite for recoveries and contamination. AC drilling recovery in the top few metres is moderate to good. Extra care is taken to maximise sample recovery in these metres. Sample weight is recorded to determine recovery at the rig at the time of drilling by the geologist. Drilling is ceased when recoveries become poor or once Saprock or refusal has been reached. The use of the AC 115mm has been adopted as the standard since October 2025. Improvements in both air pressure and cyclone management have resulted in excellent recovery. This has been combined with the use of SA 300mm twin drilling to the base of the FERP layer (4 to 6m) to further validate the quality of the AC 115mm drilling. |
|||||||||||||||||||||||||||||||||||||||||||||||||||||||||||||||||||||||||||
|
|
Measures taken to maximise sample recovery and ensure representative nature of the samples. |
The Company's trained geologists supervise drilling on a 1 team 1 geologist basis and are responsible for monitoring all aspects of the drilling and sampling process. For PT drilling, core is extruded into core trays; slough is actively removed by the driller at the drilling rig and core recovery, and quality is recorded by the geologist. AC samples are recovered in large plastic bags. The bags are clearly labelled and delivered back to sovereign's laydown yard at the end of shift for processing. Since October 2025 the cyclone is checked every 1m. If there is any hang-up in the cyclone, this material is collected and recombined with the primary sample. |
|||||||||||||||||||||||||||||||||||||||||||||||||||||||||||||||||||||||||||
|
|
Whether a relationship exists between sample recovery and grade and whether sample bias may have occurred due to preferential loss/gain of fine/coarse material. |
No relationship is believed to exist between grade and sample recovery. The high percentage of silt and absence of hydraulic inflow from groundwater at this deposit results in a sample size that is well within the expected size range. An oversize (>5mm) bias can occur where larger coarse fragments, predominantly near the surface, appear preferentially recovered when using different diameter drilling methods. The use of larger diameter drilling (AC 115mm and SA 300mm) negates the potential for this bias. |
|||||||||||||||||||||||||||||||||||||||||||||||||||||||||||||||||||||||||||
|
Logging |
Whether core and chip samples have been geologically and geotechnically logged to a level of detail to support appropriate Mineral Resource estimation mining studies and metallurgical studies. |
Geological data is collected in adequate detail for use in Mineral Resource estimation. All individual 1m HA intervals are geologically logged, recording relevant data using company codes. A small representative sample is collected for each 1m interval and placed in chip trays for future reference. All individual 1m PT core intervals are geologically logged, recording relevant data using company codes. Half core remains in the trays and is securely stored in the company warehouse. AC and SA 1m intervals are geologically logged using company codes. A small representative sample is collected for each 1m interval and placed in chip trays for future reference. |
|||||||||||||||||||||||||||||||||||||||||||||||||||||||||||||||||||||||||||
|
|
Whether logging is qualitative or quantitative in nature. Core (or costean, channel, etc.) photography. |
All logging includes lithological features and estimates of basic mineralogy. Logging is qualitative. The PTDD core is photographed dry. |
|||||||||||||||||||||||||||||||||||||||||||||||||||||||||||||||||||||||||||
|
|
The total length and percentage of the relevant intersection logged |
100% of samples are geologically logged. |
|||||||||||||||||||||||||||||||||||||||||||||||||||||||||||||||||||||||||||
|
Sub- sampling techniques and sample preparation |
If core, whether cut or sawn and whether quarter, half or all core taken. |
Due to the soft weathered nature of the material, core samples are carefully cut in half using hand tools. |
|||||||||||||||||||||||||||||||||||||||||||||||||||||||||||||||||||||||||||
|
|
If non-core, whether riffled, tube sampled, rotary split, etc. and whether sampled wet or dry. |
HA, PTDD, SA and AC hole samples are dried, riffle split and composited. Samples are collected and homogenised prior to splitting to ensure sample representivity. ~1.5kg composite samples are processed. Where drillhole lengths are composited into longer samples for processing, an equivalent mass is taken from each primary sample to make up the composite. The primary composite sample is considered representative for this style of mineralisation and is consistent with industry standard practice. |
|||||||||||||||||||||||||||||||||||||||||||||||||||||||||||||||||||||||||||
|
|
For all sample types, the nature, quality and appropriateness of the sample preparation technique. |
Techniques for sample preparation are detailed on SOP documents verified by Placer and MSA Resource Geologists. Sample preparation is recorded on a standard flow sheet and detailed QA/QC is undertaken on all samples. Sample preparation techniques and QA/QC protocols are appropriate for mineral determination and support the resource classifications as stated. |
|||||||||||||||||||||||||||||||||||||||||||||||||||||||||||||||||||||||||||
|
|
Quality control procedures adopted for all sub-sampling stages to maximise representivity of samples. |
The sampling equipment is cleaned after each sub-sample is taken. Field duplicate, laboratory replicate and standard sample statistical analysis is employed to manage sample precision and analysis accuracy. |
|||||||||||||||||||||||||||||||||||||||||||||||||||||||||||||||||||||||||||
|
|
Measures taken to ensure that the sampling is representative of the in situ material collected, including for instance results for field duplicate/second-half sampling. |
Sample size analysis is completed to verify sampling accuracy. Field duplicates are collected for precision analysis of riffle splitting. SOPs consider sample representivity. Results indicate a sufficient level of precision for mineral resource classification. |
|||||||||||||||||||||||||||||||||||||||||||||||||||||||||||||||||||||||||||
|
|
Whether sample sizes are appropriate to the grain size of the material being sampled. |
The sample size is considered appropriate for the material sampled. |
|||||||||||||||||||||||||||||||||||||||||||||||||||||||||||||||||||||||||||
|
Quality of assay data and laboratory tests |
The nature, quality and appropriateness of the assaying and laboratory procedures used and whether the technique is considered partial or total. |
Rutile All sample preparation is completed at Sovereign Metals Malawi onsite laboratory (SSL) located in Lilongwe. The sample preparation methods are considered quantitative to the point where a non-magnetic (NMag) concentrate is generated. Since June 2023 SSL has included the magnetic separation process to create the NMag concentrate, which is then sent to an external laboratory for TiO2 analysis. Prior to 2023 the Heavy Mineral Concentrate (HMC) was sent to AML Laboratory in Perth for separation. Final results generated are for recovered rutile i.e., the % mass of the sample that is rutile that can be recovered to the non-magnetic component of a HMC. The current SSL Laboratory workflow is: · Dry sample in oven for 1 hour at 105℃ · Soak in water with 1% Tetrasodium pyrophosphate (TSPP) for 12 hours and lightly agitate · Wet screen at 5mm, 600µm and 45µm to remove oversize and slimes material, since October 2025 a 2mm to 5mm size fraction has also been screened to represent the +2mm portion produced from the planned processing plant. |
|||||||||||||||||||||||||||||||||||||||||||||||||||||||||||||||||||||||||||
|
|
|
· Dry +45µm -600mm (sand fraction) in oven for 1 hour at 105℃ · Pass +45µm -600mm (sand fraction) across wet table to generate a HMC. · Dry HMC in oven for 30 minutes at 105℃ · Magnetic separation of the HMC by Carpco magnet @ 16,800G (2.9Amps) into a magnetic (Mag) and non-magnetic (NMag) fraction · Send NM to external laboratory for TiO2% (and other elements) XRF analysis Various workflows were use to produce HMC, Magnetic separation and external laboratory TiO2% plus other XRF analysis prior to June 2023 Work flow codes and number of samples impacted are presented below:
DIA-AML-IT and DIA-AML-ALS · The Sand fractions are sent to Diamantina Laboratories, Perth. Split ~150g of sand fraction for HLS using Tetrabromoethane (TBE, SG 2.96g/cc) as the liquid heavy media to generate HMC. (Heavy liquid separation (HLS) of the HM is no longer required and a HM result is not reported in the updated MRE. The HMC prepared via wet-table, gravity separation at the Lilongwe Laboratory provides an ideal sample for subsequent magnetic separation and XRF.) · Bag the HMC fraction and send to AML Perth for quantitative separation. · The resulting NM fractions are sent to either ALS Metallurgy Perth or Intertek Perth for quantitative XRF analysis. LLW-AML-IT and LLW-AML-ALS · Bag HMC fraction and send to Perth, Australia for quantitative separation at AML · The resulting NM fractions are sent to either ALS Metallurgy Perth or Intertek Perth for quantitative XRF analysis. LLW-LLW-ALS · The NM fractions are sent to ALS Metallurgy Perth for quantitative XRF analysis. Samples receive XRF_MS and are analysed for: TiO2, Al2O3, CaO, Cr2O3, Fe2O3, K2O, MgO, MnO, SiO2, V2O5, ZrO2, HfO2. LLW-LLW-SS · The NM fractions are sent to Scientific Services South Africa for quantitative XRF analysis. Samples are analysed for: TiO2, Nd2O3, CeO2, La2O3, BaO, HfO2, Nb2O5, ZrO2, Y2O3, Fe2O3, MnO, Cr2O3, V2O5, CaO, K2O, P2O5, SiO2, Al2O3, MgO, NaO2 The number of Rutile samples used in the MRE by hole type are:
Graphite All graphite samples were processed at Intertek-Genalysis Johannesburg and Perth via method C72/CSA. 750g of each 1.5kg graphite sample is pulverised to -75um with a 150g sub-sample dissolved in dilute hydrochloric acid to liberate carbonate carbon. The solution is filtered using a filter paper and the collected residue is the dried to 425°C in a muffle oven to drive off organic carbon. The 150g dried sample is then combusted using an Eltra CS-800 induction furnace infra-red Carbon / Sulphur analyser er to yield total graphitic or TGC as a percentage of the total rock. The number of samples analysed for TGC and used in the MRE by hole type are:
In some holes (especially near the surface) no graphite float was detected, these samples were not sent for analysis and were set to waste TGC grades:
|
|||||||||||||||||||||||||||||||||||||||||||||||||||||||||||||||||||||||||||
|
|
For geophysical tools, spectrometers, handheld XRF instruments, etc., the parameters used in determining the analysis including instrument make and model, reading times, calibrations factors applied and their derivation, etc. |
Acceptable levels of accuracy and precision have been established. No pXRF methods are used for quantitative determination. |
|||||||||||||||||||||||||||||||||||||||||||||||||||||||||||||||||||||||||||
|
|
Nature of quality control procedures adopted (e.g. standards, blanks, duplicate, external laboratory checks) and whether acceptable levels of accuracy (i.e. lack of bias) and precision have been established. |
Sovereign uses internal and externally sourced wet screening reference material inserted into samples batches at a rate of 1 in 20. The externally sourced, certified standard reference material for HM and Slimes assessment is provided by Placer Consulting. |
|||||||||||||||||||||||||||||||||||||||||||||||||||||||||||||||||||||||||||
|
|
|
Accuracy monitoring of the analytical work is achieved through submission of certified reference materials (CRM's). ALS, Scientific Services and Intertek all use internal CRMs and duplicates on XRF analyses. Sovereign also inserts CRMs into the sample batches at a rate of 1 in 20. Three Rutile CRMs are used by Sovereign and range from 35% - 95% TiO2. Three Graphite CRMs are used by Sovereign and range from 3% - 25% TGC. Analysis of sample duplicates is undertaken by standard statistical methodologies (Scatter, Pair Difference and QQ Plots) to test for bias and to ensure that sample splitting is representative. Standards determine assay accuracy performance, monitored on control charts, where failure (beyond 3SD from the mean) may trigger re-assay of the affected batch. Examination of the QA/QC sample data indicates satisfactory performance of field sampling protocols and assay laboratories providing acceptable levels of precision and accuracy. Acceptable levels of accuracy and precision are displayed in statistical analyses to support the resource classifications as applied to the estimate. |
|||||||||||||||||||||||||||||||||||||||||||||||||||||||||||||||||||||||||||
|
Verification of sampling & assaying |
The verification of significant intersections by either independent or alternative company personnel. |
Results are reviewed in cross-section using Datamine Studio RM and either Micromine or LeapFrog software and any spurious results are investigated. Extreme high grades are not encountered for either rutile or graphite. |
|||||||||||||||||||||||||||||||||||||||||||||||||||||||||||||||||||||||||||
|
|
The use of twinned holes. |
Twinned holes are drilled across a geographically dispersed area to determine short-range geological and assay field variability for the resource estimation. Twins were primarily: HA and AC; PTDD and AC and more recently SA and AC. A total of 389 twin holes have been drilled of which 135 are twins of the same drilling type, the remainder being comparisons between different drilling methods. All twins are within 5m of each other. The October/November AC 115mm drilling program included SA 300mm twins to the base of the FERP layer, a total of 55 twin holes. The comparison showed a 2.5% lower Rut95 grade in the AC, with the difference primarily in the higher grade near surface material. This difference was not unexpected due to difference in sample diameter. The results demonstrate the improved quality of AC recovery using the 115mm drill bit. Comparison between the drilling methods shows some bias in the sizing distributions particularly in the volume of +45 um recovered due to behaviour of coarse size fractions at the drill face. Key parameters are: sample diameter; downhole air pressure; cyclone efficiency; moisture content; and drill bit configuration. The variances observed fall within the grades tolerances expected for this type of deposit and have been taken into account in the MRE classification. |
|||||||||||||||||||||||||||||||||||||||||||||||||||||||||||||||||||||||||||
|
|
Documentation of primary data, data entry procedures, data verification, data storage (physical and electronic) protocols. |
All data is collected electronically using coded templates and logging software. This data is then imported to a SQL Database and validated both automatically (on upload) and manually (by viewing sections). |
|||||||||||||||||||||||||||||||||||||||||||||||||||||||||||||||||||||||||||
|
|
Discuss any adjustment to assay data. |
Assay data adjustments are made to convert laboratory collected weights to assay field percentages and to account for moisture. QEMSCAN of the NMag fraction shows dominantly clean and liberated rutile grains and confirms rutile is the only titanium species in the NMag fraction. Recovered rutile is defined and reported here as: TiO2 recovered in the +45 to -600um range to the NMag concentrate fraction as a % of the total primary, dry, raw sample mass divided by 95% (to represent an approximation of final product specifications). i.e., recoverable rutile within the whole sample. Graphite grade (TGC%) is not adjusted. In some holes where panning of the sample encountered no graphite flakes, a waste grade of 0.01% TGC was applied. |
|||||||||||||||||||||||||||||||||||||||||||||||||||||||||||||||||||||||||||
|
Location of data points |
Accuracy and quality of surveys used to locate drill holes (collar and down-hole surveys), trenches, mine workings and other locations used in Mineral Resource estimation. |
A Trimble R2 Differential GPS is used to pick up the drill hole collars. Daily capture at a registered reference marker ensures equipment remains in calibration. No downhole surveying of any holes is completed. Given the horizontal nature of geology and mineralisation and shallow depths of the holes, any drill hole deviation will have very limited impact on the estimation of block grades. |
|||||||||||||||||||||||||||||||||||||||||||||||||||||||||||||||||||||||||||
|
|
Specification of the grid system used. |
WGS84 UTM Zone 36 South. |
|||||||||||||||||||||||||||||||||||||||||||||||||||||||||||||||||||||||||||
|
|
Quality and adequacy of topographic control. |
The digital terrane model (DTM) was generated by wireframing a 20m-by- 20m lidar drone survey point array, commissioned by SVM in March 2022. Non-topographic features were removed from the survey points file prior to generating the topographical wireframe for resource model construction. The high resolution 3D drone aerial survey was executed utilising a RTK GPS equipped Zenith aircraft with accuracy of <10cm ground sampling distance (GSD). Post-processing includes the removal of features that do not include the undisturbed ground surface (cemeteries, pits, mounds, etc.) Topography for North - South extensions to the mineralisation outside the limits of the lidar DTM was created using the publicly available satellite topography. This was adjusted using DGPS drill hole collars to improve local accuracy. The DTM is suitable for the classification of the MRE |
|||||||||||||||||||||||||||||||||||||||||||||||||||||||||||||||||||||||||||
|
Data spacing & distribution |
Data spacing for reporting of Exploration Results. |
Preliminary regional exploration is completed on a nominal 800m grid. The infill HA drilling is spaced nominally 400m along the 400m spaced drill- lines. Further infill is completed with PT and AC holes similarly spaced at an offset grid. In some areas recent PT, AC and SA drilling has been completed on a 200m offset grid. The resultant infill 141m and 283m equilateral spacing is deemed to adequately define the mineralisation in the MRE. The PT, AC and SA holes are selectively placed throughout the deposit to ensure a broad geographical and lithological spread for the analysis. |
|||||||||||||||||||||||||||||||||||||||||||||||||||||||||||||||||||||||||||
|
|
Whether the data spacing and distribution is sufficient to establish the degree of geological and grade continuity appropriate for the Mineral Resource and Ore Reserve estimation procedure(s) and classifications applied. |
The drill spacing and distribution is considered to be sufficient to establish a degree of geological and grade continuity appropriate for the Mineral Resource estimation. Variogram analysis completed using Supervisor software informs the optimal drill and sample spacing for the MRE. Based on these results and the experience of the Competent Person, the data spacing and distribution is considered adequate for the definition of mineralisation and adequate for Mineral Resource Estimation. |
|||||||||||||||||||||||||||||||||||||||||||||||||||||||||||||||||||||||||||
|
|
Whether sample compositing has been applied. |
All samples were assigned a Weathering domain code based on the geology logging and 3D weathering profile interpretation. Separate grade domains for both rutile and graphite were interpreted based on nominal mineralisation cut-offs. Compositing to create a single composite representing the unique weathering and mineralisation domain down each hole was completed. |
|||||||||||||||||||||||||||||||||||||||||||||||||||||||||||||||||||||||||||
|
Orientation of data in relation to geological structure |
Whether the orientation of sampling achieves unbiased sampling of possible structures and the extent to which this is known considering the deposit type |
Sample orientation is vertical and approximately perpendicular to the orientation of the mineralisation, which results in true thickness estimates, limited by the sampling interval as applied. Drilling and sampling are carried out on a regular grid. |
|||||||||||||||||||||||||||||||||||||||||||||||||||||||||||||||||||||||||||
|
|
If the relationship between the drilling orientation and the orientation of key mineralised structures is considered to have introduced a sampling bias, this should be assessed and reported if material. |
There is no apparent bias arising from the orientation of the drill holes with respect to the orientation of the deposit. |
|||||||||||||||||||||||||||||||||||||||||||||||||||||||||||||||||||||||||||
|
Sample security |
The measures taken to ensure sample security |
Samples are stored in secure storage from the time of drilling, through gathering, compositing and analysis. The samples are sealed as soon as site preparation is complete. A reputable international transport company with shipment tracking enables a chain of custody to be maintained while the samples move from Malawi to South Africa and Australia. Samples are again securely stored once they arrive and are processed at respective laboratories. At each point of the sample workflow the samples are inspected by a company representative to monitor sample condition. Each laboratory confirms the integrity of the samples upon receipt. |
|||||||||||||||||||||||||||||||||||||||||||||||||||||||||||||||||||||||||||
|
Audits or reviews |
The results of any audits or reviews of sampling techniques and data |
The CP Jeremy Witley has reviewed and advised on all stages of data collection, sample processing, QA protocol and Mineral Resource Estimation. Field and in-country lab visits have been completed by Mr Witley. A high standard of operation, procedure and personnel was observed and reported. |
Section 2 - Reporting of Exploration Results
|
Criteria |
Explanation |
Commentary |
|
Mineral tenement & land tenure status |
Type, reference name/number, location and ownership including agreements or material issues with third parties such as joint ventures, partnerships, overriding royalties, native title interests, historical sites, wilderness or national park and environment settings. |
The Company owns 100% of the following Exploration Licences (ELs) EL0609, EL0582, EL0657 and EL0710 and Retention Licences RTL0035/25 to RTL0046/25 (previously EL0492). The EL's were issued in accordance with Mines and Minerals Act (2023) and are held in the Company's wholly-owned Malawi- registered subsidiaries. A 5% royalty is payable to the government upon mining and a 2% of net profit royalty is payable to the original project vendor. No significant native vegetation or reserves exist in the area. The region is intensively cultivated for agricultural crops. |
|
|
The security of the tenure held at the time of reporting along with any known impediments to obtaining a licence to operate in the area. |
The tenements are in good standing and no known impediments to exploration or mining exist. |
|
Exploration done by other parties |
Acknowledgement and appraisal of exploration by other parties. |
Sovereign is a first-mover in the discovery and definition of residual rutile and graphite resources in Malawi. No other parties are, or have been, involved in exploration. |
|
Geology |
Deposit type, geological setting and style of mineralisation |
The rutile deposit type is considered a residual placer formed by the intense weathering of rutile-rich basement paragneisses and variable enrichment by elluvial processes. Rutile occurs in a mostly topographically flat area west of Malawi's capital, known as the Lilongwe Plain, where a deep tropical weathering profile is preserved. A typical profile from top to base is generally soil ("SOIL" 0-1m) ferruginous pedolith ("FERP", 1-4m), mottled zone ("MOTT", 4-7m), pallid saprolite ("PSAP", 7-9m), saprolite ("SAPL", 9-25m), saprock ("SAPR", 25-35m) and fresh rock ("FRESH" >35m). Any rutile located in SAPR and FRESH is not considered in this Mineral Resource Estimate The graphite mineralisation occurs as multiple bands of graphite gneisses, hosted within a broader Proterozoic paragneiss package. In the Kasiya areas specifically, the preserved weathering profile hosts significant vertical thicknesses, from near surface, of graphite mineralisation. |
|
Drill hole information |
A summary of all information material to the understanding of the exploration results including a tabulation of the following information for all Material drill holes: easting and northings of the drill hole collar; elevation or RL (Reduced Level-elevation above sea level in metres of the drill hole collar); dip and azimuth of the hole; down hole length and interception depth; and hole length |
All intercepts relating to the Kasiya Deposit have been included in public releases during each phase of exploration and in this report. Releases included all collar and composite data and these can be viewed on the Company website. There are no further drill hole results that are considered material to the understanding of the exploration results. Identification of the broad zone of mineralisation is made via multiple intersections of drill holes and to list them all would not give the reader any further clarification of the distribution of mineralisation throughout the deposit. |
|
|
If the exclusion of this information is justified on the basis that the information is not Material and this exclusion does not detract from the understanding of the report, the Competent Person should clearly explain why this is the case |
Rutile grades from the 2024 AC drill program have been excluded from this MRE update as there was an unexpected issue with cyclone hangup which where occurred introduced a material sizing bias which affects the reliability of the rutile grade estimate. Geology logging and the mineralisation domains defined from the 2024 AC drilling have been incorporated to enhance confidence in the geological model. |
|
Data aggregation methods |
In reporting Exploration Results, weighting averaging techniques, maximum and/or minimum grade truncations (e.g. cutting of high-grades) and cut-off grades are usually Material and should be stated. |
All results reported are of a length-weighted average of in-situ grades. A nominal bottom cut of 0.7% rutile is used, based on preliminary assessment of resource product value and anticipated cost of operations. |
|
|
Where aggregate intercepts incorporate short lengths of high-grade results and longer lengths of low-grade results, the procedure used for such aggregation should be stated and some typical examples of such aggregations should be shown in detail. |
No data aggregation was required. |
|
|
The assumptions used for any reporting of metal equivalent values should be clearly stated. |
Rutile Equivalent (Rut_Eq = Rutile+(TGC*0.5735) - where applicable Formula: (Rutile Grade x Recovery x Rutile Price) + (Graphite Grade x Recovery x Graphite Price) / Rutile Price. Commodity Prices: · Rutile price: US$1,294/t · Graphite price: US$1,099/t Metallurgical Recovery to Product: · Rutile Recovery: 97.6% · Graphite Recovery: 70.4% |
|
Relationship between mineralisation widths & intercept lengths |
These relationships are particularly important in the reporting of Exploration Results. |
The mineralisation has been released by weathering of the underlying, layered gneissic bedrock that broadly trends NE-SW at Kasiya North and N-S at Kasiya South and far North. It lies in a laterally extensive superficial blanket with high- grade zones reflecting the broad bedrock strike orientation of ~045° in the North of Kasiya and 360° in the South and far North of Kasiya. |
|
|
If the geometry of the mineralisation with respect to the drill hole angle is known, its nature should be reported. |
The mineralisation is laterally extensive where the entire weathering profile is preserved and not significantly eroded. Minor removal of the mineralised profile has occurred in alluvial channels. These areas are adequately defined by the drilling pattern and topographical control for the resource estimate. |
|
|
If it is not known and only the down hole lengths are reported, there should be a clear statement to this effect (e.g. 'down hole length, true width not known'. |
Downhole widths approximate true widths limited to the sample intervals applied. Mineralisation remains open at depth and in areas coincident with high-rutile grade lithologies in basement rocks. Graphite results are approximate true width as defined by the sample interval and are typically higher in the deeper portions of the weathering profile. |
|
Diagrams |
Appropriate maps and sections (with scales) and tabulations of intercepts should be included for any significant discovery being reported. These should include, but not be limited to a plan view of the drill collar locations and appropriate sectional views. |
Refer to figures and diagrams provided in this announcement as well as previous announcements (which are accessible on the Company's website). |
|
Balanced reporting |
Where comprehensive reporting of all Exploration Results is not practicable, representative reporting of both low and high-grades and/or widths should be practiced to avoid misleading reporting of exploration results. |
All results are included in this report and in previous releases. These are accessible on the Company's website. |
|
Other substantive exploration data |
Other exploration data, if meaningful and material, should be reported including (but not limited to: geological observations; geophysical survey results; geochemical survey results; bulk samples - size and method of treatment; metallurgical test results; bulk density, groundwater, geotechnical and rock characteristics; potential deleterious or contaminating substances. |
Limited lateritic duricrust has been variably developed at Kasiya, as is typical in tropical highland areas subjected to seasonal wet/dry cycles. Lithological logs record drilling refusal in under 2% of the HA/PT drill database. No drilling refusal was recorded above the saprock interface by AC drilling. Slimes (-45 µm) averages 46wt% in the primary rutile mineralisation zone. Separation test work conducted at AML demonstrates the success in applying a contemporary mineral sands flowsheet in treating this material and achieving excellent rutile recovery. Sample quality (representivity) is established by statistical analysis of comparable sample intervals. Several generations of QEMSCAN analysis of the NMag performed at ALS Metallurgy, shows dominantly clean and liberated rutile grains and confirms rutile is the only titanium species in the NMag fraction. |
|
Further work |
The nature and scale of planned further work (e.g. test for lateral extensions or depth extensions or large-scale step-out drilling). |
Additional waste rock characterisation work relevant to mining scale, related to barren clay horizons related to recent alluvial weathering (dambos), amphibolite and pegmatitic zones. A greater understanding of the lithological character and extent of those basement units, where high-grade (>1%) rutile persists at the saprock interface, may assist in focusing further resource definition and exploration targeting. |
|
|
|
Further metallurgical assessment is suggested to characterise rutile quality and establish whether any chemical variability is inherent across the deposit. Further laboratory and metallurgical analysis of the Mag fraction to improve the definition of the Rare Earth Elements (REE) associated with the presence of Monazite in the Mag fraction. Further analysis of other potential HM associated with the byproducts of rutile production. |
|
|
Diagrams clearly highlighting the areas of possible extensions, including the main geological interpretations and future drilling areas, provided this information is not commercially sensitive. |
Refer to diagrams in the body of this report and in previous releases. These are accessible on the Company's website. |
Section 3 - Estimation and Reporting of Mineral Resources
|
Criteria |
JORC Code explanation |
Commentary |
||||||||||||||||||||||||||||||||||||||||||
|
Database integrity
|
Measures taken to ensure that data has not been corrupted by, for example, transcription or keying errors, between its initial collection and its use for Mineral Resource estimation purposes. |
Data are manually entered into database tables according to SOPs and conforming to company field names and classifications. These are migrated to Datashed5 (prior to June 2024) and now MX Deposit database managed internally by the Company (with external support from Cape Town based exploration company RES) with validation and quarantine capability. Relevant tables from the database are exported to csv format and forwarded to MSA for independent review. |
||||||||||||||||||||||||||||||||||||||||||
|
|
Data validation procedures used. |
Validation of the primary data include checks for duplicate or overlapping intervals, missing survey data, missing assay data or missing lithological data. Statistical, out-of-range, distribution, error and missing data validation is completed by MSA on data sets before being compiled into a de-surveyed drill hole file and interrogated in 3D using Datamine Studio RM software. All questions relating to the input data are forwarded to the client for review and resolution prior to resource estimation. The type and number of holes used in the MRE are:
Additional sampling included open pits, channel sampling of the trial mining area which were used for checking and validation of the various drilling methods:
|
||||||||||||||||||||||||||||||||||||||||||
|
Site visits |
Comment on any site visits undertaken by the Competent Person and the outcome of those visits. |
Field and SSL laboratory visits were completed over a 1-week period in November 2024 and June 2025. A high standard of operation, procedure and personnel was observed and reported. |
||||||||||||||||||||||||||||||||||||||||||
|
|
If no site visits have been undertaken indicate why this is the case. |
Not applicable |
||||||||||||||||||||||||||||||||||||||||||
|
Geological interpretation |
Confidence in (or conversely, the uncertainty of) the geological interpretation of the mineral deposit. |
There is a high degree of repeatability and uniformity in the geological character of the Kasiya Deposit demonstrated by lithological logging of AC, PT core and HA samples. Satellite imagery and airborne geophysical data provided guidance for interpreting the strike continuity of the deposit. Drill hole intercept logging and assay results (AC, PT, SA and HA), stratigraphic interpretations from drill core and geological logs of drill data have formed the basis for the geological interpretation. The drilling exclusively targeted the SOIL, FERP, MOTT and SAPL weathering horizons, with no sampling of the SAPR and below the upper level of the fresh rock (FRESH) domain. |
||||||||||||||||||||||||||||||||||||||||||
|
|
Nature of the data used and of any assumptions made. |
No assumptions were made. |
||||||||||||||||||||||||||||||||||||||||||
|
|
The effect, if any, of alternative interpretations on Mineral Resource estimation. |
No alternative interpretations on Mineral Resource Estimation are offered. |
||||||||||||||||||||||||||||||||||||||||||
|
|
The use of geology in guiding and controlling Mineral Resource estimation. |
The mineral resource is constrained by the drill array plus up to 400m area of influence from nearest drilling. The topographical DTM constrains the vertical extent of the resource. The primary domain control is weathering type - SOIL+FERP, MOTT, PSAP and SAPL. This is further sub-divided into rutile mineralisation (nominally >=0.5% Rutile) and graphite mineralisation (nominally >=0.6% TGC). The mineralisation domains are treated independently of each other. The base to mineralisation is constrained by a DTM representing the bottom of drilling. AC drilling has accurately defined depth to basement at the saprock interface, which has been modelled in the MRE where intersected. |
||||||||||||||||||||||||||||||||||||||||||
|
|
The factors affecting continuity both of grade and geology. |
Rutile grade is concentrated in surface regolith horizons. Deposit stratigraphy and weathering is consistent along and across strike. Rutile grade trend is oriented at 45 degrees at Kasiya North and 360 degrees at Kasiya South and far North, which mimics the underlying basement source rocks and residual topography. Rutile varies across strike as a result of the layering of mineralised and non-mineralised basement rocks. Areas containing near surface clay lenses, amphibolite and narrow cross striking pegmatitic rocks are barren of rutile and graphite. These zones have been modelled and excluded from the mineralisation domains. |
||||||||||||||||||||||||||||||||||||||||||
|
Dimensions |
The extent and variability of the Mineral Resource expressed as length (along strike or otherwise), plan width, and depth below surface to the upper and lower limits of the Mineral Resource. |
The Kasiya mineralised footprint strikes N - S & NE - SW, is 72km long and approximately 20km at its widest section. The currently defined surface extent of >=0.7% rutile is about 268.6km2.. The mineral resource occurs from surface to the saprolite-saprock interface, which is typically in the order of 15 m, although can attain localised thicknesses in excess of 25 m. The deposit thins towards the edges to approximately 5 m and pinches out in the drainage channels. |
||||||||||||||||||||||||||||||||||||||||||
|
Estimation and modelling techniques |
The nature and appropriateness of the estimation technique(s) applied and key assumptions, including treatment of extreme grade values, domaining, interpolation parameters and maximum distance of extrapolation from data points. If a computer assisted estimation method was chosen include a description of computer software and parameters used. |
Datamine Studio RM, LeapFrog and Supervisor software are used for the data analysis, variography, geological interpretation and resource estimation. A 3D block model honouring the geology boundaries which included weathering horizons; barren mafic intrusives; surface clay horizons, cross striking pegmatitic zones and presence of barren or low grade amphibolite was created. The model was also coded with the tenement EL codes, rock in-situ dry bulk density and moisture content. Rutile mineralisation was defined as the last intercept >=2m down hole exceeding 0.5% Rutile. Generally, rutile grade is highest at the surface gradually reducing in grade with depth. Using this guideline very little internal low grade/waste is introduced. The resulting sample point data was used to create the bounding lower surface for a rutile mineralisation DTM. Additional manual points were interpreted in section by section to ensure consistency, especially in areas with wider spaced drilling. Graphite mineralisation was defined as the highest up hole intercept >-2m exceeding 0.6% TGC. Generally, TGC grade is highest at depth gradually reducing in grade closer to the surface. Using this guideline very little internal low grade/waste is introduced. Similarly to rutile, a graphite mineralisation upper limit DTM was constructed. The lower limit of graphite mineralisation was either the base of drilling or the top of SAPR if drilling intersected SAPR. Eight grade domains were created, 4 mineralised and 4 low grade / waste for both rutile and graphite, based on the combination of weathering type inside or outside the mineralisation DTM's. Samples were composited to 1 sample per drillhole per domain. Rutile and TGC samples were treated independently as there is no correlation between rutile and TGC grades. The composite populations generally approximated normal distributions with some -ve and/or +ve skewness relating to the imposed mineralisation boundary. Ordinary Kriging (OK) was considered the best grade estimator for both rutile and graphite due to the near normal grade distributions and adequate variograms. Variography analysis was used to determine population nugget effect and OK search and neighbourhood parameters. Each grade domain was treated as a 2D seam and estimated using OK with dynamic anisotropy which followed the broad mineralisation continuity trends. No declustering or removal of twin data was required, as OK is an optimal declustering algorithm, and the post OK checks demonstrated no negative weights in the mineralised zones. Any areas not estimated were set to waste grades. |
||||||||||||||||||||||||||||||||||||||||||
|
|
The availability of check estimates, previous estimates and/or mine production records and whether the Mineral Resource estimate takes appropriate account of such data. |
This is the fifth MRE for the Kasiya Deposit. Bulk-scale test work has been completed and results support the view of the Competent Person that an economic deposit of readily separable, high- quality rutile is anticipated from the Kasiya Deposit. The recovery of a coarse- flake graphite by-product was also achieved by the test work. |
||||||||||||||||||||||||||||||||||||||||||
|
|
The assumptions made regarding recovery of by-products. |
A graphite co-product was modelled as recoverable TGC based on the test-work. |
||||||||||||||||||||||||||||||||||||||||||
|
|
Estimation of deleterious elements or other non-grade variables of economic significance (e.g. sulphur for acid mine drainage characterisation). |
No significant deleterious elements are identified. A selection of assay, magnetic separation, XRF and mineralogical results have been reviewed. |
||||||||||||||||||||||||||||||||||||||||||
|
|
In the case of block model interpolation, the block size in relation to the average sample spacing and the search employed. |
The parent cell size used is equivalent to the infill drill hole spacing within the Measured Resource (200m*200m). XY sub-celling to 50m*50m is adequate resolution for horizontal boundaries. Seam modelling ensured the weathering and topography layers were vertically accurate (within the 50m horizontal resolution). Grade was estimated using the parent cell panel size. |
||||||||||||||||||||||||||||||||||||||||||
|
|
Any assumptions behind modelling of selective mining units. |
Dry mining using bulk mining methods such as dragline and/or excavator load and haul has been considered in the modelling. The assumption is that any mining selectivity will be based on distinct weathering horizons which range in thickness from 2m to 9m, with a near horizontal dip. |
||||||||||||||||||||||||||||||||||||||||||
|
|
Any assumptions about correlation between variables. |
Rutile and graphite mineralisation have been modelled separately as there is no correlation between them. |
||||||||||||||||||||||||||||||||||||||||||
|
|
Description of how the geological interpretation was used to control the resource estimates. |
Grade estimation was constrained by hard boundaries (domains) that result from the geological interpretation and mineralisation interpretation. |
||||||||||||||||||||||||||||||||||||||||||
|
|
Discussion of basis for using or not using grade cutting or capping. |
Top Capping was applied to the composites considered to be outliers to reduce local high-grade bias. Generally <1% of samples had a grade cap applied. |
||||||||||||||||||||||||||||||||||||||||||
|
|
The process of validation, the checking process used, the comparison of model data to drill hole data, and use of reconciliation data if available. |
Validation of the grade estimate was completed both visually and statistically. Visual validation by loading the model and drill hole files and annotating, colouring and using filtering to check for the appropriateness of the estimate. Distributions of section line averages (swath plots) for drill holes and models were prepared for each zone and orientation for comparison purposes. The resource model has appropriately averaged informing drill hole data and is considered suitable to support the resource classifications as applied to the estimate. No production has been carried out, so no reconciliation data is available. |
||||||||||||||||||||||||||||||||||||||||||
|
Moisture |
Whether the tonnages are estimated on a dry basis or with natural moisture, and the method of determination of the moisture content. |
Tonnages are estimated on a dry basis. Average moisture content is included in the model for mine planning purposes. |
||||||||||||||||||||||||||||||||||||||||||
|
Cut-off parameters |
The basis of the adopted cut-off grade(s) or quality parameters applied. |
The mineral resource is confined to an economically optimised pit shell based on financial parameters. For clarity and comparison with previous resource estimates, the MRE has been subdivided into a rutile dominant resource (reported at >=0.4% Rutile which is similar to previous MRE's) and a graphite rich zone (generally below the rutile resource) reported at 0.6% TGC cutoff grade. Note: The pit shell includes internal lower grade rutile and graphite material which is tabled for transparency as it will most probably be mined due to the bulk mining methodology. |
||||||||||||||||||||||||||||||||||||||||||
|
Mining factors or assumptions |
Assumptions made regarding possible mining methods, minimum mining dimensions and internal (or, if applicable, external) mining dilution. It is always necessary as part of the process of determining reasonable prospects for eventual economic extraction to consider potential mining methods, but the assumptions made regarding mining methods and parameters when estimating Mineral Resources may not always be rigorous. Where this is the case, this should be reported with an explanation of the basis of the mining assumptions made. |
Dry-mining has been determined as the optimal method of mining for the Kasiya Rutile deposit. The materials competence is loose, soft, fine and friable with no cemented sand or dense clay layers, allowing for a free dig mining method. It is considered that the strip ratio would be zero or near zero. Dilution is considered to be minimal as rutile mineralisation occurs from surface and mineralisation is generally gradational into the low-grade portions with few sharp boundaries. |
||||||||||||||||||||||||||||||||||||||||||
|
Metallurgical factors or assumptions |
The basis for assumptions or predictions regarding metallurgical amenability. It is always necessary as part of the process of determining reasonable prospects for eventual economic extraction to consider potential metallurgical methods, but the assumptions regarding metallurgical treatment processes and parameters made when reporting Mineral Resources may not always be rigorous. Where this is the case, this should be reported with an explanation of the basis of the metallurgical assumptions made. |
Recovery parameters have not been factored into the estimate. However, the valuable minerals are readily separable due to their SG differential and are expected to have a high recovery through the proposed, conventional wet concentration plant. Rigorous metallurgical testwork on rutile and graphite recoverability and specifications has been completed on numerous bulk samples since 2018. Rutile recovered to product is modelled at 97.6% (the estimated rutile grade is a recovered grade). The average recovery for graphite recovered to product is 70.4%. The chemical and physical specifications of both products rank in the top quartile. |
||||||||||||||||||||||||||||||||||||||||||
|
Environmental factors or assumptions |
Assumptions made regarding possible waste and process residue disposal options. It is always necessary as part of the process of determining reasonable prospects for eventual economic extraction to consider the potential environmental impacts of the mining and processing operation. While at this stage the determination of potential environmental impacts, particularly for a greenfields project, may not always be well advanced, the status of early consideration of these potential environmental impacts should be reported. Where these aspects have not been considered this should be reported with an explanation of the environmental assumptions made. |
The Project has commenced preparation of the Environmental and Social Impact Assessment (ESIA), and all supporting biological, social and biophysical specialist studies have been concluded, and have been fed into the Project design as modifying factors or assumptions. The unconstrained MRE was constrained by both environmental and social no-go areas which acted as modifying factors. This allowed the determination of the constrained MRE covering the current 22 pits of 3,400 hectares. The constrained mapping reduced social impact by completely avoiding nearby communities, as well as avoiding all remanent natural habitats - barring the establishment of the Water Storage Dam. With respect to possible waste and process residue, full hydrogeological and geochemical testing has been concluded. Metals leaching is deemed a low risk, with most modelled parameters are expected to remain within local and WHO drinking water standards. Risk related to acid mine drainage has been categorized as intermediate - as while the Sulphides are below thresholds (<0.3%) there is near no neutralizing capacity. Long-term kinetic leach testing is required to verify the models; however, no specific or targeted disposal measures is currently required as the risks is not deemed to be material. |
||||||||||||||||||||||||||||||||||||||||||
|
Bulk density |
Whether assumed or determined. If assumed, the basis for the assumptions. If determined, the method used, whether wet or dry, the frequency of the measurements, the nature, size and representativeness of the samples. |
In-situ dry bulk density was calculated from 400 core samples taken from spatially and lithologically-representative sites across the deposit. Dry bulk density is calculated from PT drill core using a cylinder volume wet and dry method performed by Sovereign in Malawi. Shelby tube core samples collected from the 2024 PTDD drill program were analysed by CIVILAB in South Africa. Bulk density data was coded by weathering horizon. Population distributions were then reviewed and obvious outlies removed. Either the mean or median were used as the average for each weathering and/or rock type domain. |
||||||||||||||||||||||||||||||||||||||||||
|
|
The bulk density for bulk material must have been measured by methods that adequately account for void spaces (vughs, porosity, etc.), moisture and differences between rock and alteration zones within the deposit. |
The in-situ volume and dry mass method was used, which accounts for porosity. No significant voids are expected. |
||||||||||||||||||||||||||||||||||||||||||
|
|
Discuss assumptions for bulk density estimates used in the evaluation process of the different materials. |
The average in-situ dry bulk density of the total MRE is 1.60 t/m3. This is derived from using an average density of 1.39 t/m3 for the SOIL; 1.58 t/m3 for the FERP, 1.66 t/m3 for the MOTT; 1.68 t/m3 for the PSAP; and 1.77 t/m3 for SAPL; Density was assigned based on the weathering domain. |
||||||||||||||||||||||||||||||||||||||||||
|
Classification |
The basis for the classification of the Mineral Resources into varying confidence categories. |
The Kasiya MRE has been classified as Measured, Indicated or Inferred. JORC classification considered geological understanding; mineralisation continuity; drilling and sampling quality and spacing; OK estimation efficiency and confidence (SoR); and proposed mining method and scale. The dominant control on grade distribution within the mineralised zone is intensity of weathering. Rutile is a mineral resistant to weathering and is concentrated by depletion of less resistant minerals during the weathering process resulting in higher grades near the surface where more intense weathering has taken place. The weathering profiles are consistent and readily defined by logging of drill samples. Both rutile and graphite mineralisation have been well defined by drilling and appropriate sample analysis to determine rutile recovered grade and in-situ TGC. Both mineralisation zones are broad and continuous with rutile dominant in the Soil, FERP and MOTT horizons, and graphite in the PSAP and SAPL horizons. There is significant overlap of the two mineralisation zones. The mineralisation is truncated either by changes in the protolith of displaced by mafic intrusives. Recent drainage has also impacted mineralisation continuity. The dominant zones of mineralisation exceed 10km of strike continuity and range from 1 to 4km in width. Regional exploration was completed on a nominal 800m square grid, with infill to 400m then either 200m square or 200m offset grid. Twin holes plus some close spaced geostatistical drilling, close spaced channel sampling during the trial mining and open pit sampling have all demonstrated the robustness of the geology interpretation and mineralisation continuity. OK efficiency (KE) generally exceeds 0.6 with SoR exceeding 0.85 in the dominant mineralised zones. Based on the high confidence geology interpretation; mineralisation scale and continuity, including considering the bulk mining method; and very tight grade distributions within the estimation domains the Competent Person is comfortable classifying all the Mineral Resource as either Measured, Indicated or Inferred. Measured was defined using a nominal KE >=0.6 and a SOR >=0.85 but generally exceeding 0.9, which generally fits areas with a nominal drill spacing of 200 by 200m. A boundary was used to define the Measured Mineral Resource. Indicated was defined using a nominal KE >=0.4 to 0.5 and a SOR >=0.8, which generally fits areas with a nominal drill spacing of 400 to 200m. A boundary was used to define the Indicated Mineral Resource. The Mineral Resource was constrained to a potentially economic open pit shell to reflect the code requirement for Reasonable Prospects of Eventual Economic Extraction (RPEEE). The shell was defined using Whittle Open Pit Optimisation with the following parameters: Rutile: Net concentrate revenue US$1400/t; Process recovery 100%; Graphite: Net revenue US$1200/t ; Average Process recovery of 70.4%. Mining Opex US$1.35/t; Process Opex US$5.44/t The MRE is presented in 3 Tables. The top table presents the rutile dominant mineral resource based on a higher rutile cut-off pit shell - optimised using the $1,400 rutile price using a nominal ore grade cutoff of 0.75% Rutile. This pit shell was generated to maximise material above 0.7% Rutile as a comparison with the previously reported MRE. The middle table presents the remaining mineral resource within the primary pit shell but outside (mainly below) the rutile dominant pit shell. This table is further sub-divided to show the high grade graphite material (primarily at depth) and the lower grade rutile material (primarily at the edges of the deposit). The bottom table presents the entire MRE constrained to the RPEEE Open Pit shell. No cutoff is applied as material <0.7% Rut_EQ will likely be mined as internal dilution as it is spread throughout the MRE in small pockets not suitable for selective mining. |
||||||||||||||||||||||||||||||||||||||||||
|
|
Whether appropriate account has been taken of all relevant factors (i.e. relative confidence in tonnage/grade estimations, reliability of input data, confidence in continuity of geology and metal values, quality, quantity and distribution of the data). |
All relevant factors were assessed by the Competent Person, including data quality, confidence in the geological interpretation and framework for the mineral resource, mineralisation continuity and variability. Geostatistical parameters relative to drillhole spacing was used guide the classification of the Mineral Resource. |
||||||||||||||||||||||||||||||||||||||||||
|
|
Whether the result appropriately reflects the Competent Person's view of the deposit |
The MRE appropriately reflects the Competent Person's view of the Kasiya rutile and graphite deposit. |
||||||||||||||||||||||||||||||||||||||||||
|
Audits or reviews |
The results of any audits or reviews of Mineral Resource estimates. |
The Mineral Resource was completed by the SVM technical services team. MSA completed fine tuning of the mineralisation interpretation, statistics, variography and OK parameters. The final model was reviewed by the Competent Person within the MSA team. |
||||||||||||||||||||||||||||||||||||||||||
|
Discussion of relative accuracy/ confidence |
Where appropriate a statement of the relative accuracy and confidence level in the Mineral Resource estimate using an approach or procedure deemed appropriate by the Competent Person. For example, the application of statistical or geostatistical procedures to quantify the relative accuracy of the resource within stated confidence limits, or, if such an approach is not deemed appropriate, a qualitative discussion of the factors that could affect the relative accuracy and confidence of the estimate. |
Additional mineralisation is expected to occur below the effective depth of HA and PT drilling. This has been confirmed by areas which have included deeper AC drilling. A high-degree of uniformity exists in the broad and contiguous lithological and grade character of the deposit. Drilling, sampling and data collection procedures have been professionally executed. QA protocols and interpretations conform to industry best practice. Assay, mineralogical determinations and metallurgical test work conform to industry best practice and demonstrate a rigorous assessment of product and procedure. The development of a conventional processing flowsheet and marketability studies support the classification of the Kasiya Resource. |
||||||||||||||||||||||||||||||||||||||||||
|
|
The statement should specify whether it relates to global or local estimates, and, if local, state the relevant tonnages, which should be relevant to technical and economic evaluation. Documentation should include assumptions made and the procedures used. |
The block model estimate is of sufficient accuracy to apply modifying factors for mine planning in the portion classified as Measured and Indicated Mineral Resource. Inferred Mineral Resources are global in nature and are suitable for economic evaluation at a high level such as a scoping study. Recoverable resource estimates have not been made on a selective mining unit basis. |
||||||||||||||||||||||||||||||||||||||||||
|
|
These statements of relative accuracy and confidence of the estimate should be compared with production data, where available. |
No production data are available to reconcile model results. |
Section 4 - Estimation and Reporting of Ore Reserves
JORC Table 1
Estimation and Reporting of Ore Reserves
The following information provided complies with the 2012 JORC Code requirements specified by 'Table-1 Section 4' of the Code. Each item in this table has been summarised as the basis for the assessment of overall Ore Reserves risk in the table below, with each of the risks related to confidence and/or accuracy of the various inputs into the Ore Reserves qualitatively assessed.
|
Criteria |
JORC Code explanation |
Commentary |
|||||||||||||||||||||||||||||||||||||||||||||||||||||||||||||||||||||||||||||||||||||||||||||||||||||||||||||||||||
|
Mineral Resource estimate for conversion to Ore Reserves |
· Description of the Mineral Resource estimate used as a basis for the conversion to an Ore Reserve. · Clear statement as to whether the Mineral Resources are reported additional to, or inclusive of, the Ore Reserves. |
· The current identified MRE underpins the Ore Reserve reported in this DFS. · The updated 2026 Mineral Resource model was prepared by Sovereign under the guidance and review of Independent Competent Person Mr Jeremy Witley of MSA Group South Africa. The updated MRE followed additional drilling which significantly upgraded both Inferred to Indicated and Indicated to Measured Mineral Resources. · The Ore Reserves are included within the Mineral Resource Estimate. |
|||||||||||||||||||||||||||||||||||||||||||||||||||||||||||||||||||||||||||||||||||||||||||||||||||||||||||||||||||
|
Site visits |
· Comment on any site visits undertaken by the Competent Person and the outcome of those visits. · If no site visits have been undertaken, indicate why this is the case. |
· Mr. Fourie has been engaged by Sovereign and consulted on the PFS, OPFS, DFS, and trial mining program completed in 2024-2025, including approximately two months spent on site at Kasiya in 2024. |
|||||||||||||||||||||||||||||||||||||||||||||||||||||||||||||||||||||||||||||||||||||||||||||||||||||||||||||||||||
|
Study status |
· The type and level of study undertaken to enable Mineral Resources to be converted to Ore Reserves. · The Code requires that a study to at least Pre-Feasibility Study level has been undertaken to convert Mineral Resources to Ore Reserves. Such studies will have been carried out and will have determined a mine plan that is technically achievable and economically viable, and that material Modifying Factors have been considered. |
· The study was completed to a feasibility level of detail. · A detailed plan that is technically achievable and economically viable has been completed. |
|||||||||||||||||||||||||||||||||||||||||||||||||||||||||||||||||||||||||||||||||||||||||||||||||||||||||||||||||||
|
Cut-off parameters |
· The basis of the cut-off grade(s) or quality parameters applied. |
· The pit shell generated was based on a 0.7% RUT95 cut-off grade. Although all ore incapsulated in the inventory of the pit will be sent to the processing plant as ore, regardless of grade. · All material in the pits will be sent to the process plant, except for isolated waste portions, which can easily be identified and removed as waste. As no cut-off grade is applied a validation of the average Rut95 grade over the LoM compared to the breakeven cut-off grade was investigated. The calculated breakeven Rut95 cut-off grade is 0.42%, with the LoM average being 0.96% Rut95. This demonstrates that the average grade over the LoM for all the material is well above the calculated breakeven cut-off grade and therefore the assumption that all material is sent to the plant to be treated as ore and form part of the Ore Reserve is validated. · A financial assessment was undertaken to ascertain whether the LoM Plan fulfils the criteria of 'reasonable prospects for eventual economic extraction' using detailed costs. On the basis that no cut-off grade is being used for the Project the CP finds it to be appropriate for the operation, considering the nature of the deposit, and the associated project economics. |
|||||||||||||||||||||||||||||||||||||||||||||||||||||||||||||||||||||||||||||||||||||||||||||||||||||||||||||||||||
|
Mining factors or assumptions |
· The method and assumptions used as reported in the Pre-Feasibility or Feasibility Study to convert the Mineral Resource to an Ore Reserve (i.e. either by application of appropriate factors by optimisation or by preliminary or detailed design). · The choice, nature and appropriateness of the selected mining method(s) and other mining parameters including associated design issues such as pre-strip, access, etc. · The assumptions made regarding geotechnical parameters (e.g. pit slopes, stope sizes, etc.), grade control and pre-production drilling. · The major assumptions made and Mineral Resource model used for pit and stope optimisation (if appropriate). · The mining dilution factors used. · The mining recovery factors used. · Any minimum mining widths used. · The manner in which Inferred Mineral Resources are utilised in mining studies and the sensitivity of the outcome to their inclusion. · The infrastructure requirements of the selected mining methods. |
· The Mineral Resource model prepared by Sovereign under the guidance and review of Independent Competent Person, Mr Jeremy Witley, of MSA Group South Africa was used for the estimation of Ore Reserves. · Pit optimisation work, which defines the Ore Reserve estimate and subsequently the LOM schedules were generated. · The open pit geometries developed for the purposes of mine planning, and which define the subsequent Ore Reserve, are based on NPVS pit shells edited to comply with practical mining requirements and identified exclusion zones. · Due to the shallow nature of the geometries, and there being no requirements for ramp access due to the mining methodology, traditional mine designs were not developed. · Initially the mining method considered in the PFS for the Kaysia Project was a hydro mining operation. During a trail mining period, mechanical and hydro mining methods were tested with the outcome indicating that mechanical methods are better suited for the Project. · The mining method for the Project will therefore be based on utilising mechanical equipment (draglines with excavator support). Trucking the mined material to the processing plants with 90t RDT's. · A strip-mining configuration will be implemented. · The mining operation will not require any machinery at the bottom of the pit and due to the shallow nature of the operation, geotechnical slopes is insignificant. · A 30-degree slope angle is required only on the active face where the heavy dragline machinery will be operational. · The quantities of dilution and ore losses will be negligible due to the relatively homogenous and continuous nature of the orebody and therefore 0% dilution and Ore Losses were applied, as all tonnes mined (except for isolated waste portions, which can easily be identified and removed as waste) will be processed. · It was imperative to mine each of the pits from the deepest portion first and mine progressively to the shallower areas. The first strip was placed in such a manner of each pit so that water is constantly draining away from the working faces so that the clean water can be reclaimed as processing water from the sump. The strips were based on the following assumptions: · Starting the first strip in the pit at the area which will provide the lowest elevation and developing towards the high point to assist with natural water drainage to the collection sump for dewatering. · Minimum width of 50m but preferably 200m to allow for grade blending and slower face progressions with optimal productivity. · No Inferred Mineral Resources were included. The portion of Inferred Mineral resources included in the pit was classified as waste and removed, The Inferred Mineral Resources are situated in an isolated area, which could be easily separated from all other material. · The main mining infrastructure includes processing plants, ore stockpiles, haul roads/ramps, workshops and piping required for backfilling. |
|||||||||||||||||||||||||||||||||||||||||||||||||||||||||||||||||||||||||||||||||||||||||||||||||||||||||||||||||||
|
Metallurgical factors or assumptions |
· The metallurgical process proposed and the appropriateness of that process to the style of mineralisation. · Whether the metallurgical process is well-tested technology or novel in nature. · The nature, amount and representativeness of metallurgical test work undertaken, the nature of the metallurgical domaining applied and the corresponding metallurgical recovery factors applied. · Any assumptions or allowances made for deleterious elements. · The existence of any bulk sample or pilot scale test work and the degree to which such samples are considered representative of the orebody as a whole. · For minerals that are defined by a specification, has the ore reserve estimation been based on the appropriate mineralogy to meet the specifications? |
Rutile Processing Plant Test work has been conducted across four key study phases: Scoping Study (SS) 2021, Pre-Feasibility Study (PFS) 2023, Optimised Pre-Feasibility Study (OPS) 2024, and Definitive Feasibility Study (DFS) 2026. A series of bulk samples, listed below, were processed during the SS, PFS, OPFS and DFS phases to validate and refine the metallurgical flowsheet for the Kasiya Rutile Project. · 2020 - Kasiya North (1 tonne): A bulk sample was processed at Allied Mineral Laboratories (AML) in Perth, Western Australia. The testwork included desliming, particle classification, MG12 spiral separation, attritioning, and both electrostatic and magnetic separation. This produced rutile, ilmenite, and non-conductor concentrates. Flocculant screening and thickening tests were subsequently conducted at Metso Outotec in 2021. · 2021 - Kasiya North (1.6 tonnes): Building on the 2020 flowsheet, this sample underwent additional testing at AML, focusing on fine particles (<45 µm) and combined spiral concentrates. The dry separation process assumptions were validated, and approximately 650 kg of fine material was generated for pilot-scale thickening (High Compression and High Rate), pressure filtration, and centrifuge testwork conducted by Metso Outotec · 2022 - Kasiya South Composite (250 kg): A composite sample from early-mining areas (Kingfisher, Dove/Parrot, Sparrow) was tested to confirm that Kasiya South ore behaves similarly to Kasiya North. The PFS gravity and dry separation flowsheet for rutile was successfully validated. · 2023 - Kasiya South Kingfisher (2.5 tonnes): A bulk sample comprising of multiple samples taken from the larger Kasiya South (Kingfisher, Mousebird, Babbler, Flycatcher, Starling, Dove and Parrot), was used for variability testwork aligned with the early years of the PFS mine plan. · 2023 - Dove/Parrot Composite (250 kg): A sub-sample from Kingfisher, Dove/Parrot and Sparrow pits, also representing early-mining areas, was collected and stored in Perth. The sample was processed considering the developed flowsheet. However, this sample was not included in the DFS mine plan. During the DFS phase, variability testwork was conducted to assess metallurgical performance across ore zones scheduled for mining in the first eight years. This work aimed to validate recovery assumptions and refine domain-specific processing parameters. At the start of the DFS, the OPFS mine plan was used to select the Metallurgical Bulk Samples.
Following the DFS Mineral Resource Estimate (MRE) update and mine plan optimisation, it was determined that some bulk samples selected at the start of the DFS were no longer representative of the early mining schedule. As a result, additional samples were collected from key pits to represent the pits to be mined in accordance with the DFS mine schedule: · Sparrow/Babbler/Mousebird Composite Samples: Complete Lithology - (FERP/MOTT/PSAP/SAPL): 1045 kg Upper Lithology - FERP Horizon Only (~0-4.5 m): 234 kg Lower Lithology - Below FERP (MOTT/PSAP/SAPL): 870 kg · Hawk and Crow Pits: Full lithology samples were collected and processed. These samples were selected to ensure coverage of geological variability and to support geometallurgical modelling efforts. All variability samples were processed replicating the established rutile flowsheet, consistent with prior bulk sample campaigns. Where sample mass was insufficient for spiral separation, wet tables were employed as a substitute. The DFS Flowsheet adds a scrubber at the start of the circuit due to the mining method change from Hydraulic mining in the PFS to Dry mining in the DFS. Processing steps included: · Gravity Separation: Classification via Up Current Classifier (UCC) to separate fine light minerals from coarse dense minerals. Rougher spirals (fine and coarse) to produce Heavy Mineral Concentrate (HMC) and graphite-rich tailings. Cleaner, scavenger, and recleaner spirals for HMC refinement. · Dry Mineral Separation (MSP - Rutile Production): Removal of +600 µm trash minerals. Attritioning of HMC followed by UCC fines removal. Electrostatic separation. Oversize screening (300 µm, 355 µm, or 425 µm). Rare Earth Drum and Roll Magnetic Separation. This flowsheet was applied consistently across all DFS variability samples, ensuring comparability with previous testwork and supporting robust metallurgical modelling. The proposed processes are conventional for the production of Rutile product concentrate and utilises commercially established processes. Bench-scale and pilot-scale testwork conducted throughout the PFS and DFS phase has been sufficient to validate the metallurgical design and performance projections for the rutile circuit. The rutile produced during these campaigns meets the required grade specifications for marketable product (see Table below).
The summarised testwork results indicates some variability in feed grade, recovery, and product quality across the different Kasiya pits. Bulk samples from the variability testwork program show rutile feed grades ranging from 0.80% to 1.74%, with corresponding recoveries between 87% and 99%, and rutile product grade averaging 94.8% TiO₂. The South Sparrow Mousebird sample set demonstrated a pronounced lithological dependence, where the lower lithology yielded lower recoveries and grades than the upper horizon. When composited, the overall recovery and grade stabilised at 97.6% and 94.8% TiO₂, respectively. This observation reinforces the need for a well-defined ROM blending strategy to ensure consistent feed characteristics and to optimise plant throughput, recovery, and product quality. The Scoping and PFS bulk testwork achieved consistently higher feed grades (1.05-1.48% rutile), with recoveries ranging from 96% to 99% and average product grades of 95.8% TiO₂, confirming the robustness and repeatability of the flowsheet across multiple campaigns and sample sources. Nevertheless, spatial variability in the Crow sample, which was taken near the pit boundary, warrants further investigation to support the development of a geometallurgical model for this pit. The Crow pit, representing approximately 5% of the mine plan, indicated a lower Rutile recovery of 87.4%. Overall, the metallurgical testwork confirms that the Kasiya rutile flowsheet is robust and repeatable, producing high-quality rutile and demonstrating resilience to spatial and lithological variability. These results provide a reliable basis for plant design, geometallurgical modelling, and financial evaluation. Graphite Processing Plant · Bench and pilot scale metallurgical testing for the graphite circuit was performed at ALS (Perth, Australia), Core Metallurgy (Brisbane, Australia), Maelgwyn (South Africa), and SGS (Lakefield, Canada) to develop the flowsheet and conditions for the graphite flotation circuit. · The proposed flowsheet and conditions are aligned with the design of other projects treating a similar style of mineralization. · The technologies employed in the Kasiya graphite flowsheet are well proven and have been employed in the mineral processing industry for decades. · Several bulk samples were collected from different areas of the Kasiya project and subjected to pilot plant testing. The latest pilot plant tests processed two large composite samples from 4 different pits with a total sample mass of almost 30 tonnes. The composites were generated using auger drills from many different locations within these four pits. These two bulk samples were used to optimise the flowsheet, assess technology alternatives, and generate graphite concentrate for application testing and customers' evaluation. · A variability flotation test program aimed to provide representative samples from the different pits that will be mined within the first few years of operation. The optimized flowsheet and conditions were applied to these variability samples. This approach was chosen to verify the robustness of the proposed flowsheet and conditions. · Flake size of the concentrate has been determined to ensure salability of product. |
|||||||||||||||||||||||||||||||||||||||||||||||||||||||||||||||||||||||||||||||||||||||||||||||||||||||||||||||||||
|
Environmental |
· The status of studies of potential environmental impacts of the mining and processing operation. Details of waste rock characterisation and the consideration of potential sites, status of design options considered and, where applicable, the status of approvals for process residue storage and waste dumps should be reported. |
The Project has commenced preparation of the Environmental and Social Impact Assessment (ESIA), and all supporting biological, social and biophysical specialist studies have been concluded, and have been fed into the Project design as modifying factors or assumptions. Sovereign intends to submit the ESIA to the Malawi Environmental Protection Agency for review in the second quarter of 2026. With respect to possible waste and process residue, full hydrogeological and geochemical testing has been concluded. Metals leaching is deemed a low risk, with most modelled parameters are expected to remain within local and WHO drinking water standards. Risk related to acid mine drainage has been categorized as intermediate - as while the Sulphides are below thresholds (<0.3%) there is near no neutralizing capacity. Long-term kinetic leach testing is required to verify the models; however, no specific or targeted disposal measures is currently required as the risks is not deemed to be material. The unconstrained MRE was constrained by both environmental and social no-go areas which acted as modifying factors. This allowed the determination of the constrained MRE covering the current 22 pits of 3,400 hectares. The constrained mapping reduced social impact by completely avoiding nearby communities, as well as avoiding all remanent natural habitats - barring the establishment of the Water Storage Dam. Barring the ESIA approval, there are a separate suit of approvals required on a component-by-component basis covering (1) land acquisition, (2) water extraction and water effluent discharge, (3) air and noise emissions and other applicable permits. Sovereign intends to apply for the permits post-DFS but well ahead of any FEED and FID planning. |
|||||||||||||||||||||||||||||||||||||||||||||||||||||||||||||||||||||||||||||||||||||||||||||||||||||||||||||||||||
|
Infrastructure |
· The existence of appropriate infrastructure: availability of land for plant development, power, water, transportation (particularly for bulk commodities), labour, accommodation; or the ease with which the infrastructure can be provided, or accessed. |
Kasiya is located approximately 40km northwest of Lilongwe, Malawi's capital, and boasts favourable access to services and infrastructure. The proximity to Lilongwe gives the project access to a large pool of professionals and skilled tradespeople, as well as industrial services. Logistics cost estimates, including rail and port infrastructure and handling were provided by Thelo DB, Nacala Logistics and Grindrod based on market data, suppliers' quotations, industry databases, industry contacts and the consultant's existing knowledge of southern African transport infrastructure and freight markets. The above consultants are independent with appropriate experience in the management of transport logistics studies in southern Africa. |
|||||||||||||||||||||||||||||||||||||||||||||||||||||||||||||||||||||||||||||||||||||||||||||||||||||||||||||||||||
|
Costs |
· The derivation of, or assumptions made, regarding projected capital costs in the study. · The methodology used to estimate operating costs. · Allowances made for the content of deleterious elements. · The source of exchange rates used in the study. · Derivation of transportation charges. · The basis for forecasting or source of treatment and refining charges, penalties for failure to meet specification, etc. · The allowances made for royalties payable, both Government and private. |
· The capital expenditure of the project is broken down as follows (summarised by Capital Cost Type):
· The method of estimation includes a combination of the following key methods: o Detailed-and Feasibility-level Engineering design o Material take-off done from first principles o Competitive bidding processes from Vendors o Benchmarking against comparable mining operations · Contingency estimation by means of Quantitative Risk Assessment · Sustaining Capital was estimated similarly i.e., through first principles, and priced by means of competitive bidding processes. · The Capex estimate is expressed in USD, with the base date being Q4 2025. All bids received are valid until this date, therefore the estimate is expressed in real terms with limited escalation exposure. · Standardised exchange rates were used exclusively to convert foreign currencies to the base currency. These foreign exchange rates were produced by the Sovereign Advisory financial department. The forward-escalation due to foreign currency fluctuation is covered in the DCF. |
|||||||||||||||||||||||||||||||||||||||||||||||||||||||||||||||||||||||||||||||||||||||||||||||||||||||||||||||||||
|
Revenue factors |
· The derivation of, or assumptions made regarding revenue factors including head grade, metal or commodity price(s) exchange rates, transportation and treatment charges, penalties, net smelter returns, etc. · The derivation of assumptions made of metal or commodity price(s), for the principal metals, minerals and co-products. |
· A life-of-mine production schedule was derived from the pit shells selected and the Mineral Resource model. The production schedule was used to generate monthly estimates of the mined tonnes and feed grade. · The Rutile price used for Ore Reserve declaration is US$1,490/t and the Graphite price is US$1,290/t. · All cost inputs are based on tenders, quote estimates or calculated from first principal. |
|||||||||||||||||||||||||||||||||||||||||||||||||||||||||||||||||||||||||||||||||||||||||||||||||||||||||||||||||||
|
Market assessment |
· The demand, supply and stock situation for the particular commodity, consumption trends and factors likely to affect supply and demand into the future. · A customer and competitor analysis along with the identification of likely market windows for the product. · Price and volume forecasts and the basis for these forecasts. · For industrial minerals the customer specification, testing and acceptance requirements prior to a supply contract. |
Sovereign obtained independent market assessments for both products.
Rutile: Sovereign engaged market leading TZMI to provide a bespoke marketing report to support the Study. TZMI is a global, independent consulting and publishing company which specialises in technical, strategic and commercial analyses of the opaque (non-terminal market) mineral, chemical and metal sectors.
TZMI's assessment has confirmed that, based upon their high-level view on global demand and supply forecasts for natural rutile, and with reference to the specific attributes of Kasiya, there is a reasonable expectation that the product will be able to be sold into existing and future rutile markets. Given the premium specifications of Kasiya's natural rutile, the product is expected to be suitable for all major end-use markets including TiO2 pigment feedstock, titanium metal and welding sectors.
The rutile price adopted in the DFS is based on TZMI's real 2025 price forecast and confirmed by TZMI as part of the DFS. Using the above product mix, the LOM average realised price for rutile is US$1,670 per tonne FOB, Nacala.
Graphite: Sovereign engaged Fastmarkets, a specialist international publisher and information provider for the global steel, non-ferrous and industrial minerals markets, to prepare a marketing report for graphite. Fastmarkets' assessment has confirmed that based upon their high-level view on global demand and supply forecasts for natural flake graphite, and with reference to the specific attributes of Sovereign's projects, there is a reasonable expectation that the product from Sovereign's projects will be able to be sold into existing and future graphite markets. Given the extremely low-cost profile and high-quality product, it is expected that output from Kasiya will be able to fill new demand or substitute existing lower quality / higher cost supply. Project considerations taken by Fastmarkets in forming an opinion about the marketability of product include: · Low capital costs (incremental) · Low operating costs · High quality concentrate specifications Industry participants confirm that the highest value graphite concentrates remain the large, jumbo and super-jumbo flake fractions, primarily used in industrial applications such as refractories, foundries and expandable products. These sectors currently make up the significant majority of total global natural flake graphite market by value. Fastmarkets have formed their opinion based solely upon project information provided by Sovereign to Fastmarkets and have not conducted any independent analysis or due diligence on the information provided. Graphite pricing in the DFS is based on the price forecast provided by Benchmark Minerals Intelligence (BMI), which reflects a gradual increase in prices from current observed market levels over time. Importantly, this independently derived pricing framework results in a Life-of-Mine (LoM) average graphite price of approximately US$1,288/t, which is effectively unchanged from the PFS and OPFS assumption of US$1,290/t. Pricing was constructed using FOB China benchmarks, adjusted by an FOB East Africa premium to derive FOB Nacala realised prices by size fraction. These were then weighted according to Kasiya's expected graphite size distribution to generate a representative basket price. This approach provides a more detailed and market-aligned methodology while maintaining consistency with prior study pricing assumptions. |
|||||||||||||||||||||||||||||||||||||||||||||||||||||||||||||||||||||||||||||||||||||||||||||||||||||||||||||||||||
|
Economic |
· The inputs to the economic analysis to produce the net present value (NPV) in the study, the source and confidence of these economic inputs including estimated inflation, discount rate, etc. · NPV ranges and sensitivity to variations in the significant assumptions and inputs. |
The economic analysis for the Project is based on the discounted cashflow (DCF) methodology, consistent with the advanced development status of the Project and the availability of Feasibility-level engineering data. The financial model develops real, pre- and post-tax, unlevered free cash flow forecasts, which are discounted at a project-specific discount rate to derive the Project's Net Present Value (NPV). Life of Mine (LoM) cashflows are derived from the Ore Reserve only and do not include any inferred mineral resources. The investment evaluation is 100% equity-based, with no consideration for the impact of shareholding or debt on the Project's returns. Discount Rate: The Project's discount rate of 8% (US$ real) was provided by the Issuer and is based on the Issuer's corporate investment standards. The discount rate is considered appropriate compared to other similar late-stage development studies completed recently on Greenfields rutile and graphite projects in Africa. Production: Gross revenue is driven exclusively by the sale of natural rutile with a 95% TiO2 grade, and natural flake graphite concentrate with a 95.5% TGC grade. The mine plan, stockpiling strategy, and blending strategy produces a monthly head feed profile with accompanying ore tonnes and ore grades which are incorporated in the financial model as an input. The head feed profile is driven by the available plant feed capacity in Stage 1 (12Mtpa) and Stage 2 (24 Mtpa) respectively. The South and North plants ramp up to nameplate feed capacity over a period of 10 months and 7 months respectively. Recovery: Rutile recovery (% RUT95), is kept constant over the LoM at 97.6%, whereas the graphite recovery (% TGC), is gradually increased from 68.9% TGC in the first 2 years, to 69.4% in Year 3, 69.9% in Year 4, and 70.4% from year 5 onwards. Gross Revenue: Sales prices are stated on a free-on-board Nacala basis for both rutile and graphite (refer above). Rutile revenue is segmented into standard and premium market segments based on the concentrate analysis performed by TZMI. A 25% premium applies to sales into the premium market segment. Graphite revenue is based on the mesh size distribution of the graphite concentrate, which defines the yield to fine flake (-100mm), medium flake (+100mm), large flake (+80mm), jumbo flake (+50mm), and super jumbo flake (+32mm). The weighted average basket price is derived from the mesh size distribution based on prices obtained from BMI and applied to the concentrate production profile. Capital Expenditure: A Class 3 capital budget estimate with a target accuracy range of +/-10% as defined in terms of the Association for the Advancement of Cost Engineering International (AACEi) was developed for the Project. The CBE was structured according to an approved work breakdown structure and cash flowed in line with the Project's execution schedule. A WBS level 1 summary of the Initial, Expansion, and Sustaining Capex is provided in the table below.
Operating Expenditure: A detailed operating cost estimate was prepared in line with AUSIMM guidelines for Class 3 Feasibility Studies with an accuracy range of +/-10% at an 80% confidence level. A significant proportion of the costs were derived from detailed first-principle calculations, supported by a combination of actual in-country costs and vendor pricing. A summary of the total operating unit cost for Stage 1, Stage 2, and the LoM is provided below.
All pre-production operating costs have been capitalised and are reported as part of the Project's Initial Project Capex estimate. No corporate allocated charges have been levied to the Project and the Opex estimate excludes any provisions for contingency. Rehabilitation and Closure Costs: Ongoing rehabilitation and final closure costs are included in the Opex estimate and reported under Rehabilitation. The final closure cost is modelled as a closure guarantee facility, where an upfront payment is made to secure the guarantee and the balance of the closure liability is financed over the LoM. Selling Expenses: off-site costs for the transport of products to Nacala, as well as all port-related fees, are included in the operating cost estimate based on quoted contracted rates received. Mineral Royalties and Other Regulatory Fees: Mineral royalties on rutile and graphite sales are included at 5% ad valorem. Mandatory community development costs are included at 0.45% of gross revenue. Inflation: The capital and operating cost inputs adopted in the economic analysis are expected to remain fixed in real US$ terms throughout the life of the Project, reflecting constant purchasing power assumptions at the Feasibility Study effective date. Investment Evaluation Results: The Project generates a value accretive business case with pre-tax NPV8% Real and pre-tax IRR of US$2,204 million and 23.4% respectively. A deterministic sensitivity analysis was performed illustrating the pre-tax NPV movement resulting from discrete movements in key input parameters such as sales prices, discount rate, Capex and Opex. The Project remains NPV-positive over these observed sensitivity ranges evaluated.
Corporate Tax: The fiscal regime applicable to mining companies in Malawi is uncertain. Companies have recently entered into mine development agreements (MDAs) with the Malawian Government which provide stability through the fixing of certain fiscal terms but critically deviate from the enacted legislation. Since the terms of these MDAs remain uncertain, the Issuer has elected to report the economic analysis results on a pre-tax basis The assessment of post-tax results provided below is subject to finalization of these fiscal terms with Government and should be treated as conceptual at this stage. The post-tax results below are based on the fiscal assumptions: • Corporate Tax Rate: 30% • Resource Rent Tax: Not Applicable • Super Profit Tax: All profits above MWK 10 billion taxed at an additional 10% • Capital Allowances: Mining Capex is 100% deductible in the year of spend, with unredeemed capital allowances carried forward indefinitely. • Tax Payment Periodicity: Quarterly in advance.
|
|||||||||||||||||||||||||||||||||||||||||||||||||||||||||||||||||||||||||||||||||||||||||||||||||||||||||||||||||||
|
Social |
· The status of agreements with key stakeholders and matters leading to social licence to operate. |
· ESIA commenced and all baseline and specialist studies concluded to inform the DFS (Refer to Chapter 19). ESIA Report to be submitted to the Malawi Environmental Protection Authority in early 2026 for authorisation. · Full suite of social management plans prepared in support of the DFS (Refer to Chapter 19). Community Development Agreements (CDAs) as required under Malawi mining law, currently under negotiation with 13 traditional authorities, and expected to be concluded before construction. |
|||||||||||||||||||||||||||||||||||||||||||||||||||||||||||||||||||||||||||||||||||||||||||||||||||||||||||||||||||
|
Other |
· To the extent relevant, the impact of the following on the project and/or on the estimation and classification of the Ore Reserves: · Any identified material naturally occurring risks. · The status of material legal agreements and marketing arrangements. · The status of governmental agreements and approvals critical to the viability of the project, such as mineral tenement status, and government and statutory approvals. There must be reasonable grounds to expect that all necessary Government approvals will be received within the timeframes anticipated in the Pre-Feasibility or Feasibility study. Highlight and discuss the materiality of any unresolved matter that is dependent on a third party on which extraction of the reserve is contingent. |
· There are no identified naturally occurring risks associated with the Project. · The Project is wholly owned by Sovereign Metals Limited. Marketing discussions are ongoing and non-binding memoranda of understanding have been executed with potential customers. Binding sales agreements are expected to be established prior to project development. · Sovereign is yet to apply for a Mining Licence ("ML") covering the footprint of the project, however it is not anticipated for there to be any objections in obtaining the necessary government approvals. |
|||||||||||||||||||||||||||||||||||||||||||||||||||||||||||||||||||||||||||||||||||||||||||||||||||||||||||||||||||
|
Classification |
· The basis for the classification of the Ore Reserves into varying confidence categories. · Whether the result appropriately reflects the Competent Person's view of the deposit. · The proportion of Probable Ore Reserves that have been derived from Measured Mineral Resources (if any). |
· All Ore Reserves are reported and constraint within the pit shells generated from the pit optimisation process. · The Ore Reserve is classified in accordance with the guidelines of the Australian Code for Reporting of Exploration Results, Mineral Resources and Ore Reserves (JORC 2012 Edition). · Only Proven and Probable Ore Reserves were converted from Measured and Indicated Mineral Resources respectively. · The Ore Reserves are included within the declared Mineral Resources. · The Ore Reserves have been completed to a Feasibility level of accuracy. · Inferred Mineral Resource material has not been included in the pit optimisation or in the Ore Reserves estimation. · The CP considers this appropriate for the Kasiya Ore Reserve Estimation |
|||||||||||||||||||||||||||||||||||||||||||||||||||||||||||||||||||||||||||||||||||||||||||||||||||||||||||||||||||
|
Audits or reviews |
· The results of any audits or reviews of Ore Reserve estimates. |
· No external audits or reviews of the Ore Reserve has been completed |
|||||||||||||||||||||||||||||||||||||||||||||||||||||||||||||||||||||||||||||||||||||||||||||||||||||||||||||||||||
|
Discussion of relative accuracy/ confidence |
· Where appropriate a statement of the relative accuracy and confidence level in the Ore Reserve estimate using an approach or procedure deemed appropriate by the Competent Person. For example, the application of statistical or geostatistical procedures to quantify the relative accuracy of the reserve within stated confidence limits, or, if such an approach is not deemed appropriate, a qualitative discussion of the factors which could affect the relative accuracy and confidence of the estimate. · The statement should specify whether it relates to global or local estimates, and, if local, state the relevant tonnages, which should be relevant to technical and economic evaluation. Documentation should include assumptions made and the procedures used. · Accuracy and confidence discussions should extend to specific discussions of any applied Modifying Factors that may have a material impact on Ore Reserve viability, or for which there are remaining areas of uncertainty at the current study stage. · It is recognised that this may not be possible or appropriate in all circumstances. These statements of relative accuracy and confidence of the estimate should be compared with production data, where available. |
· The Ore Reserve has been completed to feasibility level with the data being generated from a tightly spaced drilling grid, thus confidence in the resultant figures is considered high. |
|||||||||||||||||||||||||||||||||||||||||||||||||||||||||||||||||||||||||||||||||||||||||||||||||||||||||||||||||||
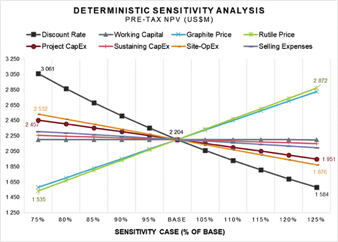
APPENDIX 2 - NATURAL RUTILE RESOURCE INFORMATION (Figure 1)
|
Ref |
Company |
Project |
Stage of Develop-ment |
Source |
|
1 |
Iluka Resources |
Wimmera |
DFS |
Ore Reserves and Mineral Resources statement 2025 https://www.iluka.com/media/ntnd53oo/iluka-resources-ore-reserves-and-mineral-resources-as-at-31-december-2024.pdf |
|
2 |
Leonoil (ex.Sierra Rutile) |
Sembehun |
DFS |
2023 Annual Report https://sierra-rutile.com/media/52zon0go/sierra-rutile- 2023-annual-report.pdf |
|
3 |
Kenmare Resources |
Moma (Various) |
Production |
2024 Annual Report https://wp-kenmare-2024.s3.eu-west-2.amazonaws.com/media/2025/04/2025-04-14-Kenmare-2024-Annual-Report.pdf#page=35 |
|
4 |
VHM |
Goschen |
DFS / Permitted |
Corporate Presentation (26 Mar 2026) https://wcsecure.weblink.com.au/pdf/VHM/03072246.pdf |
|
5 |
Leonoil (ex.Sierra Rutile) |
Area 1 |
Production |
2023 Annual Report https://sierra-rutile.com/media/52zon0go/sierra-rutile- 2023-annual-report.pdf |
|
6 |
Iluka Resources |
Balranald |
Construction |
Ore Reserves and Mineral Resources statement 2025 https://www.iluka.com/media/ntnd53oo/iluka-resources-ore-reserves-and-mineral-resources-as-at-31-december-2024.pdf |
|
7 |
Iluka Resources |
Eneabba |
Construction |
Ore Reserves and Mineral Resources statement 2025 https://www.iluka.com/media/ntnd53oo/iluka-resources-ore-reserves-and-mineral-resources-as-at-31-december-2024.pdf |
|
8 |
Image Resources |
McCalls |
Resource |
Corporate Presentation 30 May 2025 https://app.sharelinktechnologies.com/announcement-preview/asx/5953be32f215f379c7d1903671e85994 |
|
9 |
Iluka Resources |
Euston |
Resource |
Ore Reserves and Mineral Resources statement 2025 https://www.iluka.com/media/ntnd53oo/iluka-resources-ore-reserves-and-mineral-resources-as-at-31-december-2024.pdf |
|
10 |
Energy Fuels |
Toliara |
DFS |
NI 43-101 and S-K 1300 Feasibility Study https://www.energyfuels.com/wp-content/uploads/2026/01/FS-Vara-Mada-Project-Report-NI43-101-FINAL-01.07.2026.pdf |
|
11 |
MRG Metals |
Koko Massava |
Resource |
2023 Annual Report https://wcsecure.weblink.com.au/pdf/MRQ/02717754.pdf |
|
12 |
Iluka Resources |
Cataby |
Production |
Ore Reserves and Mineral Resources statement 2025 https://www.iluka.com/media/ntnd53oo/iluka-resources-ore-reserves-and-mineral-resources-as-at-31-december-2024.pdf |
|
13 |
Shenge Resources |
Tajiri |
Scoping Study |
2024 Annual Report (Strandline Resources Limited) https://clients3.weblink.com.au/pdf/STA/02860612.pdf |
|
14 |
Iluka Resources |
Ouyen |
Production |
Ore Reserves and Mineral Resources statement 2025 https://www.iluka.com/media/ntnd53oo/iluka-resources-ore-reserves-and-mineral-resources-as-at-31-december-2024.pdf |
Notes: Does not include any projects where rutile is not reported separately within HMC assemblage.
1. Wimmera
|
|
Mt |
Rutile Grade |
Contained Rutile |
|
Measured |
246 |
0.31% |
0.8 |
|
Indicated |
535 |
0.29% |
1.5 |
|
Inferred |
1,327 |
0.38% |
3.1 |
|
Total |
2,108 |
0.28% |
5.8 |
2. Sembehun
|
|
Mt |
Rutile Grade |
Contained Rutile |
|
Measured |
133.77 |
1.38% |
1.85 |
|
Indicated |
166.82 |
1.05% |
1.75 |
|
Inferred |
207.20 |
0.93% |
1.93 |
|
Total |
507.79 |
1.09% |
5.53 |
3. Moma
|
|
Mt |
Rutile Grade |
Contained Rutile |
|
Reserves not included in Resources |
1,420 |
0.05% |
0.8 |
|
Measured |
363 |
0.06% |
0.2 |
|
Indicated |
2,879 |
0.05% |
1.4 |
|
Inferred |
4,296 |
0.04% |
1.8 |
|
Total |
8,958 |
0.05% |
4.3 |
4. Goschen
|
|
Mt |
Rutile Grade |
Contained Rutile |
|
Measured |
25 |
0.5% |
0.1 |
|
Indicated |
360 |
0.3% |
1.2 |
|
Inferred |
500 |
0.3% |
1.6 |
|
Total |
890 |
0.3% |
2.8 |
5. Area 1
|
|
Mt |
Rutile Grade |
Contained Rutile |
|
Measured |
41.85 |
0.99% |
0.41 |
|
Indicated |
103.53 |
0.91% |
0.94 |
|
Inferred |
123.32 |
0.71% |
0.88 |
|
Total |
268.7 |
0.83% |
2.23 |
6. Balranald
|
|
Mt |
Rutile Grade |
Contained Rutile |
|
Measured |
6 |
5.7% |
0.3 |
|
Indicated |
35 |
3.8% |
1.3 |
|
Inferred |
13 |
3.0% |
0.4 |
|
Total |
54 |
3.7% |
2.0 |
7. Eneabba
|
|
Mt |
Rutile Grade |
Contained Rutile |
|
Measured |
249 |
0.4% |
0.9 |
|
Indicated |
177 |
0.4% |
0.7 |
|
Inferred |
93 |
0.4% |
0.3 |
|
Total |
518 |
0.4% |
1.9 |
8. McCalls
|
|
Mt |
Rutile Grade |
Contained Rutile |
|
Measured |
- |
- |
- |
|
Indicated |
1,630 |
0.05% |
0.8 |
|
Inferred |
1,980 |
0.05% |
0.9 |
|
Total |
3,610 |
0.05% |
1.7 |
9. Euston
|
|
Mt |
Rutile Grade |
Contained Rutile |
|
Measured |
- |
- |
- |
|
Indicated |
34 |
3.5% |
1.2 |
|
Inferred |
14 |
1.7% |
0.2 |
|
Total |
48 |
3.1% |
1.5 |
10. Toliara
|
|
Mt |
Rutile Grade |
Contained Rutile |
|
Measured |
597 |
0.06% |
0.4 |
|
Indicated |
793 |
0.04% |
0.3 |
|
Inferred |
1,390 |
0.03% |
0.4 |
|
Total |
1,190 |
0.03% |
1.1 |
11. Koko Massava
|
|
Mt |
Rutile Grade |
Contained Rutile |
|
Measured |
- |
- |
- |
|
Indicated |
557 |
0.05% |
0.3 |
|
Inferred |
977 |
0.05% |
0.5 |
|
Total |
1,531 |
0.05% |
0.8 |
12. Cataby
|
|
Mt |
Rutile Grade |
Contained Rutile |
|
Measured |
105 |
0.2% |
0.2 |
|
Indicated |
63 |
0.1% |
0.1 |
|
Inferred |
65 |
0.1% |
0.1 |
|
Total |
233 |
0.3% |
0.7 |
13. Tajiri
|
|
Mt |
Rutile Grade |
Contained Rutile |
|
Measured |
74 |
0.2% |
0.1 |
|
Indicated |
165 |
0.2% |
0.4 |
|
Inferred |
29 |
0.2% |
0.1 |
|
Total |
268 |
0.2% |
0.6 |
14. Ouyen
|
|
Mt |
Rutile Grade |
Contained Rutile |
|
Measured |
- |
- |
- |
|
Indicated |
10 |
1.9% |
0.2 |
|
Inferred |
24 |
1.5% |
0.4 |
|
Total |
34 |
1.6% |
0.5 |
Note:
Where not disclosed separately, rutile grades have been calculated as HM% multiplied by rutile % of assemblage.
APPENDIX 3 - FLAKE GRAPHITE RESOURCE INFORMATION (Figure 3)
|
Company |
Project |
Stage of Development |
Steady State Production tpa |
C1 Cash Costs US$/t |
Notes |
Source |
|
|
NGX |
Malingunde |
PFS Complete |
52000 |
396 |
- |
Company Presentation: Clean Energy Minerals in Africa (August 2024)
https://cdn-api.markitdigital.com/apiman-gateway/ASX/asx-research/1.0/file/2924-02844363-6A1222369&v=fc9bdb61fe50ea61f8225e24ce041a0e155a9400 |
|
|
Focus Graphite |
Lac Knife |
FS Complete |
47781 |
413 |
Converted from Canadian Dollars to US Dollars based on exchange rate used in source document of 1.00 CAD / 0.736 USD |
Company Announcement: NI 43-101 Technical Report - Feasibility Study Update Lac Knife Graphite Project Québec, Canada (14 April 2023)
https://focusgraphite.com/wp-content/uploads/2021/07/J5116-Focus-Lac-Knife-Tech-Rep-FSU-1.pdf |
|
|
Nouveau Monde Graphite |
Matawinie |
Construction |
105882 |
419 |
- |
Press Release: Updated Feasibility Study for the Matawinie Mine
https://nmg.com/updated-feasibility-study/ |
|
|
Syrah Resources |
Balama |
Production |
240000 |
455 |
Production based on Company guidance of 20kt per month production rate. Operating costs based on midpoint of Balama C1 cost (FOB Nacala/Pemba) medium-term guidance of US$430-480 per tonne. |
Company Presentation: Equity Raising and US Government Strategic Funding Proposals (26 March 2026)
https://www.syrahresources.com.au/investors/asx-announcements# |
|
|
Black Rock Mining |
Mahenge |
Financing post eDFS |
89000 |
466 |
Operating costs are for first 10 years therefore average production of first 10 years only shown |
Company Announcement: Black Rock Completes FEED and eDFS Update (10 October 2022)
https://blackrockmining.com.au/wp-content/uploads/BlackRockCompletesFEEDAndeDFSUpdate.pdf |
|
|
Renascor |
Siviour |
DFS Complete |
150000 |
472 |
- |
Company Announcement: Siviour Battery Anode Material Study Results (8 August 2023)
https://renascor.com.au/wp-content/uploads/2023/08/20230808-Siviour-Battery-Anode-Material-Study-Results-2588185.pdf |
|
|
South Star Battery Metals |
Santa Cruz |
Production |
25000 |
484 |
Transport costs per Benchmark minerals |
Technical Report: Updated Resources and Reserves Assessment and Pre-feasibility Study (18 March 2020)
https://www.southstarbatterymetals.com/ydihapto/2021/04/NI43-101_PFS_Santa_Cruz_Mar18_2020.pdf |
|
|
Blencowe Resources |
Orom-Cross |
PFS Complete |
97000 |
485 |
Costs are AISC |
Company Announcement: Definitive Feasibility Study Confirms Outstanding Economics for Orom-Cross Graphite Project (1 Dec 2025)
https://blencoweresourcesplc.com/2025/12/01/dfs-results-confirms-outstanding-economics/ |
|
|
NextSource Materials |
Molo |
Production |
150000 |
541 |
Figures relate to Molo expansion case. |
Company Announcement: Nextsource Materials announces robust feasibility study results for Molo Mine expansion to 150,000 tonnes per annum of Superflake® graphite concentrate (12 December 2023)
https://www.nextsourcematerials.com/nextsource-materials-announces-robust-feasibility-study-results-for-molo-mine-expansion-to-150000-tonnes-per-annum-of-superflake-graphite-concentrate/ |
|
|
Ecograf |
Epanko |
BFS Complete |
73000 |
553 |
- |
Updated Epanko BFS (25 February 2026)
https://www.ecograf.com.au/wp-content/uploads/2026/02/3029888.pdf |
|
|
Evion |
Maniry |
DFS Complete |
56400 |
658 |
Production of 56.4ktpa is from year 4. Years 1-3 production is 39ktpa |
BlackEarth Minerals Maniry Graphite Project Definitive Feasibility Study (3 November 2022)
https://cdn-api.markitdigital.com/apiman-gateway/ASX/asx-research/1.0/file/2924-02593286-6A1120357?access_token=83ff96335c2d45a094df02a206a39ff4 |
|
|
Volt Resources |
Bunyu |
Stage 1 FS Complete |
24780 |
670 |
Relates to stage 1 development which has had a feasibility study completed |
Company Announcement: Feasibility Study Update for Bunyu Graphite Project Stage 1, Tanzania, delivers significantly improved economics (14 August 2023)
https://api.investi.com.au/api/announcements/vrc/d68bb8a5-dc8.pdf |
|
|
Evolution Energy |
Chilalo |
DFS Complete |
52000 |
773 |
Operating costs are for first 9 years of production |
Company Announcement: FEED and updated DFS confirms Chilalo as a standout high margin, low Capex and development-ready graphite project (20 March 2023)
https://api.investi.com.au/api/announcements/ev1/67aa3d24-039.pdf
|
|
|
Graphite One |
Graphite Creek |
FS Complete |
175000 |
982 |
Production and costs relate to Graphite Creek Mine and not the proposed graphite manufacturing facility |
Graphite Creek Project NI 43-101 Technical Report and Feasibility Study (25 March 2025)
https://www.graphiteoneinc.com/wp-content/uploads/2025/04/NI-43101_FS_Report_20250422_Final.pdf
|
|
Notes:
Analysis does not include projects:
- without at least a PFS-level study complete;
- owned by unlisted companies or companies in administration (voluntary or otherwise);
- in care and maintenance;
- with downstream studies which do not include a breakdown of graphite concentrate C1 costs
RNS may use your IP address to confirm compliance with the terms and conditions, to analyse how you engage with the information contained in this communication, and to share such analysis on an anonymised basis with others as part of our commercial services. For further information about how RNS and the London Stock Exchange use the personal data you provide us, please see our Privacy Policy.


Latest directors dealings
- 2 minutes ago Sintana Energy Inc.
- 7 minutes ago accesso Technology Group
- 7 minutes ago Iofina
- 7 minutes ago Allergy Therapeutics
- 7 minutes ago Tinybuild Inc. (DI) (Reg s, CAT 3)