
Financial Results & Outlook: Year Ended 30.06.2026
Summary by AI BETAClose X


27 August 2026
South32 Limited
(Incorporated in Australia under the Corporations Act 2001 (Cth))
(ACN 093 732 597)
ASX / LSE / JSE Share Code: S32; ADR: SOUHY
ISIN: AU000000S320
south32.net
APPENDIX 4E AND 2026 FINANCIAL RESULTS AND OUTLOOK
South32 Limited (ASX, LSE, JSE: S32; ADR: SOUHY) (South32) provides the following Appendix 4E and Financial Results and Outlook for the year ended 30 June 2026.
The following reporting documents will be provided separately:
· Appendix 3A.1 - Notification of dividend
· Appendix 3C - Notification of buy-back
· 2026 Full Year Financial Results Presentation
· 2026 Annual Report
· 2026 Climate Related Reporting Methodology
· Appendix 4G: Key to Disclosures
South32 will hold a conference call at 8.00am Australian Western Standard Time to discuss the 2026 financial results material, the details of which are as follows:
Conference ID:
Please pre-register for this call at link. Following the conference call a recording will be available on the South32 website (https://www.south32.net/investors/presentations-speeches).
About us
Our purpose is to make a difference by developing natural resources, improving people's lives now and for generations to come. We are trusted by our owners and partners to realise the potential of their resources. We produce minerals and metals critical to the world's energy transition from operations across the Americas, Australia and Southern Africa and we are discovering and responsibly developing our next generation of mines. We aspire to leave a positive legacy and build meaningful relationships with our partners and communities to create brighter futures together.
|
Investor Relations |
Media Relations |
|
Ben Baker |
Jamie Macdonald |
Further information on South32 can be found at www.south32.net.
APPENDIX 4E
SOUTH32 LIMITED
(ABN 84 093 732 597)
Results for announcement to the market
This information is provided in accordance with the ASX Listing Rules and should be read in conjunction with South32's Annual Report for the year ended 30 June 2026.
Figures in italics indicate that an adjustment has been made since the financial information was previously reported.
|
US$M |
FY26 |
FY25 |
% Change |
|
Revenue from continuing operations(a)(b) |
5,816 |
5,780 |
1% |
|
Profit/(loss) after tax attributable to members[1] |
1,087 |
213 |
410% |
|
Other financial measures |
|||
|
Underlying revenue(a)(b) |
8,108 |
7,610 |
7% |
|
Underlying earnings attributable to members1(a)(b) |
1,032 |
666 |
55% |
(a) On 29 August 2024, South32 sold its shareholding in Illawarra Metallurgical Coal to an entity owned by Golden Energy and Resources Pte Ltd and M Resources Pty Ltd[2]. As a result, Illawarra Metallurgical Coal was classified as a discontinued operation in the FY26 and FY25 results. Our FY25 Group underlying financial measures include the financial contribution of Illawarra Metallurgical Coal prior to its sale.
(b) On 1 December 2025, South32 sold its shareholding in Cerro Matoso to an entity owned by CoreX Holding B.V[3]. As a result, Cerro Matoso was classified as a discontinued operation in the FY26 and FY25 results. Our FY26 and FY25 Group underlying financial measures include the financial contribution from Cerro Matoso prior to its sale.
Net tangible assets per share
Net tangible assets per ordinary share were US$2.12 as at 30 June 2026 (US$1.93 as at 30 June 2025)[4].
Dividends
The Board has resolved to pay a final dividend of US 5.4 cents per share (fully-franked) for the year ended 30 June 2026.
The record date for determining entitlements to dividends is 18 September 2026; payment date is 15 October 2026.
FINANCIAL RESULTS AND OUTLOOK YEAR ENDED 30 JUNE 2026
ASX / LSE / JSE Share Code: S32; ADR: SOUHY
27 August 2026
Base metals business drives strong earnings growth and shareholder returns
"Strong operating performance coupled with commodity price tailwinds underpinned one of the best financial results in our history, with Group Underlying EBITDA increasing by 28 per cent to US$2.5 billion and Underlying earnings increasing by 55 per cent to US$1 billion.
"Cannington and Sierra Gorda's operating performance enabled the Group to capture the benefit of higher prices across copper, zinc and silver, supporting increased earnings and cash flow from our base metals business.
"Group cash flow from operations increased by US$352 million to US$610 million, after investing US$711 million at Hermosa to grow our future base metals production. This enabled the Group to maintain a strong balance sheet with net cash of US$283 million, while returning US$327 million to shareholders during the year.
"Reflecting our strong financial performance and disciplined approach to capital allocation, the Board has resolved to pay a fully-franked ordinary dividend of 5.4 cents per share, or US$242 million, in respect of the June 2026 half year. The Board has also resolved to extend our capital management program to September 2027, with US$209 million remaining to be returned to shareholders.
"The sale of our aluminium value chain assets to Alcoa will simplify and strengthen our portfolio, positioning South32 as a leading base metals focused company with high-margin assets and a pipeline of compelling growth options in copper, zinc and silver.
"We are continuing to enhance our copper exposure through Sierra Gorda, which increased its Ore Reserve estimate by 61 per cent to approximately 1.1 billion tonnes following successful infill drilling programs. Sierra Gorda is expected to deliver production growth of 5 per cent in FY27 and a further 2 per cent in FY28, supported by higher planned copper grades. Beyond this, the recently sanctioned fourth grinding line project is expected to increase production by approximately 30 per cent from FY31.
"We are advancing construction of the Taylor zinc-lead-silver project at Hermosa, which is expected to deliver attractive returns from its long-life, low-cost production of zinc, silver and lead. In addition, exploration results at the adjacent Peake deposit support its potential as a future source of copper production and mine life extension within the Taylor development.
"Looking ahead, the outlook for our business is positive as we focus on safe and stable operations and growing our production of base metals into structurally attractive markets."
Matt Daley, South32 CEO
Financial Highlights
|
US$M |
FY26 |
FY25 |
% Change |
|
Revenue from continuing operations[5][6] |
5,816 |
5,780 |
1% |
|
Operating profit/(loss) from continuing operations5,6 |
1,359 |
554 |
145% |
|
Profit/(loss) after tax |
1,085 |
210 |
417% |
|
Profit/(loss) after tax attributable to members[7] |
1,087 |
213 |
410% |
|
Basic earnings/(loss) per share (US cents)[8] |
24.2 |
4.7 |
415% |
|
Ordinary dividends per share (US cents)[9] |
9.3 |
6.0 |
55% |
|
Ordinary shares on issue (million) |
4,486 |
4,504 |
(0.4%) |
|
Other financial measures[10] |
|
|
|
|
Underlying revenue |
8,108 |
7,610 |
7% |
|
Underlying EBITDA |
2,462 |
1,928 |
28% |
|
Underlying EBITDA margin |
31.0% |
26.3% |
4.7% |
|
Underlying EBIT |
1,717 |
1,211 |
42% |
|
Underlying EBIT margin |
21.7% |
16.5% |
5.2% |
|
Underlying earnings attributable to members7 |
1,032 |
666 |
55% |
|
Basic Underlying earnings per share (US cents)8 |
23.0 |
14.8 |
55% |
|
Return on invested capital (ROIC) |
13.6% |
9.0% |
4.6% |
Sale of Aluminium Value Chain Assets
On 1 July 2026, we announced a binding conditional agreement to sell our aluminium value chain assets to Alcoa Corporation (Alcoa) for an implied enterprise value of up to US$5.6B (the Transaction)[11]. Alcoa will also assume related rehabilitation provisions of approximately US$1.1B[12].
Alcoa will acquire South32's interests in Worsley Alumina (86%), Hillside Aluminium (100%), Mineração Rio do Norte (MRN) bauxite mine (33%)[13], Brazil Alumina refinery (36%) and Brazil Aluminium smelter (40%) (together, the Aluminium Value Chain Assets), under the Transaction. Mozal Aluminium is excluded from the Transaction and remains on care and maintenance, with divestment under active consideration.
The Transaction is expected to complete in H2 FY27, subject to satisfaction or waiver of conditions precedent, including South32 shareholder approval.
The Aluminium Value Chain Assets will continue to be reported in South32's Group financial results and sustainability related disclosures until Transaction completion.
Safety performance
On 14 March 2026, Mr Simon Mukwarami, a contractor at Worsley Alumina, was fatally injured while he and his work crew were undertaking a plant maintenance activity at the refinery. Our thoughts remain with Mr Mukwarami's family and colleagues. Worsley Alumina is cooperating with authorities in relation to their investigations and activities.
Nothing is more important than the health, safety and wellbeing of our people. As an organisation, we continue work to embed our 'safety guarantee', knowing that we cannot be truly successful unless everyone goes home safe and well at the end of every shift.
In FY26, lost time injury frequency (LTIF) reduced by 29% to 1.0 (FY25: 1.4) and total recordable injury frequency (TRIF) reduced by 8% to 3.4 (FY25: 3.7). Our leading indicator, significant hazard frequency, increased to 245 for FY26 (FY25: 196), indicating a sustained focus on identifying and reporting serious safety risks.
Health and safety performance[14]
|
Performance metric |
FY26 |
FY25 |
|
Fatalities from health and safety incidents |
1 |
1 |
|
Total lost time injury frequency (LTIF) |
1.0 |
1.4 |
|
Total recordable injury frequency (TRIF) |
3.4 |
3.7 |
|
Total significant hazard frequency |
245 |
196 |
People and culture
An inclusive culture and diverse workforce supports greater collaboration, innovation and performance. We continue to focus on building a workforce that represents the communities where we operate, and increasing the representation of women in leadership roles. We measure our inclusion and diversity progress through a set of measurable objectives as described in the table below.
Inclusion and diversity performance14
|
Diversity representation |
FY26 measurable objective |
FY26 |
FY25 |
|
Women in our workforce |
Achieve at least 26.1% |
26.3 |
25.6(a) |
|
Women on our Board |
Maintain at least 40% |
50.0 |
54.5 |
|
Women in Lead Team |
Maintain at least 40% |
28.6(b) |
50.0 |
|
Women in leadership roles |
Achieve at least 24.7% |
24.9 |
24.2(a) |
|
Local workforce diversity |
Achieve at least 2 of 3 targets |
2 |
3(a) |
|
Inclusion Index score |
Achieve at least 80.2% |
82.8 |
80.2(a) |
|
Group Inclusion and Diversity Action Plan |
100% delivered |
100 |
92 |
(a) FY25 outcomes have been restated to exclude Cerro Matoso (divested on 1 December 2025) and Mozal Aluminium (placed on care and maintenance on 15 March 2026). FY25 outcomes including Cerro Matoso and Mozal Aluminium: Women in our workforce was 23.1%; Women in leadership roles was 23.6%; Local workforce diversity was five of five targets; Inclusion Index score was 82.1%.
(b) Lead Team at 30 June 2026 comprised of Graham Kerr, Matthew Daley, Sandy Sibenaler, Kelly O'Rourke, Erwin Schaufler, Noel Pillay and Simon Collins. Effective 3 August 2026, Lead Team comprises of Matthew Daley, Sandy Sibenaler, Kelly O'Rourke, Simon Collins and David Palmer with an outcome of 40%.
Addressing climate change
Our operational greenhouse gas (GHG) emissions were largely unchanged at 20.5Mt CO2-e in FY26, as the sale of Cerro Matoso in December 2025 and transition of Mozal Aluminium to care and maintenance in March 2026, more than offset increased reliance on coal-fired electricity at Mozal Aluminium prior to care and maintenance due to reduced hydroelectric power supply following drought conditions in Mozambique.
Our Scope 3 GHG emissions increased by 22% to 28.6Mt CO2-e in FY26, reflecting an increase in processing of sold products as Australia Manganese recommenced operations following the impacts of Tropical Cyclone Megan in the prior period.
As a result of the Transaction, we will review our climate change targets and goals[15] during FY27 given the significant reduction in portfolio GHG emissions, with Aluminium Value Chain Assets and Mozal Aluminium contributing approximately 95% of our operational GHG emissions in FY26.
Greenhouse gas emissions
|
Million tonnes of CO2 equivalent |
FY26 |
FY25 |
|
Operational GHG emissions |
20.5 |
20.7 |
|
Scope 3 GHG emissions |
28.6 |
23.5[16] |
Business performance
Base metals
Sierra Gorda
Sierra Gorda payable copper equivalent production[17] decreased by 3% (or 2.6kt) to 87.1kt in FY26, but exceeded guidance, as strong by-product volumes more than offset weather-related impacts in H2 FY26.
Payable copper equivalent production17 is expected to increase by 5% to 91.8kt in FY27 and a further 2% to 94.0kt in FY28, supported by higher planned copper grades in the next phase of the mine plan.
Underlying EBITDA increased by US$276M to US$758M in FY26, for an operating margin of 66%, due to higher realised metal prices.
On 30 June 2026, the Sierra Gorda joint venture approved execution of the fourth grinding line project[18], a high-returning plant expansion that is expected to increase copper equivalent production by approximately 30% from FY31. Capital expenditure is expected to be ~US$725M (100% basis) over FY27-FY30[19], representing a highly efficient capital intensity of ~US$21k/t CuEq[20], benefitting from existing water and power infrastructure.
During the year, Sierra Gorda progressed infill drilling programs designed to extend mine life. This work has supported a 61%[21] increase in the Ore Reserve estimate to approximately 1.1Bt (100% basis), extending Sierra Gorda's reserve life by approximately 5-years to 204521.
At the adjacent Catabela Northeast prospect, we defined an Exploration Target[22] ranging from 1.1Bt @ 0.48% TCu to 2.9Bt @ 0.45% TCu, highlighting the potential for future mine life extension. Exploration and early-stage study work to advance Catabela Northeast will continue in FY27.
On 8 June 2026, the Sierra Gorda joint venture signed a non-binding memorandum of understanding with the nearby BHP Spence mine for the purpose of identifying and evaluating opportunities for operational collaboration.
Cannington
Cannington payable zinc equivalent production[23] decreased by 12% (or 28.8kt) to 205.4kt in FY26, reflecting lower metal grades in accordance with the mine plan. This was partially offset by an 11% increase in ore processed as lower grade stockpiled material was milled.
Payable zinc equivalent production23 is expected to be 290.0kt across both FY27 and FY28 (ore processed 2,100kdmt, zinc 45.0kt, lead 80.0kt and silver 8,725koz), with the processing of lower grade stockpiled material to supplement ore mined.
Underlying EBITDA increased by US$170M to US$451M in FY26, for an operating margin of 53%, reflecting higher average realised metal prices together with lower Operating unit costs.
Cannington's underground Ore Reserve of 11Mt[24] supports a reserve life of approximately 7-years to FY33, with work continuing to unlock value from the underground Mineral Resource of approximately 44Mt. As previously announced, we expect to invest US$65M to US$80M over FY27 and FY28 in additional ventilation and electrical infrastructure to support further underground mine life extensions.
In addition, study work for the open pit development option is continuing, with a final investment decision targeted for H1 FY28.
Hermosa project
We invested US$711M[25] of growth capital expenditure at Hermosa in FY26, continuing construction of the Taylor zinc-lead-silver project (Taylor), and completing the exploration decline for the Clark battery-grade manganese deposit.
On 30 April 2026, we announced an update on the Taylor project[26]. This included an increase in Taylor's initial operating life by 5-years to ~33 years[27], first production expected in H2 FY28, and growth capital expenditure updated to US$3.3B. Based on updated assumptions, Taylor is expected to deliver steady-state EBITDA of ~US$650M[28] per annum and a net present value of ~US$3.1B[29].
Underground development and surface infrastructure construction is progressing in accordance with the Taylor project update. Lateral development and shaft station construction at the first underground mining level from the main shaft was completed in Q4 FY26, while the ventilation shaft is expected to reach the primary production level in Q1 FY27.
Work is also underway to extend the Clark decline to provide additional access to the Taylor orebody. This will enhance operational flexibility and increase ore handling capacity by approximately 25%, offering the potential to increase production above Taylor's design capacity through future plant de-bottlenecking.
On 7 July 2026, the United States Forest Service released the Final Record of Decision for Hermosa[30], completing the federal permitting process under the National Environmental Policy Act. A Notice to Proceed is on track for Q1 FY27.
We expect to invest growth capital expenditure of US$1,000M[31] in FY27 as we continue construction of Taylor, including a planned increase in surface infrastructure construction activity.
We also invested US$30M in capitalised exploration at Hermosa in FY26, including exploration drilling at the adjacent Peake copper deposit, as we test the potential for a continuous mineralised system connecting Peake and Taylor Deeps.
Ambler Metals project
The Ambler Metals joint venture (50% South32 share) approved a ~US$42M (100% basis) budget for CY26 work programs, focused on drilling and development activities for the high-grade Arctic polymetallic deposit, located in the Ambler mining district, Alaska.
On 14 May 2026, Arctic was accepted as a covered project under FAST-41[32], with the federal permitting timetable published in July 2026.
Exploration
We invested US$60M (US$44M capitalised) in exploration programs at our existing operations and development options in FY26, including US$30M at our Hermosa project (all capitalised), US$12M for our Sierra Gorda EAI (US$6M capitalised), US$5M for our manganese EAI (US$1M capitalised) and US$4M for the Ambler Metals project (all capitalised).
We also invested US$34M in greenfield exploration programs in FY26, progressing multiple exploration programs targeting base metals in highly prospective regions. This included exploration activity at our 100% owned Roosevelt prospect in the Ambler mining district, Alaska, and the Selena copper, zinc, lead, and silver project in Nevada, pursuant to an earn-in agreement with Ridgeline Minerals.
Cerro Matoso
The divestment of Cerro Matoso to a subsidiary of CoreX Holding B.V. completed on 1 December 2025[33]. Prior to completion, payable nickel production decreased by 19% to 15.0kt in H1 FY26, while Underlying EBITDA decreased by US$73M to US$11M.
Manganese
Australia Manganese
Australia Manganese production increased to 3,031kwmt in FY26, as operations resumed following the impacts of Tropical Cyclone Megan in the prior period. Notwithstanding, production was below plan, as the operation managed elevated site water levels resulting from ongoing groundwater inflows and significant wet season impacts.
Production guidance for FY27 and FY28 is set at 2,650kwmt to 2,900kwmt, reflecting constrained mine pit access due to elevated water volumes. FY28 production guidance is subject to receipt of required approvals for additional water management infrastructure, and its subsequent installation during the next dry season. We expect to invest approximately US$70M in additional water infrastructure across FY27 and FY28, subject to regulatory approvals.
Underlying EBITDA increased to US$229M in FY26, with sales volumes increasing to 3,598kwmt, following the restart of operations and commissioning of new wharf infrastructure in the prior period.
South Africa Manganese
South Africa Manganese production decreased by 3% to 2,085kwmt in FY26, but exceeded guidance, as the operation completed planned maintenance and additional underground development activity at Wessels. Production is expected to be 2,000kwmt across both FY27 and FY28, subject to our continued use of higher cost trucking.
Underlying EBITDA decreased by US$16M to US$30M in FY26, as higher sales volumes were more than offset by a stronger South African rand, higher trucking costs and diesel prices.
Aluminium value chain
Alumina
Alumina saleable production was largely unchanged year-on-year at 5.1Mt in FY26. Brazil Alumina operated above nameplate capacity driven by improved plant availability, while improved bauxite availability at Worsley Alumina was offset by a weather-related disruption to third-party gas supply during Q3 FY26. FY27 production guidance remains unchanged at 5.3Mt.
Underlying EBITDA decreased by US$868M to US$210M in FY26, for an operating margin of 12%, due to a 32% decrease in our average realised price of alumina.
Aluminium
Aluminium saleable production decreased by 8% to 1,109kt in FY26, as Mozal Aluminium was placed on care and maintenance in March 2026, due to the inability to secure sufficient and affordable electricity supply[34].
Hillside Aluminium saleable production was largely unchanged at 717kt in FY26, as the smelter continued to test its maximum technical capacity, despite the impact of load-shedding. Production is expected to be 720kt[35] in FY27.
Brazil Aluminium saleable production increased by 4% (or 6kt) to 144kt in FY26, with the smelter's operator implementing additional measures to improve process stability, following unplanned pot outages and energy disruptions in December 2025. Production is expected to be 140kt in FY27, as the smelter continues to stabilise operations.
Underlying EBITDA increased by US$678M to US$865M in FY26, for an operating margin of 24%, reflecting a 19% increase in our average realised price of aluminium, and lower alumina input prices at Hillside Aluminium and Brazil Aluminium.
Financial performance
Profit and Loss
The Group's profit after tax attributable to members increased by US$874M to US$1,087M in FY26, as we delivered strong operating results and captured the benefit of higher prices for many of our commodities. Underlying earnings attributable to members increased by US$366M to US$1,032M in FY26. A reconciliation of profit/(loss) to Underlying earnings attributable to members is set out in the 'Earnings analysis' section.
Underlying revenue increased by US$498M (or 7%) to US$8,108M, with strong operating performance at Cannington and Sierra Gorda enabling the Group to capitalise on higher base and precious metals prices (+US$668M). In our aluminium value chain, higher aluminium prices (+US$435M) were more than offset by lower alumina prices (-US$504M).
Underlying EBITDA increased by US$534M (or 28%) to US$2,462M, with Group operating margin increasing to 31.0% (FY25: 26.3%). This reflected higher average commodity prices and lower controllable costs (+US$58M), which more than offset uncontrollable cost pressures from stronger producer currencies (-US$159M), general inflation (-US$74M) and raw material input prices (-US$26M).
Underlying EBIT increased by US$506M (or 42%) to US$1,717M in FY26. Underlying depreciation and amortisation increased by US$28M to US$745M, with higher depreciation at Australia Manganese and Sierra Gorda, partially offset by Mozal Aluminium.
Cash Flow
Group free cash flow from operations, excluding EAIs, was an inflow of US$107M in FY26 (FY25: US$192M inflow), which reflected higher profitability and an unwind in working capital, partially offset by an increase in growth capital expenditure at Hermosa (-US$194M) and higher income tax payments (-US$49M).
Separately, we received net distributions[36] of US$503M (FY25: US$66M) from our EAIs in FY26. This included a record US$401M from Sierra Gorda (FY25: US$176M) reflecting strong operating performance and higher metal prices, and a net distribution of US$102M from our manganese business (FY25: US$110M of funding) as external insurance recoveries related to Australia Manganese were finalised.
Group capital expenditure, excluding EAIs, exploration and intangibles, increased by US$120M to US$1,037M in FY26, as higher growth capital expenditure at Hermosa (+US$194M) was partially offset by lower sustaining capital expenditure (-US$140M) following the divestments of Illawarra Metallurgical Coal (IMC) and Cerro Matoso.
Capital expenditure for our Sierra Gorda EAI, excluding exploration and intangibles, increased by US$19M to US$235M in FY26, as the operation continued its investment in deferred stripping and tailings infrastructure.
Capital expenditure for our manganese EAI, excluding exploration and intangibles, decreased by US$54M to US$105M in FY26, as Australia Manganese executed its recovery plan in FY25, and South Africa Manganese completed work to access new mining areas at Wessels.
We returned US$327M to shareholders during FY26, including US$292M[37] in fully-franked ordinary dividends and US$35M via our on-market share buy-back[38].
Balance Sheet
Group net cash increased by US$160M to US$283M in FY26, as improved profitability and higher EAI net distributions (+US$503M), more than offset our investment in growth at Hermosa (-US$711M) and returns to shareholders (-US$327M).
Dividends and Capital Management
Consistent with our current policy to distribute a minimum 40% of Underlying earnings attributable to members as ordinary dividends, the Board has resolved to pay a fully-franked final ordinary dividend of US 5.4 cents per share (US$242M) in respect of H2 FY26, representing 41% of Underlying earnings attributable to members. This takes total dividends in respect of FY26 to 9.3 cents per share, representing a year-on-year increase of 55%.
The Board has also resolved to extend our US$2.6B capital management program by a further six months to 10 September 2027[39], with US$209M remaining to be returned to shareholders.
Earnings reconciliation
Consistent with our accounting policies, various items are excluded from the Group's profit/(loss) to derive Underlying earnings[40]. Total adjustments to derive FY26 Underlying EBIT (+US$332M), shown in the table below, include:
|
− |
Significant items (+US$122M): recognition of costs related to Mozal Aluminium's transition to care and maintenance[41], including employee separation costs and termination of contractual arrangements (+US$33M), and the non-cash write-down of raw materials and consumables and work in progress inventories (+US$89M); |
|
− |
Joint venture adjustments[42] (+US$613M): to reconcile the equity accounting position to a proportional consolidation basis for our manganese and Sierra Gorda EAIs; |
|
− |
Gain on the disposal of subsidiaries (-US$16M): recognition of a gain on disposal from finalisation of the upfront consideration for the sale of IMC (-US$19M) and loss on disposal of Cerro Matoso (+US$3M); |
|
− |
Impairment reversal of financial assets (-US$249M): periodic revaluation of the shareholder loan receivable from Sierra Gorda reflecting higher copper prices and other macroeconomic assumptions. An offsetting amount is recorded in the Sierra Gorda joint venture adjustments noted above; and |
|
− |
Gain on non-trading derivative instruments and contingent consideration measured at fair value through profit and loss (-US$146M): revaluation of the contingent consideration receivable[43] from the sale of IMC reflecting higher metallurgical coal prices (-US$93M) and determination that no contingent consideration is payable[44] in relation to our acquisition of Sierra Gorda (-US$55M). |
Further information on these adjustments is included in Note 4 Segment information to the financial statements in South32's Annual Report for the year ended 30 June 2026.
Profit/(loss) to Underlying EBITDA reconciliation
|
US$M |
FY26 |
FY25 |
|
Operating profit/(loss) from continuing operations |
1,359 |
554 |
|
Operating profit/(loss) from discontinued operations |
26 |
(61) |
|
Adjustments to derive Underlying EBIT: |
|
|
|
Significant items |
122 |
(71) |
|
Joint venture adjustments42 |
613 |
122 |
|
(Gains)/losses on the disposal of subsidiaries |
(16) |
47 |
|
Exchange rate (gains)/losses on restatement of monetary items |
8 |
8 |
|
Impairment losses/(reversals) of financial assets |
(249) |
27 |
|
Impairment losses/(reversals) of non-financial assets |
- |
464 |
|
(Gains)/losses on non-trading derivative instruments and contingent consideration measured at fair value through profit and loss |
(146) |
121 |
|
Total adjustments to derive Underlying EBIT |
332 |
718 |
|
Underlying EBIT |
1,717 |
1,211 |
|
Underlying depreciation and amortisation |
745 |
717 |
|
Underlying EBITDA |
2,462 |
1,928 |
Profit/(loss) to Underlying earnings attributable to members reconciliation
|
US$M |
FY26 |
FY25 |
|
Profit/(loss) after tax attributable to members |
1,087 |
213 |
|
Total adjustments to derive Underlying EBIT |
332 |
718 |
|
Total adjustments to derive Underlying net finance costs |
(180) |
(237) |
|
Total adjustments to derive Underlying income and royalty related tax expense |
(207) |
(28) |
|
Underlying earnings attributable to members |
1,032 |
666 |
Earnings analysis
The following key factors influenced Underlying EBIT in FY26, relative to FY25.
Reconciliation of movements in Underlying EBIT (US$M)[45][46]
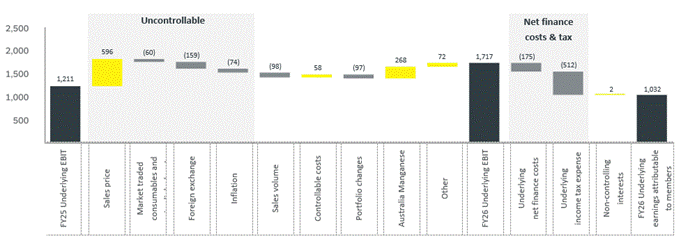
|
Earnings analysis |
US$M |
Commentary |
|
FY25 Underlying EBIT |
1,211 |
|
|
Change in sales price |
596 |
Higher average realised prices for our commodities, including: Silver (+US$331M) Copper (+US$314M) Zinc and Lead (+US$23M) Aluminium (+US$435M), offset by lower average realised prices for alumina (-US$504M) |
|
Net impact of price-linked costs |
(60) |
Higher aluminium smelter raw material input prices, primarily coke (-US$26M) Higher price-linked royalties at Cannington (-US$10M) Higher diesel prices (-US$7M) |
|
Change in exchange rates |
(159) |
Stronger South African rand (-US$75M), Australian dollar (-US$46M), Brazilian real (-US$31M) and Chilean peso (-US$7M) |
|
Change in inflation |
(74) |
General inflation across South America (-US$27M), Australia (-US$24M), and South Africa (-US$15M) Inflation-linked indexation of electricity prices at Hillside Aluminium (-US$8M) |
|
Change in sales volume |
(98) |
Lower planned volumes at Cannington (-US$131M), and Hillside Aluminium (-US$118M) reflecting the timing of shipments Partially offset by increased volumes to third party customers from Worsley Alumina (+US$119M) as sales were redirected from Mozal Aluminium, along with higher volumes at Brazil Alumina (+US$24M) and Brazil Aluminium (+US$16M) |
|
Controllable costs |
58 |
Inventory and volume related movements (+US$28M) primarily at Cannington and Hillside Aluminium, reflecting lower sales volumes for the period Lower contractor and maintenance costs (+US$37M), primarily at Worsley Alumina, Brazil Alumina and Brazil Aluminium Lower caustic soda consumption at Worsley Alumina (+US$16M) primarily due to improved bauxite quality Partially offset by a one-off workforce payment at Sierra Gorda (-US$27M), following finalisation of new three-year industrial agreements |
|
Portfolio changes |
(97) |
Reflects divestments of IMC (-US$50M) and Cerro Matoso (-US$47M) |
|
Australia Manganese |
268 |
Restart of operations at Australia Manganese following the impacts of Tropical Cyclone Megan |
|
Other |
72 |
Higher EBIT from Mozal Aluminium (+US$127M) prior to care and maintenance Higher royalty income (+US$8M) Higher depreciation and amortisation (-US$57M), primarily at Sierra Gorda |
|
FY26 Underlying EBIT |
1,717 |
|
Net finance income/(costs)
The Group's FY26 Underlying net finance costs of US$175M primarily comprise the unwinding of the discount applied to our closure and rehabilitation provisions (US$132M), interest on lease liabilities (US$59M), largely for the multi-fuel co-generation facility at Worsley Alumina, and interest on our US$700M of senior unsecured notes (US$31M).
Underlying net finance income/(costs) reconciliation
|
US$M |
FY26 |
FY25 |
|
Unwind of discount applied to closure and rehabilitation provisions |
(132) |
(136) |
|
Interest on lease liabilities |
(59) |
(58) |
|
Interest on senior unsecured notes |
(31) |
(31) |
|
Change in discount rate on closure and rehabilitation provisions |
1 |
- |
|
Interest income on cash and cash equivalents |
67 |
66 |
|
Other |
(21) |
(29) |
|
Underlying net finance costs |
(175) |
(188) |
|
Add back earnings adjustment for exchange rate variations on net cash/(debt) |
(38) |
12 |
|
Joint venture adjustments[47] |
218 |
225 |
|
Total adjustments to derive Underlying net finance costs |
180 |
237 |
|
Remove net finance costs from discontinued operations |
3 |
16 |
|
Net finance income/(costs) |
8 |
65 |
Tax expense
The Group's Underlying income tax and royalty related taxation expense increased by US$152M to US$512M in FY26, reflecting higher profitability, for an Underlying effective tax rate (ETR) of 32.9% (FY25: 35.0%). Our Group Underlying ETR reflects the corporate tax rates[48] and royalty related taxes[49] of the jurisdictions in which we operate and our geographical earnings mix.
The Underlying ETR for our manganese business was 66.4% in FY26, including the royalty related tax49 at Australia Manganese and the derecognition of certain deferred tax assets. The Underlying ETR for our Sierra Gorda EAI was 32.3% in FY26, reflecting royalty related tax49.
Underlying income tax expense (including royalty related taxation) reconciliation
|
US$M |
FY26 |
FY25 |
|
Underlying EBIT |
1,717 |
1,211 |
|
Include: Underlying net finance costs |
(175) |
(188) |
|
Remove: Share of (profit)/loss of EAIs |
16 |
7 |
|
Underlying profit/(loss) before tax |
1,558 |
1,030 |
|
|
|
|
|
Income tax expense/(benefit) from continuing operations |
308 |
304 |
|
Income tax expense/(benefit) from discontinued operations |
(3) |
28 |
|
Tax effect of other adjustments to derive Underlying EBIT |
(31) |
5 |
|
Tax effect of other adjustments to derive Underlying net finance costs |
11 |
(3) |
|
Exchange rate variations on tax balances |
27 |
14 |
|
Significant items |
(2) |
1 |
|
Joint venture adjustments relating to income tax47 |
144 |
(3) |
|
Joint venture adjustments relating to royalty related tax47 |
58 |
14 |
|
Total adjustments to derive Underlying income tax (expense)/benefit |
207 |
28 |
|
Underlying income tax expense/(benefit) |
512 |
360 |
|
Underlying effective tax rate |
32.9% |
35.0% |
Cash flow
Group free cash flow from operations, excluding EAIs, was an inflow of US$107M in FY26 (FY25: US$192M inflow), which reflected higher profitability and an unwind in working capital, partially offset by an increase in growth capital expenditure at Hermosa (-US$194M) and higher income tax payments (-US$49M).
Working capital decreased by US$82M in FY26, reflecting the timing of receivables, and lower inventories and payables at Mozal Aluminium as the smelter transitioned to care and maintenance in March 2026.
Separately, we received net distributions[50] of US$503M (FY25: US$66M) from our EAIs in FY26. This included a record US$401M from Sierra Gorda (FY25: US$176M) reflecting strong operating performance and higher metal prices, and a net distribution of US$102M from our manganese business (FY25: US$110M net funding) as external insurance recoveries related to Australia Manganese were finalised.
Free cash flow from operations excluding EAIs
|
US$M |
FY26 |
FY25 |
|
Operating profit/(loss) from continuing and discontinued operations |
1,385 |
493 |
|
Non-cash or non-operating items |
167 |
1,029 |
|
Share of (profit)/loss from EAIs |
(89) |
(99) |
|
(Gain)/loss from sale of operations |
(16) |
47 |
|
Change in working capital |
82 |
(37) |
|
Cash generated from operations |
1,529 |
1,433 |
|
Total capital expenditure, excluding EAIs |
(1,094) |
(963) |
|
Operating cash flows generated from operations after capital expenditure |
435 |
470 |
|
Net interest paid[51] |
(43) |
(42) |
|
Income tax paid |
(285) |
(236) |
|
Free cash flow from operations |
107 |
192 |
Working capital movement
|
US$M |
FY26 |
Commentary |
|
Trade and other receivables |
93 |
Collection of receivables, partially offset by higher commodity prices |
|
Inventories |
42 |
Predominantly lower inventories at Mozal Aluminium |
|
Trade and other payables |
(89) |
Mozal Aluminium transitioned to care and maintenance |
|
Provisions and other liabilities |
36 |
|
|
Total working capital movement |
82 |
|
Capital expenditure
The Group's capital expenditure[52], excluding EAIs, increased by US$131M to US$1,094M in FY26, largely reflecting higher growth capital expenditure at Hermosa:
|
− |
Safe and reliable capital expenditure decreased by US$140M to US$213M, reflecting a reduction in sustaining capital intensity following the divestment of IMC and Cerro Matoso; |
|
− |
Improvement and life extension capital expenditure increased by US$66M to US$113M, as we advanced development of new mining areas at Worsley Alumina; |
|
− |
Growth capital expenditure increased by US$194M to US$711M[53] at Hermosa as we progressed underground development and surface infrastructure construction for the Taylor zinc-lead-silver project, and completed the exploration decline for the Clark deposit in Q2 FY26; and |
|
− |
Intangibles and capitalised exploration expenditure increased by US$11M to US$57M with the continuation of multiple exploration programs targeting base metals in highly prospective mineral belts. |
Our share of capital expenditure for our material EAIs decreased by US$43M to US$347M in FY26:
|
− |
Capital expenditure for our Sierra Gorda EAI increased by US$12M to US$241M, as the operation continued its investment in deferred stripping and tailings infrastructure; and |
|
− |
Capital expenditure for our manganese EAIs decreased by US$55M to US$106M, as Australia Manganese executed its recovery plan in FY25 and South Africa Manganese completed work to access new mining areas at Wessels. |
Capital expenditure (South32 share)52
|
US$M |
FY26 |
FY25 |
|
Safe and reliable capital expenditure |
207 |
269 |
|
Improvement and life extension capital expenditure |
111 |
44 |
|
Growth capital expenditure |
711 |
517 |
|
Intangibles and the capitalisation of exploration expenditure |
57 |
45 |
|
Discontinued operations(a) |
8 |
88 |
|
Total capital expenditure (excluding EAIs) |
1,094 |
963 |
|
EAIs capital expenditure |
347 |
390 |
|
Total capital expenditure (including EAIs) |
1,441 |
1,353 |
(a) Reflects Cerro Matoso (FY26: US$6M safe and reliable capital expenditure and US$2M improvement and life extension capital expenditure; FY25: US$27M safe and reliable capital expenditure and US$3M improvement and life extension capital expenditure), and IMC (FY26: nil; FY25: US$57M safe and reliable capital expenditure and US$1M capitalised exploration).
Balance sheet
Group net cash increased by US$160M to US$283M in FY26, as improved profitability and higher EAI net distributions (+US$503M), more than offset our investment in growth at Hermosa (-US$711M) and returns to shareholders (-US$327M).
We continue to prioritise a strong balance sheet and retain access to significant liquidity, including our undrawn US$1.4B sustainability-linked revolving credit facility, which matures in December 2028. Following announcement of the Transaction, our BBB+/Baa1 credit ratings were placed under review by S&P Global Ratings and Moody's, respectively, reflecting a reduction in business scale and diversification.
Net cash
|
US$M |
FY26 |
FY25 |
|
Cash and cash equivalents |
2,134 |
1,757 |
|
Lease liabilities |
(748) |
(713) |
|
Other interest bearing liabilities |
(1,103) |
(921) |
|
Net cash(a) |
283 |
123 |
(a) FY25 net cash included US$80M classified as held for sale as part of the Cerro Matoso disposal group.
Dividends and capital management
Consistent with our current policy to distribute a minimum 40% of Underlying earnings attributable to members as ordinary dividends, the Board has resolved to pay a fully-franked final ordinary dividend of US 5.4 cents per share (US$242M) in respect of H2 FY26, representing 41% of Underlying earnings attributable to members.
The Board has also resolved to extend our US$2.6B capital management program by a further six months to 10 September 2027[54], with US$209M remaining to be returned to shareholders.
Until completion of the Transaction, earnings from the Aluminium Value Chain Assets will form part of South32's Underlying earnings and accordingly the calculation of dividends under our current policy to distribute a minimum 40% of Underlying earnings attributable to members as ordinary dividends.
Dividends announced
|
Period |
Dividend per share |
US$M |
Franking |
Pay-out ratio |
|
H1 FY24 |
0.4 |
18 |
100% |
45% |
|
H2 FY24 |
3.1 |
140 |
100% |
41% |
|
H1 FY25 |
3.4 |
154 |
100% |
41% |
|
H2 FY25 |
2.6 |
117 |
100% |
40% |
|
H1 FY26 |
3.9 |
175 |
100% |
40% |
|
H2 FY26 |
5.4 |
242 |
100% |
41% |
South32 shareholders registered on the South African branch register will not be able to dematerialise or rematerialise their shareholdings between 16 and 18 September 2026 (both dates inclusive), nor will transfers to/from the South African branch register be permitted between 11 and 18 September 2026 (both dates inclusive).
Details of the currency exchange rates applicable for the dividend will be announced to the relevant stock exchanges. Further dividend information is available on our website (www.south32.net).
South32 American Depositary Receipts (ADRs) each represent five fully paid ordinary shares in South32 and ADR holders will receive dividends accordingly, subject to the terms of the Depositary Agreement.
|
Dividend timetable |
Date |
|
Announce currency conversion into South African rand |
14 September 2026 |
|
Last day to trade cum dividend on the Johannesburg Stock Exchange (JSE) |
15 September 2026 |
|
Ex-dividend date on the JSE |
16 September 2026 |
|
Ex-dividend date on the ASX and London Stock Exchange (LSE) |
17 September 2026 |
|
Record date (including currency election date for ASX) |
18 September 2026 |
|
Payment date |
15 October 2026 |
OUTLOOK
Production
We achieved 101% of FY26 Group copper equivalent production[55] guidance, despite localised weather impacts.
Looking ahead, Sierra Gorda is expected to deliver copper equivalent production growth[56] of 5% in FY27 and a further 2% in FY28, underpinned by higher planned copper grades in the next phase of the mine plan.
At Cannington, we have increased ore processed by 20% to 2.1Mtpa in FY27, with milling of lower grade stockpiled material[57] to supplement ore mined. Payable zinc equivalent production[58] is expected to be 290.0kt over both FY27 and FY28, reflecting planned metal grades.
At Australia Manganese, production guidance for FY27 and FY28 is set at 2,650kwmt to 2,900kwmt, reflecting constrained mine pit access due to elevated water volumes. FY28 production guidance is subject to receipt of required approvals for additional water management infrastructure, and its subsequent installation during the next dry season.
FY27 production guidance for our aluminium value chain business remains unchanged. As the Transaction is expected to complete in H2 FY27, we have not provided guidance for FY28.
Production guidance (South32 share)
|
|
FY26 |
FY27e(a) |
FY28e(a) |
Key guidance assumptions |
|
Sierra Gorda (non-operated) |
|
|
|
|
|
Ore processed (Mt) |
21.0 |
21.8 |
21.8 |
Higher planned copper grades |
|
Payable copper equivalent production (kt)56 |
87.8 |
91.8 |
94.0 |
|
|
Payable copper production (kt) |
69.2 |
79.0 |
79.0 |
|
|
Payable molybdenum production (kt) |
1.9 |
0.5 |
1.0 |
|
|
Payable gold production (koz) |
18.5 |
20.0 |
20.0 |
|
|
Payable silver production (koz) |
741 |
700 |
700 |
|
|
Cannington |
|
|
|
|
|
Ore processed (kdmt) |
2,163 |
↑2,100 |
2,100 |
Processing of lower grade stockpiled material to supplement ore mined
Average metal grades in accordance with the mine plan |
|
Payable zinc equivalent production (kt)58 |
290.0 |
290.0 |
290.0 |
|
|
Payable silver production (koz) |
8,906 |
↑8,725 |
8,725 |
|
|
Payable lead production (kt) |
82.9 |
80.0 |
80.0 |
|
|
Payable zinc production (kt) |
39.2 |
↑45.0 |
45.0 |
|
|
Australia Manganese |
|
|
|
|
|
Manganese ore production (kwmt) |
3,031 |
2,650 - 2,900 |
2,650 - 2,900 |
Managing constrained pit access and progressing approvals for additional water discharge options |
|
South Africa Manganese |
|
|
|
|
|
Manganese ore production (kwmt) |
2,085 |
2,000 |
2,000 |
Subject to our continued use of higher cost trucking |
|
Worsley Alumina[59] |
|
|
|
|
|
Alumina production (kt) |
3,722 |
3,900 |
N/A |
Further improvement in bauxite supply to the refinery |
|
Brazil Alumina (non-operated)59 |
|
|
|
|
|
Alumina production (kt) |
1,411 |
1,360 |
N/A |
Expected to operate near nameplate capacity |
|
Brazil Aluminium (non-operated)59 |
|
|
|
|
|
Aluminium production (kt) |
144 |
140 |
N/A |
Continuing to stabilise operations |
|
Hillside Aluminium59,[60] |
|
|
|
|
|
Aluminium production (kt) |
717 |
720 |
N/A |
Expected to continue to test maximum technical capacity |
(a) The denotation (e) refers to an estimate or forecast year.
Costs and capital expenditure
Operating unit costs guidance
The Group's cost base was largely unchanged in FY26, as the divestment of lower returning businesses, and active cost management, which supported a US$58M reduction in controllable costs, offset uncontrollable cost pressures in raw material input prices and freight rates from the conflict in the Middle East, and stronger producer currencies.
Looking ahead, we expect a continuation of these external impacts, including generally stronger producer currencies, to influence Operating unit costs in FY27. We continue to pursue cost efficiencies to mitigate these impacts, while higher planned volumes at Sierra Gorda and processing of lower grade stockpiles at Cannington are expected to benefit Operating unit costs.
As previously announced, in connection with the Transaction, we expect to reduce the Group's functional support costs by approximately US$125M per annum, with the full benefit expected to be realised in FY29. These cost savings will be reflected in both lower Group and unallocated expenses and reduced Operating unit costs. We recently implemented the first phase of this work, streamlining senior leadership roles, accountabilities and support functions.
Operating unit cost
|
|
FY26e(a),[61] |
FY26 |
H1 FY26 |
H2 FY26 |
FY27e(a),[62] |
Key guidance assumptions |
|
Sierra Gorda (non-operated) |
|
|
|
|
|
|
|
(US$/t)(b) |
17.0 |
18.9 |
17.0 |
20.9 |
17.5 |
Higher planned volumes and lower labour costs to more than offset inflation |
|
Cannington |
|
|
|
|
|
|
|
(US$/t)(b) |
205 |
185 |
183 |
187 |
205 |
Stronger Australian dollar, general inflation, and costs to support an extended mine life |
|
Australia Manganese |
|
|
|
|
|
|
|
(US$/dmtu, FOB) |
2.40 |
2.62 |
2.31 |
2.93 |
3.15 |
Lower planned volumes, a stronger Australian dollar and general inflation |
|
South Africa Manganese |
|
|
|
|
|
|
|
(US$/dmtu, FOB) |
3.10 |
3.22 |
3.09 |
3.35 |
3.50 |
Inflation and higher in-land logistics costs |
|
Worsley Alumina |
|
|
|
|
|
|
|
(US$/t) |
310 |
313 |
318 |
308 |
320 |
Higher planned volumes and reduced caustic soda consumption, more than offset by a stronger Australian dollar, higher energy prices and inflation |
|
Brazil Alumina (non-operated) |
|
|
|
|
|
|
|
(US$/t) |
Not provided |
324 |
320 |
330 |
Not provided |
Will continue to be influenced by energy and raw material input prices |
|
Brazil Aluminium (non-operated) |
|
|
|
|
|
|
|
(US$/t) |
Not provided |
2,895 |
2,919 |
2,870 |
Not provided |
Will continue to be influenced by raw material input prices and ramp-up profile for all three potlines |
|
Hillside Aluminium |
|
|
|
|
|
|
|
(US$/t) |
Not provided |
2,298 |
2,295 |
2,301 |
Not provided |
Will continue to be influenced by raw material input prices, the South African rand and inflation-linked energy costs |
(a) The denotation (e) refers to an estimate or forecast year.
(b) US dollar per tonne of ore processed. Periodic movements in finished product inventory may impact Operating unit costs.
Capital expenditure guidance (excluding exploration and intangibles)
FY27 capital expenditure guidance for base metals and manganese, including EAIs, is expected to increase by US$395M to US$1,500M as we invest in our base metals growth projects, continuing construction of Hermosa's Taylor project and commencing Sierra Gorda's fourth grinding line expansion project:
|
− |
Safe and reliable: expected to increase by US$24M to US$395M, including deferred stripping at Sierra Gorda, and additional water infrastructure at Australia Manganese to manage elevated water volumes; |
|
− |
Improvement and life extension: expected to increase by US$82M to US$105M, with investment in Sierra Gorda's fourth grinding line project and underground infrastructure upgrades at Cannington to support an extended mine life; and |
|
− |
Growth: Hermosa capital expenditure is expected to increase by US$289M to US$1,000M[63], reflecting a planned increase in surface infrastructure construction activity. |
FY27 capital expenditure guidance for the Aluminium Value Chain Assets is expected to increase by US$28M to US$300M:
|
− |
Safe and reliable: expected to increase by US$59M to US$225M, including additional bauxite residue disposal activity and planned infrastructure upgrades at Worsley Alumina, and replacement of pot tending assemblies at Hillside Aluminium; and |
|
− |
Improvement and life extension: expected to decrease by US$31M to US$75M, as we execute the Worsley Mine Development Project, including the Nullaga mine development, at Worsley Alumina. |
Capital expenditure for base metals and manganese
|
US$M |
FY26 |
FY27e(a) |
|
Sierra Gorda |
227 |
220 |
|
Cannington |
41 |
80 |
|
Australia Manganese |
75 |
80 |
|
South Africa Manganese |
22 |
15 |
|
Cerro Matoso[64] |
6 |
- |
|
Safe and reliable capital expenditure (excluding EAIs) |
47 |
80 |
|
Safe and reliable capital expenditure (including EAIs) |
371 |
395 |
|
Sierra Gorda |
8 |
90 |
|
Cannington |
1 |
10 |
|
Australia Manganese |
3 |
5 |
|
South Africa Manganese |
5 |
- |
|
Cerro Matoso64 |
2 |
- |
|
Group & Unallocated |
4 |
- |
|
Improvement and life extension capital expenditure (excluding EAIs) |
7 |
10 |
|
Improvement and life extension capital expenditure (including EAIs) |
23 |
105 |
|
Hermosa |
711 |
1,000 |
|
Growth capital expenditure |
711 |
1,000 |
|
Total capital expenditure (excluding EAIs) |
765 |
1,090 |
|
Total capital expenditure (including EAIs) |
1,105 |
1,500 |
Capital expenditure for Aluminium Value Chain Assets
|
US$M |
FY26 |
FY27e(a) |
|
Worsley Alumina |
55 |
85 |
|
Brazil Alumina |
25 |
35 |
|
Brazil Aluminium |
15 |
15 |
|
Hillside Aluminium |
62 |
90 |
|
Mozal Aluminium (care & maintenance)[65] |
9 |
- |
|
Safe and reliable capital expenditure |
166 |
225 |
|
Worsley Alumina |
105 |
75 |
|
Hillside Aluminium |
1 |
- |
|
Improvement and life extension capital expenditure |
106 |
75 |
|
Total capital expenditure |
272 |
300 |
(a) The denotation (e) refers to an estimate or forecast year.
Capitalised exploration guidance
FY27 Group capitalised exploration guidance, including EAIs, is expected to increase by US$36M to US$80M, reflecting increased exploration drilling at Hermosa as we test regional targets in our highly prospective regional land package, and exploration and study work at Ambler Metals to progress the high-grade Arctic polymetallic deposit.
Capitalised exploration (South32 share)
|
US$M |
FY26 |
FY27e(a) |
|
Capitalised exploration (excluding EAIs) |
37 |
70 |
|
EAIs capitalised exploration |
7 |
10 |
|
Capitalised exploration (including EAIs) |
44 |
80 |
(a) The denotation (e) refers to an estimate or forecast year.
Other expenditure guidance
Other expenditure items presented below are on a proportional consolidation basis including our manganese and Sierra Gorda EAIs.
|
|
FY26 |
FY27e(a) |
Commentary |
|
Group and unallocated expense in Underlying EBIT (excluding greenfield exploration and third party products and services EBIT) |
|||
|
(US$M) |
63 |
120(b) |
FY26 reflected favourable inter-group inventory adjustments in our aluminium value chain (US$46M)
Guidance reflects current run-rate, ahead of Transaction completion |
|
Hermosa expenses included in Underlying EBIT |
|||
|
(US$M) |
46 |
45 |
Work across the broader Hermosa project |
|
Underlying depreciation and amortisation |
|||
|
(US$M) |
745 |
800(b) |
Higher depreciation at Sierra Gorda with higher deferred stripping amortisation reflective of the mine sequence |
|
Underlying net finance costs |
|
|
|
|
(US$M) |
175 |
180(b) |
Reflects current balance sheet |
|
Greenfield exploration |
|
|
|
|
(US$M) |
34 |
40 |
Exploration activity targeting base metals in highly prospective regions |
(a) The denotation (e) refers to an estimate or forecast year.
(b) Guidance reflects ownership of the Aluminium Value Chain Assets for FY27.
OPERATIONS ANALYSIS
A summary of the underlying performance of the Group's operations is presented below and a more detailed analysis is included on pages 39 to 47 in South32's Annual Report for the year ended 30 June 2026.
Operations table (South32 share)
|
|
Underlying revenue |
Underlying EBIT |
||
|
US$M |
FY26 |
FY25 |
FY26 |
FY25 |
|
Sierra Gorda |
1,154 |
832 |
561 |
318 |
|
Cannington |
852 |
659 |
364 |
204 |
|
Hermosa |
- |
- |
(46) |
(45) |
|
Australia Manganese |
675 |
42 |
143 |
(125) |
|
South Africa Manganese |
364 |
353 |
2 |
24 |
|
Worsley Alumina |
1,319 |
1,917 |
5 |
619 |
|
Brazil Alumina |
502 |
749 |
(27) |
226 |
|
Brazil Aluminium |
441 |
355 |
20 |
(97) |
|
Hillside Aluminium |
2,236 |
1,989 |
581 |
85 |
|
Mozal Aluminium (care & maintenance) |
890 |
979 |
182 |
55 |
|
Third party products and services[66] |
262 |
370 |
18 |
18 |
|
Inter-segment / Group and unallocated |
(780) |
(1,264) |
(97) |
(179) |
|
South32 Group (excluding IMC and Cerro Matoso) |
7,915 |
6,981 |
1,706 |
1,103 |
|
IMC[67] |
- |
144 |
- |
50 |
|
Cerro Matoso |
193 |
485 |
11 |
58 |
|
South32 Group |
8,108 |
7,610 |
1,717 |
1,211 |
GLOSSARY OF TERMS AND ABBREVIATIONS
ADR
American Depositary Receipts.
ASX
Australian Securities Exchange.
Cu/TCu
Copper/total copper.
CY
Calendar year.
dmtu
Dry metric tonne unit.
EAI
Equity accounted investment.
FY
Financial Year.
Goal
Goal is defined as an aspiration to deliver an outcome for which we have not identified a pathway for delivery, but for which efforts will be pursued towards achieving that outcome, subject to certain assumptions or conditions.
g/t
Grams per tonne.
JSE
Johannesburg Stock Exchange.
kdmt
Thousand dry metric tonnes.
koz
Thousand ounces.
kt
Thousand tonnes.
ktpa
Thousand tonnes per annum.
kwmt
Thousand wet metric tonnes.
lb
Pound.
Leadership roles
A Leadership Role is a position in the organisational structure flagged as the head of an organisational unit.
Local workforce diversity
Local workforce diversity is a metric consisting of equally weighted sub-performance metrics measuring local workforce diversity across the regions in which we operate. This includes Black People in the total workforce in South Africa, Black People in Management Roles in South Africa, and Aboriginal and Torres Strait Islander Peoples representation in the Australian workforce.
Lost time injury frequency (LTIF)
(The sum of lost time injuries x 1,000,000) ÷ exposure hours, for employees and contractors. This is stated in units of per million hours worked for employees and contractors. We adopt the United States Government Occupational Safety and Health Administration (OSHA) guidelines for the recording and reporting of occupational injuries and illnesses.
LSE
London Stock Exchange.
Moz
Million ounce.
Mt
Million tonne.
Mtpa
Million tonnes per annum.
MW
Megawatt.
Mwmt
Million wet metric tonne.
Operating cost
Operating cost is Underlying revenue less Underlying EBITDA excluding third party products and services.
Operating unit cost
Operating unit cost is Underlying revenue less Underlying EBITDA, excluding third party products and services, divided by sales volumes.
oz
Ounce.
Realised sales price
Realised sales price is calculated as Underlying revenue excluding third party products and services divided by sales volume.
ROIC
Return on invested capital (ROIC) is calculated as Underlying EBIT less the discount on rehabilitation provisions included in Underlying net finance costs, tax effected by the Group's Underlying effective tax rate (ETR) including our material equity accounted investments on a proportional consolidation basis, divided by the sum of fixed assets (excluding any rehabilitation assets, the impact of any impairments or impairment reversals, and unproductive capital) and inventories.
Significant hazard frequency
(The sum of significant hazards x 1,000,000) ÷ exposure hours. This is stated in units of per million hours worked for employees and contractors. A significant hazard is something that has the potential to cause harm, ill health or injury, or damage to property, plant or the environment.
South32 share
South32's ownership share of operations is presented as follows: Worsley Alumina (86% share), Brazil Alumina (36% share), Brazil Aluminium (40% share), Hillside Aluminium (100%), Mozal Aluminium (63.7% share), Sierra Gorda (45% share), Cannington (100%), Hermosa (100%), Australia Manganese (60% share) and South Africa Manganese ore (54.6% share). Prior to the divestment of Illawarra Metallurgical Coal on 29 August 2024, South32's ownership was 100%. Prior to the divestment of South Africa Manganese alloy on 3 June 2025, South32's ownership was 60%. Prior to divestment of Cerro Matoso on 1 December 2025, South32's ownership was 99.9%. Unless otherwise stated: all metrics reflect South32's share.
t
Tonne.
Target
Target is defined as an intended outcome in relation to which we have identified one or more pathways for delivery of that outcome, subject to certain assumptions or conditions.
Total recordable injury frequency (TRIF)
(The sum of recordable injuries x 1,000,000) ÷ exposure hours, for employees and contractors. This is stated in units of per million hours worked for employees and contractors. We adopt the United States Government Occupational Safety and Health Administration (OSHA) guidelines for the recording and reporting of occupational injuries and illnesses.
Underlying earnings attributable to members
Underlying earnings attributable to members is profit/(loss) after tax, net of amounts attributable to non-controlling interests and earnings adjustment items, from continuing and discontinued operations. In order to calculate Underlying earnings, the following items are adjusted as applicable each period, irrespective of materiality: Exchange rate gains/losses on restatement of monetary items; Impairment losses/reversals; Gains/losses on disposal and consolidation of interests in operations; Gains/losses on non-trading derivative instruments, contingent consideration and other investments measured at fair value through profit or loss; Major corporate restructures; Joint venture adjustments; Exchange rate variations on net cash/debt; Tax effect of earnings adjustments; and Exchange rate variations on tax balances. In addition, items that do not reflect the underlying operations of South32, and are individually, or in combination with other related earnings adjustments, significant to the financial statements, are excluded to determine Underlying earnings. When applicable, significant items are detailed in the Financial Information. Underlying earnings attributable to members is the key measure that South32 uses to assess the performance of the South32 Group, make decisions on the allocation of resources and assess senior management's performance.
Underlying EBIT
Underlying EBIT is profit/loss before net finance income/costs, tax and any earnings adjustments, including impairments, from continuing and discontinued operations. The performance of each of the South32 operations and operational management is assessed based on Underlying EBIT. In order to calculate Underlying EBIT, the following items are adjusted as applicable each period, irrespective of materiality: Exchange rate gains/losses on restatement of monetary items; Impairment losses/reversals; Gains/losses on disposal and consolidation of interests in operations; Gains/losses on non-trading derivative instruments, contingent consideration and other investments measured at fair value through profit or loss; Major corporate restructures; and Joint venture adjustments. In addition, items that do not reflect the underlying operations of South32, and are individually, or in combination with other related earnings adjustments, significant to the financial statements, are excluded to determine Underlying EBIT. When applicable, significant items are detailed in the Financial Information.
Underlying EBIT margin
Comprises Underlying EBIT excluding third party products and services EBIT, divided by Underlying revenue excluding third party products and services revenue.
Underlying EBITDA
Underlying EBITDA is Underlying EBIT before Underlying depreciation and amortisation. Underlying EBITDA per operation excludes third-party products and services EBITDA. Underlying depreciation and amortisation is adjusted for joint venture adjustments as applicable each period, irrespective of materiality. In addition, items that do not reflect the underlying operations of South32, and are individually, or in combination with other related earnings adjustments, significant to the financial statements, are excluded to determine Underlying EBITDA. When applicable, significant items are detailed in the Financial Information.
Underlying EBITDA margin (operating margin)
Comprises Underlying EBITDA, divided by Underlying revenue excluding third party products and services revenue. Also referred to as operating margin.
Underlying Effective Tax Rate (ETR)
Underlying ETR is Underlying income tax expense, including royalty related tax, divided by Underlying profit subject to tax.
Underlying revenue
Underlying revenue includes revenue from third party products and services.
US$B
US$ billion.
US$M
US$ million.
Forward-looking statements
This release contains forward-looking statements, including statements about trends in commodity prices and currency exchange rates; demand for commodities; production forecasts; plans, strategies and objectives of management; capital costs and scheduling; operating costs; anticipated productive lives of projects, mines and operations; and provisions and contingent liabilities. These forward-looking statements reflect expectations at the date of this release, however they are not guarantees or predictions of future performance. They involve known and unknown risks, uncertainties and other factors, many of which are beyond our control, and which may cause actual results to differ materially from those expressed in the statements contained in this release. Readers are cautioned not to put undue reliance on forward-looking statements. Except as required by applicable laws or regulations, the South32 Group does not undertake to publicly update or review any forward-looking statements, whether as a result of new information or future events. Past performance cannot be relied on as a guide to future performance. South32 cautions against reliance on any forward-looking statements or guidance.
Non-IFRS financial information
This release includes certain non-IFRS financial measures, including Underlying earnings, Underlying EBIT and Underlying EBITDA, Underlying revenue, Underlying net finance costs, Underlying depreciation and amortisation, Underlying operating costs, Underlying income tax expense, Underlying royalty related tax expense, Basic Underlying earnings per share, Underlying effective tax rate, Underlying EBIT margin, Underlying EBITDA margin, Free cash flow, net cash/debt, net operating assets and ROIC. These measures are used internally by management to assess the performance of our business, make decisions on the allocation of our resources and assess operational management. Non-IFRS measures have not been subject to audit or review and should not be considered as an indication of or alternative to an IFRS measure of profitability, financial performance or liquidity.
No offer of securities
Nothing in this release should be read or understood as an offer or recommendation to buy or sell South32 securities, or be treated or relied upon as a recommendation or advice by South32.
No financial or investment advice - South Africa
South32 does not provide any financial or investment 'advice' as that term is defined in the South African Financial Advisory and Intermediary Services Act, 37 of 2002, and we strongly recommend that you seek professional advice.
FURTHER INFORMATION
|
Investor relations Ben Baker E Ben.Baker@south32.net |
Media relations Jamie Macdonald E Jamie.Macdonald@south32.net |
|
Further information on South32 can be found at www.south32.net.
South32 Limited (ABN 84 093 732 597)
Registered in Australia
(Incorporated in Australia under the Corporations Act 2001)
Registered Office: Level 2, 100 St Georges Terrace
Perth Western Australia 6000 Australia
ISIN: AU000000S320
Approved for release by Matt Daley, Chief Executive Officer
JSE Sponsor: The Standard Bank of South Africa Limited
27 August 2026
[1] Members are equity holders of South32 Limited. Amounts reported as attributable to members are stated net of amounts attributable to non-controlling interests.
[2] Refer to market release "Completion of Illawarra Metallurgical Coal Sale" dated 29 August 2024.
[3] Refer to market release "Completion of Cerro Matoso Divestment" dated 1 December 2025.
[4] Net tangible assets as at 30 June 2026 includes all right-of-use assets and lease liabilities, in accordance with AASB 16 Leases.
[5] On 29 August 2024, South32 sold its shareholding in Illawarra Metallurgical Coal to an entity owned by Golden Energy and Resources Pte Ltd and M Resources Pty Ltd. As a result, Illawarra Metallurgical Coal was classified as a discontinued operation in the FY26 and FY25 results.
[6] On 1 December 2025, South32 sold its shareholding in Cerro Matoso to an entity owned by CoreX Holding B.V. As a result, Cerro Matoso was classified as a discontinued operation in the FY26 and FY25 results.
[7] Members are equity holders of South32 Limited. Amounts reported as attributable to members are stated net of amounts attributable to non-controlling interests.
[8] Basic earnings per share is calculated as profit/(loss) after tax attributable to members divided by the weighted average number of shares for the period. Basic Underlying earnings per share is calculated as Underlying earnings attributable to members divided by the weighted average number of shares for the period. The weighted average number of shares for FY26 is 4,486 million (FY25: 4,510 million).
[9] FY26 ordinary dividends per share is calculated as H1 FY26 ordinary dividend announced (US$175M) divided by the number of shares on issue at 31 December 2025 (4,486 million) plus H2 FY26 ordinary dividend announced (US$242M) divided by the number of shares on issue at 30 June 2026 (4,486 million).
[10] The underlying information reflects the Group's interest in material equity accounted joint ventures and is presented on a proportional consolidation basis. Our Group underlying financial measures reflect continuing and discontinued operations. Financial measures listed in this table and subsequently repeated throughout our Financial Results and Outlook Year Ended 30 June 2026 are defined in the Glossary of terms and abbreviations section.
[11] Refer to market release "Agreement to sell aluminium value chain assets to Alcoa for up to US$5.6B and Chief Executive Officer transition" dated 1 July 2026.
[12] Based on Group closure and rehabilitation provisions as at 30 June 2026.
[13] Subject to exercise of pre-emptive rights held by MRN's partners.
[14] Health and safety, and inclusion and diversity metrics listed on this page are defined in the Glossary of terms and abbreviations section.
[15] A target to halve our net operational greenhouse gas (GHG) emissions (Scope 1 and 2) by FY35, from FY21 levels, and a long-term goal to achieve net zero GHG emissions across all scopes (Scope 1, 2 and 3) by 2050.
[16] Reflects a correction to certain spend-based emission factors used in the emissions management system.
[17] Payable copper equivalent production (kt) was calculated by aggregating revenues from copper, molybdenum, gold and silver, and dividing the total Revenue by the price of copper. FY25 realised prices for copper (US$4.18/lb), molybdenum (US$21.12/lb), gold (US$2,877/oz) and silver (US$31.7/oz) have been used for FY25 and FY26. FY26 realised prices for copper (US$5.92/lb), molybdenum (US$25.90/lb), gold (US$4,462/oz) and silver (US$70.6/oz) have been used for FY27e and FY28e.
[18] Refer to market release "Final investment approval for Sierra Gorda's fourth grinding line" dated 1 July 2026.
[19] US dollars (real). Based on a USD:CLP exchange rate of 900. Reflects ~US$190M in FY27, ~US$290M in FY28, ~US$200M in FY29 and ~US$45M in FY30.
[20] Based on increased copper equivalent production volumes over CY31 to CY41.
[21] Compared to 30 June 2026. Information in this announcement that relates to Ore Reserve and/or Mineral Resource estimates for Sierra Gorda was declared in market release "61% increase in Sierra Gorda Ore Reserve estimate" dated 25 August 2026 and prepared by Competent Persons in accordance with the requirements of the JORC Code. South32 confirms that it is not aware of any new information or data that materially affects the information included in the original market announcement. All material assumptions and technical parameters underpinning the estimates in the relevant market announcement continue to apply and have not materially changed. South32 confirms that the form and context in which the Competent Persons' findings are presented have not been materially modified from the original market announcement.
[22] The information in this announcement that relates to the Exploration Target and Exploration Results for Catabela Northeast is extracted from "2026 Half Year Financial Results" (www.south32.net) dated 12 February 2026. The information was prepared by Competent Persons in accordance with the requirements of the JORC Code. South32 confirms that it is not aware of any new information or data that materially affects the information included in the original market announcement. South32 confirms that the form and context in which the Competent Persons' findings are presented have not been materially modified from the original market announcement.
[23] Payable zinc equivalent (kt) was calculated by aggregating revenues from payable silver, lead and zinc, and dividing the total Revenue by the price of zinc. FY25 realised prices for zinc (US$2,648/t), lead (US$1,883/t) and silver (US$31.9/oz) have been used for FY25 and FY26. FY26 realised prices for zinc (US$3,000/t), lead (US$1,944/t) and silver (US$66.4/oz) have been used for FY27e and FY28e.
[24] Information in this announcement that relates to Mineral Resources and Ore Reserve estimates for Cannington was declared as part of South32's annual Resource and Reserve declaration in the 2026 Annual Report(www.south32.net) issued on 27 August 2026 and prepared by Competent Persons in accordance with the requirements of the JORC Code. South32 confirms that it is not aware of any new information or data that materially affects the information included in the original announcement. All material assumptions and technical parameters underpinning the estimate in the relevant market announcement continue to apply and have not materially changed. South32 confirms that the form and context in which the Competent Persons' findings are presented have not been materially modified from the original market announcement.
[25] Hermosa growth capital expenditure excludes lease payments of US$53M for self generated power and other assets directly attributable to construction of infrastructure at the Taylor deposit. These self generated power and other costs were included in our capital cost estimate provided in market release "Hermosa project update" dated 30 April 2026.
[26] Refer to market release "Hermosa project update" dated 30 April 2026.
[27] The information in this announcement that refers to the Production Target and forecast financial information for the Taylor deposit is based on Proved (41Mt, 32%) and Probable (58Mt, 44%) Ore Reserves and Measured (1.1Mt, 1%), Indicated (4.2Mt, 3%), Inferred (13Mt, 10%) Mineral Resources and Exploration Target (13Mt, 10%). The Ore Reserves, Mineral Resources and Exploration Target underpinning the Production Target were declared as part of the "Hermosa Project Update" (www.south32.net) dated 30 April 2026 and have been prepared by Competent Persons and reported in accordance with the JORC Code. All material assumptions and technical parameters underpinning the estimates in the relevant market announcement continue to apply and have not materially changed. South32 confirms that the form and context in which the Competent Persons' findings are presented have not been materially modified from the original market announcement. There is low level of geological confidence associated with Inferred Mineral Resources and there is no certainty that further exploration work will result in the determination of Indicated Mineral Resources or that the Production Target will be realised. The potential quantity and grade of the Exploration Target is conceptual in nature. In respect of the Exploration Target used in the Production Target, there has been insufficient exploration to determine a Mineral Resource and there is no certainty that further exploration work will result in the determination of Mineral Resources or that the Production Target itself will be realised. The stated Production Target is based on South32's current expectations of future results or events and should not be solely relied upon by investors when making investment decisions. Further evaluation work and appropriate studies are required to establish sufficient confidence that this Production Target will be met. South32 confirms that inclusion of 20% of tonnage (10% Inferred Mineral Resources and 10% Exploration Target) is not the determining factor of the project viability and the project forecasts a positive financial performance when using 80% tonnage (32% Proved and 44% Probable Ore Reserves and 1% Measured and 3% Indicated Mineral Resources). South32 is satisfied, therefore, that the use of Inferred Mineral Resources, the Exploration Target in the Production Target and forecast financial information reporting, is reasonable.
[28] Average EBITDA calculated over the steady state production years (FY31-FY59).
[29] Based on a valuation date of 1 July 2026 included in market release "Hermosa project update" dated 30 April 2026.
[30] Refer to Hermosa news release "U.S. Forest Service issues Final Record of Decision for South32 Hermosa" dated 7 July 2026.
[31] Hermosa growth capital expenditure guidance excludes expected lease payments of US$60M for self generated power and other assets directly attributable to construction of infrastructure at the Taylor deposit. These self generated power and other costs were included in our capital cost estimate provided in market release "Hermosa project update" dated 30 April 2026.
[32] Refer to news release by Trilogy Metals Inc. "Trilogy Metals Announces Acceptance of Alaska's High-Grade Arctic Copper-Zinc-Lead-Gold-Silver Project into the FAST-41 Federal Permitting Program" dated 15 May 2026 (https://trilogymetals.com/news-and-media/news/trilogy-metals-announces-acceptance-of-alaskas-high-grade-arctic-copper-zinc-lead-gold-silver-project-into-the-fast-41-federal-permitting-program/).
[33] Refer to market release "Completion of Cerro Matoso Divestment" dated 1 December 2025.
[34] Refer to market release "Mozal Aluminium placed on care and maintenance" dated 16 March 2026.
[35] Production guidance for Hillside Aluminium does not assume any load-shedding impact on production.
[36] Net distributions from our material EAIs (manganese and Sierra Gorda) includes dividends, capital contributions and net repayments/drawdowns of shareholder loans, which should not be considered as an indication of or alternative to an IFRS measure of profitability, financial performance or liquidity. FY26 net distributions from our material EAIs comprise a distribution (+US$401M) from Sierra Gorda and a net distribution from Australia Manganese (+US$102M). The distribution from Sierra Gorda (US$401M) relates to accrued interest.
[37] Comprised of US$117M in respect of H2 FY25 paid in Q2 FY26 and US$175M in respect of H1 FY26 paid in Q4 FY26.
[38] We returned US$35M via the on-market share buy-back in FY26, purchasing 17M shares at an average price of A$3.08 per share.
[39] Since inception of our capital management program, US$1.8B has been allocated to our on-market share buy-back (837M shares at an average price of A$3.06 per share) and US$525M returned in the form of special dividends.
[40] Our Group underlying financial measures reflect continuing and discontinued operations.
[41] Refer to market release "Mozal Aluminium placed on care and maintenance" dated 16 March 2026.
[42] The underlying information reflects the Group's interest in material equity accounted joint ventures and is presented on a proportional consolidation basis, which is the measure used by the Group's management to assess its performance. The joint venture adjustments reconcile the proportional consolidation to the equity accounting position included in the Group's consolidated financial statements. The FY26 Sierra Gorda joint venture adjustments include a revaluation loss of US$(249)M (US$(182)M post-tax) relating to the shareholder loan payable that was eliminated from the Group's Underlying earnings upon proportional consolidation. The FY26 Australia Manganese joint venture adjustments include significant items of US$92M (US$59M post-tax) relating to insurance income recognised as Australia Manganese finalised its insurance recoveries for the impacts of Tropical Cyclone Megan in March 2024. The FY26 South Africa Manganese joint venture adjustments include an impairment of US$49M (US$38M post-tax) recognised for the Wessels mine at Hotazel Manganese Mines.
[43] Applicable for five years from the date of completion of the sale of IMC in August 2024, with no annual cap. The first two years will be calculated and paid on the second anniversary of completion and annually thereafter. The contingent price-linked consideration will be calculated as 50% of incremental metallurgical coal revenue from equity production, net of royalties, based on the following metallurgical coal price thresholds: Year 1: US$200/t, Year 2: US$200/t, Year 3: US$190/t, Year 4: US$180/t, Year 5: US$180/t.
[44] Under the sale agreement, contingent price-linked consideration of up to US$500M, was payable at threshold copper production rates and prices for years 2022 to 2025. Specifically, 50% of incremental revenue realised above the following copper price threshold, only where payable copper production exceeds the agreed threshold: CY25: US$3.80/lb and 158kt Cu. The production threshold was not achieved in CY25. As a result, no amount is payable for CY25 and the contingent consideration payable was written down to nil in FY26 (FY25: US$55M).
[45] Sales price variance reflects the revenue impact of changes in commodity prices, based on the current period's sales volume. Price-linked costs variance reflects the change in royalties together with the change in input costs driven by changes in commodity prices or market traded consumables. Foreign exchange reflects the impact of exchange rate movements on local currency denominated costs and sales. Sales volume variance reflects the revenue impact of sales volume changes, based on the comparative period's sales prices. Controllable costs variance represents the impact from changes in the Group's controllable local currency cost base, including the variable cost impact of production volume changes on expenditure, and period-on-period movements in inventories. The controllable cost variance excludes earnings adjustments including significant items.
[46] Underlying net finance costs, Underlying income tax expense (includes Underlying royalty related tax expense) and amounts attributable to non-controlling interests are actual FY26 results, not year-on-year variances.
[47] The underlying information reflects the Group's interest in material equity accounted joint ventures and is presented on a proportional consolidation basis, which is the measure used by the Group's management to assess its performance. The joint venture adjustments reconcile the proportional consolidation to the equity accounting position included in the Group's consolidated financial statements.
[48] The corporate tax rates applicable to the countries where the Group operates include: Australia 30%, South Africa 27%, Colombia 35%, Mozambique 0%, Brazil 34% and Chile 27%.
[49] Australia Manganese is subject to a royalty related tax equal to 20% of adjusted EBIT. Sierra Gorda is subject to a royalty related tax based on the amount of copper sold and the mining operating margin, the rate is between 5% and 14% for annual sales over 50kt of refined copper. These royalties are included in Underlying royalty related tax expense.
[50] Net distributions from our material EAIs (manganese and Sierra Gorda) includes dividends, capital contributions and net repayments/drawdowns of shareholder loans, which should not be considered as an indication of or alternative to an IFRS measure of profitability, financial performance or liquidity. FY26 net distributions from our material EAIs comprise a distribution (+US$401M) from Sierra Gorda and a net distribution from Australia Manganese (+US$102M). The distribution from Sierra Gorda (US$401M) relates to accrued interest.
[51] Net interest paid excludes amounts reported as net distributions from material EAIs.
[52] Total capital expenditure comprises capital expenditure, capitalised exploration and the purchase of intangibles. Capital expenditure comprises safe and reliable capital expenditure, improvement and life extension capital expenditure (including decarbonisation), and growth capital expenditure.
[53] Hermosa growth capital expenditure excludes lease payments of US$53M for self generated power and other assets directly attributable to construction of infrastructure at the Taylor deposit. These self generated power and other costs were included in our capital cost estimate provided in market release "Hermosa project update" dated 30 April 2026.
[54] Since inception of our capital management program, US$1.8B has been allocated to our on-market share buy-back (837M shares at an average price of A$3.06 per share) and US$525M returned in the form of special dividends.
[55] Group FY26 payable copper equivalent production, calculated by applying FY26 realised prices for all operations.
[56] Payable copper equivalent production (kt) was calculated by aggregating revenues from payable copper, molybdenum, gold and silver, and dividing the total Revenue by the price of copper. FY26 realised prices for copper (US$5.92/lb), molybdenum (US$25.90/lb), gold (US$4,462/oz) and silver (US$70.6/oz) have been used for FY26, FY27e and FY28e.
[57] The stockpiled material referred to in this report is not included as Mineral Resources in accordance with the JORC (2012) Code.
[58] Payable zinc equivalent production (kt) was calculated by aggregating revenues from payable silver, lead and zinc, and dividing the total Revenue by the price of zinc. FY26 realised prices for zinc (US$3,000/t), lead (US$1,944/t) and silver (US$66.4/oz) have been used for FY26, FY27e and FY28e.
[59] FY28 guidance not provided, reflecting expected completion of the Transaction in H2 FY27.
[60] Production guidance does not assume any load-shedding impact on production.
[61] FY26e Operating unit cost guidance includes royalties (where appropriate), the influence of exchange rates, and various assumptions for FY26, including: an alumina price of US$340/t; a manganese ore price of US$4.40/dmtu for 44% manganese product; a silver price of US$47.0/oz; a lead price of US$2,000/t (gross of treatment and refining charges); a zinc price of US$2,980/t (gross of treatment and refining charges); a copper price of US$4.80/lb (gross of treatment and refining charges); a molybdenum price of US$22.00/lb (gross of treatment and refining charges); a gold price of US$3,900/oz; an AUD:USD exchange rate of 0.66; a USD:ZAR exchange rate of 17.50; a USD:COP exchange rate of 3,940; a USD:CLP exchange rate of 950; and a reference price for caustic soda; which reflect forward markets as at February 2026 or our internal expectations.
[62] FY27e Operating unit cost guidance includes royalties (where appropriate), the influence of exchange rates, and various assumptions for FY27, including: an alumina price of US$320/t; a manganese ore price of US$4.90/dmtu for 44% manganese product; a silver price of US$65.0/oz; a lead price of US$2,000/t (gross of treatment and refining charges); a zinc price of US$3,500/t (gross of treatment and refining charges); a copper price of US$6.20/lb (gross of treatment and refining charges); a molybdenum price of US$26.00/lb (gross of treatment and refining charges); a gold price of US$4,300/oz; an AUD:USD exchange rate of 0.70; a USD:ZAR exchange rate of 17.00; a USD:CLP exchange rate of 930; and a reference price for caustic soda; which reflect forward markets as at August 2026 or our internal expectations.
[63] Hermosa growth capital expenditure guidance excludes expected lease payments of ~US$60M for self generated power and other assets directly attributable to construction of infrastructure at the Taylor deposit. These self generated power and other costs were included in our capital cost estimate provided in market release "Hermosa project update" dated 30 April 2026.
[64] Reflects five months of ownership prior to the divestment of Cerro Matoso on 1 December 2025.
[65] Capital expenditure for Mozal Aluminium reflects the period ending March 2026.
[66] FY26 Underlying revenue on third party products and services sold from continuing operations comprises US$77M for aluminium, US$1M for alumina, US$35M for manganese, US$94M for freight services and US$55M for raw materials. FY26 Underlying EBIT on third party products and services sold from continuing operations comprises US$8M for aluminium, US$11M for alumina and US$(1)M for freight services. FY25 Underlying revenue on third party products and services sold from continuing operations comprises US$142M for aluminium, US$28M for alumina, US$35M for manganese, US$50M for freight services and US$115M for raw materials. FY25 Underlying EBIT on third party products and services sold from continuing operations comprises US$3M for aluminium, US$16M for alumina and US$(1)M for raw materials.
[67] FY25 underlying results for IMC include third party products and services. FY25 Underlying revenue on third party products and services sold was US$28M and Underlying EBIT on third party products and services sold was nil.
RNS may use your IP address to confirm compliance with the terms and conditions, to analyse how you engage with the information contained in this communication, and to share such analysis on an anonymised basis with others as part of our commercial services. For further information about how RNS and the London Stock Exchange use the personal data you provide us, please see our Privacy Policy.

Latest directors dealings
- 1 hour ago Pinewood Technologies Group
- 2 hours ago Cropper (James)
- 2 hours ago Keller Group
- 4 hours ago IWG
- 4 hours ago Ultimate Products