
Final Results for the year ended 31 March 2026
Summary by AI BETAClose X

Prior to publication, the information contained within this announcement was deemed by the Company to constitute inside information as stipulated under the UK Market Abuse Regulation. With the publication of this announcement, this information is now considered to be in the public domain.
23 July 2026
Software Circle plc
("Software Circle", "the Company" or "the Group")
Preliminary Results for the year ended 31 March 2026
Software Circle plc (AIM: SFT) announces its full year audited results for the year ended 31 March 2026.
Financial highlights
|
|
2026 |
2025 |
|
Revenue |
£22.3m |
£18.3m |
|
Recurring Revenue* |
£16.8m |
£12.7m |
|
Operating EBITDA (oEBITDA)* |
£7.6m |
£4.8m |
|
Adjusted EBITDA (aEBITDA)* |
£5.8m |
£3.2m |
|
Operating profit |
£0.7m |
£0.7m |
|
Total comprehensive income/(loss) |
£(0.7)m |
£(0.4)m |
|
Operating Cash Flow Per Share (OCFPS)* |
1.1p |
0.5p |
|
Operating Return On Capital Deployed* |
25% |
24% |
|
Return On Capital Deployed* |
19% |
16% |
|
Cash generated from operating activities |
£5.9m |
£2.9m |
|
Cash and cash equivalents |
£3.9m |
£8.6m |
|
Earnings Per Share (EPS) |
(0.2)p |
(0.1)p |
|
Net debt / (cash) |
£11.4m |
£2.2m |
* Alternative performance measures defined in note 9
● Total revenue growth of 22%
● Combined organic revenue growth in acquired companies of 7%
● £4.2m of revenue growth added through acquisitions made in the current and prior year
● Organic growth in oEBITDA of 19% (23% in acquired companies only)
Strategic and Operational highlights
● £25.0m debt facility plus £10.0m accordion option secured post year end to extend deployable capital
● Acquisitions of Artificial Intelligent Finance Ltd and Broker Information Services Ltd
For further information:
|
Software Circle plc |
|
|
Gavin Cockerill (CEO) |
via investors@softwarecircle.com |
|
|
|
|
Allenby Capital Limited (Nominated Adviser and broker) |
0203 328 5656 |
|
David Hart / Liz Kirchner (Corporate Finance) Joscelin Pinnington / Amrit Nahal (Sales and Corporate Broking) |
|
Notes to editors:
Software Circle plc (AIM: SFT) has a mission: to be a leading serial acquirer and operator of Vertical Market Software businesses in the UK and Ireland - a permanent home for software leaders, teams, and customers. These are mission-critical systems, deeply embedded in the day-to-day workflows of users.
We help founders find the right exit strategy, acquiring businesses at appropriate valuations, supporting their organic growth over time, and reinvesting the free cash flow they generate into further value-accretive opportunities. We are building a group that gives shareholders diversified exposure to these software businesses, with discipline, alignment, and operational know-how.
Software Circle continues operations in an independent, decentralised way, and maintains the entrepreneurial spirit and culture that exists in the businesses acquired, enabling organic growth to be driven. Our goal is to create an environment where motivated teams can do their best work for the benefit of the most important stakeholder: the end customer.
For more information visit www.softwarecircle.com.
Chair's Statement
Dear shareholder,
In my first Chair's Statement last year, I set out our long-term ambition and the principles that guide how we allocate capital and measure success. Those principles remain unchanged. This year, I will focus on why I believe the opportunity ahead has become even more compelling, the progress we have made during the year, and how your Board has supported the Company in building a long-term compounding business.
Our long-term ambition
Our ambition is to become a leading acquirer and operator of vertical market software businesses, a permanent home for founders, leaders, teams and customers.
There are thousands of vertical market software businesses serving specialised customer groups. Many are excellent businesses, often built by founders and small teams with deep industry expertise. Through our conversations with founders, we increasingly hear that many like the idea of becoming part of a larger organisation. They want a permanent home that allows them to retain their identity and autonomy whilst benefiting from the support, resources and shared experience of a bigger group.
This has become even more evident with the rapid development of AI. The pace of technological change is accelerating. Founders and small teams need to learn new technologies, retrain employees, rethink products and adapt faster than ever before. For many, this creates both pressure and opportunity.
This is where Software Circle can make a difference. Bringing businesses together allows us to share knowledge, build specialist expertise, particularly around AI, and create a community where leaders learn from one another. Our aim is not to centralise decision-making, but to help exceptional teams navigate an increasingly complex world whilst remaining close to their customers.
What will success look like in 10-20 years?
Three years into our journey, we are now at a stage where the flywheel is starting to turn. As the Group grows, acquisitions will be able to be funded entirely through cash flow and debt. We are no longer reliant on equity issuance to finance inorganic growth. Over time, this compounding effect should enable us to deploy ever larger amounts of capital into disciplined M&A.
Looking 10 to 20 years ahead, success will not be defined by the number of acquisitions we complete or the size of the Group. Success will mean that Software Circle has become a recognised and trusted home for vertical market software businesses. A place that founders actively seek out because they know their teams, customers and products will continue to thrive. When founders start calling us, we will know that we have created a durable competitive advantage over other acquirers in our industry.
To achieve this, we must excel at three things: disciplined M&A, operational improvement, and instilling a culture built on our shared values. Great acquisitions bring talented people, products and knowledge into the Group. Strong operating capabilities make us a better home for future acquisitions. A strong culture ensures that we grow in the right way. Together, these elements reinforce one another and create the flywheel that we believe can compound value for customers, employees and shareholders over many years.
Progress during the year
From the Board's perspective, we keep our assessment simple and focused on the few measures that matter most. We ask three questions.
First, are our existing businesses becoming stronger? The answer is yes. Across the businesses we've acquired, organic growth in revenue was 7% and organic growth in Operating EBITDA was 23%, reflecting significant margin improvement. Together with the contribution from acquisitions and our original Nettl business, this resulted in Group Operating EBITDA increasing by 61% to £7.6m. These results give us confidence that we are not only acquiring quality businesses, but also helping them become stronger over time.
Second, are we redeploying capital effectively? During the year, we deployed £12.1m, including associated costs, deferred consideration payments for past acquisitions and two new acquisitions: Artificial Intelligence Finance and Broker Information Services, establishing our first software cluster in financial services. These are exactly the type of businesses we seek to acquire: mission-critical systems that sit at the heart of their customers' daily workflows, making them difficult to displace.
We have now deployed £36.7m of capital and this year generated £7.6m of Operating EBITDA. Our return measures are calculated against the average capital deployed over the year rather than the cumulative total. On that basis, Operating Return On Capital Deployed was 25% (2025: 24%) and a Return On Capital Deployed, after central costs, of 19% (2025: 16%).
Finally, is all of this creating more value for shareholders? Ultimately, this is what matters most. Operating Cash Flow Per Share, our preferred measure of long-term value creation, has more than doubled during the year from 0.5p to 1.1p.
I encourage you to read the CEO's and CFO's Reports for more detail.
The Board's role
The Board's role is to steward the Company on behalf of shareholders by challenging, supporting and guiding management in building a business over many years.
A significant part of our work centres on capital allocation. The Investment Committee reviewed acquisition opportunities and refined our acquisition criteria to reflect our latest thinking on competitive moats and the impact of AI on vertical market software businesses.
We also reviewed the Group's long-term funding strategy. Our objective is to maximise intrinsic value per share while prudently managing leverage. After the year end, this resulted in a new debt facility with increased funding on more attractive terms.
Furthermore, we continued to oversee governance, remuneration and the principal risks facing the Group. We reviewed whether our remuneration structure remains aligned with long-term value creation and spent considerable time discussing how AI is changing the competitive landscape. In particular, we challenged management on how Software Circle can best support our businesses in adapting to this rapidly evolving environment.
AI now sits at the centre of how we assess both our existing businesses and every new acquisition. Gavin's statement sets out our thinking on AI in full, including how we believe it can strengthen rather than threaten the businesses we own.
Final thoughts
I would like to thank everyone across the Group. We are still at an early stage of our journey, yet the progress we made last year has been tremendous. It is the result of the hard work, commitment and entrepreneurial spirit of our teams. They are the people who create value for our customers every day.
Finally, I would like to thank our shareholders. We are fortunate to have a group of like-minded owners who share our long-term ambition and are aligned with us in what we are trying to build.
I encourage you to join us at our AGM in Manchester this September. We deliberately extend the formal meeting to allow time for shareholders, the executive team and the rest of the Board to come together. It is an opportunity to hear more about our progress and strategy, exchange ideas and learn from one another. I hope to see many of you there.
Matthias Riechert
Chair
Chief Executive's Statement
Dear shareholder,
We closed FY26 with more revenue, better cash generation, and two more companies in the portfolio. The numbers tell the story of our twin compounding engines gathering momentum: the continued successful execution of our acquisition strategy, and the development of organic growth systems across the Group. Profitability has significantly stepped up and cash is following through.
Three years on from FY23, when the strategy now in place began to take hold, Group revenue has grown from £11.7m to £22.3m, a compound annual growth rate of 24%. Over the same period, recurring revenue has increased from £4.1m to £16.8m, representing compound annual growth of 60%. It now accounts for 76% of Group revenue, compared with 35% three years ago. Over the same period, our Adjusted EBITDA margin has risen from 3% to 26%.
The quality of the revenue base has improved even faster than the scale of the Group. This gives us confidence that the strategy is doing what we built it to do, with each year's progress strengthening the platform for the next.
We're a lean business by nature and by design, both centrally and within our operating units. Recurring revenue per head, including the central team, has more than doubled since FY23, from £45k to over £100k on a run rate basis. Over that period, headcount has increased 2.0x while Recurring Revenue has grown 4.1x. The operating model is doing the work.
Of course, no CEO statement would be complete without addressing the topic that has found its way into every boardroom, investor discussion and dinner table conversation: AI.
AI has become one of those rare topics, perhaps rivalled only by football in a World Cup year, where everyone has a view, no one has all the answers, and the commentary seems to change by the week.
For us, the task has been to look past the noise and focus on execution. How AI can solve real problems, improve the way our customers work and unlock meaningful value. We'll set out later what we are doing with AI, and why we believe Software Circle is on the right side of it.
What we do
Software Circle is a permanent home for B2B vertical market software businesses in the UK and Ireland. We buy them. We don't sell them and we keep them. The cash they produce, we redeploy into the next one.
The model is straightforward. Acquire founder-led, profitable, high-recurring-revenue software companies serving specialist verticals. The businesses we look for share a pattern. They sit inside regulated or specialist workflows where the platform is part of how the work gets done. Their data is proprietary, their customer relationships long, their switching costs high. That defensibility matters today. It matters more as AI matures, which we will come to later. We pay disciplined entry multiples. We support and develop organic growth over time, reinvesting the growing cash flows back into the portfolio and further acquisitions. That is the flywheel we are building.
The discipline matters most. The best serial acquirers, we believe, share these habits. We buy at multiples that protect downside. We never confuse activity with progress. We measure Return On Capital Deployed ("ROCD") and Operating Cash Flow Per Share ("OCFPS") above all else. Those numbers compound. The rest is noise. We say no often. When there's nothing worth doing, we wait.
Every acquisition gets evaluated against our guardrails. Every pound we deploy is benchmarked against the next pound we could deploy somewhere else.
The operating model is decentralised by design. Each business keeps its name, its team, its strategy and its identity. The leaders closest to the customer make the day-to-day calls. Our job at the centre is to maintain accountability and to provide capital, capability and support.
Decentralisation is what makes the model work. It's the reason customers stay. It's the reason great founders sell to us. It's the reason organic growth is possible inside the portfolio. Take it away and the engine stops. It is particularly vital in building AI maturity in a way that truly benefits our customers.
A year of execution
Revenue grew 22% to £22.3m (2025: £18.3m). Recurring Revenue grew 33% to £16.8m, now 76% of total revenue, up from 70%.
Group organic revenue declined by 1% (2025: decline of 9%), due to the continued reduction in non-recurring revenue at Nettl Systems. Despite that, organic Operating EBITDA grew by 19% (2025: 22%), reflecting a combination of cost discipline and the continued application of our operating methodologies across the Group.
Adjusted EBITDA grew 83% to £5.8m (2025: £3.2m), at a margin of 26% (2025: 17%) and beating the 25% target we set out previously. Operating EBITDA was up 61% at £7.6m (2025: £4.8m), at a margin of 34% (2025: 26%). Operating Cash Flow Per Share ("OCFPS") more than doubled to 1.1p (2025: 0.5p).
It is in the performance of our acquired portfolio where the compounding power of the underlying engine is most visible. This delivered organic revenue growth of 7% (2025: 5%) and organic Operating EBITDA growth of 23% (2025: 12%). With an Operating EBITDA margin of 43%, this produces a Quality Score of 50, comfortably above the "Rule of 40" threshold commonly used as a marker of software business health. The chart below illustrates the progress over the past three years.
The underlying engine - our acquired portfolio
|
|
2026 |
2025 |
2024 |
|
Revenue |
£17.0m |
£11.9m |
£7.8m |
|
oEBITDA |
£7.2m |
£4.3m |
£2.8m |
|
Organic Revenue Growth |
7% |
5% |
5% |
|
Organic oEBITDA Growth |
23% |
12% |
22% |
|
oEBITDA margin |
43% |
36% |
36% |
|
Capital Deployed on Acquisitions in Year |
£12.1m |
£9.2m |
£4.4m |
Each operating segment played its part in the year.
Graphics and Ecommerce. Revenue was £7.7m (2025: £8.7m), representing 34% of Group revenue. Nettl continued to experience a reduction in non-recurring revenue. Although Vertical Plus grew again, this was not enough to offset the decline, resulting in an 11.5% revenue reduction across the segment. Through cost discipline at Nettl and via growth at Vertical Plus, Operating EBITDA still increased by 4%.
Professional and Financial Services. Revenue increased to £6.2m from £3.1m. The Irish fintech cluster of Online Application ("AIF") and Broker Information Services ("BIS") joined the Group during the year, adding £2.5m of revenue and £1.0m of Operating EBITDA through acquisition. Watermark and bethebrand, which delivered its first full year within the Group, both grew strongly. Their collective organic revenue growth of 10% helped the segment deliver strong organic Operating EBITDA growth of 34%.
Health and Social Care. Revenue was £3.9m (2025: £3.6m), an increase of £0.3m. Link Maker, acquired during the prior year, delivered its first full year within the Group and contributed £0.4m of acquisition growth, performing in line with expectations. Organic revenue declined slightly by £0.1m, as CareDocs softened on revenue while maintaining margin through cost efficiency. With NHS assured status now achieved and AI product development advancing, the foundations are in place to support organic growth from here. Operating EBITDA grew £0.3m to £1.6m (2025: £1.3m), of which £0.1m (5%) was organic and £0.2m inorganic from Link Maker's first full year.
Property. Revenue at TopFloor was £1.9m (2025: £1.6m). Investment in the product is starting to bear fruit. New open-banking modules and continued new-logo growth contributed to organic revenue growth of 15% and organic Operating EBITDA growth of 21%, making it one of the standout performers during the year.
Education. Revenue was £2.6m (2025: £1.3m). Of this, £1.0m was inorganic, as Total Drive delivered its first full year within the Group. Arc Technology continued its expansion, while Total Drive delivered a significant increase in new logos during its first full year within the Group. Together, the businesses delivered organic revenue growth of 15%, both are gaining momentum. Operating EBITDA grew to £1.5m (2025: £0.5m), of which £0.4m (36%) was organic and £0.6m inorganic from Total Drive's first full year.
Through our inorganic and organic growth, the Group's profit base is diversified across more businesses and at a higher margin than a year ago.
Composition of Group Revenue and oEBITDA
|
|
# Op Units |
Revenue |
oEBITDA |
|||||||
|
Segment |
2026 |
2025 |
2026 |
2025 |
2026 |
2025 |
||||
|
Graphics and Ecommerce |
2 |
2 |
£7.7m |
34% |
£8.7m |
47% |
£1.0m |
13% |
£1.0m |
21% |
|
Professional & Financial Services |
4 |
2 |
£6.2m |
28% |
£3.1m |
17% |
£2.6m |
34% |
£1.2m |
25% |
|
Health and Social Care |
2 |
2 |
£3.9m |
17% |
£3.6m |
20% |
£1.6m |
21% |
£1.3m |
27% |
|
Education |
2 |
2 |
£2.6m |
12% |
£1.3m |
7% |
£1.5m |
20% |
£0.5m |
10% |
|
Property |
1 |
1 |
£1.9m |
9% |
£1.6m |
9% |
£0.9m |
12% |
£0.8m |
17% |
|
Total |
11 |
9 |
£22.3m |
£18.3m |
£7.6m |
£4.8m |
||||
|
oEBITDA margin |
|
|
|
|
|
|
34% |
26% |
||
We've deployed £36.7m to date, rising to £42m once deferred and contingent consideration payable on current performance levels is included. Of that, £12.1m was deployed in FY26, as AIF and BIS joined the Group.
The acquired portfolio's compounding accelerates each year as organic growth and margin improvement layer on top of the acquisitions already completed. This is reflected in Operating Return On Capital Deployed, which increased to 25% (2025: 24%).
AI: our approach
AI is the single most important strategic question facing every software business today, including ours. As Matthias notes in his statement, the Board has spent real time on this over the year, what follows is the detail on how we think about it.
The debate has swung between two extremes. On one side, the "SaaS-pocalypse" view, that AI is coming for every incumbent. On the other, the view that vertical market software enters a golden age because workflows are too embedded to disrupt. The truth is often much more nuanced and likely sits somewhere between the two, and we think we're better positioned than most.
The pace of change is real. Model capability, reliability and adoption have advanced rapidly over the past few years, particularly in software development and knowledge work. Early 2026 brought another significant step forward.
This is the fastest technology shift any of us have experienced. Ignoring it would, of course, be reckless. There are real risks. Larger attack surfaces, prompt injection, governance gaps, hallucinations, brittle edge cases. These are not reasons to stand still. They are reasons to move carefully and deliberately.
The vertical software businesses we own, and continue to acquire, sit squarely in the path of opportunity. We need to be smart about how we take advantage of it.
Our approach across the Group rests on two principles.
Courage. We engage. We put guardrails in place. We run controlled pilots. We accept that early versions will be imperfect, then harden them quickly. We build the muscle to use AI well.
Curiosity. We ask questions. We run tests. We turn uncertainty into practical patterns we can repeat across the portfolio.
We are not waiting for AI to be perfect before we act. We are building the muscle to use it well, always with a bias for action.
Why VMS is better positioned
Much of the market anxiety around AI has been driven by the fear that agents and copilots will commoditise traditional software. There is some truth in that concern, but it applies unevenly. The kind of software most at risk from AI is shallow. UI-heavy, generic workflows, per-seat pricing, low switching costs. If a user can ask an AI agent to execute the same outcome through a chat interface, the traditional product interface potentially becomes optional. Switching costs fall. Features get copied faster. Seat-based pricing comes under pressure.
We own a different kind of software. Platforms that are so deeply embedded in the daily operations of regulated or specialist industries that if they stopped working, the business would stop too, or fall out of compliance, or become unsafe. There is a fundamental difference between a simple tool and something that is vital to the business and its workflows.
In our view, there are three layers that make these businesses harder to displace as AI matures.
Proprietary data. Domain-specific history, taxonomies and workflow patterns that compound with use. The data belongs to the workflow, not to a general-purpose model.
The data inside our platforms is the texture of how real work gets done. How a CareDocs user logs a fall and what comes next. How a mortgage broker through Online Application structures a suitability report. Years of decisions captured as structured records, with the taxonomies and categorisations our platforms built up around them.
The data sits behind login walls in regulated or specialised workflows.
Regulatory embed. Our platforms often deliver audit trails, mandated reporting, safety obligations and deal with ever evolving rules and changes in regulation. Trust relationships backed by regulatory consequence. A CRM that breaks costs you a bad week. A platform holding the Care Quality Commission record, the Financial Conduct Authority approval log, the property rental regulation compliance record, or the mandated university placement reporting carries existential consequences if it fails.
Trust takes years to earn from regulators and from the customers operating under them.
Transaction embed. Platforms that are economically and operationally entangled with the moment value is exchanged. Remove the platform and you interrupt both the flow of money and the execution of work. This is more than workflow dependency. The software is part of the commercial infrastructure. It helps the customer quote, transact, record, reconcile, comply and deliver. Once a platform occupies that position, it is not casually replaced.
These layers, alongside well executed AI, make platforms more valuable, not less. The three layers work together. Data tells the agent what to do. Regulation defines what it can do. Transaction embed gives every action consequence.
In practice, what does this look like? The evidence from across our portfolio is encouraging. Churn hasn't moved. Growth hasn't softened, despite plenty of noise saying it should have. Customers are coming to us asking how AI can work for them inside the platforms they already use every day.
The questions are forward-looking. How can these systems become more useful? For VMS businesses like ours, that's the signal that matters. The software is already embedded in the workflow, trusted by users, and connected to the data and processes that make a difference. The opportunity is to bring AI into that reality.
With these layers as the foundation, AI can unlock meaningful value for customers in workflows where the real-world consequences matter. Through listening to our customers, we are seeing these opportunities across the portfolio. Here are a few examples.
CareDocs is used by hundreds of care homes across the UK, holding data-rich care records that support inspection by the Care Quality Commission. AI can improve the quality-of-care recording, identify potential non-compliance earlier and reduce the administrative burden on care teams by making analysis and summaries simpler, more useful and more transparent. This gives busy care homes more time to care.
Link Maker sits at the heart of the children's adoption placement system across the UK, used by local authorities and social workers. As in all of our regulated products, AI use needs to be carefully thought through with stakeholders at the heart of it. AI could improve the quality of profiles by automatically flagging non-compliant sections of a child profile before publication, supporting Letter Swap correspondence between adopters and birth families by performing automated risk assessments on uploads, using rules set by the organisation, and converting all audio messages into text, greatly speeding social worker review.
Broker Information Services and Online Application together form an Irish fintech cluster for financial brokers, with nightly product feeds and end-to-end mortgage and insurance applications. AI can auto-draft suitability reports, flag renewals ahead of time, and route applications intelligently. All of which improves the efficiency for brokers.
bethebrand manages marketing approval workflows for firms regulated by the Financial Conduct Authority. AI can start pre-screening submissions against compliance rules, flag regulatory changes for review and codify the institutional memory compliance teams rely on.
Total Drive is used by over 8,000 driving instructors every week. AI can enhance both instructor productivity and learner outcomes through test-readiness, personalised lesson planning based on aggregate platform data, GPS route analysis, intelligent diary management, demand forecasting, voice-enabled workflows through Apple CarPlay and business intelligence tools that help instructors operate more efficiently.
Nettl is a software and services platform for the graphics industry. AI can draft quotes, run pre-flight checks on artwork, create orders, follow up with clients and route through the supply chain, even deliver services, turning an end-to-end operating system into an intelligent worker.
Across the portfolio, the foundations are increasingly in place. Each unit is building out use cases like these, prioritised by impact. Decentralisation matters here. The teams closest to the customer can see which use cases will have the most benefit and impact for the user, and they build those first. The role of the centre is to set the direction of travel, run the AI community across the Group, and help each business build the capability it needs. The common thread is the move from systems of record to systems of action.
Systems of record to systems of action
Systems of record are the cornerstone of vertical market software. They are built for accuracy, consistency, auditability and compliance.
What's being added on top is an action layer. Software that executes tasks, automates workflows, drafts responses, routes work and calls tools under human approval. That's the shift from systems of record to systems of action.
Software also stops being just a tool the team uses. It becomes an additional worker on the team. SaaS becomes SaaW: Software as a Worker. The platform picks up tasks, drafts the response, runs the check, routes the file and hands the result back for approval. More of the work happens inside the software itself.
Owning the agent
The single biggest call we're making inside our AI strategy is who owns the agent.
If the agent that does the work for our customers lives outside our platforms, in a general-purpose chatbot, a horizontal copilot, or someone else's interface, we become the back-end that the agent calls for data. The customer relationship shifts to whoever owns the agent.
If the agent lives inside our platforms, we remain the control tower. The agent has full context: the data, the history, the rules, the people, the regulator. Permissions, approvals and audit trails are native. Compliance is enforced by the platform itself. Accuracy is higher because the agent isn't guessing. Every action it takes feeds back into making it better at the next one.
Owning the agent is possible precisely because of the kind of software we own. The proprietary data gives the agent context a general model can't have. The regulatory infrastructure lets us enforce permissions and audit at platform level. The transaction embed gives every agent action consequence. The same three moats that protect our businesses from displacement are what makes agent ownership possible.
We've seen this pattern before. In mobile, the platforms that owned the device captured the value above it. In cloud, the platforms that owned the runtime captured the margin from the workloads sitting on top. In AI-driven workflows, the platform that owns the agent is best placed to retain the customer relationship.
Monetisation follows the work the agent does, through assistant tiers and into autonomous autopilot.
The mantra inside the Group: own the data, own the agent, own the workflow.
What we're doing across the Group
We've established an internal AI community with a champion in each business. Knowledge, success stories and challenges are shared in our internal forums and group sessions.
We've built an AI Maturity Scorecard with two components. Operational maturity covers use-case penetration, workflow integration, measurement, ROI, governance and capability. Product maturity covers customer value and adoption, integration depth, data readiness, safety, reliability and the extent to which AI strengthens the moat. Every business is scored and tracked.
Our medium-term goal is an AI Operating Layer that means workflows are automated end-to-end, products are built smarter and faster, support is delivered ahead of need and retention is strengthened structurally.
AI risk and opportunity are now embedded into M&A due diligence for every target we evaluate. We want to understand how each target is positioned and how it performs against the three layers we look for. This helps us focus on businesses with longevity and opportunity in an AI-driven world.
The winners are the businesses with the deepest domain expertise and the discipline to deploy AI where it materially improves outcomes. That's the kind of software we own, and the kind we continue to acquire.
Across the Group, we take a simple view. If we dismiss AI and underestimate the change, we may not get the chance to recover. If we prepare for AI and overestimate the change, we still build a stronger business.
We are using the knowledge across the Group and investing in the capability of our people because the downside of inaction far exceeds the cost of preparation. Nobody has certainty about how this technology will ultimately evolve. What we do know is that our portfolio of essential, vertically embedded software gives us a strong foundation. We believe AI, deployed carefully and for the benefit of customers, can make that foundation compound further.
Current trading and outlook
The new financial year began in April. Trading is in line with internal expectations and the acquisition pipeline remains healthy.
We also refinanced the Group's borrowing facilities after the year end. In May, we secured a new £25.0m committed revolving credit facility with Santander, together with a £10.0m uncommitted accordion. This replaced the £16.7m Shawbrook facility put in place in November 2024. Our thanks to Shawbrook for backing us early. And our welcome to Santander as we move into the next phase.
We surpassed our Gate 4 milestone of £5m Adjusted EBITDA on a run-rate basis during the year. Gate 5 sits at £15m.
Before further M&A, the Group is currently generating annualised revenue of approximately £25.0m at an Adjusted EBITDA margin of 27%. The Santander facility gives us the capacity to continue deploying capital on acquisitions that meet our criteria, while maintaining a disciplined approach to leverage.
We get to the next gate the same way we got here. One disciplined acquisition at a time. Organic growth in each unit. Cash redeployed.
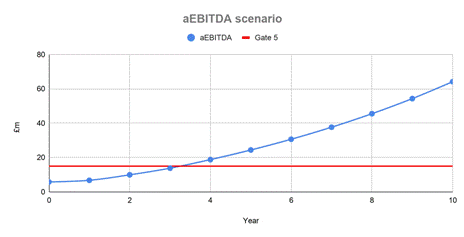
The illustrative scenario below shows how those elements can combine over time. It starts from our current run-rate Adjusted EBITDA of approximately £6.8m in year 1 and assumes that we continue to acquire businesses with similar characteristics, at similar entry multiples, while delivering measured organic Adjusted EBITDA growth and maintaining leverage below our stated ceiling of 3x.
On those assumptions, the Group would reach Gate 5 within approximately three to four years. The shape of the curve is the point. Each acquisition adds a new stream of earnings and cash flow. Organic growth and margin improvement then layer on top of the businesses already acquired. As the portfolio grows, it generates more cash internally. That cash funds a greater proportion of the next round of acquisitions.
Over time, the balance shifts. External capital remains a useful tool, but the Group becomes progressively less reliant on it.
The milestone we are building towards is the self-funded flywheel: the point at which internally generated cash flow can fund the acquisition programme in full. From there, the engine turns increasingly under its own power.
Nobody can be certain how far or how quickly this runs. The scenario is an illustration, not a forecast, and the assumptions behind it may not be realised. But the direction is one we have already demonstrated over the past three years. The discipline that produced these results is the discipline that takes us to the next gate.
*Illustrative scenario not a forecast
** Assumptions:
Acquisition at current multiples and similar business profile; Maximum gross leverage = x3 aEBITDA; Organic oEBITDA Growth = 12%; Cost of Debt = 6.7%; Corporation Tax rate = 25%; Maximum deployment of £20m per year.
Thank you
To our shareholders, thank you for your continued support. I look forward to seeing many of you at the AGM in September. Beyond the formal business, it is a real opportunity to meet in person and share more of the story behind our progress.
A particular welcome to the teams who joined us during the year. To every team member across the Group, thank you for the focus and execution that produced these numbers. Your work continues to strengthen the foundations of a resilient, cash-generative software group.
Gavin Cockerill
Chief Executive Officer
Multi-year review of financial performance
|
SUMMARY INCOME STATEMENT £000 |
2026 |
2025 |
2024 |
2023 |
|
Recurring revenue |
16,845 |
12,701 |
9,210 |
4,104 |
|
Non-recurring revenue |
5,416 |
5,573 |
6,955 |
7,573 |
|
Total Revenue |
22,261 |
18,274 |
16,165 |
11,677 |
|
|
|
|
|
|
|
Operating EBITDA |
7,627 |
4,752 |
2,784 |
1,315 |
|
Central costs |
(1,827) |
(1,586) |
(1,096) |
(947) |
|
Adjusted EBITDA |
5,800 |
3,166 |
1,688 |
368 |
|
Acquisition costs |
(838) |
(479) |
(347) |
(353) |
|
Development costs capitalised |
1,825 |
1,292 |
1,133 |
390 |
|
Share option charges |
(125) |
(106) |
(37) |
- |
|
Depreciation and amortisation |
(6,121) |
(4,608) |
(3,551) |
(1,556) |
|
Impairments and exceptionals |
182 |
1,439 |
(2,111) |
(805) |
|
Operating profit / (loss) |
723 |
704 |
(3,225) |
(1,956) |
|
Net finance costs |
(1,768) |
(1,375) |
(256) |
(695) |
|
Tax |
236 |
342 |
1,111 |
1,243 |
|
Net loss from continuing operations |
(809) |
(329) |
(2,370) |
(1,408) |
|
Net loss from discontinued operations |
- |
- |
- |
(203) |
|
Net loss |
(809) |
(329) |
(2,370) |
(1,611) |
|
SUMMARY STATEMENT OF FINANCIAL POSITION £000 |
2026 |
2025 |
2024 |
2023 |
|
Property, plant and equipment |
601 |
764 |
1,242 |
1,384 |
|
Intangible assets |
36,086 |
26,862 |
15,302 |
16,266 |
|
Other assets |
2,137 |
1,907 |
2,451 |
3,976 |
|
Cash and cash equivalents |
3,937 |
8,566 |
15,391 |
1,994 |
|
Total assets |
42,761 |
38,099 |
34,386 |
23,620 |
|
|
|
|
|
|
|
Equity |
20,842 |
21,394 |
21,681 |
928 |
|
Interest-bearing liabilities |
15,351 |
10,800 |
8,495 |
18,716 |
|
Non-interest-bearing liabilities |
6,568 |
5,905 |
4,210 |
3,976 |
|
Equity and liabilities |
42,761 |
38,099 |
34,386 |
23,620 |
|
|
|
|
|
|
|
Net debt / (cash) |
11,414 |
2,234 |
(6,896) |
16,722 |
|
SUMMARY STATEMENT OF CASH FLOWS £000 |
2026 |
2025 |
2024 |
2023 |
|
Loss for the year from continuing operations |
(809) |
(329) |
(2,370) |
(1,408) |
|
Adjustments for non-cash items |
7,583 |
3,885 |
4,386 |
1,936 |
|
Operating cash flow before changes in working capital |
6,774 |
3,556 |
2,016 |
528 |
|
Cash flow from changes in working capital |
(288) |
(616) |
283 |
(396) |
|
Cash flow from taxes |
(548) |
2 |
(6) |
67 |
|
Cash flow from operating activities |
5,938 |
2,942 |
2,293 |
199 |
|
Cash flows from other investing activities |
(1,801) |
(994) |
(844) |
(344) |
|
Cash flow from operating and other investing activities |
4,137 |
1,948 |
1,449 |
(145) |
|
Capital deployed acquiring subsidiaries |
(11,234) |
(8,685) |
(4,100) |
(8,367) |
|
Cash flows from disposals |
- |
1,712 |
- |
- |
|
Cash flows from financing activities |
2,451 |
(1,790) |
16,050 |
9,035 |
|
Cash flow for the year from continuing operations |
(4,646) |
(6,815) |
13,399 |
523 |
|
FX on cash |
17 |
(10) |
(2) |
- |
|
Cash flow on discontinued operations |
- |
- |
- |
9 |
|
Cash movement for the year |
(4,629) |
(6,825) |
13,397 |
532 |
|
REVENUE ANALYSIS £000 |
2026 |
2025 |
2024 |
2023 |
|
Prior year |
18,274 |
16,165 |
11,677 |
8,916 |
|
Full year contribution from prior acquisitions |
1,658 |
1,005 |
5,220 |
- |
|
Organic growth |
(192) |
(1,598) |
(860) |
611 |
|
Partial year contribution from new acquisitions |
2,521 |
2,702 |
128 |
2,150 |
|
Current year |
22,261 |
18,274 |
16,165 |
11,677 |
|
oEBITDA ANALYSIS £000 |
2026 |
2025 |
2024 |
2023 |
|
Prior year |
4,752 |
2,784 |
1,315 |
217 |
|
Full year contribution from prior acquisitions |
781 |
243 |
1,393 |
- |
|
Organic growth |
1,060 |
656 |
20 |
379 |
|
Partial year contribution from new acquisitions |
1,034 |
1,069 |
56 |
719 |
|
Current year |
7,627 |
4,752 |
2,784 |
1,315 |
|
CAPITAL DEPLOYED £000 |
2026 |
2025 |
2024 |
2023 |
|
Opening |
24,657 |
15,493 |
11,046 |
2,326 |
|
Capital deployed on acquisitions |
11,234 |
8,685 |
4,100 |
8,367 |
|
Acquisition related costs |
838 |
479 |
347 |
353 |
|
Closing |
36,729 |
24,657 |
15,493 |
11,046 |
|
KEY FINANCIAL PERFORMANCE INDICATORS (CONTINUING OPERATIONS) |
2026 |
2025 |
2024 |
2023 |
|
Change in revenue, % |
21.8 |
13.0 |
38.4 |
31.0 |
|
Change in recurring revenue, % |
32.6 |
37.9 |
124.4 |
92.2 |
|
Organic revenue growth rate, % |
(1.0) |
(9.3) |
(5.1) |
6.9 |
|
Organic revenue growth rate (acquisitions), % |
6.9 |
4.5 |
5.0 |
n/a |
|
Run-rate ARR, £000 |
19,188 |
14,376 |
10,116 |
9,132 |
|
Operating EBITDA margin, % |
34.3 |
26.0 |
17.2 |
11.3 |
|
Operating Return On Capital Deployed, % |
24.8 |
23.7 |
21.0 |
19.7 |
|
aEBITDA margin, % |
26.1 |
17.3 |
10.4 |
3.2 |
|
Return On Capital Deployed, % |
18.9 |
15.8 |
12.7 |
5.5 |
|
Net debt / equity ratio, times |
0.5 |
0.1 |
(0.3) |
18.0 |
|
Leverage |
2.0 |
0.7 |
(4.1) |
45.4 |
|
Interest cover ratio, times |
3.3 |
2.3 |
6.6 |
0.5 |
|
Earnings per share, pence |
(0.2) |
(0.1) |
(0.9) |
(1.2) |
|
Operating Cash Flow Per Share, pence |
1.1 |
0.5 |
0.6 |
(0.1) |
|
Closing share price, pence |
15.7 |
29.6 |
15.3 |
9.3 |
Chief Financial Officer's Report
Another year of strategic progress and improved profitability
FY26 marked another step forward. We grew revenue, increased profitability and brought two further high-quality software businesses into the Group.
Total revenue rose 22% to £22.3m (2025: £18.3m). Recurring revenue reached £16.8m (2025: £12.7m), up 33%, and now represents 76% of the total (2025: 70%). The predictable, contracted and renewing nature of that income remains central to how we assess the durability of every business we own.
Profit improvement was even more pronounced. oEBITDA increased 61% to £7.6m (2025: £4.8m) and aEBITDA rose 83% to £5.8m (2025: £3.2m), taking the aEBITDA margin to 26% from 17%. Despite this, operating profit was flat at £0.7m (2025: £0.7m) as a result of increased amortisation on acquisition-related intangible assets.
We deployed a total of £12.1m during the year across new acquisitions, including associated costs, and deferred consideration payments for past acquisitions. Artificial Intelligence Finance Ltd (known as Online Application) was added in August 2025 and Broker Information Services Ltd in October 2025, each satisfying our investment criteria. Both are profitable and cash generative, together adding £2.5m of revenue and £1.0m of oEBITDA in the financial year.
Alternative Performance Measures (APMs)
The Group utilises Alternative Performance Measures (APMs) to offer shareholders a clearer understanding of our underlying trading performance and to provide a consistent measure of the execution of our strategy. These measures are not intended to replace IFRS metrics but to supplement them. Our key APMs include oEBITDA, aEBITDA, Recurring Revenue, Return on Capital Deployed, and Operating Cash Flow Per Share. A full list of definitions is provided in note 9.
Revenue performance
Three factors account for the 22% increase in revenue to £22.3m:
● Acquisitions: businesses bought in the current and prior year added £4.2m.
● Organic growth: the ten businesses in our acquired portfolio grew organically by £0.9m (2025: £0.4m), an increase of 7%.
● Nettl: revenue fell by £1.1m (2025: £2.0m), extending the trend of recent years.
Revenue by segment
|
|
Total Revenue |
Organic growth |
Acquisition growth |
|||
|
|
2026 |
2025 |
2026 |
2025 |
2026 |
2025 |
|
Graphics and Ecommerce |
£7.7m |
£8.7m |
£(1.0)m |
£(1.8)m |
£0.0m |
£0.0m |
|
Professional & Financial Services |
£6.2m |
£3.1m |
£0.3m |
£0.1m |
£2.8m |
£1.6m |
|
Health and Social Care |
£3.9m |
£3.6m |
£(0.1)m |
£(0.1)m |
£0.4m |
£1.0m |
|
Education |
£2.6m |
£1.3m |
£0.3m |
£0.1m |
£1.0m |
£1.1m |
|
Property |
£1.9m |
£1.6m |
£0.3m |
£0.1m |
£0.0m |
£0.0m |
|
Total |
£22.3m |
£18.3m |
£(0.2)m |
£(1.6)m |
£4.2m |
£3.7m |
Recurring licence and subscription income rose to £16.8m (2025: £12.7m), a direct consequence of acquiring businesses with revenue of a predominantly recurring nature. The acquired portfolio delivered 7% (2025: 5%) organic revenue growth, driven by broader adoption of expanded services and measured pricing that reflects the continued investment we make in our products. Group-wide, organic revenue edged down 1% (2025: down 9%), attributable to the lower contribution from Nettl, our longest-held operating business. Nettl continues to face a challenging trading environment, with cost pressures increasing and macroeconomic uncertainty further impacting demand for its products and services.
Run-rate Annual Recurring Revenue (ARR), calculated by annualising the recurring revenue contracted at the year end, closed the year up 33% at £19.2m (2025: £14.4m), giving us good visibility into the period ahead.
Profitability and earnings
The Group continues to turn revenue growth into stronger earnings:
● Operating EBITDA increased by 61% to £7.6m (2025: £4.8m).
● aEBITDA increased by 83% to £5.8m (2025: £3.2m).
● The Group generated a statutory Operating Profit of £0.7m (2025: £0.7m).
● Statutory Loss for the year increased to £0.8m (2025: loss of £0.3m).
oEBITDA by segment
|
|
oEBITDA |
Organic growth |
Acquisition growth |
|||
|
|
2026 |
2025 |
2026 |
2025 |
2026 |
2025 |
|
Graphics and Ecommerce |
£1.0m |
£1.0m |
£0.0m |
£0.4m |
£0.0m |
£0.0m |
|
Professional & Financial Services |
£2.6m |
£1.2m |
£0.4m |
£0.1m |
£1.0m |
£0.5m |
|
Health and Social Care |
£1.6m |
£1.3m |
£0.1m |
£0.0m |
£0.2m |
£0.5m |
|
Education |
£1.5m |
£0.5m |
£0.4m |
£0.2m |
£0.6m |
£0.3m |
|
Property |
£0.9m |
£0.8m |
£0.1m |
£0.0m |
£0.0m |
£0.0m |
|
Total |
£7.6m |
£4.8m |
£1.0m |
£0.7m |
£1.8m |
£1.3m |
Both engines drove the gain. Acquisitions added £1.8m of Operating EBITDA, organic Operating EBITDA growth was 19%, lifting the Operating EBITDA margin to 34% (2025: 26%). Each operating segment has contributed to this growth. In the Graphics and Ecommerce segment this was possible, despite the reduction in Nettl revenue contribution, due to ongoing cost efficiencies, including the benefit of closing Nettl's loss-making Liverpool location at the start of the year.
Central costs rose to £1.8m (2025: £1.6m), the planned cost of resourcing a larger group and sustaining a disciplined acquisition and integration capability. As a proportion of Operating EBITDA, central costs reduced to 24% (2025: 33%).
As a result of the increased aEBITDA performance, Statutory Operating Profit remained £0.7m (2025: £0.7m). This was despite a rise in depreciation and amortisation to £6.1m (2025: £4.6m), driven by non-cash amortisation on acquisitions of £4.8m (2025: £3.7m), and the prior year benefiting from a £1.7m credit related to the sale of the printing.com domain.
The statutory result for the year was a loss of £0.8m (2025: loss of £0.3m), equivalent to a loss per share of 0.2p (2025: 0.1p). We expect the Group to move into sustained net profitability. Amortisation is fixed against the historical cost of past deals and does not rise in step with revenue or profit, so the earnings each new acquisition contributes should increasingly outweigh that charge.
Cash flow, debt, and leverage
|
Key Metrics (£'000 unless stated) |
2026 |
2025 |
|
Cash flow from operating and other investing activities |
4,137 |
1,948 |
|
Operating Cash Flow Per Share (OCFPS) |
1.1p |
0.5p |
|
Capital deployed on acquisitions including related costs |
12,072 |
9,164 |
|
Closing Cash and cash equivalents |
3,937 |
8,566 |
|
Interest-bearing liabilities |
15,351 |
10,800 |
|
Net debt |
11,414 |
2,234 |
|
Leverage (Net debt / aEBITDA) |
2.0 |
0.7 |
Cash generation across the operating businesses remained robust at £4.1m (2025: £1.9m). OCFPS more than doubled to 1.1p (2025: 0.5p), reflecting the step-up in aEBITDA and the high cash conversion of our businesses.
We deployed £12.1m in acquisitions and related costs. Funded from a combination of cash and a drawdown of £4.5m from the debt facility, this moved the Group to net debt of £11.4m at the year end (2025: £2.2m).
The net leverage at the end of the year has increased to 2.0x (2025: 0.7x). However, in line with financial reporting standards, this number includes £3.2m of contingent consideration, calculated on the expected business growth over the earn-out periods rather than the business performance reported within this report. At the current level of business performance, the total of contingent consideration, whether treated as consideration or remuneration for post-combination services, would be approximately £3.9m. Further, the reported aEBITDA of £5.8m includes only a partial year of profit contribution from companies acquired during the year. As at 31 March 2026 the run-rate aEBITDA of the Group stands at approximately £6.8m. Adjusting for these two factors gives a Leverage of 1.8x. The Board regards this as an appropriate level and a sound base from which to keep executing the strategy.
Through FY26 the acquisition programme was supported by the facilities arranged with Shawbrook Bank in the prior year, with significant headroom maintained against the covenant limits. Gross Leverage, being total debt, excluding consideration payable contingent on future earnings growth, to adjusted EBITDA, was not to exceed 3.80:1.00. Debt service cover, being the ratio of cash flows available for debt service to the total of debt service, not to be less than 1.10:1.0.
After the year end, on 20 May 2026, we refinanced the Shawbrook facility, signing a committed £25.0m revolving credit facility with Santander UK plc alongside a £10.0m uncommitted accordion. We drew £10.7m to repay the Shawbrook borrowings in full, leaving the balance available for further acquisitions. The facility runs for four years to 20 May 2030, extendable by a further year, and is priced on a ratchet of 2.00% to 3.00% over SONIA according to leverage. The Gross Leverage covenant is increased to 4.00:1.00 initially, reducing to 3.50:1.00 on 1 April 2028. Debt service cover has been replaced with Interest Cover, being EBITDA divided by Net finance charges being no less than 4.00:1.00. The new structure lowers our cost of capital and gives us materially greater flexibility as we scale.
Treasury policies and capital allocation
Our capital allocation priorities are unchanged and set out earlier in this report.
Surplus funds are held on short-term deposit to ensure liquidity for working capital and to be readily available for future acquisition opportunities.
The Board keeps the Group's long-term financing structure under continual review. Where possible, acquisitions will be financed from the Group's free cash flow. Beyond that, we will use leverage selectively to expand our deployable capital, allowing us to pursue more opportunities without undue dilution. We do so conservatively, keeping Group-wide leverage below 3x aEBITDA.
Outlook
We began the new year with real momentum. Before any further M&A, the Group is already running at annualised revenue of around £25.0m on an aEBITDA margin of 27%. With our "Gate 4" milestone of £5m of annualised aEBITDA now behind us, attention turns to "Gate 5" and £15m of annualised aEBITDA. The pipeline is healthy and continues to surface opportunities that meet our criteria.
Iain Brown
Chief Financial Officer
Consolidated statement of comprehensive income
|
FOR THE YEAR ENDED 31 MARCH 2026 |
Note |
2026 |
2025 |
|
|
|
£000 |
£000 |
|
Revenue |
2 |
22,261 |
18,274 |
|
Direct costs |
|
(4,630) |
(5,028) |
|
Gross profit |
|
17,631 |
13,246 |
|
Staff costs |
|
(8,532) |
(7,433) |
|
Other operating charges |
|
(2,374) |
(2,404) |
|
Depreciation and amortisation |
5 |
(6,121) |
(4,608) |
|
Profit on disposal of domain |
|
- |
1,712 |
|
Value adjustment of consideration payable |
6 |
119 |
191 |
|
Operating profit |
2 |
723 |
704 |
|
|
|
|
|
|
Financial income |
|
66 |
386 |
|
Financial expenses |
|
(1,834) |
(887) |
|
Value adjustment on bond settlement |
6 |
- |
(874) |
|
Net financing expense |
|
(1,768) |
(1,375) |
|
|
|
|
|
|
Loss before tax |
|
(1,045) |
(671) |
|
Tax credit |
3 |
236 |
342 |
|
Loss for the year |
|
(809) |
(329) |
|
Other Comprehensive income |
|
|
|
|
Items that may be reclassified subsequently to profit or loss |
|
|
|
|
Exchange differences on translation of foreign subsidiaries |
|
132 |
(64) |
|
Loss and total comprehensive income for the year |
|
(677) |
(393) |
|
Earnings per share attributable to the ordinary equity shareholders of Software Circle plc basic and diluted1, pence per share |
4 |
(0.21)p |
(0.08)p |
(1) Earnings per share suffers no dilution as the Group has reported a net loss after tax
Consolidated statement of financial position
|
AT 31 MARCH 2026 |
Note |
2026 |
2025 |
|
|
|
£000 |
£000 |
|
Non-current assets |
|
|
|
|
Property, plant and equipment |
|
601 |
764 |
|
Intangible assets |
5 |
36,086 |
26,862 |
|
Total non-current assets |
|
36,687 |
27,626 |
|
Current assets |
|
|
|
|
Inventories |
|
19 |
26 |
|
Trade and other receivables |
|
2,118 |
1,881 |
|
Cash and cash equivalents |
|
3,937 |
8,566 |
|
Total current assets |
|
6,074 |
10,473 |
|
Total assets |
|
42,761 |
38,099 |
|
Current liabilities |
|
|
|
|
Trade and other payables |
|
4,278 |
3,830 |
|
Other interest-bearing loans and borrowings |
6 |
4,200 |
2,692 |
|
Total current liabilities |
|
8,478 |
6,522 |
|
Non-current liabilities |
|
|
|
|
Other interest-bearing loans and borrowings |
6 |
11,151 |
8,108 |
|
Deferred tax liabilities |
|
2,290 |
2,075 |
|
Total non-current liabilities |
|
13,441 |
10,183 |
|
Total liabilities |
|
21,919 |
16,705 |
|
Net assets |
|
20,842 |
21,394 |
|
Equity attributable to equity holders of the parent |
|
|
|
|
Share capital |
7 |
3,901 |
3,901 |
|
Merger reserve |
|
838 |
838 |
|
Share premium |
|
28,255 |
28,255 |
|
Share based payment reserve |
|
268 |
143 |
|
Translation reserve |
|
117 |
(15) |
|
Retained earnings |
|
(12,537) |
(11,728) |
|
Total equity |
|
20,842 |
21,394 |
Consolidated statement changes in shareholders' equity
|
YEAR ENDED 31 MARCH 2026 |
|
||||||
|
|
Share capital |
Merger reserve |
Share premium |
Share based payment reserve |
Translation reserve |
Retained earnings |
Total |
|
|
£000 |
£000 |
£000 |
£000 |
£000 |
£000 |
£000 |
|
Balance at 31 March 2024 |
3,901 |
838 |
28,255 |
37 |
58 |
(11,408) |
21,681 |
|
Total comprehensive income for the year |
- |
- |
- |
- |
(64) |
(329) |
(393) |
|
Transfer of translation reserve on closure of foreign subsidiaries |
- |
- |
- |
- |
(9) |
9 |
- |
|
Share option charge |
- |
- |
- |
106 |
- |
- |
106 |
|
Total movement in equity |
- |
- |
- |
106 |
(73) |
(320) |
(287) |
|
Balance at 31 March 2025 |
3,901 |
838 |
28,255 |
143 |
(15) |
(11,728) |
21,394 |
|
|
|
|
|
|
|
|
|
|
Total comprehensive income for the year |
- |
- |
- |
- |
132 |
(809) |
(677) |
|
Share option charge |
- |
- |
- |
125 |
- |
- |
125 |
|
Total movement in equity |
- |
- |
- |
125 |
132 |
(809) |
(552) |
|
Balance at 31 March 2026 |
3,901 |
838 |
28,255 |
268 |
117 |
(12,537) |
20,842 |
|
|
|
|
|
|
|
|
|
Consolidated statement of cash flows
|
FOR YEAR ENDED 31 MARCH 2026 |
Note |
2026 |
2025 |
|
|
|
£000 |
£000 |
|
Cash flows from operating activities |
|
|
|
|
Loss for the year |
|
(809) |
(329) |
|
Adjustments for: |
|
|
|
|
Depreciation, amortisation and impairment |
|
6,121 |
4,789 |
|
Loss / (profit) on disposal of plant and equipment |
|
3 |
(223) |
|
Profit on disposal of intangible assets |
|
- |
(1,712) |
|
Share based payments |
|
125 |
106 |
|
Financial income |
|
(66) |
(386) |
|
Financial expense |
|
1,834 |
887 |
|
Value adjustment on bond settlement |
|
- |
874 |
|
Bad debt (credit) / expense |
|
(79) |
83 |
|
Tax credit |
|
(236) |
(342) |
|
Value adjustment on consideration payable |
|
(119) |
(191) |
|
Operating cash flow before changes in working capital and provisions |
|
6,774 |
3,556 |
|
Change in trade and other receivables |
|
297 |
978 |
|
Change in inventories |
|
7 |
7 |
|
Change in trade and other payables |
|
(592) |
(1,601) |
|
Cash generated from operations |
|
6,486 |
2,940 |
|
Corporation tax paid |
|
(548) |
(156) |
|
R&D tax income received |
|
- |
158 |
|
Net cash inflow from operating activities |
|
5,938 |
2,942 |
|
Cash flows from investing activities |
|
|
|
|
Purchase of property, plant and equipment |
|
(42) |
(61) |
|
Disposal of property, plant and equipment |
|
- |
46 |
|
Disposal of intangible assets |
|
- |
1,712 |
|
Capitalised development expenditure |
5 |
(1,825) |
(1,292) |
|
Purchase of other intangible assets |
|
- |
(16) |
|
Interest received |
|
66 |
329 |
|
Acquisition of subsidiaries net of cash |
8 |
(8,925) |
(7,367) |
|
Payment of deferred consideration |
|
(2,309) |
(1,318) |
|
Net cash used in investing activities |
|
(13,035) |
(7,967) |
|
Cash flows from financing activities |
|
|
|
|
Proceeds from loans |
6 |
4,250 |
6,700 |
|
Repayment of loans |
|
(696) |
(7,361) |
|
Finance costs paid |
|
(899) |
(913) |
|
Capital payment of lease liabilities |
|
(156) |
(132) |
|
Interest payment of lease liabilities |
|
(48) |
(84) |
|
Net cash generated from / (used in) financing activities |
|
2,451 |
(1,790) |
|
Net decrease in cash and cash equivalents |
|
(4,646) |
(6,815) |
|
Foreign exchange movements |
|
17 |
(10) |
|
Cash and cash equivalents at the start of the year |
|
8,566 |
15,391 |
|
Cash and cash equivalents at the end of the year |
|
3,937 |
8,566 |
|
|
|
|
|
Notes to the financial statements
1. BASIS OF PREPARATION
GENERAL INFORMATION
Software Circle plc (the "Company") is a public limited company incorporated and domiciled in the UK. The Company's registered office is C/O Gateley Legal, Ship Canal House, 98 King Street, Manchester, England, M2 4WU.
The financial information set out herein does not constitute statutory accounts as defined in Section 434 of the Companies Act 2006. The financial information for the year ended 31 March 2026 has been extracted from the Company's audited financial statements which were approved by the Board of Directors on 22 July 2026 and which, if adopted, will be delivered to the Registrar of Companies for England and Wales. Statutory accounts for the years ended 31 March 2026 and 31 March 2025 have been reported on by the auditor. Their report in respect of both years (i) was unqualified; (ii) did not include a reference to any matters which the auditor drew attention by way of emphasis without qualifying their audit report and (iii) did not contain a statement under section 498(2) or 498 (3) of the Companies Act 2006.
GOING CONCERN
As part of the consideration of the appropriateness of adopting the going concern basis of accounting, the Directors have prepared a base case forecast and then applied reasonable sensitivities.
As at the balance sheet date, the Company maintained a substantial cash balance, providing a strong liquidity position to support its business operations and strategic growth plans. The cash reserves are considered sufficient to meet the current operational requirements and short-term obligations of the Company.
The Company's primary strategic objective includes expansion through acquisitions, which involves inherent risks, particularly concerning deferred consideration payments. While the Company has a significant cash balance, the Directors recognise the following risks:
· Acquisition volume and payment obligations: The risk of acquiring multiple companies in a short time frame could potentially strain the Company's liquidity if not managed prudently.
· Deferred consideration payments: The Company must ensure that it can meet deferred consideration payments as they fall due, without compromising its operational liquidity.
To mitigate these risks, the Directors have implemented the following measures:
· Due diligence and acquisition strategy: Rigorous due diligence processes are in place to evaluate potential acquisition targets, ensuring that each acquisition aligns with the Company's strategic objectives and financial capacity.
· Cash flow forecasting and management: Detailed cash flow forecasting is conducted regularly to project the timing and amounts of deferred consideration payments, ensuring that adequate cash reserves are maintained.
· Contingency planning: Contingency plans are established to address any potential shortfalls in liquidity, including securing additional financing if necessary.
Since the year end, the Group has further strengthened its liquidity position. On 20 May 2026, it entered into a new committed £25.0m revolving credit facility with Santander UK plc, together with a £10.0m uncommitted accordion option, replacing its previous facilities with Shawbrook Bank Limited. The facility has a four-year term and provides additional committed headroom to fund operations and the acquisition strategy across the going concern assessment period.
After considering the Group's cash position, the new committed facility and headroom available to it, the comprehensive risk management strategies in place, and the ability to adjust the pace of acquisitions if required, the Directors have a reasonable expectation that the Group and Company have adequate resources to continue in operational existence for the foreseeable future. Accordingly, they continue to adopt the going concern basis in preparing the financial statements.
CRITICAL ACCOUNTING ESTIMATES AND JUDGEMENTS
The preparation of the financial statements requires management to make judgements, estimates and assumptions that affect the application of the accounting policies and the reported amounts of assets, liabilities, income and expenses. Actual results may differ from these estimates.
Estimates and underlying assumptions are reviewed on an ongoing basis. Revisions to accounting estimates are recognised in the period in which the estimate is revised and in any future periods affected.
Significant areas of estimation uncertainty and critical judgements in applying accounting policies that have the most significant effect on the amounts recognised in the financial statements are described below:
CAPITALISATION OF DEVELOPMENT COSTS
The Board considers that the Group's key differentiators stem from its proprietary software. It is essential to continue investing in these assets. Separate projects are defined for new initiatives as they are identified. Development costs are capitalised where a project has been defined, tested and expected to realise future economic benefits. Programming is carried out to a detailed specification and schedule. The Board exercises judgement in determining the costs to be capitalised and determine the useful economic life to be applied typically 3 years or whilst the asset in question remains in use. The amounts capitalised are disclosed in note 5.
FAIR VALUE ASSESSMENT OF A BUSINESS COMBINATION
Following an acquisition the Group makes an assessment of all assets and liabilities, inclusive of making judgements on the identification of specific intangible assets which are recognised separately from goodwill. Where future consideration is contingent on a performance obligation, judgement is required in assessing the likelihood of the obligation being achieved when determining its fair value at the time of acquisition. Acquired intangible assets include items such as the customer base and technology, to which a value is first attributed at the time of acquisition. The valuation is based upon future discounted cash flows and expectations for the business and requires a number of judgements to be made regarding future performance of an acquisition. For VMS businesses acquired in line with the Group's stated strategy, the expected useful lives of the customer base has been determined by reviewing the existing customer churn at the time of acquisition whilst the Technology's expected useful life is estimated based on the expected requirement for ongoing development. See note 8.
IMPAIRMENT OF INTANGIBLE ASSETS
In assessing impairment, Management estimates the recoverable amount of cash generating units based on expected future cash flows and uses the weighted average cost of capital to discount them. At the end of each reporting period the Management reviews a five year forward looking financial projection including a terminal value for the Group. The Management has further evaluated the terminal growth expectations and the applied discount rate applicable to derive a Net Present Valuation (NPV) of the Group. If the NPV of the Group shows a lower valuation than the net assets or the Company cost of investment in subsidiaries plus intercompany balances due, an impairment will be made. Based on this evaluation, including management estimates and assumptions, no impairment was made during the reporting period. Estimation uncertainty relates to assumptions about future operating results in particular sales volumes and the determination of a suitable discount rate.
ESTIMATION OF THE EXPECTED CREDIT LOSSES ON TRADE RECEIVABLES
In assessing the expected credit losses, in respect of the trade and intercompany receivables under IFRS 9, the Group considers the past performance of the receivable book along with future factors that may affect the credit worthiness of the receivables. Estimations have therefore been made within these assumptions which could affect the carrying value of the trade receivables.
REMUNERATION FOR POST-COMBINATION SERVICES
Where amounts payable to the former owners of an acquired business are contingent on their continued employment, they are treated under IFRS 3 as remuneration for post-combination services rather than as consideration and recognised as an employee expense over the service period. Judgement is required both in reaching this classification and in determining the amount of remuneration earned in the period and to be recognised. The amounts subject to this judgement in respect of the current year acquisitions are disclosed in note 8.
2. REVENUE AND SEGMENTAL INFORMATION
Segmental reporting is prepared for the Group's operating segments based on the information which is presented to the Board, which reviews revenue and adjusted EBITDA by segment. The Group's costs, finance income, tax charges, non-current liabilities, net assets and capital expenditure are only reviewed by the Board at a consolidated level and therefore have not been allocated between segments in the analysis below.
The Group assigns CGUs to operating segments based on the nature of the platform and the clients it serves. Details of which CGUs are assigned to each segment are disclosed in note 5.
|
ANALYSIS BY LOCATION OF REVENUE |
UK & Ireland |
Europe |
Other |
Total |
|
|
£000 |
£000 |
£000 |
£000 |
|
Year ended 31 March 2026 |
21,702 |
66 |
493 |
22,261 |
|
Year ended 31 March 2025 |
17,690 |
122 |
462 |
18,274 |
Revenue generated outside the UK & Ireland is in Belgium, The Netherlands, New Zealand, South Africa and the USA.
No single customer provided the Group with over 1% of its revenue.
DISAGGREGATION OF REVENUE AND OPERATING PROFIT / (LOSS)
|
Year ended 31 March 2026 |
Graphics & Ecommerce |
Professional & financial services |
Health & social care |
Property |
Education |
Operating Total |
Central overhead |
Total |
|
£000 |
£000 |
£000 |
£000 |
£000 |
£000 |
£'000 |
£000 |
|
|
Licence and subscription revenue |
3,281 |
5,517 |
3,854 |
1,865 |
2,328 |
16,845 |
- |
16,845 |
|
Product and service revenue |
4,395 |
665 |
56 |
4 |
296 |
5,416
|
- |
5,416
|
|
Revenue |
7,676 |
6,182 |
3,910 |
1,869 |
2,624 |
22,261 |
- |
22,261 |
|
|
|
|
|
|
|
|
|
|
|
adjusted EBITDA |
1,011 |
2,588 |
1,576 |
948 |
1,504 |
7,627 |
(1,827) |
5,800 |
|
Development costs |
333 |
689 |
635 |
157 |
11 |
1,825 |
- |
1,825 |
|
Acquisition costs |
- |
- |
- |
- |
- |
- |
(838) |
(838) |
|
Share based payment charges |
(6) |
(3) |
(3) |
- |
(1) |
(13) |
(112) |
(125) |
|
Exceptional items |
40 |
(5) |
28 |
- |
- |
63 |
- |
63 |
|
Value adjustments on contingent consideration |
- |
- |
- |
- |
- |
- |
119 |
119 |
|
Depreciation and amortisation |
(773) |
(199) |
(271) |
(50) |
(29) |
(1,322) |
(4,799) |
(6,121) |
|
Operating profit / (loss) |
605 |
3,070 |
1,965 |
1,055 |
1,485 |
8,180 |
(7,457) |
723 |
Exceptional items
In the prior year, £283,000 of restructuring costs were provided for the closure of an unprofitable trading location within the Nettl business. Following a negotiated exit the provision was not fully utilised, resulting in a £40,000 credit in the Graphics and Ecommerce segment. £5,000 of restructuring costs were incurred in our Professional & financial services division due to legal entity structure simplification work following the acquisition of Artificial Intelligence Finance Limited. Our Health & Social Care recognised exceptional income of £28,000 in relation to a write-off of a legacy balance.
|
Year ended 31 March 2025 |
Graphics & Ecommerce |
Professional & financial services |
Health & social care |
Property |
Education |
Operating Total |
Central overhead |
Total |
|
£000 |
£000 |
£000 |
£000 |
£000 |
£000 |
£'000 |
£000 |
|
|
Licence and subscription revenue |
3,474 |
2,842 |
3,488 |
1,618 |
1,279 |
12,701 |
- |
12,701 |
|
Product and service revenue |
5,203 |
289 |
62 |
4 |
15 |
5,573 |
- |
5,573 |
|
Revenue |
8,677 |
3,131 |
3,550 |
1,622 |
1,294 |
18,274 |
- |
18,274 |
|
|
|
|
|
|
|
|
|
|
|
adjusted EBITDA |
974 |
1,162 |
1,337 |
784 |
495 |
4,752 |
(1,586) |
3,166 |
|
Development costs |
307 |
287 |
616 |
63 |
19 |
1,292 |
- |
1,292 |
|
Acquisition costs |
- |
- |
- |
- |
- |
- |
(479) |
(479) |
|
Share based payment charges |
- |
- |
- |
- |
- |
- |
(106) |
(106) |
|
Exceptional items |
(283) |
- |
(55) |
- |
- |
(338) |
1,586 |
1,248 |
|
Value adjustments on contingent consideration |
- |
- |
- |
- |
- |
- |
191 |
191 |
|
Depreciation and amortisation |
(578) |
(256) |
(174) |
(29) |
(27) |
(1,064) |
(3,544) |
(4,608) |
|
Operating profit / (loss) |
420 |
1,193 |
1,724 |
818 |
487 |
4,642 |
(3,938) |
704 |
Exceptional items
On 2 April 2024, the Company announced the sale of the printing.com domain to JAL Equity Corp for £1,772,000. Related disposal costs totalled £60,000. In November 2024 the Company entered into a new financing facility and incurred associated legal and professional fees of £126,000. £55,000 of restructuring costs were incurred in our Health & social care division to enable the required reinvestment into development of the operating unit's platform, future proofing and preparing that business for growth. £283,000 of restructuring costs were provided for in our Graphics & Ecommerce division for the closure of an unprofitable trading location within the Nettl business.
Location of non-current assets
Of the Group's non-current assets (excluding deferred tax) of £36,687,000 (2025: £27,626,000), £26,798,000 (2025: £23,959,000) are located in the UK. Non-current assets located outside the UK are in Ireland and total £9,889,000 (2025: £3,667,000).
|
3. TAXATION |
|
|
|
Recognised in the income statement |
2026 |
2025 |
|
|
£000 |
£000 |
|
Current tax expense |
|
|
|
UK corporation tax charge |
118 |
86 |
|
Overseas corporation tax charge |
251 |
2 |
|
Adjustments for prior years |
108 |
(14) |
|
|
477 |
74 |
|
Deferred tax expense |
|
|
|
Origination and reversal of temporary differences |
(593) |
(483) |
|
Adjustments in respect of prior periods |
(120) |
67 |
|
|
(713) |
(416) |
|
|
|
|
|
Total tax in income statement |
(236) |
(342) |
RECONCILIATION OF EFFECTIVE TAX RATE
Factors affecting the tax charge for the current period:
The current tax credit for the period is lower (2025: higher) than the standard rate of corporation tax in the UK of 25% (2025: 25%).
|
The differences are explained below: |
|
|
|
|
2026 |
2025 |
|
|
£000 |
£000 |
|
Loss before tax |
(1,045) |
(671) |
|
Tax using the UK corporation tax rate of 25% (2025: 25%) |
(261) |
(168) |
|
Effects of: |
|
|
|
Other tax adjustments, reliefs and transfers |
(98) |
(132) |
|
Adjustments in respect of prior periods - current tax |
108 |
(14) |
|
Adjustments in respect of prior periods - deferred tax |
(120) |
67 |
|
Deferred tax not recognised |
66 |
- |
|
Chargeable losses |
- |
(124) |
|
Impact of tax in a foreign jurisdiction |
69 |
29 |
|
Total tax credit |
(236) |
(342) |
The Group tax debtor amounts to £163,000 (2025: £96,000) and tax creditor amounts to £210,000 (2025: £331,000). The deferred tax liabilities as at 31 March 2026 have been calculated using the tax rate of 25% which was substantively enacted at the balance sheet date.
4. EARNINGS PER SHARE
The calculations of earnings per share are based on the following profits and numbers of shares:
|
|
2026 |
2025 |
|
|
£000 |
£000 |
|
Loss after taxation for the financial year |
(809) |
(329) |
|
Weighted average number of shares |
2026 |
2025 |
|
For basic earnings per ordinary share |
390,083,306 |
390,083,306 |
|
For diluted earnings per ordinary share |
390,083,306 |
390,083,306 |
|
Basic earnings per share |
(0.21)p |
(0.08)p |
|
Diluted earnings per share |
(0.21)p |
(0.08)p |
The holders of ordinary shares are entitled to receive dividends as declared from time to time and are entitled to one vote per share at meetings of the Company. The holders of deferred shares shall not be entitled to any participation in the profits or the assets of the Company and the deferred shares do not carry any voting rights.
As of 31 March 2026, the dilutive effect of share options would be 7,068,174 (2025: 5,348,211). The calculation is based on the treasury method prescribed in IAS 33. This calculates the theoretical number of shares that could be purchased at the average market price in the period from the proceeds of exercised options. The difference between the number of shares under option and the theoretical number of shares that could be purchased from the proceeds of their exercise is deemed liable to be issued at nil value and represents the dilution.
As the Group has reported a net loss after tax, including the options would be anti-dilutive, therefore all outstanding options have no dilutive effect.
5. INTANGIBLE ASSETS
|
|
Domains & brand |
Software |
Development costs |
Customer Lists |
Technology |
Goodwill |
Other |
Total |
|
|
£000 |
£000 |
£000 |
£000 |
£000 |
£000 |
£000 |
£000 |
|
Cost Balance at 31 March 2024 |
363 |
4,544 |
6,526 |
5,474 |
11,312 |
954 |
139 |
29,312 |
|
Additions |
- |
16 |
1,292 |
- |
- |
- |
- |
1,308 |
|
Arising on acquisition |
- |
- |
- |
2,487 |
3,211 |
8,832 |
- |
14,530 |
|
Disposals |
(337) |
(251) |
- |
(279) |
- |
- |
- |
(867) |
|
Balance at 31 March 2025 |
26 |
4,309 |
7,818 |
7,682 |
14,523 |
9,786 |
139 |
44,283 |
|
Additions |
- |
- |
1,825 |
- |
- |
- |
- |
1,825 |
|
Arising on acquisition (note 8) |
- |
- |
- |
5,125 |
2,296 |
5,881 |
- |
13,302 |
|
Balance at 31 March 2026 |
26 |
4,309 |
9,643 |
12,807 |
16,819 |
15,667 |
139 |
59,410 |
|
Amortisation Balance at 31 March 2024 |
349 |
4,536 |
4,958 |
1,207 |
2,836 |
12 |
112 |
14,010 |
|
Amortisation for the year |
1 |
5 |
573 |
667 |
3,029 |
- |
3 |
4,278 |
|
Disposals |
(337) |
(251) |
- |
(279) |
- |
- |
- |
(867) |
|
Balance at 31 March 2025 |
13 |
4,290 |
5,531 |
1,595 |
5,865 |
12 |
115 |
17,421 |
|
Amortisation for the year |
1 |
5 |
1,102 |
1,027 |
3,764 |
- |
4 |
5,903 |
|
Balance at 31 March 2026 |
14 |
4,295 |
6,633 |
2,622 |
9,629 |
12 |
119 |
23,324 |
|
Net book value At 31 March 2024 |
14 |
8 |
1,568 |
4,267 |
8,476 |
942 |
27 |
15,302 |
|
At 31 March 2025 |
13 |
19 |
2,287 |
6,087 |
8,658 |
9,774 |
24 |
26,862 |
|
At 31 March 2026 |
12 |
14 |
3,010 |
10,185 |
7,190 |
15,655 |
20 |
36,086 |
IMPAIRMENT TESTING
The Group's recognised goodwill amounts to £15,655,000 (2025: £9,774,000). Goodwill and other intangible assets are assigned to Cash Generating Units ("CGUs"). Our primary consideration in defining CGUs is the distinctiveness of business operations and segmentation. Each CGU represents a major line of business or geographical area that generates cash inflows largely independent of other units. The Group has the following identified CGUs with recognised goodwill:
|
|
|
Carrying value of Goodwill |
|
|
CGU |
Operating Segment |
2026 £000 |
2025 £000 |
|
Nettl Systems |
Graphics & Ecommerce |
128 |
128 |
|
Vertical Plus |
Graphics & Ecommerce |
480 |
480 |
|
CareDocs |
Health and Social Care |
17 |
17 |
|
Arc Technology |
Education |
317 |
317 |
|
bethebrand |
Professional & Financial Services |
2,079 |
2,079 |
|
Linkmaker |
Health and Social Care |
2,898 |
2,898 |
|
Total Drive |
Education |
3,855 |
3,855 |
|
Artificial Intelligence Finance |
Professional & Financial Services |
1,339 |
- |
|
Broker Information Services |
Professional & Financial Services |
4,542 |
- |
|
Total |
|
15,655 |
9,774 |
The recoverable amount of goodwill and intangible assets is determined from value in use calculations. The Group prepares cash flow forecasts derived from budgets and five-year business plans. The sales growth relates to all key revenue streams of the business and have been determined based on the experience to date of operating these sales channels and ranges from 2.5% to 30%. Costs have been assumed to increase in line with an inflationary rate of 3%.
For the purposes of impairment testing inflationary growth of 0.5% is assumed beyond this period. A pre-tax discount factor of 12.61% (2025: 13.55%) was applied.
The Directors have considered the sensitivity of the key assumptions. Increasing the pre-tax discount factor to 15.0% would not result in an impairment charge against intangible assets. Should revenue growth be reduced to nil across all business units, and product revenue decline in the first year by 2.5%, no impairment would be recognised. As a result, the intangible assets are not considered to be impaired.
Amortisation and impairment charge
The amortisation charge of £5,903,000 (2025: £4,278,000) is recognised in profit or loss within depreciation and amortisation expenses. No impairment (2025: £nil) was recognised during the year.
6. OTHER INTEREST-BEARING LOANS AND BORROWINGS
|
Current Liabilities |
2026 |
2025 |
|
|
£000 |
£000 |
|
Lease liabilities |
116 |
159 |
|
Loans |
536 |
634 |
|
Deferred consideration |
1,650 |
1,634 |
|
Contingent consideration |
1,898 |
265 |
|
|
4,200 |
2,692 |
|
|
|
|
|
Non-Current Liabilities |
|
|
|
Lease liabilities |
316 |
499 |
|
Loans |
9,487 |
5,678 |
|
Contingent consideration |
1,348 |
1,931 |
|
|
11,151 |
8,108 |
Contingent consideration is where the amount of future consideration payments payable depend on the future performance of the acquired companies. A fair value credit of £119,000 (2025: £191,000) has been recognised in the statement of comprehensive income due to a reduced likelihood of post-acquisition targets being met.
In November 2024 the Company entered into new loan facilities of up to £16,700,000 with Shawbrook Bank Limited over a 5-year period to 22 November 2029.
The facility was split into three parts:
A. £3,350,000 amortising loan repayable monthly over the borrowing term;
B. £3,350,000 repayable in a bullet at the end of the borrowing term;
C. £10,000,000 committed facility, available to be utilised until 22 May 2027.
In the prior year, facilities A and B were drawn and utilised to settle Bearer Bonds with a nominal value of £6,700,000 for £6,700,000 plus accrued interest of £143,000. The carrying value at the date of repurchase was £5,969,000, resulting in a value adjustment on bond settlement of £874,000.
In October 2025, £4,500,000 was drawn from Facility C, partially funding the acquisition of Broker Information Services Limited.
The terms of the facilities included Gross Leverage and Debt Service covenants as follows:
● Gross Leverage, being total debt to EBITDA, not to exceed 3.80:1.00 initially, tapering to 2.50:1:00 by December 2027.
● Debt service cover, not to be less than 1.10:1.00 during the term of the Facilities.
The Bank had a fixed and floating charge over the Group's assets and the Group was in compliance with the above covenants throughout the period.
On 20 May 2026, the Group entered into a new revolving credit facility (the "Facility") with Santander UK plc, replacing the Group's existing facilities with Shawbrook Bank Limited. The Facility comprises a committed £25.0 million revolving credit facility and a £10.0 million uncommitted accordion option, exercisable subject to Santander's credit approval. The Facility has a four-year term, with interest payable at a margin over SONIA on a ratchet of between 2.00% and 3.00% depending on the Group's leverage. The Facility is repayable as a single bullet at the end of the term and is subject to customary financial covenants and security arrangements.
7. SHARE CAPITAL
|
|
|
|
|
In thousands of shares |
Ordinary shares 2026 |
Ordinary shares 2025 |
|
In issue at 1 April |
390,083 |
390,083 |
|
Issued by the Company |
- |
- |
|
Shares on the market at 31 March - fully paid |
390,083 |
390,083 |
|
Allotted, called up and fully paid |
£000 |
£000 |
|
390,083,306 (2025: 390,083,306) ordinary shares of £0.01 each |
3,901 |
3,901 |
|
63 deferred shares of £0.10 each |
- |
- |
|
|
3,901 |
3,901 |
Dividends
During the year and prior year no dividends were proposed or paid. After the balance sheet date, the Board proposed no final dividend would be made (2025: £nil).
8. ACQUISITIONS
Acquisition of Artificial Intelligence Finance Limited (AIF)
The entire issued share capital of Artificial Intelligence Finance Limited, a provider of software to mortgage and insurance brokers and lenders in Ireland, was acquired on 4 August 2025 for consideration of £5,298,000. The initial consideration paid at completion was £3,922,000, with deferred consideration of £514,000 to be paid on the first anniversary of completion. On acquisition, up to a further €4,000,000 was payable contingent upon the achievement of certain targets relating to the future financial performance of AIF, to be achieved over the calendar year 2027. Following the subsequent acquisition of Broker Information Services Limited, this increased to a maximum of €7,500,000, payable contingent upon the achievement of now combined targets for AIF and BIS. Of this €7,500,000, €4,465,000 is additionally contingent upon the continuing employment of certain shareholders. In line with IFRS 3, such amounts are to be recognised as an employee expense over the period in which the related services are provided, rather than being included in the consideration transferred. The consideration was increased by a further £262,000 in respect of surplus cash within the business at the acquisition, £nil of which was paid on completion with the remainder deferred until the agreement of completion accounts. The present value of expected consideration payments at acquisition totalled £5,298,000.
AIF met Software Circle's acquisition criteria by being a software business and having a prominent position in its vertical market. Delivering solutions that generate revenues of a recurring nature.
In the period during the current financial year that AIF was owned by the Group, it contributed revenue of £1,582,000, an aEBITDA of £491,000 and, due to the amortisation of intangibles arising on consolidation, a profit before tax of £1,000. Had it been owned by the Group for the full year, it would have contributed revenue of £2,344,000, an aEBITDA of £611,000 and a loss before tax of £155,000.
Net assets of AIF on acquisition:
|
|
Book Value |
Adjustments |
Fair value |
|
|
£000 |
£000 |
£000 |
|
Customer base |
- |
2,673 |
2,673 |
|
Technology |
- |
1,364 |
1,364 |
|
Development costs |
449 |
(449) |
- |
|
Property plant and equipment |
12 |
- |
12 |
|
Cash and cash equivalents |
329 |
- |
329 |
|
Trade and other receivables |
385 |
- |
385 |
|
Trade and other payables |
(299) |
- |
(299) |
|
Deferred tax |
- |
(505) |
(505) |
|
Net assets acquired |
876 |
3,083 |
3,959 |
|
Consideration |
|
|
5,298 |
|
Goodwill |
|
|
1,339 |
|
|
|
|
|
|
Consideration satisfied by: |
|
|
£000 |
|
Cash on completion |
|
|
3,922 |
|
Deferred consideration |
|
|
776 |
|
Contingent consideration |
|
|
600 |
|
|
|
|
5,298 |
An income approach was used to value contractual customer lists and relationships, using a discount factor of 13.4%. The useful life has been estimated at 10 years. The technology was valued by using a relief from royalty approach, based on a royalty rate of 21% and using a discount factor of 13.4%. The useful life has been estimated at 3 years. The goodwill arising from the acquisition of AIF is attributable to a number of factors, including the specialised knowledge and expertise of the assembled workforce and the market position.
Trade and other receivables include gross contractual amounts due of £385,000 of which £nil was expected to be uncollectible at the date of acquisition.
The deferred tax liabilities recognised represent the tax effect which will result from the amortisation of the intangible assets, estimated using the tax rate substantively enacted at the balance sheet date.
Acquisition of Broker Information Services Limited (BIS)
The entire issued share capital of BIS, a provider of client management and quotation software for the financial broker market in Ireland, was acquired on 10 October 2025 for consideration of £7,152,000. The initial consideration paid at completion was £5,589,000 with deferred consideration of £1,039,000 to be paid on the first anniversary of completion. As mentioned above, the maximum payable under the AIF earnout has been increased by €3,500,000, contingent upon the achievement of now combined earnings targets relating to the future financial performance of AIF and BIS, to be achieved over the calendar year 2027. Of this €3,500,000, €2,084,000 is additionally contingent upon the continuing employment of certain shareholders. In line with IFRS 3, such amounts are to be recognised as an employee expense over the period in which the related services are provided, rather than being included in the consideration transferred. The consideration was increased by a further £16,000 in respect of surplus cash within the business at the acquisition, payable in full on the agreement of completion accounts. The present value of expected consideration payments at acquisition totalled £7,152,000.
BIS met Software Circle's acquisition criteria by being a software business and having a prominent position in its vertical market. Delivering solutions that generate revenues of a recurring nature.
In the period during the current financial year that BIS was owned by the Group, it contributed revenue of £948,000, an aEBITDA of £545,000 and, due to the amortisation of intangibles arising on consolidation, a profit before tax of £264,000. Had it been owned by the Group for the full year, it would have contributed revenue of £1,718,000, an aEBITDA of £703,000 and a profit before tax of £112,000.
Net assets of BIS on acquisition:
|
|
Book Value |
Adjustments |
Fair value |
|
|
£000 |
£000 |
£000 |
|
Customer base |
- |
2,452 |
2,452 |
|
Technology |
- |
932 |
932 |
|
Development costs |
68 |
(68) |
- |
|
Property, plant and equipment |
4 |
- |
4 |
|
Cash and cash equivalents |
257 |
- |
257 |
|
Trade and other receivables |
81 |
- |
81 |
|
Trade and other payables |
(693) |
- |
(693) |
|
Deferred tax |
- |
(423) |
(423) |
|
Net assets acquired |
(283) |
2,893 |
2,610 |
|
Consideration |
|
|
7,152 |
|
Goodwill |
|
|
4,542 |
|
|
|
|
|
|
Consideration satisfied by: |
|
|
£000 |
|
Cash on completion |
|
|
5,589 |
|
Deferred consideration |
|
|
1,055 |
|
Contingent consideration |
|
|
508 |
|
|
|
|
7,152 |
An income approach was used to value contractual customer lists and relationships, using a discount factor of 13.0%. The useful life has been estimated at 10 years. The technology was valued by using a relief from royalty approach, based on a royalty rate of 24.0% and using a discount factor of 13.0%. The useful life has been estimated at 3 years. The goodwill arising from the acquisition of BIS is attributable to a number of factors, including the specialised knowledge and expertise of the assembled workforce and the market position.
Trade and other receivables include gross contractual amounts due of £81,000 of which £nil was expected to be uncollectible at the date of acquisition.
The deferred tax liabilities recognised represent the tax effect which will result from the amortisation of the intangible assets, estimated using the tax rate substantively enacted at the balance sheet date.
9. DEFINITIONS
|
Defined term |
Definition |
Usage |
|
EBITDA |
Earnings before interest, tax, depreciation, amortisation |
Measures our operating efficiency |
|
Adjusted EBITDA (aEBITDA) |
Operating EBITDA less central administration costs |
Adjustments to EBITDA to better measure how efficiently the Group manages our portfolio to generate free cash flow |
|
Operating EBITDA (oEBITDA) |
EBITDA before impairments, share option charges, exceptional costs, acquisition related costs, central administration costs and the capitalisation of qualifying development costs |
Used to measure the performance of decentralised business units without the application of central Software Circle management and overheads |
|
Capital Deployed |
Opening value plus closing value of cash paid, including acquisition related expenditure, in respect of investments in subsidiary companies, divided by 2 |
Provides the average amount of Capital Deployed on the acquisition of subsidiaries during the year |
|
Return On Capital Deployed (ROCD) |
aEBITDA as a percentage of Capital Deployed |
A KPI to measure how efficiently we are deploying the group's total capital invested in acquisitions to generate recurring cash returns after central costs, available for debt service and reinvestment |
|
Operating Return On Capital Deployed (oROCD) |
oEBITDA as a percentage of Capital Deployed |
A KPI to reflect how efficiently we are deploying the Group's total capital invested in acquisitions to generate recurring operational cash returns |
|
Earnings per share |
Net profit / loss for the year divided by the weighted average number of shares |
IFRS performance indicator |
|
Operating Cash Flow Per Share |
Cash flow from operating and other investing activities divided by the weighted average number of shares |
A measure to demonstrate the Group's cash generating ability on a per share basis |
|
Cash flows from other investing activities |
Cash flows from investing activities less acquisition of subsidiaries net of cash and payment of deferred consideration |
Used in the calculation of Operating Cash Flow Per Share |
|
Interest cover ratio |
aEBITDA divided by net finance costs |
Demonstrates the ability to cover interest costs through operating activities |
|
Net debt |
Interest bearing liabilities less cash and cash equivalents |
Used to assess the ability to meet long-term obligations |
|
Net debt / equity ratio |
Net debt divided by equity |
Used to assess the financial leverage |
|
Leverage |
Net debt divided by aEBITDA |
Used to assess the financial leverage |
|
Recurring revenue |
Subscription and contract-based revenue expected to continue into the future |
Estimating future revenue |
|
Run-rate (Revenue, Recurring Revenue, aEBITDA) |
An annualised indication of performance as at the period end, based on contracted recurring revenue and the most recent twelve months of trading. Run-rate measures are not forecasts. |
Estimating future performance |
|
Recurring revenue per head |
Recurring revenue divided by the total number of employees and contractors |
Used to assess operational efficiency |
|
Quality Score |
oEBITDA percentage plus recurring revenue growth percentage |
Measures overall business performance |
|
Organic growth |
In respect of businesses owned for the full year, the change in the current year divided by the total of the previous year plus the effect of additional contributions from acquisitions completing a full year for the first time |
Used to assess the revenue, oEBITDA and aEBITDA performance of our portfolio |
10. ANNUAL REPORT AND NOTICE OF ANNUAL GENERAL MEETING
The Annual Report and Notice of Annual General Meeting ("AGM") will be sent to, or made available to, shareholders in accordance with their mailing preferences on 7 August 2026 and will be available on the Company's website at softwarecircle.com/reports-downloads/ from that date. The AGM is due to be held at 10:00 a.m. on 2 September 2026 at King Street Townhouse Hotel, 10 Booth St, Manchester M2 4AW.
The Board carefully oversees capital allocation guided by what maximises long-term value per share. To this aim our strategy remains to create long term shareholder value through acquiring vertical market software businesses, supporting their organic growth and reinvesting free cash flow generated into further acquisitions to achieve long-term capital compounding. Every pound we deploy in acquisitions is benchmarked against alternative capital allocation options. Whilst the Company has not recently paid dividends and has no share buyback programme in place, the Board considers it appropriate to retain the flexibility to do so in circumstances where such capital allocation would offer the greatest return to shareholders. The Company intends to undergo a capital reduction by way of cancelling the share premium account (the "Share Premium Cancellation"). The Share Premium Cancellation is proposed to be undertaken to create approximately £19.3m of distributable reserves in the accounts of the Company. As a result of the Share Premium Cancellation, future cash generated by the Company would be available for the purposes of paying dividends or making share buybacks should circumstances dictate it appropriate or desirable to do so.
A circular setting out further details of the Share Premium Cancellation, with approval to be sought at the forthcoming AGM, will be sent to, or made available to, shareholders in accordance with their mailing preferences and made available on the Company's website at softwarecircle.com/reports-downloads/ when sending the Annual Report and Notice of AGM on 7 August 2026.
Completion of the Share Premium Cancellation will not affect the rights attached to the Ordinary Shares and will not result in any change to the number of Ordinary Shares in issue (or their nominal value).
RNS may use your IP address to confirm compliance with the terms and conditions, to analyse how you engage with the information contained in this communication, and to share such analysis on an anonymised basis with others as part of our commercial services. For further information about how RNS and the London Stock Exchange use the personal data you provide us, please see our Privacy Policy.

Latest directors dealings
- 13 hours ago City of London Investment Group
- 14 hours ago Kooth
- 14 hours ago THG
- 14 hours ago Origin Enterprises (CDI)
- 14 hours ago Kingfisher