Final Results
Summary by AI BETAClose X
15 January 2026
Safestore Holdings plc
("Safestore", "the Company" or "the Group")
Results for the year ended 31 October 2025
Strong operational performance, investment in future growth and earnings at an inflection point
|
|
2025 |
2024 |
Change (Total) |
Change (CER)2 |
|
FINANCIAL METRICS |
|
|
|
|
|
Total Revenue (£'m) |
234.3 |
223.4 |
4.9% |
5.0% |
|
LFL14 Revenue (£'m) |
228.7 |
221.9 |
|
3.1% |
|
Underlying EBITDAR4 (£'m) |
137.0 |
135.4 |
1.2% |
1.3% |
|
Operating Profit (£'m) |
159.3 |
425.8 |
(62.6%) |
|
|
Underlying Profit before Tax5 (£'m) |
92.9 |
97.0 |
(4.2%) |
|
|
Statutory Profit before Tax (£'m) |
127.1 |
398.6 |
(68.1%) |
|
|
Adjusted Diluted EPRA EPS11 (pence) |
40.3 |
42.3 |
(4.7%) |
|
|
Dividend per share (pence) |
30.70 |
30.40 |
1.0% |
|
|
Balance Sheet Metrics |
|
|
|
|
|
EPRA Basic NTA13 per Share (pence) |
1,129 |
1,091 |
3.5% |
|
|
Net Assets (£'m) |
2,288.4 |
2,226.8 |
2.8% |
|
|
Net cash inflow from operating activities (£'m) |
99.9 |
95.9 |
4.2% |
|
|
Net debt (£'m) |
1,058.6 |
899.5 |
17.7% |
|
|
Loan to value ratio (LTV) %16 |
28.1% |
25.1% |
3.0ppt |
|
|
OPERATING METRICS |
|
|
|
|
|
Maximum Lettable Area ("MLA")8 m sq ft |
9.3 |
8.6 |
8.0% |
|
|
Current Lettable Area ("CLA")3 m sq ft |
8.5 |
8.2 |
3.9% |
|
|
Closing Occupancy7 (% of CLA) |
78.1% |
78.0% |
0.1ppt |
|
|
LFL Closing Occupancy (% CLA) |
81.2% |
80.0% |
1.2ppt |
|
|
Group REVPAF10 (£ / sq ft) |
27.47 |
27.77 |
(1.1%) |
(1.0%) |
|
LFL REVPAF (£ / sq ft) |
28.93 |
28.12 |
|
2.9% |
.
HIGHLIGHTS
Financial and operational progress
· Group revenue at constant exchange rates (CER) up 5.0% to £234.3 million, with 3.1% LFL growth; positive LFL growth across all geographies and increasing contribution from non-LFL stores:
- UK revenue +3.3% improved through the year reaching £167.5 million, with increasing domestic occupancy, unit partitioning and higher average storage rates9 driving LFL growth of 2.4%
- Paris revenue of €52.6 million +2.5% reflects solid LFL growth of 1.3% with increasing occupancy and flat average rates
- Expansion Markets15 total revenue of €26.2 million +27.0%; strong growth in LFL (+13.5%) and non-LFL stores; Spain, Netherlands and Belgium all performed well;
· Underlying store EBITDAR increased by 3.1% to £155.9 million; inflationary cost pressures were partially offset by internal efficiencies, resulting in LFL cost of sales increase of 4.4%, broadly in line with sales and below the previously guided rise of 7-8%
· Underlying EBITDAR was £137.0 million, up 1.2%, lower growth than store EBITDAR growth due to higher administrative costs
· Operating profit down 62.6% to £159.3 million due to lower property revaluation gains of £23.1 million in FY 2025 (FY 2024: £292.2 million)
· Underlying net finance costs increased by £5.0 million to £26.4 million due to increased borrowings to support the store expansion programme
· Underlying profit before tax of £92.9 million declined by 4.2% reflecting the higher interest charge. The resulting Adjusted Diluted EPRA EPS was 40.3p, in line with consensus estimates. Statutory profit before tax of £127.1 million and Basic EPS of 50.9 pence declined 68.1% and 70.1% respectively, as a result of lower fair value gains on investment properties than in FY 2024
· Dividend per share of 30.70p, up 1%, underpinned by robust cash flow from operating activities, in line with progressive dividend policy and reflecting confidence in future prospects
· Balance sheet remained strong with £2.3 billion of net assets growing 2.8% in the year. LTV ratio of 28.1% and interest cover ratio ("ICR")17 of 4.0x; capital structure underpinned by investment property valuation of £3.5 billion
Strategy on track, with pipeline being executed as planned
· Continued focus on REVPAF to optimise trading in our existing store portfolio where we see significant potential to drive further EBITDA growth from both LFL and non-LFL stores. Recently opened (non-LFL) stores on track to meet 10% yield on cost18 hurdle, with stores opened 2016-2021 achieving between 10%-20%
· £80 million investment in store development resulted in MLA growing by a further 8% or 0.7 million sq ft to 9.3 million sq ft in FY 2025, with the addition of 13 new stores and 1 extension, representing the largest organic space increase in our recent history. In total since FY 2023 we have added 1.5 million sq ft, a 19% uplift to MLA
· £38.9 million investment in Italy through a new 50:50 joint venture with Nuveen established in December 2024 with stores performing in line with expectations
· Further enhancement of our technology-led operating model that combines centralised efficiency and local expertise with accelerated AI integration across marketing, pricing, and sales to optimise revenue performance
· We continue to make good progress towards our target of operational net zero with a 22% reduction in emissions intensity to 0.64 kgCO2e/ m2
Outlook and guidance
· Q1 trading to date has shown a continuation of the trend in LFL growth from FY 2025 across all our markets
· FY 2026 outlook: cautiously optimistic with a return to earnings growth
o Underlying LFL cost of sales growth expected to be 3%-6%
o Underlying net finance costs projected to increase by £1-£2 million
o Capital expenditure on new stores of £86 million
o 417k sq ft of additional MLA with a further 678k sq ft MLA in FY 2027 and beyond.
· On track to deliver the £35-£40 million of incremental EBITDA from non-LFL stores and pipeline on stabilisation
Frederic Vecchioli, Safestore's Chief Executive Officer, commented:
"Safestore's performance in FY 2025 reflects strong operational execution and investment in future growth. I want to thank our teams across the business for their hard work and commitment throughout the year. We continued to drive REVPAF and optimise trading across the like-for-like estate, which remains a key engine of profit growth for the Group. We also demonstrated good cost control, and this continues to be a focus. The dividend was up 1%, an important part of the total return for our shareholders.
Our new and recently opened stores are performing well across the portfolio, and, together with the development pipeline of a further 20 stores, are expected to contribute an additional £35-£40 million of EBITDA to the Group upon stabilisation.
We have entered the new financial year with confidence, and on the back of solid trading in the first quarter to date. Safestore is now at an inflection point, where the significant investment we have made in MLA expansion is driving revenue growth and is set to translate into meaningful growth in earnings and long term value creation."
For further information, please contact:
|
Safestore Holdings PLC |
|
|
Frederic Vecchioli, Chief Executive Officer Simon Clinton, Chief Financial Officer |
020 8732 1500 |
|
|
|
|
|
|
|
|
|
|
FTI Consulting |
|
|
Dido Laurimore |
020 3727 1000 |
|
Richard Gotla Oliver Parsons |
safestore@fticonsulting.com |
Analyst and investor presentation
An analyst and investor presentation will be held at 9:30am GMT today, 15 January 2026.
Notes to Editors
· Safestore is the UK's largest self-storage group with 211 stores on 31 October 2025 comprising:
o 139 in the UK (78 in London and the South East, 61 in key metropolitan areas including Manchester, Birmingham, Glasgow, Edinburgh, Liverpool, Sheffield, Leeds, Newcastle, and Bristol)
o 34 in the Paris region
o 16 in Spain
o 15 in the Netherlands
o 7 in Belgium.
o Joint ventures: 7 stores in Germany under a joint venture agreement with Carlyle and 12 stores in Italy under a joint venture agreement with Nuveen.
· As of 31 October 2025, Safestore had a maximum lettable area ("MLA") of 9.28 million sq ft (excluding the expansion pipeline stores) of which 6.67 million sq ft was occupied.
· Safestore was founded in the UK in 1998 and acquired "Une Pièce en Plus" ("UPP") in France in 2004 which was founded in 1998 by the current Safestore Group CEO Frederic Vecchioli.
· Safestore has been listed on the London Stock Exchange since 2007 and entered the FTSE 250 index in October 2015.
· The Group provides storage to around 105,000 personal and business customers and employs over 850 people across the Safestore Group.
Notes
We prepare our financial statements using IFRS but we also use a few adjusted measures in assessing and managing the performance of the business. These measures are not defined under IFRS and they may not be directly comparable with other companies' adjusted measures and are not intended to be a substitute for, or superior to, any IFRS measures of performance. These include like-for-like figures, to aid in the comparability of the underlying business as they exclude the impact on results of purchased, sold, opened or closed stores; and constant exchange rate ("CER") figures are provided to present results on a more comparable basis, removing FX movements. These metrics are disclosed because management review and monitor performance of the business on this basis. We also include a few measures defined by the European Public Real Estate Association ("EPRA"), which are designed to enhance transparency and comparability across the European Real Estate sector; see notes 11 and 13 below and 'Non-GAAP financial information' in the notes to the financial statements.
1 - Where reported amounts are presented either to the nearest £0.1 million or to the nearest 10,000 sq ft, the effect of rounding may impact the reported percentage change.
2 - CER is Constant Exchange Rate (Euro denominated results for the current period are retranslated at the exchange rate effective for the comparative period. Euro denominated results for the comparative period are translated at the exchange rates effective in that period, in order to present the reported results for the current period on a comparable basis).
3 - CLA is Current Lettable Area excludes space not yet fitted out and space which is operationally unavailable from MLA (Maximum Lettable Area). Measured in square feet ("sq ft").
4 - Underlying EBITDAR was previously termed Underlying EBITDA. It is defined as Operating Profit before exceptional items, share-based payments, corporate transaction costs, change in fair value of derivatives, gain/loss on investment properties, depreciation, the net profit from joint ventures and associates, interest and tax. It has been renamed to ensure the name more closely reflects the nature of the financial measure.
5 - Underlying profit before tax is defined as underlying EBITDAR less leasehold costs6, depreciation charged on property, plant and equipment, net profit from joint ventures and associates, and net finance charges relating to bank loans and cash.
6 - Leasehold costs reflect the rental expense and therefore include both the lease liability interest element and the fair value re-measurement of lease liabilities.
7 - Occupancy excludes offices but includes bulk tenancy.
8 - MLA is Maximum Lettable Area. Measured in square feet ("sq ft").
9 - Average storage rate is calculated as the revenue generated from self-storage divided by the average square footage occupied during the period in question.
10 - Revenue per Available Square Foot ("REVPAF") is an alternate performance measure used by the business and is considered by management as the best KPI of economic performance of a mature self-storage asset as it is the net outcome of the occupancy/rate mix plus ancillary sales. It is calculated by dividing revenue for the period by weighted average available square feet for the same period.
11 - Adjusted Diluted EPRA EPS is based on EPRA's definition of Earnings and is defined as profit or loss for the period after tax but excluding corporate transaction costs, change in fair value of derivatives, gain/loss on investment properties and the associated tax impacts. The Company then makes further adjustments for the impact of exceptional items, IFRS 2 share-based payment charges, exceptional tax items, and deferred tax charges. This adjusted earnings is divided by the diluted number of shares. The IFRS 2 cost is excluded as it is written back to distributable reserves and is a non-cash item (with the exception of the associated National Insurance element). Therefore, neither the Company's ability to distribute nor pay dividends are impacted (with the exception of the associated National Insurance element). The financial statements will disclose earnings on a statutory, EPRA and Adjusted Diluted EPRA basis and will provide a full reconciliation of the differences in the financial year in which any LTIP awards may vest.
12 - Cash flow before investing activities is defined as net cash inflow from operating activities less leasehold cost payments..
13 - EPRA's Best Practices Recommendations guidelines for Net Asset Value ("NAV") metrics are EPRA Net Tangible Assets ("NTA"), EPRA Net Reinstatement Value ("NRV") and EPRA Net Disposal Value ("NDV"). EPRA NTA is considered to be the most relevant measure for the Group's business which provides sustainable long term progressive returns and is now the primary measure of net assets. The basis of calculation, including a reconciliation to reported net assets, is set out in note 15 to the financial statements.
14 - Like‐for‐like ("LFL") information includes only those stores which have been open throughout both the current and prior financial years, with adjustments made to remove the impact of new and closed stores, as well as corporate transactions.
15 - Expansion Markets comprise Spain, the Netherlands and Belgium plus income earned in relation to the associate in Germany and the joint venture in Italy.
16 - LTV ratio is loan to value ratio, which is defined as net debt (excluding lease liabilities) as a proportion of the valuation of investment properties and investment properties under construction (excluding lease liabilities).
17 - ICR is interest cover ratio and is calculated as the ratio of underlying EBITDA after leasehold costs to underlying finance charges.
18 - Yield on cost is defined as incremental EBITDA divided by the initial investment in a new store.
Reconciliations between underlying metrics and statutory metrics can be found in the financial review and financial statements sections of this announcement.
CEO REVIEW
Group Summary
Safestore delivered an encouraging performance in FY 2025, with LFL growth improving through the year, a strong non-LFL revenue contribution and further delivery of our store expansion programme. We achieved this against a backdrop of lacklustre GDP growth, demonstrating the resilience of the underlying demand for our self-storage offer. Revenue growth and store EBITDAR performance were robust across all our geographies, notwithstanding the anticipated inflation-driven cost challenges and the profit drag impact of a higher number of new store openings. The slight decline in underlying profit before tax and adjusted diluted EPRA EPS was driven by increased debt to fund the store development programme, which we are confident will contribute significantly to future earnings growth. Overall, the results for the year reflect progress against our strategy to optimise the trading performance of the existing store portfolio and take advantage of selective expansion opportunities, whilst maintaining a strong balance sheet.
Financial summary
Group revenues grew 5.0% (CER) in total to £234.3 million, with LFL sales growth of 3.1% and newly opened (non-LFL) stores contributing £5.9 million of revenue, up from £1.5 million in the prior year. Underlying store EBITDAR was £155.9 million, up 3.2% (CER), a good performance as we absorbed well-documented inflationary cost increases and the incremental costs of rolling out new stores. The underlying LFL cost of sales increase of 4.4% was below our previously guided rate of 7%-8%, helped by operational efficiencies identified during the year which will continue to flow through in FY 2026. LFL store EBITDAR margins remained strong at 67.6%.
Underlying central administrative costs increased by £3.1 million or 19.6% to £18.9 million due to investments in technology capabilities to enhance our data-led customer service and to support our larger portfolio as well as re-established variable pay for Head Office colleagues. This resulted in underlying EBITDAR of £137.0 million, up 1.3% (CER). Net finance costs rose by £5.0 million to £26.4 million due to an increase in borrowings to fund the store expansion programme. This impacted underlying PBT, which declined by 4.2% to £92.9 million. In turn, Adjusted Diluted EPRA EPS fell by 4.7% to 40.3 pence.
Statutory profit before tax was £127.1 million (FY 2024: £398.6 million) reflecting a lower gain on investment properties compared to the prior year. Basic EPS was 50.9 pence (FY 2024: 170.5 pence).
Cash flow before investing activities12 grew to £89.6 million (FY 2024: £86.2 million). We incurred total capex of £109.2 million, including £80 million on new store development compared to £81 million in FY 2024. FY 2025 represented the peak MLA opening year for the current pipeline development which runs to FY 2027 and beyond. Net debt increased by £159.1 million to fund the store programme as planned, with a new five-year term loan of €77.5 million and a new eight-year €70.0 million USPP arranged to refinance a portion of the drawn RCF. The average blended cost of debt fell by 0.5ppt to 3.46% due to lower rates on floating debt facilities and a higher proportion of Euro denominated borrowings following the pro-active conversion of €150 million of drawn facilities from GBP to EUR. Our balance sheet remains strong: interest cover was 4.0x (FY 2024: 4.3x) and LTV stood at 28.1% (FY 2024: 25.1%).
Safestore's capital structure is underpinned by the valuation of our investment properties which was £3,245.9 million (FY 2024: £3,052.9 million) at the year-end reflecting the stable valuation of the LFL estate and growth from the value created by our new store development.
Trading summary
Stores in our LFL portfolio (>two years old and 89% of MLA) delivered revenue growth of 3.1% year on year. LFL closing occupancy was 81.2%, up 1.2ppt, and LFL REVPAF at a Group level was up 2.9% to £28.93. This is a pleasing performance and reflects our relentless focus on optimising trading in our existing store base.
Within the LFL estate, our mature stores (>five years old and 79% of MLA) delivered 1.9% revenue growth through improvements in average storage rate. Also within the LFL estate, our stabilising stores (sites two-five years old and 10% of MLA), delivered good occupancy and REVPAF growth, contributing 1.2ppt of the total 3.1% LFL growth. Their performance underlines the opportunity to drive highly profitable growth as they trade towards more mature occupancy levels.
Non-LFL stores (<two years old and 11% of MLA) delivered strong revenue growth, contributing an additional £4.4 million of sales to the Group (CER) as they quickly grow their occupancy and build REVPAF.
From a geographic perspective, in the UK our performance was driven by higher domestic customer demand and the continued conversion of space to smaller units that command higher rates. The UK business produced encouraging LFL revenue growth of +2.4% and successfully offset inflationary cost pressures and the impact of new store investment to achieve a stable store EBITDAR margin for the year. In Paris, economic conditions remained tough, but the business still produced robust revenue and store EBITDAR growth and demonstrated excellent cost control. Our stores in Expansion Markets (Spain, the Netherlands and Belgium) delivered a strong trading performance and also a significant increase in store EBITDAR as newer stores started covering their costs.
Portfolio and pipeline
We continued to deliver successfully on our new space programme. MLA at the year end was 9.3 million sq ft, an 8% or 0.7 million sq ft increase over the year with 13 new stores added. Our owned portfolio has a total of 211 stores across five geographies with significant strength in dense, metropolitan areas that hold high barriers to entry for new site development. We opened two stores in the UK (+1.7% to regional MLA), four in Paris (+16.8% to regional MLA) and four stores in Spain (taking the number there to 16 and adding 45.5% to regional MLA). New stores are trading in line with our expectations and are on track to meet our hurdle yield on cost return rate of 10%, the highest in the industry. In addition, our newly established joint venture with Nuveen in Italy is performing well and together with our track record gives us confidence that these joint venture relationships provide an excellent route to grow our network.
Looking ahead, we are on track to deliver an additional 416,600 sq ft in FY 2026, a 4.5% uplift to Group MLA. The total pipeline of new space remains at 1.1 million sq ft as at the end of FY 2025, with three further sites added to the pipeline since the half year results.
Platform and technology highlights
We made good progress in building our digital scale and the value of our proprietary 27-year data set of over 2 million lets, further strengthening our competitive advantage. In FY 2025 we accelerated the integration of advanced AI across marketing, pricing and property development capabilities that smaller operators cannot replicate. Major initiatives in marketing - including refining expenditure allocation through a proprietary AI-driven Customer Value Model that optimises pay-per-click spend, the use of Google reviews sentiment tracking and AEO search visibility partnerships - helped to maintain our overall marketing spend at 4.1% of revenues whilst enhancing enquiry capture. In pricing architecture, we developed our predictive modelling which anticipates occupancy trends and churn risks. This enables more proactive revenue management, for example through targeted discounting for low conversion segments. The operational productivity of our sales teams continued to improve with the use of enquiry conversion scoring models and automated sales calls transcript analysis to drive performance coaching and ultimately revenue generation.
Our priorities in FY 2026 are to grow REVPAF across all our stores, continue our efforts to minimise cost growth and find efficiencies, deliver the pipeline of new stores on time and on budget, maintain our disciplined approach to investment and continue with our proactive debt management. Together, we expect these core elements of our strategy will generate long term, sustainable growth in earnings.
Dividend
The Board is pleased to increase the dividend by 1% to 30.70 pence for the full year, of which 20.60 pence is payable as a final dividend in April. We will continue to pursue a progressive dividend policy whilst rebuilding dividend cover over the medium term.
Outlook
We are cautiously optimistic about the year ahead, in which we expect earnings per share growth to resume. Q1 like-for-like growth to date is tracking last year's trends, despite the lacklustre economic environment in many of our markets. We expect the inflationary cost pressures incurred in FY 2025 to ease in FY 2026, alongside further support from cost saving actions. We also anticipate a reduced earnings drag from new stores in FY 2026 as a fewer number of stores will be opened compared to FY 2025.
In FY 2026 we expect:
· LFL cost of sales growth of 3-6%;
· Underlying net finance costs increasing £1-£2 million;
· Year-on-year MLA growth of 4.5% (0.4 million sq ft) in FY 2026 with a further 7.3% MLA in FY 2027 and beyond; and
· Capital expenditure on new stores of £86 million.
Looking ahead, the Board is confident that the market dynamics for self-storage in the UK and Europe remain positive with our portfolio well positioned to deliver growth. We will continue to leverage and finesse our marketing and operational expertise to drive REVPAF and earnings. Growth will be driven by:
· EBITDA growth from LFL stores:
o Mature LFL stores (>five years old), which represent 79% of MLA, through rate improvements, benefits from UK partitioning, and cost inflation easing.
o Contribution from fully invested stabilising LFL stores (between two and five years old), which currently represent 10% of MLA, as they continue up the maturity curve, increase occupancy and build profitability.
· Increasing contribution from our non-LFL stores (1.0 million sq ft or 11% of MLA and < two years old) and our current pipeline of 1.1 million sq ft projected to open over the next few years. This 2.1 million sq ft of space will contribute increasingly to earnings as stores fill occupancy and cover their fixed costs. These stores are expected to generate an incremental £35-£40 million of EBITDA upon stabilisation.
· Our joint ventures in Germany and Italy present an opportunity to expand from a small footprint of stores with a lower initial capital outlay and management fee income. We see the potential for other opportunities with this model to drive longer term portfolio growth.
Trading and Operational Review
|
Trading Data* |
TOTAL |
LIKE-FOR-LIKE |
||||
|
Revenue metrics |
2025 |
2024 |
Change |
2025 |
2024 |
Change |
|
Revenue (millions) |
|
|
|
|
|
|
|
Group (GBP) |
£234.3 |
£223.4 |
4.9% |
£228.7 |
£221.9 |
3.1% |
|
UK (GBP) |
£167.5 |
£162.2 |
3.3% |
£164.8 |
£161.0 |
2.4% |
|
Paris (EUR) |
€52.6 |
€51.3 |
2.5% |
€51.9 |
€51.2 |
1.3% |
|
Expansion Markets (EUR) |
€26.2 |
€20.5 |
27.0% |
€23.0 |
€20.1 |
13.5% |
|
|
|
|
|
|
|
|
|
Average rate (per sq ft) |
|
|
|
|
|
|
|
Group (GBP) |
£30.20 |
£29.85 |
1.2% |
£30.58 |
£29.90 |
2.3% |
|
UK (GBP) |
£30.68 |
£29.94 |
2.5% |
£30.71 |
£29.95 |
2.5% |
|
Paris (EUR) |
€41.81 |
€42.28 |
(1.1%) |
€42.51 |
€42.33 |
0.4% |
|
Expansion Markets (EUR) |
€24.30 |
€23.28 |
4.4% |
€25.29 |
€23.44 |
7.9% |
|
|
|
|
|
|
|
|
|
REVPAF (per sq ft) |
|
|
|
|
|
|
|
Group (GBP) |
£27.47 |
£27.77 |
(1.1%) |
£28.93 |
£28.12 |
2.9% |
|
UK (GBP) |
£29.24 |
£28.85 |
1.3% |
£29.56 |
£28.77 |
2.8% |
|
Paris (EUR) |
€37.33 |
€39.13 |
(4.6%) |
€39.04 |
€39.39 |
(0.9%) |
|
Expansion Markets (EUR) |
€18.79 |
€18.48 |
1.7% |
€23.00 |
€20.38 |
12.9% |
|
|
|
|
|
|
|
|
|
Space and occupancy metrics |
2025 |
2024 |
Change |
2025 |
2024 |
Change |
|
Closing occupancy (million sq ft) |
|
|
|
|
|
|
|
Group |
6.67 |
6.41 |
4.0% |
6.33 |
6.34 |
(0.1%) |
|
UK |
4.52 |
4.54 |
(0.4%) |
4.43 |
4.51 |
(1.8%) |
|
Paris |
1.19 |
1.09 |
8.4% |
1.12 |
1.09 |
3.2% |
|
Expansion Markets |
0.96 |
0.78 |
23.4% |
0.78 |
0.74 |
5.8% |
|
|
|
|
|
|
|
|
|
Closing occupancy (% of CLA) |
|
|
|
|
|
|
|
Group |
78.1% |
78.0% |
0.1ppt |
81.2% |
80.0% |
1.2ppt |
|
UK |
79.9% |
79.6% |
0.3ppt |
80.6% |
80.3% |
0.3ppt |
|
Paris |
81.2% |
81.9% |
(0.7ppt) |
84.8% |
82.7% |
2.1ppt |
|
Expansion Markets |
67.3% |
65.5% |
1.8.ppt |
79.7% |
74.4% |
5.3ppt |
|
|
|
|
|
|
|
|
|
MLA (million sq ft) |
|
|
|
|
|
|
|
Group |
9.28 |
8.59 |
8.0% |
8.24 |
8.23 |
0.1% |
|
UK |
5.98 |
5.88 |
1.7% |
5.79 |
5.81 |
(0.3%) |
|
Paris |
1.66 |
1.42 |
16.8% |
1.40 |
1.37 |
2.1% |
|
Expansion Markets |
1.64 |
1.29 |
27.1% |
1.05 |
1.05 |
- |
|
|
|
|
|
|
|
|
|
CLA (million sq ft) |
|
|
|
|
|
|
|
Group |
8.54 |
8.22 |
3.9% |
7.80 |
7.92 |
(1.6%) |
|
UK |
5.66 |
5.70 |
(0.8%) |
5.49 |
5.61 |
(2.1%) |
|
Paris |
1.46 |
1.34 |
9.3% |
1.32 |
1.31 |
0.6% |
|
Expansion Markets |
1.42 |
1.19 |
20.1% |
0.99 |
1.00 |
(1.2%) |
*all total numbers reported using the reported exchange rate. LFL measures all reported at CER where applicable.
Geographic underlying performance - P&L in Local Currencies
|
|
FY 2025 |
FY 2024 |
||||||
|
Underlying performance |
UK |
Paris |
Exp Mkt |
Total (CER) |
UK |
Paris |
Exp Mkt |
Total (CER) |
|
|
£'m |
€'m |
€'m |
£'m |
£'m |
€'m |
€'m |
£'m |
|
|
|
|
|
|
|
|
|
|
|
LFL |
164.8 |
51.9 |
23.0 |
228.7 |
161.0 |
51.2 |
20.1 |
221.9 |
|
Non-LFL |
2.7 |
0.7 |
3.2 |
5.9 |
1.2 |
0.1 |
0.4 |
1.5 |
|
Total revenue |
167.5 |
52.6 |
26.2 |
234.6 |
162.2 |
51.3 |
20.5 |
223.4 |
|
|
|
|
|
|
|
|
|
|
|
LFL |
109.1 |
39.4 |
14.1 |
154.6 |
108.8 |
37.6 |
11.6 |
150.8 |
|
Non-LFL |
1.0 |
(0.4) |
0.9 |
1.4 |
0.7 |
- |
(0.5) |
0.4 |
|
Total store EBITDAR |
110.1 |
39.0 |
15.0 |
156.0 |
109.5 |
37.6 |
11.1 |
151.2 |
|
LFL store EBITDAR margin |
66.2% |
75.9% |
61.3% |
67.6% |
67.6% |
73.4% |
57.7% |
68.0% |
UK (64% of MLA, 139 stores)
Our operational performance in the UK reflects a continuously improved revenue trajectory through the year. Total revenue was up 3.3% to £167.5 million with LFL growth of 2.4% to £164.8 million.
Driven by increased product adoption, demand from domestic customers remained robust throughout the year, with space occupied up 3.4% at year-end, enabling us to accelerate our partitioning programme by converting larger units into smaller units better suited to domestic customer demand.
The programme is reducing our historical overweight to larger units (>250 sq ft) within our UK portfolio, resulting in more smaller and higher yielding configurations and enabling a more typical 70/30 domestic/business customer split in terms of space occupied. We intend to convert a total of 500,000 sq ft (out of an initial total of approximately 1 million sq ft) of larger units into smaller units over two years and made good progress in FY 2025 with 190,000 sq ft completed. We expect to convert the balance in FY 2026 and 2027. As smaller units have a higher rental value/sq ft, this has a positive impact on the average rate we achieve and ultimately will drive REVPAF growth.
LFL occupancy closed broadly flat year on year at 80.6% with occupied space in units smaller than 250 sq ft increasing 1.4% and occupied space in larger units decreasing by 132,000 sq ft (15.7%). Business occupied space is down 6.2% on FY 2024, with the level impacted by the unit partitioning programme described above. This change in mix to smaller units and domestic customers contributed to the increase of 2.5% in the achieved rate for LFL stores, reflecting the Group's strategy to optimise REVPAF.
In the year there were eleven UK stores still stabilising and included in LFL. These stores, which are between two and five years old, increased their occupancy and provided a meaningful contribution to LFL revenue growth. We expect stabilised occupancy of 85%-90% in our UK LFL portfolio, compared to the 80.6% achieved in FY 2025, with further occupancy growth in stabilising stores expected to be a contributing driver in closing this gap.
In addition to our LFL portfolio we have opened six stores since the end of FY 2023 which are currently classified as non-LFL. These stores contributed £1.5 million to year-on-year revenue growth in the financial year and are performing in line with their expected maturity curve.
The UK LFL store EBITDAR margin fell to 66.2% (FY 2024: 67.6%). This was due to an increase in the LFL cost of sales base of 6.9% to £55.7 million driven largely by inflation-linked increases in the National Living Wage and National Insurance impacting employee costs, and a 10.2% increase in business rates partially offset by savings from integrating call centre activities in stores and improved insurance costs. As a result, UK LFL store EBITDAR increased only slightly by £0.3 million to £109.1 million for the financial year.
The strong growth in revenue from non-LFL stores in the UK led to total EBITDAR for the UK to increase £0.6m or 0.5% year-on-year.
The mix of our customer base is depicted in the table below. The combined impacts of stronger demand from domestic customers and the partitioning of larger units, resulted in the proportion of domestic customers in the UK increasing to 63% of occupied sq ft at the end of FY 2025 (FY 2024: 59%).
|
|
|
|
|
|
|
|
|
Business and domestic Customers FY 2025 |
UK |
Paris |
Exp Mkt |
|
|
|
Domestic Customers |
|
|
|
|
|
|
Numbers (% of total) |
79% |
82% |
90% |
|
|
|
Sq ft occupied (% of total) |
63% |
66% |
83% |
|
|
|
Average length of stay (months) |
17.3 |
22.9 |
21.6 |
|
|
|
|
|
|
|
|
|
|
Business Customers |
|
|
|
|
|
|
Numbers (% of total) |
21% |
18% |
10% |
|
|
|
Sq ft occupied (% of total) |
37% |
34% |
17% |
|
|
|
Average length of stay (months) |
26.0 |
26.4 |
30.4 |
|
|
|
|
|
|
|
|
Paris (18% of MLA, 34 stores)
Our Paris business delivered €52.6 million revenue with LFL growth of 1.3% and non-LFL delivering €0.7 million of revenue. This was a steady result in context of the weaker economic conditions of the region in FY 2025.
On a LFL basis, closing occupancy increased 2.1ppt to 84.8% in the year, reflecting the strength of our unique portfolio of stores located in both city centre and suburban areas and our skills at driving and converting online enquires. The LFL average rate achieved was up 0.4% and LFL REVPAF was down slightly (0.9%) due to an additional 30,000 sq ft of CLA from two store extensions opened in the last 18 months. These extensions will support LFL revenue growth in Paris as they mature.
In FY 2024 and FY 2025, we opened a total of four new stores and one extension in Paris, with a further four in the pipeline which will take the number of stores in the market to 38. Non-LFL stores contributed €0.6 million to year-on-year revenue growth. This 31% growth in MLA means that our portfolio density within central Paris will increase substantially and whilst we expect that the new stores will be significant contributors to growth as they mature in the years ahead, we anticipate that performance of LFL stores may be impacted due to our approach of giving customers choice of storage locations and prices with cross-network space allocation.
The LFL Store EBITDAR margin rose to 75.9% mainly due to LFL cost of sales in Paris falling 8.1% year on year. This reflected a normalising bad debt provision and continued tight cost control, particularly in the dynamic management of staffing including lower store variable pay, together with savings in utilities through using Group procurement.
As a result, LFL store EBITDAR for Paris increased by a healthy 4.8% year on year to €39.4 million. Total store EBITDAR increased at a slightly lower rate of 3.7% reflecting the impact of new store openings.
Expansion Markets (18% MLA, 38 stores)
Our Expansion Markets continued to be a strong contributor to Group growth with LFL revenue increasing 13.5% to €23.0 million year on year and total revenue increasing 27.0% to €26.2 million.
Performance in each market was strong. In Spain (16 stores) revenue grew 22.9% on a LFL basis to €7.7m through both occupancy and rate improvements with growth supported by seven stabilising stores. LFL revenue in the Netherlands (15 stores) of €9.1m and Belgium (7 stores) of €5.5m grew by 10.1% and 13.0% respectively, achieved through both occupancy and rate increases.
LFL closing occupancy increased from 74.4% to 79.7% with the growth in particular coming from stabilising stores in the Netherlands and Spain as they fill up towards the Mature LFL store average level of 85.8% (FY 2024: 84.5%).
New stores and expansions contributed €3.2 million of non-LFL revenue, with growth of €2.8 million in the year, largely through openings in Spain.
Management fees from our joint ventures in Germany and Italy contributed €1.7 million to Expansion Market revenue (FY 2024: €0.8 million).
The LFL store EBITDAR margin increased to 61.3%, up 3.6ppts. LFL costs of sales for Expansion Markets increased 4.7%, reflecting a mix of normal inflationary increases and the timing of maintenance expenses. As a result, Expansion Markets LFL store EBITDAR increased 21.6% with store EBITDAR including non-LFL stores increasing 35.1% year-on-year.
Joint ventures and associates
We have an associate investment with Carlyle in Germany and a joint venture with Nuveen in Italy. These joint ventures represent a route for the Group to access new geographies and expand our managed portfolio with diluted risk and with lower capital deployed. We earn management fees which are recorded in Expansion Market revenue together with our share of the results of the joint ventures themselves.
Our associate in Germany has seven stores totalling 327,000 sq ft with a further five in its pipeline. Safestore owns 10% of the associate. The underlying share of losses for FY 2025, a £0.6 million loss (FY 2024: £nil), reflects one-off professional fees related to the establishment of the business and normalisation of leases.
We entered into the joint venture in Italy in December 2024 through the acquisition of a 50% share in EasyBox at a cost of £38.9 million. EasyBox comprises twelve stores (of which two opened in FY 2025) and is a leading platform in the emerging Italian storage market where the supply of self-storage is equivalent to 3% of that in the UK. The stores are located in the key economic centres of Rome, Florence and northern Italy, and total 821,675 sq ft. and are performing in line with our expectations. The underlying share of profit for FY 2025, a £0.5 million gain (FY 2024: £nil), reflects the profit for the first nine months of the 2025 calendar year.
MLA and CLA space and occupancy by geography
When developing new stores, we occasionally delay the full fit out of the interior of our stores to reflect the phasing of occupancy increases. In addition, through the partitioning programme space can be held as unavailable until it is converted. Together these areas which are still to be fitted out are not available to be leased and are hence excluded from CLA.
|
|
|
|
|
|
|
|
|
|
|
|
|
MLA (m sq ft) |
To be fitted out (m sq ft) |
Operationally unavailable (m sq ft) |
CLA (m sq ft) |
% Occupancy of MLA |
% Occupancy of CLA |
|
|
|
|
|
|
|
|
|
|
|
|
|
UK |
6.0 |
(0.2) |
(0.2) |
5.6 |
75.6% |
79.9% |
|
|
|
Paris |
1.7 |
(0.2) |
(0.0) |
1.5 |
71.3% |
81.2% |
|
|
|
Exp Mkt |
1.6 |
(0.2) |
(0.0) |
1.4 |
58.5% |
67.3% |
|
|
|
Total |
9.3 |
(0.6) |
(0.2) |
8.5 |
71.8% |
78.1% |
|
|
|
|
|
|
|
|
|
|
|
Pan-European platform for growth
Our operating model combines the benefits of centralised expertise with targeted local execution. Core strategic functions, including Marketing, IT, Revenue Management, Finance, and Construction Analytics, are delivered from our UK headquarters enabling efficient, consistent execution across all markets. This platform is integrated with local operational support teams which are deployed specifically in markets where on-the-ground expertise generates incremental value and enhances asset performance.
Digital platform capabilities serve as a critical differentiator within our industry for new lease enquiry generation and revenue optimisation. Our centralised, in-house teams of specialists together with our proprietary data set of years of historical leases enable the development of advanced marketing tools and machine-learning algorithms to drive performance. This provides us with a distinct competitive advantage over most of the market, which consists largely of smaller operators lacking the data depth required to replicate our price/occupancy optimisation approach.
During the year, we accelerated the integration of artificial intelligence ("AI") across our key business functions to drive operational efficiency, optimise revenue generation and enhance investment rigour. This includes in marketing, where we have refined expenditure allocation through a proprietary AI-driven Customer Value Model that optimises pay-per-click spend by feeding enquiry value data back to Google, alongside deploying generative AI to scale multi-lingual content effectively. We further strengthened our digital presence through Google reviews, sentiment tracking and AEO search visibility partnerships, while testing AI-led campaign expansion tools to monitor visibility and sentiment across emerging search platforms. In FY 2025 these initiatives enabled us to enhance our enquiry capture whilst maintaining a stable marketing cost of 4.1% of revenue (FY 2024: 4.1%).
We have further improved our pricing architecture through predictive modelling which anticipates occupancy trends and churn risks, enabling proactive revenue management. This includes targeted discounting for low conversion segments and elasticity modelling to optimize the timing and magnitude of rate management.
The operational productivity of our sales teams continued to improve with the use of enquiry conversion scoring models and automated sales calls transcript analysis to drive performance coaching. Additionally, the imminent rollout of custom AI agents will streamline internal procedural queries and credit control authorisations.
Finally, we bolstered our property development capabilities with demand and rate prediction models that analyse critical site attributes and provide data-driven validation for new site selection, significantly mitigating risk in untested markets and ensuring robust capital deployment.
The Safestore portfolio comprises both automated and staffed facilities. Through our technology platform, we are able to offer customers the option to choose a unit, start a contract fully online, and access their space all without human intervention.
Nevertheless, our data consistently demonstrates that staffed interactions drive superior financial outcomes, including higher conversion rates and better rental yields. In the UK, spontaneous adoption of a fully automated customer journey remained stable at approximately 8%. While 60% of our customers execute their contracts remotely, the majority, particularly first-time users, prioritise interaction with our professional teams before completing their e-contract. This consultative approach helps customers to select the correct unit size (preventing the 'over-estimation' common in self-service) and ensure they have the right level of customer goods protection, and which also supports our yield optimisation. Balancing automation with high value human interaction translates into both an industry-leading ancillary sales contribution (16.1% of total revenue in FY 2025) and REVPAF levels among the highest in the sector, growing by 2.9% on a LFL basis in the year.
We continue to make good progress towards our target of operational net zero with a 22% reduction in emissions intensity to 0.64 kgCO2e/ m2. We now have all stores powered by certified zero-carbon electricity with in-store improvements including fitting high efficiency lighting to customer units and removal of gas heating appliances making further contributions. We install solar panels on new openings where possible and increased our capacity by over 450kWp in FY 2025, and we expect this to further expand in FY 2026 to include fitting panels on mature stores.
Portfolio Review
Our store expansion model
We develop and acquire stores only when opportunities are expected to hit our hurdle rate of return and the investment ensures we remain within our balance sheet parameters through economic cycles. This disciplined approach has served us well, creating a portfolio that is hard to replicate and one that has driven a strong track record of growth whilst navigating the macroeconomic and interest rates cycles.
We focus on acquiring sites in dense, urban areas where we can leverage our scale and operational expertise, and where barriers to entry are high as supply is constrained by strict zoning regulations and a scarcity of suitable development land. This strategy is reflected in our recent development activity: of the 30 stores developed since 2023, three are located in London, five in Paris, ten in Barcelona and Madrid, and six in the Randstad in the Netherlands, reinforcing our market leadership in Europe's most valuable real estate territories. Over time it is expected that these locations will benefit from significant first-mover advantages as prime urban assets are largely irreplicable in today's planning environment, providing strong defensive characteristics in markets with deep and growing demand.
Development programme progress
In recent years we have stepped up our organic development programme to take advantage of new space opportunities and ensure longer term earnings growth for the portfolio. Since the beginning of FY 2023 we have developed 30 new stores totalling 1.4 million sq ft of new space through investing £222 million in new store capital expenditure, expanding the Group's MLA by 19.4% to 9.3 million sq ft.
Included in this, in FY 2025 we opened 13 new stores, adding 0.7 million sq ft to the portfolio which reached 211 stores. These openings mark a third consecutive year of opening eight or more new stores to generate long term growth.
The openings in the year include two in London, four in Paris and seven in Expansion Markets (Spain four stores, the Netherlands two stores, Belgium one store). New store locations are focused on key metropolitan areas in each country.
With these openings, we now have 38 stores in Expansion Markets reflecting our investment in countries where there are relatively low levels of supply and positioning our portfolio to capture the opportunity as these markets grow.
New stores opened added 662,200 sq ft of new space with an additional 15,400 sq ft of new space from the extension. This added 677,600 sq ft of space in total taking Group MLA at 31 October 2025 to 9.3m sq ft.
|
|
|
|
|
|
|
|
|
FY 2025 Stores Opened |
FH/LH |
MLA |
Development Type |
|
|
|
London - Lea Bridge |
FH |
80.9 |
New Build |
|
|
|
London - Walton |
FH |
20.7 |
Conversion |
|
|
|
Paris - East 1 (Noisy-le-Grand) |
FH |
60.0 |
Conversion |
|
|
|
Paris - West 3 (Mantes Buchelay) |
FH |
58.0 |
New Build |
|
|
|
Paris - North West 1 (Taverny) |
FH |
54.0 |
Conversion |
|
|
|
Paris - La Défense |
FH |
38.9 |
New Build |
|
|
|
Pamplona |
FH |
64.5 |
Conversion |
|
|
|
Madrid - North East (Barajas) |
FH |
57.2 |
Conversion |
|
|
|
Madrid - South West (Carbanchel) |
FH |
45.4 |
Conversion |
|
|
|
Barcelona - Central 2 (Manso) |
LH |
19.8 |
Conversion |
|
|
|
Randstad - Amsterdam |
FH |
65.4 |
New Build |
|
|
|
Randstad - Utrecht |
FH |
50.0 |
Conversion |
|
|
|
Brussels - Zaventem |
FH |
47.4 |
New Build |
|
|
|
Extensions |
|
|
|
|
|
|
Paris - Pyrénées |
LH |
15.4 |
Extension |
|
|
|
Total openings and extensions in 2025 |
|
677.6 |
|
|
|
|
|
|
|
|
|
Our portfolio at the end of FY 2025 is shown in the table below.
|
Store Portfolio |
Number of stores |
MLA (m sq ft) |
% of Group MLA |
FY 2025 % increase in MLA |
|
London & South East England |
78 |
3.18 |
34% |
+4.2% |
|
Rest of UK |
61 |
2.80 |
30% |
|
|
UK Total |
139 |
5.98 |
64% |
+1.7% |
|
Paris |
34 |
1.66 |
18% |
+17% |
|
Expansion Markets |
38 |
1.64 |
18% |
+27% |
|
Total Group |
211 |
9.28 |
100% |
+8.0% |
|
Joint ventures (Italy & Germany) |
19 |
1.15 |
|
+251.3% |
|
Total group managed MLA (including joint ventures) |
230 |
10.43 |
|
+17.0% |
The valuation of our portfolio of investment properties increased £193.1 million in the year primarily driven by the completion of developments in the year, with the valuation at year end of £3.25 billion. We have financed our development programme through a combination of retained earnings and debt and as a result, net debt increased in the year by £159.1 million to £1,058.6 million, with the balance sheet remaining strong and comfortably within our covenants. This disciplined approach to capital allocation has allowed us to add 2.5 million sq ft to the portfolio over the last ten years without the need for any equity increases.
Development pipeline
There is a further 1.1 million sq ft of space (20 stores) in the current development pipeline to be delivered from FY 2026 with total associated capex of £219 million (of which £116 million was still to go at the end of FY 2025). Within this are three new sites that have been identified and secured since the FY 2025 half year results. The pipeline continues to reflect our focus on key metropolitan areas across our markets and includes eleven stores in London and SE England, four stores in Paris and one in each of Barcelona and Madrid. In FY 2026 to date, one store has been opened in Paris and one in London.
Our pipeline prioritises acquiring sites subject to planning, ensuring that capital for land or building acquisition is deployed only when construction is imminent, which significantly shortens the investment cycle and accelerates payback timing. The pipeline reflects an average facility size of 55,000 sq ft and avoids the development of oversized stores, which we believe offer materially lower returns on capital due to lower rental rates (a stabilised rate c. 20% less than our portfolio average), higher construction costs and longer permitting timelines.
On completion of the existing pipeline the total investment since the start of FY 2023 will be £441 million funding 2.5 million sq ft of space and 50 new stores. In addition, we have invested a total of £44 million in joint ventures in Germany and Italy, which are generating management fees and provide us with the opportunity to access at scale two large European markets.
Our development hurdle rate is 10% yield-on-cost (defined as incremental EBITDA/initial investment) upon stabilisation, which is usually five to six years from opening with earnings break-even (after the cost of financing) achieved between 18 and 24 months. Consistent with our investment model, new stores typically follow a clear 'J-curve' trajectory: while year 1 reflects the impact of a fixed cost base whilst sales ramp up, stores typically achieve operational break-even towards the end of the first year, followed by rapid yield acceleration in years 2 to 5 as occupancy and rate move towards stabilisation.
Recent vintages of new stores, including those opened in FY 2022 and FY 2023, are tracking in line with these established historical benchmarks towards our hurdle rate, underpinning our confidence in the future revenue contribution from our development pipeline. We expect our non-LFL stores (stores <two years old / opened since FY 2024) together with the existing pipeline to deliver a total of £35-£40 million of incremental EBITDA to the Group upon stabilisation.
Beyond the existing pipeline, our strong cash flow and disciplined approach to capital allocation means that we have financial capacity for further moderate space expansion. We will take advantage of selective opportunities accordingly, including investment in joint ventures, while being mindful of the short term impact on earnings from new store costs and finance expenses.
New stores and extensions opening programme
We have a total pipeline of 20 developments opening in FY 2026 and beyond, which is expected to add a total of 1.1 million sq ft, representing 11.8% of the portfolio MLA as at 31 October 2025. All sites in our development pipeline are new freehold sites. This includes the two new stores below which had already opened in the first two months of the new financial year.
|
|
|
|
|
|
|
|
|
FY 2026 opened since year end |
FH/LH |
MLA |
Development type |
|
|
|
London - Wembley |
FH |
55.3 |
New Build |
|
|
|
Paris - Colombes |
FH |
65.2 |
New Build |
|
|
|
Total opened in 2026 |
|
120.5 |
|
|
|
|
|
|
|
|
|
In addition to the 120,500 sq ft of MLA added in November and December, there is a pipeline of six stores with 296,100 sq ft of MLA projected to be opening during the remainder of FY 2026. This brings a total additional MLA projected to be delivered in FY 2026 to 416,600 sq ft. Of the eight stores to open in FY 2026, five will be in the UK, two in Paris and one in Spain.
|
|
|
|
|
|
|
|
|
|
Remaining FY 2026 openings |
FH/LH |
MLA |
Development type |
Status* |
|
|
|
London - Woodford |
FH |
68.7 |
New Build |
C, UC |
|
|
|
London - Watford |
FH |
57.5 |
New Build |
C, UC |
|
|
|
Hemel Hempstead |
FH |
51.3 |
New Build |
C, UC |
|
|
|
Shoreham |
FH |
47.1 |
New Build |
C, UC |
|
|
|
Paris - West 4 (Orgeval) |
FH |
53.0 |
New Build |
C, UC |
|
|
|
Madrid - Perseo |
FH |
18.5 |
Conversion |
C, UC |
|
|
|
Total remaining openings in 2026 |
|
296.1 |
|
|
|
|
|
|
|
|
|
|
|
* C = completed, CE = contracts exchanged, STP = subject to planning, PG = planning granted, UC = under construction
Our ongoing pipeline of new store developments beyond FY 2026 comprises twelve projects identified which will deliver an additional 678,300 sq ft of new space. Of the twelve developments nine will be in the UK, two in Paris and one in Spain.
|
|
|
|
|
|
|
|
|
|
FY 2027 and beyond openings |
FH/LH |
MLA |
Development type |
Status* |
|
|
|
London - Old Kent Road |
FH |
75.6 |
New Build |
C, STP |
|
|
|
London - Belvedere |
FH |
53.6 |
New Build |
C, STP |
|
|
|
London - Bermondsey |
FH |
50.0 |
New Build |
C, STP |
|
|
|
London - Kingston |
FH |
55.0 |
New Build |
C, PG |
|
|
|
Nottingham - Abbeyfield Road |
FH |
55.0 |
Conversion |
CE, PG |
|
|
|
Woking |
FH |
55.0 |
New Build |
CE, STP |
|
|
|
Norwich |
FH |
52.7 |
New Build |
C, STP |
|
|
|
Swindon |
FH |
52.0 |
New Build |
CE, PG |
|
|
|
Welwyn Garden City |
FH |
51.0 |
New Build |
CE, PG |
|
|
|
Paris - Bry-sur-Marne |
FH |
58.1 |
New Build |
C, UC |
|
|
|
Paris - West 1 (Conflans) |
FH |
56.0 |
New Build |
C, PG |
|
|
|
Barcelona - Hospitalet |
FH |
64.3 |
New Build |
CE, STP |
|
|
|
Total FY 2027 and beyond openings |
|
678.3 |
|
|
|
|
|
|
|
|
|
|
|
CHIEF FINANCIAL OFFICER'S REVIEW
Underlying income statement
The table below sets out the Group's underlying results of operations for the twelve months ended 31 October 2025 ("FY 2025") and the twelve months ended 31 October 2024 ("FY 2024"). To calculate the underlying performance metrics, adjustments are made for the impact of exceptional items, share-based payments, corporate transaction costs, change in fair value of derivatives, gain or loss on investment properties and the associate tax impacts, as well as exceptional tax items and deferred tax. Although not superseding IFRS, management considers this presentation of earnings to be representative of the underlying performance of the business, as it removes the income statement impact of items not fully controllable by management, such as the revaluation of derivatives and investment properties, and the impact of exceptional credits, costs and finance charges.
|
|
|
|
|
|
|
|
|
|
|
|
|
|
|
|
|
|
2025 |
2024 |
Mvmt |
|
|
|
|
|
|
|
|
£'m |
£'m |
% |
|
|
|
|
|
|
|
|
|
|
|
|
|
|
Revenue |
|
|
|
|
234.3 |
223.4 |
4.9% |
|
|
|
Underlying cost of sales |
|
|
|
(78.4) |
(72.2) |
8.6% |
|
|
|
|
Underlying store EBITDAR |
|
|
155.9 |
151.2 |
3.1% |
|
||
|
|
Underlying administrative costs |
|
|
|
(18.9) |
(15.8) |
19.6% |
|
|
|
|
Underlying EBITDAR |
|
|
|
137.0 |
135.4 |
1.2% |
|
|
|
|
Leasehold costs |
|
|
|
(16.1) |
(15.5) |
3.9% |
|
|
|
|
Underlying EBITDA after leasehold costs |
|
120.9 |
119.9 |
0.8% |
|
|||
|
|
Depreciation |
|
|
|
(1.5) |
(1.5) |
0.0% |
|
|
|
|
Net underlying finance charges |
|
|
|
(26.4) |
(21.4) |
23.4% |
|
|
|
|
Net profit from joint ventures and associates |
|
(0.1) |
(0.0) |
100.0% |
|
|||
|
|
Underlying profit before tax |
|
|
92.9 |
97.0 |
(4.2%) |
|
||
|
|
Current tax |
|
|
|
|
(4.4) |
(4.3) |
2.3% |
|
|
|
Adjusted EPRA earnings |
|
|
88.5 |
92.7 |
(4.5%) |
|
||
|
|
|
|
|
|
|
|
|
||
|
|
Diluted shares (for ADE EPS) (m) |
|
|
219.7 |
219.3 |
0.2% |
|
||
|
|
|
|
|
|
|
|
|
|
|
|
|
Adjusted diluted EPRA EPS (p) |
|
40.3 |
42.3 |
(4.7%) |
|
|||
|
|
|
|
|
|
|
|
|
|
|
The table below reconciles statutory profit before tax in the income statement to underlying profit before tax in the table above.
|
|
|
|
|
|
|
|
|
|
|
2025 |
2024 |
|
|
|
|
|
£'m |
£'m |
|
|
|
Statutory profit before tax |
127.1 |
398.6 |
|
|
|
|
Adjusted for: |
|
|
|
|
|
|
|
- gain on investment properties and investment properties under construction |
(33.4) |
(301.9) |
|
|
|
|
- share of associates non-underlying income |
(2.6) |
- |
|
|
|
|
- share-based payments |
1.1 |
0.3 |
|
|
|
|
- exceptional items |
0.7 |
- |
|
|
|
Underlying profit before tax |
92.9 |
97.0 |
|
|
|
|
|
|
|
|
|
Revenue and underlying profit by region
|
|
|
|
||||||
|
|
2025 |
2024 |
||||||
|
|
UK |
Paris |
Exp Mkt |
Total |
UK |
Paris |
Exp Mkt |
Total |
|
Total Revenue local currency 'm |
167.5 |
52.6 |
26.2 |
- |
162.2 |
51.3 |
20.6 |
- |
|
Average exchange rate |
- |
1.173 |
1.173 |
- |
- |
1.173 |
1.173 |
- |
|
Total revenue (CER) £'m |
167.5 |
44.8 |
22.3 |
234.6 |
162.2 |
43.7 |
17.5 |
223.4 |
|
Underlying EBITDAR (CER) £'m |
96.9 |
29.9 |
10.3 |
137.1 |
99.3 |
28.7 |
7.4 |
135.4 |
|
Foreign exchange |
- |
(0.1) |
- |
(0.1) |
- |
- |
- |
- |
|
Underlying EBITDAR £'m |
96.9 |
29.8 |
10.3 |
137.0 |
99.3 |
28.7 |
7.4 |
135.4 |
Analysis of cost base
Cost of sales
|
|
|
|
|
|
|
|
2025 |
2024 |
Change |
|
|
|
£'m |
£'m |
£'m |
% |
|
Volume related costs including bad debt |
5.7 |
5.7 |
- |
- |
|
Store employees |
24.8 |
23.8 |
1.0 |
4.2% |
|
Marketing |
9.6 |
9.1 |
0.5 |
5.5% |
|
Business rates |
18.3 |
16.9 |
1.4 |
8.3% |
|
Facilities and premises insurance |
15.7 |
15.5 |
0.2 |
1.3% |
|
Underlying LFL cost of sales (CER) |
74.1 |
71.0 |
3.1 |
4.4% |
|
Non-LFL and developments |
4.5 |
1.2 |
3.3 |
275.0% |
|
Foreign exchange |
(0.2) |
- |
(0.2) |
- |
|
Underlying cost of sales |
78.4 |
72.2 |
6.2 |
8.6% |
|
Depreciation |
1.5 |
1.5 |
- |
- |
|
Total cost of sales |
79.9 |
73.7 |
6.2 |
8.4% |
|
|
|
|
|
|
Cost of sales in the financial year continued to be impacted by elevated levels of inflationary cost pressures, particularly in the UK. This led to a 4.4% increase year on year in the underlying LFL cost of sales. The key drivers of this were:
· Volume related costs including bad debt: flat year on year with a normalisation of bad debt provisions in Paris;
· Store employees: a 4.2% increase year on year, driven by higher payroll costs in the UK from National Living Wage increases and rising employer National Insurance costs. This increase was partially offset by savings in the UK where we have integrated call centre activities into stores and lower costs in Paris as a result of dynamic staff management and lower variable pay;
· Marketing: remained stable at 4.1% of sales (FY 2024: 4.1%) reflecting our centrally controlled securing of customer enquiries in a cost-effective manner;
· Business rates: increased 8.3% because of higher charges in the UK from reduced taper relief and inflationary uplifts; and
· Facilities and insurance: increased by only 1.3% in the year due to risk/reward sharing with insurers of the benefit of incident prevention work largely offsetting inflationary increases in energy costs in the UK.
New stores classified as non-LFL incurred costs of £4.5 million in the year resulting in an overall increase in cost of sales of 8.4% to £79.9 million (FY 2024: £73.7 million).
Administrative Expenses
|
|
|
|
|
|
|
|
|
|
|
2025 |
2024 |
Change |
|
|
|
|
|
£'m |
£'m |
£'m |
% |
|
|
|
Underlying administrative expenses (CER) |
18.9 |
15.8 |
3.1 |
19.6% |
|
|
|
Exceptional costs |
0.7 |
- |
0.7 |
- |
|
|
|
Share-based payments |
1.1 |
0.3 |
0.8 |
266.7% |
|
|
|
Foreign exchange |
- |
- |
- |
- |
|
|
|
Total administrative expenses |
20.7 |
16.1 |
4.6 |
28.6% |
|
|
|
|
|
|
|
|
|
Administrative expenses comprise the Head Office costs of the Group. These costs include employee costs, listed company costs, professional fees and IT costs. The key centralised operations of the Group include marketing, price-setting and IT carried out by specialist teams for all markets.
In FY 2025 underlying administrative costs grew £3.1 million, up 19.6%. The key drivers were an increase in spend to enhance our capabilities in AI and data management and finance, together with a return to a more normalised level of variable pay following FY 2024 when performance targets were not met.
Underlying administrative costs exclude exceptional items of £0.7 million comprising investment in a new SAAS-based finance computer system. The implementation of this system is expected to be completed in FY 2026 with further cost in that year. These costs have been excluded from underlying performance due to their scale and irregular nature.
Investment Properties
Cushman & Wakefield Debenham Tie Leung Limited LLP ("C&W") valued the Group's property portfolio as at 31 October 2025. The total value of the Group's investment property portfolio of open stores ("IP") was £3,245.9 million, an increase of £193.1 million over the financial year (31 October 2024: £3,052.8 million).
In addition, investment property under construction ("IPUC") had a value at the balance sheet date of £122.8 million and comprises ongoing developments.
52 of our stores are leaseholds with the lease liabilities included separately on the balance sheet with a corresponding asset included in investment property.
|
|
|
|
|
|
|
|
UK |
Paris |
Exp Mkt |
Total IP |
|
|
£'m |
£'m |
£'m |
£'m |
|
Value of IP as at 1 November 2024 |
2,144.5 |
627.2 |
281.1 |
3,052.8 |
|
Developments and acquisitions* |
49.7 |
36.0 |
44.0 |
129.7 |
|
Disposals |
- |
(5.2) |
(0.8) |
(6.0) |
|
Revaluation |
(8.2) |
4.9 |
26.6 |
23.3 |
|
Foreign exchange |
- |
30.5 |
15.6 |
46.1 |
|
Value of IP as at 31 October 2025 |
2,186.0 |
693.4 |
366.5 |
3,245.9 |
|
|
|
|
|
|
|
IP under construction |
85.1 |
32.8 |
4.9 |
122.8 |
|
IP and IPUC, before lease liabilities |
2,271.1 |
726.2 |
371.4 |
3,368.7 |
|
|
|
|
|
|
|
IP lease liabilities |
79.4 |
21.9 |
10.1 |
111.4 |
|
Total as at 31 October 2025 |
2,350.5 |
748.1 |
381.5 |
3,480.1 |
|
|
|
|
|
|
* includes transfers from Investment Property Under Construction
Property valuation: IP and IPUC, before lease liabilities £'m
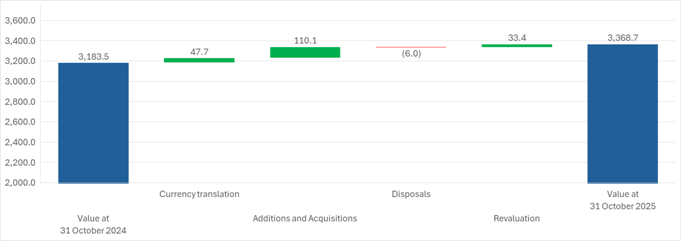
The Group's property portfolio valuation, including investment properties under construction, increased by £185.2 million, including a gain on revaluation of £33.4 million, £110.1 million relating to additions and store refurbishments and a favourable £47.7 million increase in the value of our investment properties due to foreign currency movements.
The revaluation gain was driven by increases from both new and maturing stores reflecting the value created through their development and subsequent stabilisation. The LFL portfolio valuation was stable year on year and there was a small movement in yields, which increased 13bps to 5.32% (FY 2024: 5.19%) and discount rates for future cash flows, which increased 36bps to 9.02% in the year (FY 2024: 8.66%).
Disposals in the year totalled £6.0 million from the sale of excess land and buildings.
In the year, the freehold of an existing store was acquired for £3.5 million (FY 2024: two stores for £13.5 million).
The exchange rate at 31 October 2025 was €1.1375 : £1 compared to €1.1905 : £1 at 31 October 2024.
Gain on revaluation of properties
A full, independent external valuation of the store portfolio is undertaken by the Group on an annual basis for year-end reporting.
As a result of this exercise, the net gain on investment properties during the year was as follows.
|
|
|
|
|
|
|
|
|
|
|
|
|
|
|
|
|
2025 |
2024 |
|
|
|
|
|
|
|
|
£'m |
£'m |
|
|
|
|
|
|
|
|
|
|
|
|
|
Revaluation of investment properties |
|
23.3 |
310.7 |
|
|||
|
|
Revaluation of investment properties under construction |
10.1 |
(8.8) |
|
||||
|
|
Fair value re-measurement of lease liabilities |
|
(10.3) |
(9.7) |
|
|||
|
|
Gain on revaluation of investment properties and investment properties under construction |
23.1 |
292.2 |
|
||||
|
|
|
|
|
|
|
|
|
|
The revaluation of investment properties reflects the increased value of the Group's store portfolio primarily as the new stores begin to trade and deliver in line with our plans. The fair value re-measurement of lease liabilities reflects the reduction in investment property lease liabilities as rent payments are made.
Joint Ventures and Associates
|
|
|
|
|
|
|
|
|
|
Year ended 31 October 2025 |
Italy |
Germany |
Paris |
Total |
|
|
|
|
£'m |
£'m |
£'m |
£'m |
|
|
|
Underlying share of joint venture and associate profit / (loss) |
0.5 |
(0.6) |
- |
(0.1) |
|
|
|
Fair value re-measurement of investment property lease liabilities |
- |
0.2 |
- |
0.2 |
|
|
|
Gain on revaluation of investment property |
2.4 |
- |
- |
2.4 |
|
|
|
Share of profit / (loss) from joint ventures and associates |
2.9 |
(0.4) |
- |
2.5 |
|
|
|
|
|
|
|
|
|
The underlying share of joint venture and associate profit reflects the income for the first nine months of trading (following its acquisition in FY 2025) from our Italian joint venture and the share of loss from our German associate. The result for the German associate includes the impact of one-off professional fees related to the establishment of the business and normalisation of leases. In addition, the result for Italy includes a £2.4 million gain (at share) on the revaluation of the investment property of the joint venture, taking the total share of profit from joint ventures and associates to £2.5 million (FY 2024: £nil).
Operating profit
Reported operating profit was £159.3 million for FY 2025, down £266.5 million, primarily due to a decrease in the investment property revaluation gain.
A bridge from Underlying EBITDAR to operating profit can be found below:
|
|
|
|
|
|
|
|
|
|
|
2025 |
2024 |
|
|
|
|
|
£'m |
£'m |
|
|
|
Underlying EBITDAR |
|
137.0 |
135.4 |
|
|
|
|
|
|
|
|
|
|
Adjusted for |
|
|
|
|
|
|
Gain on revaluation of investment properties |
|
23.1 |
292.2 |
|
|
|
Share of non-underlying earnings from joint ventures and associates |
|
2.5 |
- |
|
|
|
Depreciation |
|
(1.5) |
(1.5) |
|
|
|
Share-based payments |
|
(1.1) |
(0.3) |
|
|
|
Exceptional items |
|
(0.7) |
- |
|
|
|
|
|
|
|
|
|
|
Operating Profit |
|
159.3 |
425.8 |
|
|
|
|
|
|
|
|
Underlying finance charge and net finance costs
The underlying finance costs represent the finance expense before interest on obligations under lease liabilities, changes in fair value of derivatives and exceptional items. It is disclosed as management reviews and monitors the performance of the business on this basis.
The underlying finance costs increased by £5.4 million to £26.9 million (FY 2024: £21.5 million). Interest payable increased £3.1 million reflecting the Group's additional borrowings to fund the development programme with average drawn debt for FY 2025 increasing by £92 million year on year. This was offset by reducing average rate of debt driven by the conversion of €150 million of Euro denominated RCF borrowings into GBP borrowings to take advantage of the lower base rates together with the benefit of falling base rates for our floating rate debt.
A reduction in the number of ongoing developments led to a £2.5 million fall in interest capitalised on store developments to £5.3 million.
Other interest received of £0.5 million in the financial year principally reflects income on cash held, with the year-on-year increase a result of efficiency improvements in cash management.
|
|
|
|
|
|
|
|
|
|
|
2025 |
2024 |
Change |
|
|
|
|
|
£'m |
£'m |
£'m |
% |
|
|
|
Other interest received |
0.5 |
0.1 |
0.4 |
400.0% |
|
|
|
Total finance income |
0.5 |
0.1 |
0.4 |
400.0% |
|
|
|
|
|
|
|
|
|
|
|
Interest payable |
(30.8) |
(27.7) |
(3.1) |
11.2% |
|
|
|
Capitalised interest on developments |
5.3 |
7.8 |
(2.5) |
(32.1%) |
|
|
|
Amortisation of debt issuance costs on loans |
(1.4) |
(1.6) |
0.2 |
(12.5%) |
|
|
|
Underlying finance costs |
(26.9) |
(21.5) |
(5.4) |
25.1% |
|
|
|
|
|
|
|
|
|
|
|
Underlying net finance costs |
(26.4) |
(21.4) |
(5.0) |
23.4% |
|
|
|
|
|
|
|
|
|
The movement in underlying net finance costs can be summarised as follows (£'m):
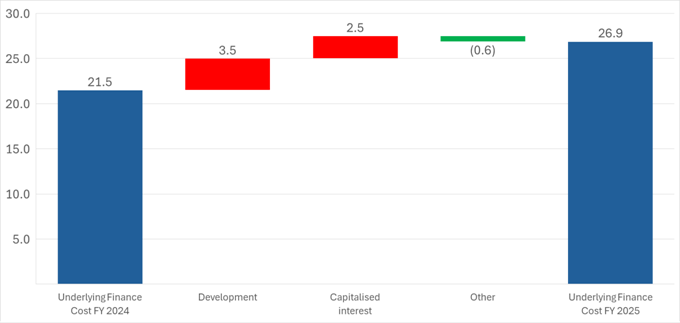
Underlying finance cost to net finance costs
Net finance costs include interest payable, interest on obligations under lease liabilities, fair value movements on derivatives, exchange gains or losses, unwinding of discounts and exceptional finance income.
In the year a floating-rate term loan was drawn at the same time as a matching interest rate swap was put in place, taking the net interest to a fixed rate with a cash flow hedge relationship. The interest on the derivative is show together with that of the term loan.
Interest on lease liabilities was flat at £5.8 million in FY 2025 following the acquisition of the freehold on existing sites and reflects part of the leasehold rental payment. The balance of the leasehold payment is charged through the gain or loss on investment properties in the income statement. Overall, the leasehold cost charge increased by £0.6 million to £16.1 million in FY 2025 (FY 2024: £15.5 million).
The Group undertakes net investment hedge accounting for its Euro denominated borrowings reflecting the natural currency hedge against Euro denominated assets.
Net finance costs increased by £5.0 million to £32.2 million in FY 2025 (FY 2024: £27.2 million).
|
|
|
|
|
|
|
|
|
|
|
2025 |
2024 |
Change |
|
|
|
|
|
£'m |
£'m |
£'m |
% |
|
|
|
Total finance income |
0.5 |
0.1 |
0.4 |
400.0% |
|
|
|
|
|
|
|
|
|
|
|
Underlying finance costs |
(26.9) |
(21.5) |
(5.4) |
25.1% |
|
|
|
Interest on lease liabilities |
(5.8) |
(5.8) |
- |
- |
|
|
|
Total finance costs |
(32.7) |
(27.3) |
(5.4) |
19.8% |
|
|
|
Net finance costs |
(32.2) |
(27.2) |
(5.0) |
18.4% |
|
|
|
|
|
|
|
|
|
Tax
The tax charge for the period is analysed below:
|
|
|
|
|
|
|
|
|
2025 |
2024 |
|
|
|
|
£'m |
£'m |
|
|
|
Underlying current tax charge |
4.4 |
4.3 |
|
|
|
Current tax charge |
4.4 |
4.3 |
|
|
|
|
|
|
|
|
|
Tax on investment properties movement |
14,4 |
21.7 |
|
|
|
Adjustment in respect of prior years |
(2.8) |
(1.3) |
|
|
|
Losses in respect of current year |
- |
1.6 |
|
|
|
Deferred tax charge |
11.6 |
22.0 |
|
|
|
|
|
|
|
|
|
Net tax charge |
16.0 |
26.3 |
|
|
|
|
|
|
|
The net tax charge in the period was £16.0 million (FY 2024: £26.3 million).
The Group is a REIT with no tax charge on profits from its UK property rental business, so the current tax charge relates to Paris and Expansion Markets. The underlying current tax charge for the period amounted to £4.4 million (FY 2024: £4.3m).
Profit after tax
The profit after tax for the period was £111.1 million, compared with £372.3 million in FY 2024, a decrease of £261.2 million which arose principally due to the decreased gain on investment properties, which is explained above.
Earnings per share
Basic EPS was 50.9 pence (FY 2024: 170.5 pence) and diluted EPS was 50.6 pence (FY 2024: 170.1 pence). As explained in note 2 to the financial statements, management considers Adjusted Diluted EPRA EPS to be more representative of the underlying EPS performance of the business.
Adjusted Diluted EPRA EPS is based on the European Public Real Estate Association ("EPRA")'s definition of earnings and is defined as profit or loss for the period after tax excluding corporate transaction costs, changes in fair value of derivatives, exceptional and non-operating items, gain/loss on the fair value of investment properties and the associated tax impacts. The Company then makes further adjustments for the impact of share-based payment charges and deferred tax charges. This adjusted earnings figure is divided by the diluted number of shares. The share-based payment cost is excluded as it is written back to distributable reserves and is a non-cash item (with the exception of the associated National Insurance element). Therefore, neither the Company's ability to distribute nor pay dividends is impacted (with the exception of the associated National Insurance element). The financial statements disclose earnings on a statutory, EPRA and Adjusted Diluted EPRA basis and provide a full reconciliation of the differences in the financial year in which any Long Term Incentive Plan ("LTIP") awards may vest.
Management introduced Adjusted Diluted EPRA EPS as a measure of EPS following the implementation of the Group's LTIP schemes in 2017. Management considers that the real cost to existing shareholders from such schemes is the dilution that they will experience on the granting of shares. Therefore, earnings have been adjusted for the share-based payment charge and the number of shares used in the EPS calculation has also been adjusted for the dilutive effect of the LTIP schemes.
Adjusted Diluted EPRA EPS for the year was 40.3 pence (FY 2024: 42.3 pence), calculated on a pro forma basis, as if the dilutive LTIP shares were in issue throughout both the current and prior years, as follows:
|
|
|
|
||||
|
|
2025 |
2024 |
||||
|
|
Earnings |
Shares |
Pence per |
Earnings |
Shares |
Pence per |
|
|
£'m |
Million |
share |
£'m |
Million |
share |
|
Basic EPS |
111.1 |
218.4 |
50.9 |
372.3 |
218.3 |
170.5 |
|
Adjustments: |
|
|
|
|
|
|
|
Gain on revaluation of investment properties |
(23.1) |
- |
(10.6) |
(292.2) |
- |
(133.9) |
|
Fair value re-measurement of investment properties lease liabilities |
(10.3) |
- |
(4.7) |
(9.7) |
- |
(4.5) |
|
Exceptional Items |
0.7 |
- |
0.3 |
- |
- |
- |
|
Non-underlying joint venture and associate earnings |
(2.6) |
- |
(1.2) |
- |
- |
- |
|
Tax on adjustments |
11.6 |
- |
5.4 |
22.0 |
- |
10.1 |
|
Adjusted Basic EPRA EPS |
87.4 |
218.4 |
40.1 |
92.4 |
218.3 |
42.2 |
|
Share-based payments charge |
1.1 |
- |
0.5 |
0.3 |
- |
0.1 |
|
Dilutive shares |
|
1.3 |
(0.3) |
- |
0.9 |
- |
|
Adjusted Diluted EPRA EPS |
88.5 |
219.7 |
40.3 |
92.7 |
219.2 |
42.3 |
|
|
|
|
|
|
|
|
The Group has exposure to the movement in the Euro/GBP exchange rate. Based on the FY 2025 results, a 10 cent increase to the average exchange rate of 1.178 would cause an impact of £0.4 million to Adjusted EPRA Earnings (FY 2024: £1.7 million).
Dividends per share
Dividends paid in 2025 (comprising the FY 2024 full year and FY 2025 interim dividends) were £66.6 million (30.50 pence per share) (FY 2024: £65.9 million (30.20 pence per share)). A final dividend in respect of the year ended 31 October 2025 of 20.60 pence (FY 2024: 20.40 pence) per share, amounting to a total final dividend of £45.0 million (FY 2024: £44.6 million), ifs to be proposed at the AGM on 18 March 2026. The ex-dividend date will be 12 March 2026 and the record date will be 13 March 2026 with an intended payment date of 14 April 2026. The final dividend has not been included as a liability at 31 October 2025.
The Property Income Distribution ("PID") element of the final dividend is 10.30 pence (FY 2024: 15.30 pence), making the PID payable for the year 12.83 pence (FY 2024: 17.80 pence) per share.
Gearing and Capital Structure
The Group finances its activities through a combination of equity and borrowings. As at 31 October 2025, the Group's borrowings comprise a Revolving Credit Facility ("RCF") and a term loan together with US Private Placement notes ("USPPs").
The drawn debt position as at 31 October 2025 is analysed as follows:
|
|
Facility |
Drawn |
Total rate |
|
|
£/€'m |
£'m |
% |
|
|
|
|
|
|
USPP 2026 - October |
€70.0 |
£61.5 |
1.26% |
|
USPP 2027 |
€74.1 |
£65.1 |
2.00% |
|
USPP 2028 |
€29.0 |
£25.5 |
0.93% |
|
USPP 2029 |
€105.0 |
£92.3 |
2.45% |
|
USPP 2032 |
€70.0 |
£61.5 |
4.03% |
|
USPP 2033 |
€29.0 |
£25.5 |
1.42% |
|
USPP total |
€377.1 |
£331.4 |
2.24% |
|
Term Loan Facility 2030(1) (2) |
€77.5 |
£68.2 |
3.40% |
|
Total fixed rate EUR debt |
€454.6 |
£399.6 |
2.44% |
|
% of total debt |
|
41.5% |
|
|
|
|
|
|
|
USPP 2026 - October |
£35.0 |
£35.0 |
2.59% |
|
USPP 2028 |
£20.0 |
£20.0 |
1.96% |
|
USPP 2029 |
£50.5 |
£50.5 |
2.92% |
|
USPP 2029 |
£30.0 |
£30.0 |
2.69% |
|
USPP 2031 |
£80.0 |
£80.0 |
2.39% |
|
Total fixed rate GBP debt |
£215.5 |
£215.5 |
2.55% |
|
% of total debt |
|
22.4% |
|
|
|
|
|
|
|
Total fixed rate debt |
|
£615.1 |
2.48% |
|
% of total debt |
|
63.9% |
|
|
|
|
|
|
|
RCF - GBP(2) |
£172.0 |
£172.0 |
5.58% |
|
RCF - EUR(2) |
€200.0 |
£175.8 |
3.57% |
|
RCF non-utilisation GBP |
£152.2 |
- |
0.42% |
|
|
|
|
|
|
Total variable rate debt |
£500.0 |
£347.8 |
4.75% |
|
% of total debt |
|
36.1% |
|
|
|
|
|
|
|
Total debt |
|
£962.9 |
3.29% |
|
Capitalised finance costs |
- |
(£4.7) |
- |
|
|
|
|
|
|
Total Borrowings |
£1,115.0 |
£958.2 |
3.46% |
|
|
|
|
|
(1) Floating-rate loan swapped to fixed-rate with a hedging interest rate swap
(2) Includes 5 bps saving for achieving ESG targets
The debt repayment schedule can be summarised as follows (£'m)

The committed facility in the RCF totals £500 million with an expiry in November 2028. As at 31 October 2025, £347.8 million of the £500.0 million RCF was drawn, split £172.0 million and €200.0 million (£175.8 million equivalent).
The Group pays interest on the RCF at an initial margin of 125bps plus SONIA or Euribor. The margin payable is linked to certain ESG targets, which have been met, enabling a reduction in the margin by 5bps to 120bps. In addition, the Group pays a non-utilisation fee of 0.42% on the undrawn facility balance.
USPPs are denominated in Euros and Sterling and incur fixed rates of interest.
The Euro denominated USPPs total €377.1 million over six maturities from 2026 to 2033 with a weighted average interest cost of 2.24% and include a new €70.0 million, 4.03% USPP maturing in 2032 issued during the year. The Sterling denominated USPPs total £215.5 million with maturities between 2026 and 2031 and a weighted average interest rate of 2.55%.
In addition, during the year the Group arranged a five-year floating rate term loan totalling €77.5 million. This loan has been hedged with an interest rate swap with the resulting fixed interest cost of 3.45%.
As at 31 October 2025, 63.9% of the Group's drawn debt attracts fixed rates of interest. Overall, the Group has an effective interest rate on its borrowings of 3.46% as at 31 October 2025, compared with 3.96% at the previous year end.
The Euro denominated borrowings provide a natural hedge against the Group's investment in the Paris and Expansion Markets businesses. Euro denominated debt makes up 59.8% of total Group borrowings.
As at 31 October 2025, the weighted average remaining term for the Group's committed borrowing facilities is 3.5 years with the next maturities, both at 29 October 2026, comprising €70.0 million and £35.0 million USPPs. The weighted average interest rate on these USPPs is 1.74%. As current costs of borrowing are higher than this due to increased base rates, as these and subsequent USPPs are refinanced, there may be higher finance costs for the Group in 2027 and beyond.
Net debt (including lease liabilities) stood at £1,058.6 million at 31 October 2025, an increase of £159.1 million during the year, principally due to increased funding required for store acquisitions and developments. Net debt (excluding lease liabilities) was £947.2 million.
Management measures leverage with reference to its loan to value ("LTV") ratio defined as net debt (excluding lease liabilities) as a proportion of the valuation of investment properties (excluding finance leases), including investment properties under construction. As at 31 October 2025, the Group LTV ratio was 28.1% compared with 25.1% at 31 October 2024.
The Board considers the current level of gearing is appropriate for the business to enable the Group to increase returns on equity, maintain financial flexibility and to achieve our medium term strategic objectives.
Borrowings under the existing loan facilities are subject to certain financial covenants. The RCF, term loan and USPPs share interest cover and LTV covenants. The interest cover requirement is a minimum EBITDA interest of 2.4:1. Interest cover for FY 2025 was 4.0x (FY 2024: 4.3x), calculated on the basis required under our financial covenants.
The LTV covenant is 60% for the Group. As at 31 October 2025, there is significant headroom in the Group LTV covenant calculations.
Loan to value
The following table sets out the drivers of the LTV, which comfortably sits below the Board's targeted 30%-40% level at 28.1% in FY 2025 (FY 2024: 25.1%).
|
|
|
|
|
|
|
|
|
2025 |
2024 |
|
|
|
|
£'m |
£'m |
|
|
|
Current borrowings |
96.5 |
- |
|
|
|
Non-current borrowings |
861.7 |
824.2 |
|
|
|
Cash and cash equivalents |
(11.0) |
(25.3) |
|
|
|
Net debt excluding lease liabilities |
947.2 |
798.9 |
|
|
|
|
|
|
|
|
|
Investment Properties and IPUC |
3,368.7 |
3,183.5 |
|
|
|
Group loan to value |
28.1% |
25.1% |
|
|
|
|
|
|
|
Interest cover ratio
The following table sets out the components of the ICR measure, which was 4.0x in FY 2025 (FY 2024: 4.3x)
|
|
|
|
|
|
|
|
|
2025 |
2024 |
|
|
|
|
£'m |
£'m |
|
|
|
Underlying EBITDAR |
137.0 |
135.4 |
|
|
|
Leasehold costs |
(16.1) |
(15.5) |
|
|
|
Share-based payment National Insurance charge |
0.9 |
(0.6) |
|
|
|
EBITDA (excluding share-based payment NI charge) |
121.8 |
119.3 |
|
|
|
|
|
|
|
|
|
Finance income |
0.5 |
0.1 |
|
|
|
Finance expense |
(26.9) |
(21.6) |
|
|
|
Capitalised interest |
(5.3) |
(7.8) |
|
|
|
Amortisation of capitalised finance costs |
1.4 |
1.6 |
|
|
|
Net interest |
(30.3) |
(27.7) |
|
|
|
|
|
|
|
|
|
Interest Cover Ratio |
4.0x |
4.3x |
|
|
|
|
|
|
|
Cash flow
The table below sets out the cash flow of the business in FY 2025 and FY 2024.
|
|
|
|
|
|
|
|
|
|
Group cash flow |
|
|
|
|
|
|
|
|
2025 |
2024 |
Change |
|
|
|
|
|
£'m |
£'m |
£'m |
% |
|
|
|
|
|
|
|
|
|
|
|
Underlying EBITDAR |
137.0 |
135.4 |
1.6 |
1.2% |
|
|
|
Working capital/exceptionals/other |
1.5 |
(2.3) |
3.8 |
165.2% |
|
|
|
Cash generated from operations |
138.5 |
133.1 |
5.4 |
4.1% |
|
|
|
Interest payments |
(29.2) |
(25.3) |
(3.9) |
15.4% |
|
|
|
Leasehold cost payments |
(16.1) |
(15.5) |
(0.6) |
3.6% |
|
|
|
Tax payments |
(3.6) |
(6.1) |
2.5 |
(41.0%) |
|
|
|
Cash flow before investing activities |
89.6 |
86.2 |
3.4 |
4.0% |
|
|
|
Investment in joint ventures and associates |
(38.9) |
(2.5) |
(36.4) |
- |
|
|
|
Capex - investment properties |
(106.1) |
(118.3) |
11.2 |
(10.3%) |
|
|
|
Capex - property, plant and equipment |
(3.1) |
(1.8) |
(1.3) |
72.2% |
|
|
|
Net proceeds from disposal of investment properties |
6.0 |
- |
6.0 |
- |
|
|
|
Adjusted net cash flow after investing activities |
(52.5) |
(36.4) |
(16.1) |
44.1% |
|
|
|
Issue of share capital |
- |
0.7 |
(0.7) |
- |
|
|
|
Dividends paid |
(66.6) |
(65.9) |
(0.7) |
1.1% |
|
|
|
Group cash inflow / (outflow) |
(119.1) |
(101.6) |
(17.5) |
17.2% |
|
|
|
|
|
|
|
|
|
|
|
Net drawdown of borrowings |
106.5 |
111.6 |
|
|
|
|
|
|
|
|
|
|
|
|
|
Movement in net debt |
159.1 |
89.2 |
|
|
|
|
|
Opening net debt |
899.5 |
810.3 |
|
|
|
|
|
Closing net debt |
1,058.6 |
899.5 |
|
|
|
Cash generated from operations increased by £5.4 million in the year as a result of improving EBITDA year on year.
Interest payments increased compared to the prior year as a result of the increased interest charge associated with the additional borrowings to fund the capital expenditure on new stores. With small increases in leasehold payments, cash flow before investing activities was £3.4 million favourable year on year at £89.6 million (FY 2024: £86.2 million).
In the year, we invested £109.2 million (FY 2024: £120.1 million) on capital expenditure, principally on the development of new stores. An additional £38.9 million was invested in joint ventures and associates where we entered the Italian market during the year and contributed to the funding of further expansion of the Italian and German portfolios.
Dividends paid to shareholders were £66.6 million in FY 2025 (FY 2024: £65.9 million), and the Group drew a net £106.5 million of borrowings to finance capital expenditure.
The table below reconciles cash flow before investing activities in the table above to net cash inflow from operating activities in the consolidated cash flow statement.
|
|
|
|
|
|
|
|
|
|
|
|
|
|
|
|
|
|
|
2025 |
2024 |
|
|
|
|
|
|
|
|
|
£'m |
£'m |
|
|
|
|
|
|
|
|
|
|
|
|
|
|
Cash flow before investing activities |
|
89.6 |
86.2 |
|
||||
|
|
Add back: Finance lease principal payments |
10.3 |
9.7 |
|
|||||
|
|
Net cash inflow from operating activities |
99.9 |
95.9 |
|
|||||
|
|
|
|
|
|
|
|
|
|
|
Cash flow before investing activities is shown after including the impact of finance lease principal payments as these are included in leasehold costs.
Simon Clinton
Chief Financial Officer
Consolidated income statement
for the year ended 31 October 2025
|
|
|
|
Group |
|
|
|
|
|
Notes |
2025 £'m |
2024 £'m |
|
|
|
Revenue |
3, 4 |
234.3 |
223.4 |
|
|
|
Cost of sales |
|
(79.9) |
(73.7) |
|
|
|
Gross profit |
|
154.4 |
149.7 |
|
|
|
Administrative expenses |
|
(20.7) |
(16.1) |
|
|
|
Share of profit from joint ventures and associates |
|
2.5 |
- |
|
|
|
Gain on revaluation of investment properties |
13 |
23.1 |
292.2 |
|
|
|
Operating profit |
4, 5 |
159.3 |
425.8 |
|
|
|
Finance income |
7 |
0.5 |
0.1 |
|
|
|
Finance expense |
7 |
(32.7) |
(27.3) |
|
|
|
Profit before income tax |
|
127.1 |
398.6 |
|
|
|
Income tax charge |
8 |
(16.0) |
(26.3) |
|
|
|
Profit for the year |
|
111.1 |
372.3 |
|
|
|
Earnings per Share for profit attributable to the equity holders |
|
|
|
|
|
|
- basic (pence) |
10 |
50.9 |
170.5 |
|
|
|
- diluted (pence) |
10 |
50.6 |
170.1 |
|
The financial results for both years relate to continuing operations.
Consolidated statement of comprehensive income
for the year ended 31 October 2025
|
|
Group |
|
|
|
2025 £'m |
2024 £'m |
|
Profit for the year |
111.1 |
372.3 |
|
Other comprehensive income |
|
|
|
Items that may be reclassified subsequently to profit or loss: |
|
|
|
Currency translation differences |
32.4 |
(22.0) |
|
Net investment hedge |
(17.3) |
6.9 |
|
Other comprehensive income, net of tax |
15.1 |
(15.1) |
|
Total comprehensive income for the year |
126.2 |
357.2 |
Consolidated balance sheet
as at 31 October 2025
|
|
|
|
Group |
|
|
|
|
|
Notes |
2025 £'m |
2024 £'m |
|
|
|
Assets |
|
|
|
|
|
|
Non-current assets |
|
|
|
|
|
|
Investment properties |
13 |
3,480.1 |
3,284.1 |
|
|
|
Property, plant and equipment |
14 |
7.2 |
5.7 |
|
|
|
Investment in associates |
11 |
6.5 |
6.6 |
|
|
|
Investment in joint ventures |
12 |
44.4 |
- |
|
|
|
Deferred tax assets |
22 |
8.8 |
6.3 |
|
|
|
|
|
3,547.0 |
3,302.7 |
|
|
|
Current assets |
|
|
|
|
|
|
Inventories |
|
0.4 |
0.4 |
|
|
|
Current income tax receivables |
|
1.0 |
1.0 |
|
|
|
Trade and other receivables |
16 |
31.6 |
31.7 |
|
|
|
Cash and cash equivalents |
17 |
11.0 |
25.3 |
|
|
|
|
|
44.0 |
58.4 |
|
|
|
Total assets |
|
3,591.0 |
3,361.1 |
|
|
|
Current liabilities |
|
|
|
|
|
|
Borrowings |
19 |
(96.5) |
- |
|
|
|
Trade and other payables |
18 |
(54.0) |
(51.8) |
|
|
|
Lease liabilities |
21 |
(15.4) |
(14.0) |
|
|
|
|
|
(165.9) |
(65.8) |
|
|
|
Non-current liabilities |
|
|
|
|
|
|
Borrowings |
19 |
(861.7) |
(824.2) |
|
|
|
Deferred tax liabilities |
22 |
(176.7) |
(155.4) |
|
|
|
Lease liabilities |
21 |
(96.0) |
(86.6) |
|
|
|
Provisions |
27 |
(2.3) |
(2.3) |
|
|
|
|
|
(1,136.7) |
(1,068.5) |
|
|
|
Total liabilities |
|
(1,302.6) |
(1,134.3) |
|
|
|
Net assets |
|
2,288.4 |
2,226.8 |
|
|
|
Equity |
|
|
|
|
|
|
Ordinary share capital |
23 |
2.2 |
2.2 |
|
|
|
Share premium |
|
62.7 |
62.7 |
|
|
|
Translation reserve |
|
12.7 |
(2.4) |
|
|
|
Retained earnings |
|
2,210.8 |
2,164.3 |
|
|
|
Total equity |
|
2,288.4 |
2,226.8 |
|
These financial statements were authorised for issue by the Board of Directors on 14 January 2026 and signed on its behalf by:
S Clinton F Vecchioli
Chief Financial Officer Chief Executive Officer
Company registration number: 04726380
Consolidated statement of changes in shareholders' equity
for the year ended 31 October 2025
|
|
Group |
||||
|
|
Share capital £'m |
Share premium £'m |
Translation reserve £'m |
Retained earnings £'m |
Total £'m |
|
Balance at 1 November 2023 |
2.2 |
62.0 |
12.7 |
1,858.2 |
1,935.1 |
|
Comprehensive income |
|
|
|
|
|
|
Profit for the year |
- |
- |
- |
372.3 |
372.3 |
|
Other comprehensive income |
|
|
|
|
|
|
Currency translation differences |
- |
- |
(22.0) |
- |
(22.0) |
|
Net investment hedge |
- |
- |
6.9 |
- |
6.9 |
|
Total other comprehensive income |
- |
- |
(15.1) |
- |
(15.1) |
|
Total comprehensive income |
- |
- |
(15.1) |
372.3 |
357.2 |
|
Transactions with owners |
|
|
|
|
|
|
Dividends (note 9) |
- |
- |
- |
(65.9) |
(65.9) |
|
Increase in share capital and share premium |
- |
0.7 |
- |
- |
0.7 |
|
Employee share options |
- |
- |
- |
(0.3) |
(0.3) |
|
Transactions with owners |
- |
0.7 |
- |
(66.2) |
(65.5) |
|
Balance at 1 November 2024 |
2.2 |
62.7 |
(2.4) |
2,164.3 |
2,226.8 |
|
Comprehensive income |
|
|
|
|
|
|
Profit for the year |
- |
- |
- |
111.1 |
111.1 |
|
Other comprehensive income |
|
|
|
|
|
|
Currency translation differences |
- |
- |
32.4 |
- |
32.4 |
|
Net investment hedge |
- |
- |
(17.3) |
- |
(17.3) |
|
Total other comprehensive income |
- |
- |
15.1 |
- |
15.1 |
|
Total comprehensive income |
- |
- |
15.1 |
111.1 |
126.2 |
|
Transactions with owners |
|
|
|
|
|
|
Dividends (note 9) |
- |
- |
- |
(66.6) |
(66.6) |
|
Employee share options |
- |
- |
- |
2.0 |
2.0 |
|
Transactions with owners |
- |
- |
- |
(64.6) |
(64.6) |
|
Balance at 31 October 2025 |
2.2 |
62.7 |
12.7 |
2,210.8 |
2,288.4 |
The translation reserve balance of £12.7 million (FY 2024: £(2.4) million) comprises all foreign exchange differences arising from the translation of the financial statements of foreign operations and the impact of the net investment hedge. The cumulative impact of the net investment hedge included within this reserve is a net income of £13.2 million (FY 2024: £4.1 million).
Consolidated cash flow statement
for the year ended 31 October 2025
|
|
|
Group |
|
|
|
Notes |
2025 £'m |
2024 £'m |
|
Cash flows from operating activities |
|
|
|
|
Cash generated from operations |
24 |
138.5 |
133.1 |
|
Interest received |
|
0.3 |
0.1 |
|
Interest paid |
|
(35.3) |
(31.2) |
|
Tax paid |
|
(3.6) |
(6.1) |
|
Net cash inflow from operating activities |
|
99.9 |
95.9 |
|
Cash flows from investing activities |
|
|
|
|
Investment in joint ventures and associates |
11, 12 |
(38.9) |
(2.5) |
|
Expenditure on investment properties |
|
(106.1) |
(118.3) |
|
Net proceeds from disposal of investment properties |
|
6.0 |
- |
|
Purchase of property, plant and equipment |
|
(3.1) |
(1.8) |
|
Net cash outflow from investing activities |
|
(142.1) |
(122.6) |
|
Cash flows from financing activities |
|
|
|
|
Issue of share capital |
|
- |
0.7 |
|
Equity dividends paid |
9 |
(66.6) |
(65.9) |
|
Proceeds from borrowings |
|
230.5 |
173.8 |
|
Repayment of borrowings |
|
(124.0) |
(62.2) |
|
Debt issuance costs |
|
(1.3) |
(1.3) |
|
Principal payment of lease liabilities |
|
(10.3) |
(9.7) |
|
Net cash inflow from financing activities |
|
28.3 |
35.4 |
|
Net (decrease)/increase in cash and cash equivalents |
|
(13.9) |
8.7 |
|
Exchange loss on cash and cash equivalents |
|
(0.4) |
(0.3) |
|
Cash and cash equivalents at 1 November |
|
25.3 |
16.9 |
|
Cash and cash equivalents at 31 October |
17 |
11.0 |
25.3 |
Notes to the financial statements
for the year ended 31 October 2025
1. General information
Safestore Holdings plc (the "Company") and its subsidiaries (together, the "Group") provide self-storage facilities to customers throughout the UK, Paris, Spain, the Netherlands and Belgium. The Company is a public limited company, which is listed on the London Stock Exchange and incorporated and domiciled in the UK (England and Wales). The Company operates as the ultimate parent company of the Group. The address of its registered office is Brittanic House, Stirling Way, Borehamwood, Hertfordshire WD6 2BT.
2. Summary of material accounting policies
The principal accounting policies of the Group are set out below. These policies have been consistently applied to each of the years presented, unless otherwise stated.
Basis of preparation
The consolidated financial statements have been prepared in accordance with United Kingdom-adopted International Financial Reporting Standards ("IFRS") and International Financial Reporting Interpretations Committee ("IFRIC") interpretations.
The Group consolidated financial statements are presented in Sterling and are rounded to the nearest £0.1 million, unless otherwise stated. They are prepared on a going concern basis under the historical cost convention as modified by the revaluation of investment properties and the fair value of derivative financial instruments.
The preparation of financial statements in conformity with IFRS requires the use of certain critical accounting estimates and assumptions that affect the reported amounts of assets and liabilities at the date of the financial statements and the reported amounts of revenues and expenses during the reporting period. Although these estimates are based on management's best knowledge of the amount, event or actions, actual amounts may differ from those estimates.
Going concern
The Directors are satisfied that the Group has sufficient resources to continue in operation for the foreseeable future, a period of not less than twelve months from the date of this report. Accordingly, they continue to adopt the going concern basis in preparing this consolidated financial information.
In assessing the Group's going concern position as at 31 October 2025, the Directors have considered a number of factors, including the current balance sheet position, the principal and emerging risks which could impact the performance of the Group and the Group's strategic and financial plan. Consideration has been given to compliance with borrowing covenants along with the uncertainty inherent in future financial forecasts. The Directors considered the most recent three-year financial plans, in particular the projections for the period to 30 April 2027, approved by the Board. In the context of the current environment, plausible downside scenarios were applied to the plan, including a reverse stress test scenario. These were based on the potential financial impact of the Group's principal risks and uncertainties which can be found in the 2025 Annual Report. These scenarios are differentiated by the impact of lower demand levels, lower average rate growth and what level of cost savings is reasonable. A scenario was also performed where we carried out a reverse stress test to model what would be required to breach ICR and LTV covenants, which indicated highly improbable changes would be needed before any issues were to arise.
The impact of the downside scenarios has been reviewed against the Group's projected cash flow position and financial covenants over a three-year period. Should any of these scenarios occur, clear mitigating actions are available to ensure that the Group remains liquid and able to meet its liabilities as they fall due. The Group has USPPs totalling £96.5 million maturing on 30 October 2026. The Group has consistently demonstrated its ability to raise new debt, including through the arrangement of £147.5 million of new financing in the form of USPPs and a Term loan in FY 2024 and FY 2025. Management continues to discuss options for refinancing upcoming maturities with lenders and advisors with multiple sources of new debt being available. The Board is therefore confident with the assumption within the Going Concern assessment that the maturing USPPs will be refinanced. The financial position of the Group, including details of its financing and capital structure, is set out in the financial review section of this report. Further details of the Group's viability statement can be found in the 2025 Annual Report.
Standards, amendments to standards and interpretations issued and applied
There are no new or revised accounting standards or IFRIC interpretations that are applicable for the first time in the year ended 31 October 2025.
New and revised IFRSs in issue but not yet effective
At the date of authorisation of these financial statements, a number of new standards and amendments to standards and interpretations have been issued but are not yet effective for the current accounting period.
• IFRS S1 "General Requirements for Disclosure of Sustainability-related Financial Information"
• IFRS S2 "Climate-related Disclosures"
• IFRS 18 "Presentation and Disclosure in Financial Statements"
• IFRS 19 "Subsidiaries without Public Accountability: Disclosures"
• Amendments to IFRS 9 and IFRS 7
IFRS 18, which replaces IAS 1, requires the classification of all income and expenses into five categories in the consolidated income statement: operating, investing, financing, income taxes, and discontinued operations. Additionally, companies are required to present a newly defined operating profit subtotal. Among other impacts, net profit/(loss) from joint ventures and associates will be excluded from the new operating profit subtotal and classified in the investing category. While recognition and measurement of items will remain unchanged, the presentation in the consolidated income statement will be affected. From a statement of cash flows perspective, the starting point for calculating cash flows from operating activities will change from profit before income tax to operating profit. IFRS 18 also introduces new requirements for the disclosure of information about certain company-specific measures of performance, termed management-defined performance measures ("MPMs"); all information about MPMs must be disclosed in a single note to the financial statements.
The Directors do not expect the other new and revised standards to have a material impact on the financial statements of the Group or Company.
Basis of consolidation and business combinations
The consolidated financial statements incorporate the financial statements of the Company and all its subsidiary undertakings made up to 31 October each year. Subsidiaries are entities controlled by the Company. Control is achieved when the Company:
• has power over the investee;
• is exposed, or has rights, to variable returns from its involvement with the investee; and
• has the ability to use its power to affect its returns.
The results of subsidiaries acquired or disposed of during the year are included in the consolidated income statement from the effective date of acquisition or up to the effective date of disposal, as appropriate.
Where necessary, adjustments are made to the financial statements of subsidiaries to bring the accounting policies used into line with those used by the Group.
All intra-group transactions, balances and unrealised gains on transactions are eliminated on consolidation. Unrealised losses are also eliminated unless the transaction provides evidence of an impairment of the assets transferred.
The acquisition method of accounting is used to account for the acquisition of subsidiaries by the Group. The consideration transferred for the acquisition is measured as the fair value of the assets transferred, the liabilities incurred to the former owners of the acquiree and the equity instruments issued by the Group. Identifiable assets acquired and liabilities and contingent liabilities assumed in a business combination are measured initially at their fair values at the date of acquisition. Any excess of the cost of an acquisition over the fair value of the Group's share of net identifiable assets including intangible assets of the acquired entity at the date of acquisition is recognised as goodwill. Any discount received is credited to the income statement in the year of acquisition as negative goodwill on acquisition of subsidiary. Costs attributable to an acquisition are expensed in the consolidated income statement under the heading 'administrative expenses'.
Investment in associates
An associate is an entity over which the Group is in a position to exercise significant influence, but not control or joint control, through participation in the financial and operating policy decisions of the investee. Significant influence is the power to participate in the financial and operating policy decisions of the investee but is not control or joint control over those policies.
The results and assets and liabilities of associates are incorporated in these financial statements using the equity method of accounting except when classified as held for sale. Investments in associates are carried in the balance sheet at cost as adjusted by post-acquisition changes in the Group's share of the net assets of the associate, less any impairment in the value of individual investments. Losses of an associate in excess of the Group's interest in that associate (which includes any long term interests that, in substance, form part of the Group's net investment in the associate) are recognised only to the extent that the Group has incurred legal or constructive obligations or made payments on behalf of the associate. Where necessary, adjustments are made to the financial statements of associates to bring the accounting policies used into line with those used by the Group. Where a Group company transacts with an associate of the Group, profits and losses are eliminated to the extent of the Group's interest in the relevant associate. Losses may provide evidence of an impairment of the asset transferred, in which case appropriate provision is made for impairment.
Investment in joint ventures
A joint venture is an entity over which the Group has joint control, through participation in the financial and operating policy decisions of the investee. Joint control is the contractually agreed sharing of control of an arrangement, which exists only when decisions about the relevant activities require unanimous consent of the parties sharing control. The results and assets and liabilities of the joint venture are incorporated in these financial statements using the equity method of accounting except when classified as held for sale. Investments in joint ventures are carried in the balance sheet at cost as adjusted by post-acquisition changes in the Group's share of the net assets of the joint venture, less any impairment in the value of individual investments. Losses of a joint venture in excess of the Group's interest in that joint venture (which includes any long term interests that, in substance, form part of the Group's net investment in the joint venture) are recognised only to the extent that the Group has incurred legal or constructive obligations or made payments on behalf of the joint venture. Where necessary, adjustments are made to the financial statements of joint ventures to bring the accounting policies used into line with those used by the Group. Where a Group company transacts with a joint venture of the Group, profits and losses are eliminated to the extent of the Group's interest in the relevant joint venture. Losses may provide evidence of an impairment of the asset transferred, in which case appropriate provision is made for impairment.
Segmental reporting
IFRS 8 "Operating Segments" ("IFRS 8") requires operating segments to be identified based upon the Group's internal reporting to the chief operating decision maker ("CODM") to make decisions about resources to be allocated to segments and to assess their performance. The CODM is the person or group that allocates resources to and assesses the performance of the operating segments of an entity. The Group has determined that its CODM is the Executive Directors.
An operating segment is a component of an entity:
(a) that engages in business activities from which it may earn revenues and incur expenses (including revenues and expenses relating to transactions with other components of the same entity);
(b) whose operating results are regularly reviewed by the entity's CODM to make decisions about resources to be allocated to the segment and assess its performance; and
(c) for which discrete financial information is available.
The Group's net assets, revenue and profit before tax are attributable to one principal activity, the provision of self-storage, in three geographical reporting segments: the United Kingdom, Paris in France, and Expansion Markets which is defined as Spain, the Netherlands, and Belgium.
Segment results, assets and liabilities include items directly attributable to segments as well as those that can be allocated on a reasonable basis.
Revenue recognition
Revenue represents amounts derived from the provision of self-storage services (rental space and customer goods protection) which fall within the Group's activities provided in the normal course of business, net of discounts, VAT (where applicable) and other sales-related taxes.
Rental income is recognised over the period for which the space is occupied by the customer on a time apportionment basis. No revenue is recognised if there are significant uncertainties regarding recovery of the consideration due. Customer goods protection income is recognised over the period for which the space is occupied by the customer on a time apportionment basis.
The Group has put in place protection arrangements whereby it purchases block policies from third party assurers which provide cover for the value of customers' goods. The Group charges a fee to customers for such goods protection, depending on the level of cover. The block policies purchased and the income earned from charging customers are independent transactions. Although the Group may be involved in the initial handling of any customers' goods protection claims, these are passed on to the third party protection providers, which are responsible for all protection payments. The Group is not exposed to protection risk.
The Group bears the inventory risk and pricing risk associated with these contracts and as such the Group acts as principal in the provision of the access to protection services for its customers who elect to access that protection, and therefore revenue from protection premiums is reported on a gross basis.
Income for the sale of assets and consumables is recognised when the significant risks and rewards have been transferred to the buyer. For property sales this is generally at the point of completion. Where any aspect of consideration is conditional then the revenue associated with that conditional item is deferred. Income earned on the sale of consumable items is recognised at the point of sale.
Foreign currency translation
Functional and presentation currency
The individual financial statements for each company are measured using the currency of the primary economic environment in which it operates (its functional currency). For the purposes of the consolidated financial statements, the results and financial position of the Group are expressed in Sterling, which is the presentational currency of the Group.
Transactions and balances
Foreign currency transactions are translated into the functional currency at the rates of exchange prevailing on the dates of the transactions. At each balance sheet date, monetary assets and liabilities that are denominated in foreign currencies are retranslated at the rates prevailing on the balance sheet date. Non-monetary assets and liabilities carried at fair value that are denominated in foreign currencies are translated at the rates prevailing at the date when the fair value was determined. Gains and losses arising on retranslation are included in the income statement for the period, except for exchange differences arising on non-monetary assets and liabilities where the changes in fair value are recognised directly in equity.
On consolidation, the assets and liabilities of the Group's overseas operations are translated into the Group's presentational currency at exchange rates prevailing on the balance sheet date. Income and expense items are translated at the average exchange rates for the period. Exchange differences arising are classified as equity and are recognised as a separate component of equity within the translation reserve. Such translation differences are recognised as income or expense in the period in which the operation is disposed of.
Borrowing costs
All borrowing costs are recognised in the consolidated income statement in the period in which they are incurred, unless the costs are incurred as part of the development of a qualifying asset, when they will be capitalised. Commencement of capitalisation is the date when the Group incurs expenditure for the qualifying asset, incurs borrowing costs and undertakes activities that are necessary to prepare the assets for their intended use when it is probable that they will result in future economic benefits to the entity and the costs can be measured reliably. In the case of suspension of activities during extended periods, the Group suspends capitalisation. The Group ceases capitalisation of borrowing costs when substantially all of the activities necessary to prepare the asset for use are complete, typically when a store opens.
Investment properties and investment properties under construction
Investment properties are those properties owned by the Group that are held to earn rental income, or for capital growth, or both.
Investment properties and investment properties under construction are initially measured at cost, including related transaction and borrowing costs. After initial recognition, investment properties and investment properties under construction are held at fair value based on a market valuation by professionally qualified external valuers at each balance sheet date, unless the fair value of investment properties under construction are not yet reliably measurable, in which case they would be held at cost.
The fair value of investment properties and investment properties under construction reflects, among other things, rental income from current leases and assumptions about rental income from future leases in light of current market conditions. The fair value also reflects, on a similar basis, any cash outflows that could be expected in respect of the property. Some of these outflows are recognised as liabilities, including lease liabilities in respect of leasehold land and buildings classified as investment properties.
In accordance with IAS 40, investment property held as a leasehold is stated gross of the recognised lease liability. Leasehold properties are classified as investment properties and included in the balance sheet at fair value. The obligation to the lessor for the leasehold is included in the balance sheet at the present value of the minimum lease payments. The minimum lease payment valuation is re-measured at the point of lease modification and the value of the Group's right-of-use assets is adjusted accordingly over the lease term. Gains or losses arising on changes in the fair values of investment properties and investment properties under construction at the balance sheet date are recognised in the income statement in the period in which they arise.
If an investment property or part of an investment property becomes owner-occupied, it is reclassified as property, plant and equipment, and its fair value at the date of reclassification becomes its cost for accounting purposes.
Property, plant and equipment
Property, plant and equipment not classified as investment properties or investment properties under construction are stated at historical cost less accumulated depreciation and any accumulated impairment loss. Historical cost comprises the purchase price and costs directly incurred in bringing the asset into use.
Assets' residual values and useful lives are reviewed and, if appropriate, adjusted at each balance sheet date. If the carrying amount of an asset is greater than the recoverable amount then the carrying amount is written down immediately to the recoverable amount.
Depreciation is charged so as to write off the cost of an asset less estimated residual value of each asset over its expected useful life using the straight-line method. The principal rates are as follows:
Owner-occupied freehold buildings 2% per annum
Motor vehicles 20-25% per annum
Computer hardware and software 15-33% per annum
Fixtures, fittings, signs and partitioning 10-15% per annum
The gain or loss arising on the retirement or disposal of an asset is determined as the difference between the net sales proceeds and the carrying amount of the asset and is recognised in the income statement on disposal.
Leases
A right-of-use asset and corresponding lease liability are recognised at commencement of the lease. The lease liability is measured at the present value of the lease payments, discounted at the rate implicit in the lease or, if that cannot be readily determined, at the lessee's incremental borrowing rate specific to the term, country, currency, and start date of the lease. Lease payments include: fixed payments; variable lease payments dependent on an index or rate, initially measured using the index or rate at commencement; the exercise price under a purchase option if the Group is reasonably certain to exercise; penalties for early termination if the lease term reflects the Group exercising a break option; and payments in an optional renewal period if the Group is reasonably certain to exercise an extension option or not exercise a break option.
The lease liability is subsequently measured at amortised cost using the effective interest rate method. It is re-measured at the point of lease modification, with a corresponding adjustment to the right-of-use asset, when there is a change in future lease payments resulting from a rent review, change in an index or rate such as inflation, or change in the Group's assessment of whether it is reasonably certain to exercise a purchase, extension or break option.
The corresponding asset is initially measured at cost, comprising: the initial lease liability; any lease payments already made less any lease incentives received; initial direct costs; and any dilapidation or restoration costs. The Group has two categories of assets in respect of leases: those in respect of leases related to its leasehold properties, classified as investment property, and an occupational lease for its Head Office in France, classified as a right-of-use asset under IFRS 16. The right-of-use assets classified as investment property are subsequently measured at fair value, gross of the lease liability. The right-of-use asset in respect of its occupational leases is classified as property, plant, and equipment and is subsequently depreciated over the length of the lease.
Leases of low value assets and short term leases of twelve months or less are expensed to the Group consolidated income statement.
Finance charges are charged directly against income, unless they are directly attributable to qualifying assets, in which case they are capitalised in accordance with the Group's general policy on borrowing costs.
Financial instruments
(a) Financial assets
Financial assets are classified as financial assets at fair value through profit or loss ("FVTPL") or at amortised cost as appropriate. The Group determines the classification of its assets at initial recognition.
Financial assets are de-recognised only when the contractual right to the cash flows from the financial asset expires or the Group transfers substantially all risks and rewards of ownership.
A financial asset is measured at amortised cost if it meets both of the following conditions:
• it is held within a business model whose objective is to hold assets to collect contractual cash flows; and
• its contractual terms give rise on specific dates to cash flows that are solely payments of principal and interest on the principal amount outstanding.
All financial assets not classified as measured at amortised cost as described above are measured through FVTPL.
Financial assets at FVTPL - these assets are subsequently measured at fair value. Net gains and losses, including any interest, are recognised in profit or loss.
Financial assets at amortised cost - these assets are subsequently measured at amortised cost using the effective interest method. The amortised cost is reduced by impairment losses (expected losses). Interest income, foreign exchange gains and losses and impairment are recognised in profit or loss. Any gain or loss on de-recognition is recognised in profit or loss.
The Group has the following classes of financial assets:
• Trade and other receivables - trade receivables are initially recognised at transaction price. Other receivables are initially recognised at fair value. Subsequently, these assets are measured at amortised cost using the effective interest method, less provision for expected credit losses.
• Cash and cash equivalents - cash and cash equivalents represent only liquid assets with original maturity of 90 days or less. Bank overdrafts that cannot be offset against other cash balances are shown within borrowings in current liabilities on the balance sheet. Cash and cash equivalents are also classified as amortised cost. They are subsequently measured at amortised cost. Cash and cash equivalents include cash in hand, deposits at call with banks, and other short term, highly liquid investments with original maturities of three months or less.
(b) Impairment of financial assets
The Group applies the IFRS 9 simplified approach to measuring expected credit losses ("ECLs") which uses a lifetime expected loss allowance on trade receivables. The expected credit losses are estimated using a provisions matrix based upon the Group's historical credit loss experience and geographic business unit, adjusted for factors that are specific to the debtors, general economic conditions, and an assessment of both the current and forecast direction of conditions at the reporting date, including time value of money where appropriate.
Loss allowances for other receivables are initially measured at an amount equal to twelve months' ECLs and subsequently it is assessed whether the credit risk has increased significantly since initial recognition. When determining whether the credit risk of a financial asset has increased significantly since initial recognition and when estimating ECL, the Company considers reasonable and supportable information that is relevant and available without undue cost or effort. This includes both quantitative and qualitative information and analysis, based on the Company's historical experience and informed credit assessment and including forward-looking information. If the credit risk increased significantly, the loss allowance is then measured using the lifetime ECL. The Group considers a financial asset to be in default when the borrower is unlikely to pay its credit obligations to the Group in full.
(c) Financial liabilities
Financial liabilities are classified as measured at amortised cost or FVTPL. A financial liability is classified as at FVTPL if it is classified as held for trading, it is a derivative, or it is designated as such on initial recognition. Financial liabilities at FVTPL are measured at fair value and net gains and losses, including any interest expense, are recognised in profit or loss. Other financial liabilities are subsequently measured at amortised cost using the effective interest method. Interest expense and foreign exchange gains and losses are recognised in profit or loss. Any gain or loss on de-recognition is also recognised in profit or loss.
The Group has the following classes of financial liabilities:
• Trade and other payables - trade and other payables are initially recognised at fair value. Subsequently, they are measured at amortised cost using the effective interest rate method.
• Borrowings - interest-bearing loans and overdrafts are initially recognised at fair value, net of directly attributable transaction costs. Finance charges, including premiums payable on settlement or redemption and direct issue costs, are accounted for on an accruals basis in the income statement using the effective interest method and are included within the carrying amount of the instrument to the extent that they are not settled in the period in which they arise. Where fees are payable in relation to raising debt, the costs are disclosed in the cash flow statement within financing activities.
Where existing borrowings are replaced by others from the same lenders on substantially different terms, or the terms of existing borrowings are substantially modified, such an exchange or modification is treated as a de-recognition of the original borrowings and the recognition of new borrowings, and the difference in the respective carrying amounts, including issuance costs, is recognised in the income statement. Otherwise, issuance costs incurred on refinancing are offset against the carrying value of borrowings.
(d) Derivative financial instruments
The Group uses derivative financial instruments, such as interest rate swaps, to hedge risks associated with fluctuations on borrowings. Hedge accounting is used to represent the economic effects of the Group's interest rate risk management strategy. When interest rate swaps meet the criteria for documentation and hedge effectiveness, hedge accounting is applied.
At inception of the hedging relationship, the following matters are documented in accordance with IFRS 9:
- how the hedging relationship meets the hedge accounting criteria;
- the economic relationship between the hedged item and hedging instrument;
- the nature of the risk, the risk management objective and the strategy for undertaking the hedge; and
- the method used to assess the effectiveness of the hedging relationship at inception and on an ongoing basis.
Derivative financial instruments are presented as assets when their fair value is positive, and as liabilities when their fair value is negative. The notional amounts of these contracts are not recorded on the balance sheet.
To the extent that a hedging relationship is effective, any changes in the fair value of derivative financial instruments are recognised initially in other comprehensive income and are presented in a separate cash flow hedge reserve within equity. These amounts are then recycled to the income statement in the periods in which the hedged item impacts the income statement. Any ineffective portion of a derivative financial instrument would be immediately recognised within finance expenses in the income statement. When a derivative financial instrument expires, is sold, or no longer meets the criteria for hedge accounting, any cumulative gains/losses held in equity at that time remain in equity and are only recognised when the hedged item is ultimately recognised in the income statement.
The borrowings denominated in foreign currency are used to hedge net assets. The effective part of any gain or loss on borrowings that are designated as a hedge of a net investment in a foreign operation is recognised in other comprehensive income and presented in the translation reserve in equity and is subsequently recognised in the Group income statement as part of the profit or loss on disposal of the net investment. The ineffective portion of the gain or loss is recognised immediately within trading profit in the Group income statement. See note 20 for details about financial instruments.
Taxation including deferred tax
The tax currently payable is based on taxable profit for the year. Taxable profit differs from net profit as reported in the income statement because it excludes items of income or expense that are either never taxable or deductible or are taxable or deductible in other years. The Group's liability for current tax is calculated using tax rates that have been enacted or substantively enacted by the balance sheet date.
Deferred tax is provided, on an undiscounted basis, for temporary differences between the balance sheet value and the tax base value of items that may become taxable at a later date. Deferred tax liabilities are generally recognised for taxable temporary differences and deferred tax assets are recognised to the extent that it is probable that taxable profits will be available, against which deductible temporary differences can be utilised. The carrying amount of deferred tax assets is reviewed at each balance sheet date and reduced to the extent that it is no longer probable that sufficient taxable profits will be available to allow all or part of the asset to be recovered. Deferred tax is calculated at the tax rates substantively enacted at the balance sheet date that are expected to apply in the period when the liability is settled, or the asset is realised.
Deferred tax assets and liabilities are offset where there is a legally enforceable right to set off current tax assets against current tax liabilities.
Employee benefit costs
Payments to defined contribution retirement benefit schemes are charged as an expense as they fall due.
Share-based payments
Share-based incentives are provided to employees under the Group's Long Term Incentive Plan and employee Sharesave schemes. The Group recognises a compensation cost in respect of these schemes that is based on the fair value of the awards, measured using Black-Scholes or Monte Carlo valuation methodologies. For equity-settled schemes, the fair value is determined at the date of grant and is not subsequently re-measured unless the conditions on which the award was granted are modified. For cash-settled schemes, the fair value is determined at the date of grant and is re-measured at each balance sheet date until the liability is settled. Generally, the compensation cost is recognised on a straight-line basis over the vesting period. Adjustments are made to reflect expected and actual forfeitures during the vesting period due to the failure to satisfy service conditions or non-market performance conditions.
Share capital
Ordinary shares are classified as equity.
Costs directly attributable to the issue of new ordinary shares are shown in equity as a deduction, net of tax, from the proceeds.
Climate change
In preparing the financial statements, the Directors have considered the impact of climate change, particularly in the context of the climate change risks identified in the sustainability section of the strategic report and the Group's stated target of operational net zero carbon emissions by 2035. These considerations did not have a material impact on the financial reporting judgements and estimates in the current year. This reflects the conclusion that climate change will have a limited exposure and vulnerability on the Group's investment property portfolio, the carrying value of non-current assets and the estimates of future profitability used in our assessment of the recoverability of deferred tax assets.
Critical accounting judgements and key sources of estimation uncertainty
The preparation of consolidated financial statements under IFRS requires the Directors to make judgements, estimates and assumptions that may affect the application of accounting policies and the reported amounts of assets and liabilities, income, and expenses. Actual outcomes may therefore differ from these judgements, estimates, and assumptions.
There were no critical accounting judgements made in the preparation of the consolidated financial statements.
The estimates and underlying assumptions are reviewed on an ongoing basis. Revisions to accounting estimates are recognised in the period in which the estimate is revised if the revision affects only that period, or in the period of the revision and future periods if the revision affects both current and future periods.
The following key source of estimation uncertainty has significant risk of causing a material adjustment, within the next financial year, to the carrying amounts of assets and liabilities within the consolidated financial statements:
Estimate of fair value of investment properties and investment properties under construction
The Group values its investment properties using a discounted cash flow methodology which is based on projections of net operating income. Principal assumptions and management's underlying estimation of the fair value of those relate to: stabilised occupancy levels; expected future growth in storage rental income and operating costs; maintenance requirements; capitalisation rate; and discount rates. There are inter-relationships between the valuation inputs and they are primarily determined by market conditions. The effect of an increase in more than one input could be to magnify the impact on the valuation. However, the impact on the valuation could be offset by the inter-relationship of two inputs moving in opposite directions: e.g. an increase in rent may be offset by a decrease in occupancy, resulting in minimal net impact on the valuation. For immature stores, these underlying estimates hold a higher risk of uncertainty, due to the unproven nature of their cash flows. A more detailed explanation of the background, methodology, and estimates made by management that are adopted in the valuation of the investment properties, as well as detailed sensitivity analysis, is set out in note 13 to the financial statements.
Non-GAAP financial information/Alternative Performance Measures
The Directors have identified certain measures that they believe will assist the understanding of the performance of the business. The measures are not defined under IFRS and they may not be directly comparable with other companies' adjusted measures. The non-GAAP/Alternative Performance Measures are not intended to be a substitute for, or superior to, any IFRS measures of performance but they have been included as the Directors consider them to be important comparables and key measures used within the business for assessing performance. The following are the key non-GAAP/Alternative Performance Measures identified by the Group:
• The Group defines exceptional items to be those that warrant, by virtue of their nature, size, or frequency, separate disclosure on the face of the income statement where, in the opinion of the Directors, this enhances the understanding of the Group's financial performance.
• Underlying EBITDAR is an Alternative Performance Measure and is defined as operating profit before exceptional items, share-based payments, corporate transaction costs, change in value of derivatives, gain/loss on investment properties, depreciation, net profit from joint ventures and associates, interest and tax. Management considers this presentation to be representative of the underlying performance of the business, as it removes the income statement impact of items not fully controllable by management, such as the revaluation of investment properties, and the impact of exceptional credits, costs, and finance charges. A reconciliation of statutory operating profit to Underlying EBITDAR can be found in the financial review.
• Adjusted Diluted EPRA Earnings per Share is based on the European Public Real Estate Association's definition of earnings and is defined as profit or loss for the period after tax but excluding corporate transaction costs, exceptional and non-operating items, gain/loss on investment properties, and the associated tax impacts. The Company then makes further company-specific adjustments for the impact of net exchange gains/losses recognised in net finance costs and deferred and current tax in respect of these adjustments. The Company also adjusts for IFRS 2 share-based payment charges. This adjusted earnings is divided by the diluted number of shares. The IFRS 2 cost is excluded as it is written back to distributable reserves and is a non-cash item (with the exception of the associated National Insurance element). Therefore, neither the Company's ability to distribute nor pay dividends are impacted (with the exception of the associated National Insurance element). The financial statements disclose earnings on a statutory, EPRA, and Adjusted Diluted EPRA basis and will provide a full reconciliation of the differences in the financial year in which any LTIP awards may vest. A reconciliation of statutory basic Earnings per Share to Adjusted Diluted EPRA Earnings per Share can be found in note 10.
• EPRA's Best Practices Recommendations guidelines for Net Asset Value ("NAV") metrics are EPRA Net Tangible Assets ("NTA"), EPRA Net Reinstatement Value ("NRV") and EPRA Net Disposal Value ("NDV"). EPRA NTA is considered to be the most relevant measure for the Group's business which provides sustainable long term progressive returns and is the primary measure of net assets. The basis of calculation, including a reconciliation to reported net assets, is set out in note 15.
• Like-for-like figures are presented to aid in the comparability of the underlying business as they exclude the impact on results of purchased, sold, opened, or closed stores.
• Constant exchange rate ("CER") figures are provided in order to present results on a more comparable basis, removing foreign exchange movements.
3. Revenue
Analysis of the Group's operating revenue can be found below:
|
|
2025 £'m |
2024 £'m |
|
Self-storage income |
196.5 |
186.6 |
|
Customer goods protection income |
26.1 |
25.1 |
|
Other non-storage income |
11.7 |
11.7 |
|
Total revenue |
234.3 |
223.4 |
Other non-storage income includes fees earned from the management of self-storage businesses carried on by joint ventures and associates and from sales of merchandise.
4. Segmental analysis
The Group's revenue, profit before income tax, and net assets are attributable to one activity: the provision of self-storage accommodation and related services. This is based on the Group's management and internal reporting structure.
Safestore is organised and managed in three operating segments, based on geographical areas, being the United Kingdom, Paris in France, and Expansion Markets (Spain, the Netherlands, and Belgium).
The chief operating decision maker, being the Executive Directors, assesses the performance of the operating segments on the basis of Underlying EBITDAR, which is defined as operating profit before exceptional items, share-based payments, corporate transaction costs, change in value of derivatives, gain/loss on investment properties, depreciation, net profit from joint ventures and associates, interest and tax.
The operating profits and assets include items directly attributable to a segment as well as those that can be allocated on a reasonable basis.
|
Year ended 31 October 2025 |
UK £'m |
Paris £'m |
Expansion Markets £'m |
Group £'m |
|
Continuing operations |
|
|
|
|
|
Revenue |
167.5 |
44.6 |
22.2 |
234.3 |
|
Underlying EBITDAR |
96.9 |
29.8 |
10.3 |
137.0 |
|
Share-based payments |
(1.2) |
0.1 |
- |
(1.1) |
|
Exceptional costs |
(0.6) |
- |
(0.1) |
(0.7) |
|
Depreciation |
(1.3) |
(0.1) |
(0.1) |
(1.5) |
|
Share of joint ventures' and associates' profit |
- |
- |
2.5 |
2.5 |
|
Gain on investment properties |
(14.9) |
12.6 |
25.4 |
23.1 |
|
Operating profit |
78.9 |
42.4 |
38.0 |
159.3 |
|
Net finance expense |
(23.3) |
(2.9) |
(6.0) |
(32.2) |
|
Profit before tax |
55.6 |
39.5 |
32.0 |
127.1 |
|
Total investment properties |
2,350.3 |
747.9 |
381.9 |
3,480.1 |
|
Total investments in joint ventures and associates |
- |
1.8 |
49.1 |
50.9 |
|
Year ended 31 October 2024 |
UK £'m |
Paris £'m |
Expansion Markets £'m |
Group £'m |
|
Continuing operations |
|
|
|
|
|
Revenue |
162.2 |
43.7 |
17.5 |
223.4 |
|
Underlying EBITDAR |
99.3 |
28.7 |
7.4 |
135.4 |
|
Share-based payments |
(0.1) |
(0.1) |
(0.1) |
(0.3) |
|
Depreciation |
(1.4) |
(0.1) |
- |
(1.5) |
|
Gain on investment properties |
226.8 |
40.9 |
24.5 |
292.2 |
|
Operating profit |
324.6 |
69.4 |
31.8 |
425.8 |
|
Net finance expense |
(17.2) |
(1.3) |
(8.7) |
(27.2) |
|
Profit before tax |
307.4 |
68.1 |
23.1 |
398.6 |
|
Total investment properties |
2,293.2 |
668.6 |
322.3 |
3,284.1 |
|
Total investments in joint ventures and associates |
- |
1.8 |
4.8 |
6.6 |
Inter-segment transactions are entered into under the normal commercial terms and conditions that would also be available to unrelated third parties. There is no material impact from inter-segment transactions on the Group's results.
5. Operating profit
The following items have been charged/(credited) in arriving at operating profit:
|
|
Notes |
2025 £'m |
2024 £'m |
|
Staff costs |
26 |
37.1 |
30.9 |
|
Inventories: cost of inventories recognised as an expense (included in cost of sales) |
|
1.2 |
1.0 |
|
Exceptional costs |
|
0.7 |
- |
|
Depreciation on property, plant, and equipment |
14 |
1.5 |
1.5 |
|
Gain on revaluation of investment properties |
13 |
(23.1) |
(292.2) |
6. Fees paid to auditor
During the year, the Group (including its overseas subsidiaries) obtained the following services from the Company's auditor at costs detailed below:
|
|
2025 £'m |
2024 £'m |
|
Audit services |
|
|
|
Fees payable to the Company's auditor and its associates for the audit of the parent company and consolidated financial statements |
0.5 |
0.4 |
|
Fees payable to the Company's auditor and its associates for the audit of the Company's subsidiaries pursuant to legislation |
0.1
|
0.1
|
|
Total audit fees |
0.6 |
0.5 |
|
Audit-related assurance services (half year review) |
0.1 |
0.1 |
|
Other assurance services |
- |
0.1 |
|
Total non-audit services |
0.1 |
0.2 |
|
Total |
0.7 |
0.7 |
7. Finance income and costs
|
|
2025 £'m |
2024 £'m |
|
Finance income |
|
|
|
Other interest and similar income |
0.3 |
0.1 |
|
Interest receivable from loan to associates |
0.2 |
- |
|
Underlying finance income |
0.5 |
0.1 |
|
Total finance income |
0.5 |
0.1 |
|
Finance costs |
|
|
|
Interest payable on borrowings |
(25.5) |
(19.9) |
|
Amortisation of debt issuance costs on borrowings |
(1.4) |
(1.6) |
|
Underlying finance charges |
(26.9) |
(21.5) |
|
Interest on lease liabilities |
(5.8) |
(5.8) |
|
Total finance costs |
(32.7) |
(27.3) |
|
Net finance costs |
(32.2) |
(27.2) |
The capitalisation rate of interest is based on the incremental cost of RCF borrowings.
8. Income tax charge
Analysis of tax charge in the year:
|
|
Note |
2025 £'m |
2024 £'m |
|
Current tax: |
|
|
|
|
- current year |
|
4.5 |
4.3 |
|
- prior year |
|
(0.1) |
- |
|
|
|
4.4 |
4.3 |
|
Deferred tax: |
|
|
|
|
- current year |
|
14.4 |
21.7 |
|
- prior year |
|
(2.8) |
0.3 |
|
|
22 |
11.6 |
22.0 |
|
Tax charge |
|
16.0 |
26.3 |
Reconciliation of income tax charge
The tax for the period is lower (FY 2024: lower) than the standard rate of corporation tax in the UK for the year ended 31 October 2025 of 25% (FY 2024: 25%). The differences are explained below:
|
|
2025 £'m |
2024 £'m |
|
Profit before tax |
127.1 |
398.6 |
|
Profit before tax multiplied by the standard rate of corporation tax in the UK of 25% (FY 2024: 25%) |
31.8 |
99.7 |
|
Effect of: |
|
|
|
- permanent differences |
3.0 |
1.5 |
|
- profits from the tax exempt business |
(17.2) |
(78.2) |
|
- difference from overseas tax rates |
0.4 |
1.5 |
|
- potential deferred tax assets not recognised |
0.9 |
1.7 |
|
- prior year adjustment |
(2.9) |
0.1 |
|
Tax charge |
16.0 |
26.3 |
The Group is a UK real estate investment trust ("REIT"). As a result, the Group is exempt from UK corporation tax on the profits and gains from its qualifying property rental business in the UK, providing it meets certain conditions. Non-qualifying profits and gains of the Group remain subject to corporation tax as normal. The Group monitors its compliance with the REIT conditions. There have been no breaches of the conditions to date.
Taxation for other jurisdictions is calculated at the rates prevailing in the respective jurisdictions.
9. Dividends per share
Dividends paid in 2025 were £66.6 million (30.50 pence per share) (FY 2024: £65.9 million (30.20 pence per share)). A final dividend in respect of the year ended 31 October 2025 of 20.60 pence (FY 2024: 20.40 pence) per share, amounting to a total final dividend of £45.0 million (FY 2024: £44.6 million), is to be proposed at the AGM on 18 March 2026. The ex-dividend date will be 12 March 2026 and the record date will be 13 March 2026 with an intended payment date of 14 April 2026. The final dividend has not been included as a liability at 31 October 2025.
The Property Income Distribution ("PID") element of the final dividend is 10.30 pence (FY 2024: 15.30 pence), making the PID payable for the year 12.83 pence (FY 2024: 17.80 pence) per share.
10. Earnings per Share
Basic Earnings per Share ("EPS") is calculated by dividing the profit attributable to equity holders of the Company by the weighted average number of ordinary shares in issue during the year excluding ordinary shares held as treasury shares. Diluted EPS is calculated by adjusting the weighted average number of ordinary shares to assume conversion of all dilutive potential shares. The Company has one category of dilutive potential ordinary shares: share options. For the share options, a calculation is performed to determine the number of shares that could have been acquired at fair value (determined as the average annual market price of the Company's shares) based on the monetary value of the subscription rights attached to the outstanding share options. The number of shares calculated as above is compared with the number of shares that would have been issued assuming the exercise of the share options.
|
|
Year ended 31 October 2025 |
|
Year ended 31 October 2024 |
||||
|
|
Earnings £'m |
Shares million |
Pence per share |
|
Earnings £'m |
Shares million |
Pence per share |
|
Basic EPS |
111.1 |
218.4 |
50.9 |
|
372.3 |
218.3 |
170.5 |
|
Dilutive securities |
- |
1.3 |
(0.3) |
|
- |
0.6 |
(0.4) |
|
Diluted EPS |
111.1 |
219.7 |
50.6 |
|
372.3 |
218.9 |
170.1 |
Adjusted Earnings per Share
Explanations related to the adjusted earnings measures adopted by the Group are set out in note 2 under the heading Non-GAAP financial information/Alternative Performance Measures. Adjusted EPS represents profit after tax adjusted for the valuation movement on investment properties, exceptional items, non-underlying joint venture and associate earnings, and exchange gains/losses.
The Directors consider that these alternative measures provide useful information on the performance of the Group. EPRA earnings and Earnings per Share before non-recurring items and movements on revaluations of investment properties have been disclosed to give a clearer understanding of the Group's underlying trading performance.
|
|
Year ended 31 October 2025 |
|
Year ended 31 October 2024 |
||||
|
|
Earnings £'m |
Shares million |
Pence per share |
|
Earnings £'m |
Shares million |
Pence per share |
|
Basic EPS |
111.1 |
218.4 |
50.9 |
|
372.3 |
218.3 |
170.5 |
|
Adjustments: |
|
|
|
|
|
|
|
|
Gain on revaluation of investment properties |
(23.1) |
- |
(10.6) |
|
(292.2) |
- |
(133.9) |
|
Exceptional items |
0.7 |
- |
0.3 |
|
- |
- |
- |
|
Fair value re-measurement of investment properties lease liabilities |
(10.3) |
- |
(4.7) |
|
(9.7) |
- |
(4.5) |
|
Non-underlying joint venture and associate earnings |
(2.6) |
- |
(1.2) |
|
- |
- |
- |
|
Tax on adjustments |
11.6 |
- |
5.4 |
|
22.0 |
- |
10.1 |
|
Adjusted Basic EPRA EPS |
87.4 |
218.4 |
40.1 |
|
92.4 |
218.3 |
42.2 |
|
Share-based payments charge |
1.1 |
- |
0.5 |
|
0.3 |
- |
0.1 |
|
Dilutive shares |
- |
1.3 |
(0.3) |
|
- |
0.9 |
- |
|
Adjusted Diluted EPRA EPS1 |
88.5 |
219.7 |
40.3 |
|
92.7 |
219.2 |
42.3 |
Note:
1 Adjusted Diluted EPRA EPS is defined in note 2 under Non-GAAP financial information/Alternative Performance Measures.
Gain on revaluation of investment properties includes the fair value re-measurement of investment properties lease liabilities of £10.3 million (FY 2024: £9.7 million) and the related tax thereon of £1.0 million (FY 2024: £1.1 million). The exceptional items of £0.7 million (FY 2024: £nil) relate to one-off development costs of a new SAAS-based finance computer system. As an industry standard measure, EPRA earnings is presented. EPRA earnings of £87.4 million (FY 2024: £92.4 million) and Adjusted Basic EPRA Earnings per Share of 40.1 pence (FY 2024: 42.2 pence) are calculated after further adjusting for these items.
11. Investment in associates
|
|
PBC |
CERF II |
Total |
|||
|
|
2025 |
2024 |
2025 |
2024 |
2025 |
2024 |
|
|
£'m |
£'m |
£'m |
£'m |
£'m |
£'m |
|
At 1 November 2024 |
1.8 |
1.8 |
4.8 |
2.3 |
6.6 |
4.1 |
|
Additions |
- |
- |
- |
2.5 |
- |
2.5 |
|
Share of profit |
- |
- |
(0.4) |
- |
(0.4) |
- |
|
Exchange movements |
- |
- |
0.3 |
- |
0.3 |
- |
|
At 31 October 2025 |
1.8 |
1.8 |
4.7 |
4.8 |
6.5 |
6.6 |
This is a reconciliation of IFRS to EPRA share of profits for each associate:
|
|
PBC |
CERF II |
Total |
|||
|
|
2025 |
2024 |
2025 |
2024 |
2025 |
2024 |
|
Group's share |
£'m |
£'m |
£'m |
£'m |
£'m |
£'m |
|
Statutory profit after tax |
- |
- |
(0.4) |
- |
(0.4) |
- |
|
Adjusted for: |
|
|
|
|
|
|
|
Fair value re-measurement of investment properties lease liabilities |
- |
- |
(0.2) |
- |
(0.2) |
- |
|
Adjusted Basic EPRA earnings |
- |
- |
(0.6) |
- |
(0.6) |
- |
PBC Les Groues SAS
The Group has a 24.9% interest in PBC Les Groues SAS ("PBC"), a company registered and operating in France. PBC is accounted for using the equity method of accounting. PBC is the parent company of Nanterre FOCD 92, a company also registered and operating in France, which finished developing one new store in the current year and continues its wider development programme located in Paris. The development project is managed by its joint venture partners; therefore, the Group has no operational liability during this phase. During the current period there has been no material investment in the company (FY 2024: £nil). The aggregate carrying value of the Group's interest in PBC was £1.8 million (FY 2024: £1.8 million). The Group's share of profits from continuing operations for the period was £nil (FY 2024: £nil). The Group's share of other comprehensive income of associates for the period was £nil (FY 2024: £nil).
CERF II German Storage Topco S.a.r.l.
The Group has a 10.0% interest in CERF II German Storage Topco S.a.r.l. "CERF II", a company registered in Luxembourg for which the Group has board representation. The reporting date of the financial statements for CERF II is 31 December. CERF II is accounted for using the equity method of accounting. Safestore entered the German self-storage market via a new investment with Carlyle which acquired the myStorage business. The aggregate carrying value of the Group's interest in CERF II was £4.7 million (FY 2024: £4.8 million). The Group's share of losses from continuing operations for the period was £0.4 million (FY 2024: £nil). The Group's share of other comprehensive income of associates for the period was £nil (FY 2024: £nil).
12. Investment in joint venture
|
|
EasyBox |
|
|
|
2025 |
2024 |
|
|
£'m |
£'m |
|
At 1 November 2024 |
- |
- |
|
Additions |
38.9 |
- |
|
Share of profit |
2.9 |
- |
|
Exchange movements |
2.6 |
- |
|
At 31 October 2025 |
44.4 |
- |
This is a reconciliation of IFRS to EPRA share of profits for the joint venture:
|
|
EasyBox |
|
|
|
2025 |
2024 |
|
Group's share |
£'m |
£'m |
|
Statutory profit after tax |
2.9 |
- |
|
Adjusted for: |
|
|
|
Gain on investment properties and investment properties under construction |
(2.4) |
- |
|
Adjusted Basic EPRA earnings |
0.5 |
- |
EasyBox
On 23 December 2024, the Group entered into a 50:50 joint venture with the Nuveen group to acquire the EasyBox self-storage business1 in Italy. EasyBox has twelve operating stores, all of which are located in key cities in Italy. The reporting date of the financial statements for EasyBox is 31 December. EasyBox is accounted for using the equity method of accounting. The aggregate carrying value of the Group's interest in EasyBox was £44.4 million (FY 2024: £nil). The Group's share of profits from continuing operations for the nine-month period ending 30 September 2025 was £2.9 million (FY 2024: £nil). The Group's share of other comprehensive income of associates for the period was £nil (FY 2024: £nil).
Note:
1 The EasyBox self-storage business refers to the Group's investments in EasyBox Self-Storage S.p.A. and the Italian Self Storage Fund - Fondo di Investimento Alternativo Immobiliare Riservato.
13. Investment properties
|
|
Investment properties, net of lease liabilities £'m |
Investment properties lease liabilities £'m |
Investment property under construction £'m |
Total investment properties £'m |
|
At 1 November 2024 |
3,052.8 |
100.6 |
130.7 |
3,284.1 |
|
Additions |
28.8 |
21.7 |
81.3 |
131.8 |
|
Disposals |
(6.0) |
(1.9) |
- |
(7.9) |
|
Reclassification at completed cost |
100.9 |
- |
(100.9) |
- |
|
Revaluations |
23.3 |
- |
10.1 |
33.4 |
|
Fair value re-measurement of investment properties lease liabilities |
- |
(10.3) |
- |
(10.3) |
|
Exchange movements |
46.1 |
1.3 |
1.6 |
49.0 |
|
At 31 October 2025 |
3,245.9 |
111.4 |
122.8 |
3,480.1 |
|
|
Investment properties, net of lease liabilities £'m |
Investment properties lease liabilities £'m |
Investment property under construction £'m |
Total investment properties £'m |
|
At 1 November 2023 |
2,681.1 |
101.2 |
108.6 |
2,890.9 |
|
Additions |
45.9 |
11.7 |
80.0 |
137.6 |
|
Disposals |
- |
(1.6) |
- |
(1.6) |
|
Reclassification at completed cost |
56.1 |
- |
(56.1) |
- |
|
Revaluations |
301.9 |
- |
- |
301.9 |
|
Fair value re-measurement of investment properties lease liabilities |
- |
(9.7) |
- |
(9.7) |
|
Exchange movements |
(32.2) |
(1.0) |
(1.8) |
(35.0) |
|
At 31 October 2024 |
3,052.8 |
100.6 |
130.7 |
3,284.1 |
The Group acquired the freehold of the Plymouth, UK, property in January 2025. This resulted in the disposal of lease liabilities with a carrying value of £1.9 million.
The gain on investment properties, net of lease liabilities, comprises:
|
|
Cost £'m |
Revaluation on cost £'m |
Valuation £'m |
|
Freehold stores |
|
|
|
|
At 1 November 2024 |
1,094.8 |
1,470.4 |
2,565.2 |
|
Movement in year |
126.6 |
59.1 |
185.7 |
|
At 31 October 2025 |
1,221.4 |
1,529.5 |
2,750.9 |
|
Leasehold stores |
|
|
|
|
At 1 November 2024 |
164.2 |
323.4 |
487.6 |
|
Movement in year |
12.3 |
(4.9) |
7.4 |
|
At 31 October 2025 |
176.5 |
318.5 |
495.0 |
|
|
|
|
|
|
All stores |
|
|
|
|
At 1 November 2024 |
1,259.0 |
1,793.8 |
3,052.8 |
|
Movement in year |
138.9 |
54.2 |
193.1 |
|
At 31 October 2025 |
1,397.9 |
1,848.0 |
3,245.9 |
|
|
2025 £'m |
2024 £'m |
|
Revaluations of investment property and investment property under construction |
33.4 |
301.9 |
|
Fair value re-measurement of investment properties lease liabilities |
(10.3) |
(9.7) |
|
Gain on revaluation of investment properties |
23.1 |
292.2 |
Rental income earned from investment properties for the year ended 31 October 2025 was £196.5 million (FY 2024: £186.6 million).
The Group has classified the investment property and investment property under construction, held at fair value, within Level 3 of the fair value hierarchy. There were no transfers to or from Level 3 during the year.
As described in note 2, Summary of significant accounting policies, where the valuation obtained for investment property is net of all payments to be made, it is necessary to add back the lease liability to arrive at the carrying amount of investment property at fair value.
All direct operating expenses arising from investment property that generated rental income as outlined in note 3 were £97.3 million (FY 2024: £88.0 million).
The freehold and leasehold investment properties have been valued as at 31 October 2025 by external valuer Cushman & Wakefield Debenham Tie Leung Limited ("C&W"). The valuation has been carried out in accordance with the current edition of the RICS Valuation - Global Standards, which incorporates the International Valuation Standards and the RICS Valuation UK National Supplement (the "RICS Red Book"). The valuation of each of the investment properties has been prepared on the basis of fair value as a fully equipped operational entity, having regard to trading potential. Two non-trading properties were valued on the basis of fair value. The valuation has been provided for accounts purposes and, as such, is a Regulated Purpose Valuation as defined in the RICS Red Book. In compliance with the disclosure requirements of the RICS Red Book, C&W has confirmed that:
• the member of the RICS who has been the signatory to the valuations provided to the Group for the same purposes as this valuation has done so since April 2020. The valuations have been reviewed by an internal investment committee comprising two valuation partners and an investment partner, all unconnected with the assignment;
• C&W has been carrying out regular valuations for the same purpose as this valuation on behalf of the Group since October 2006;
• C&W does not provide other significant professional or agency services to the Group;
• in relation to the preceding financial year of C&W, the proportion of total fees payable by the Group to the total fee income of the firm is less than 5%; and
• the fee payable to C&W is a fixed amount per property and is not contingent on the appraised value.
Valuation method and assumptions
The valuation of the operational self-storage facilities has been prepared having regard to trading potential. Cash flow projections have been prepared for all of the properties reflecting estimated absorption, revenue growth and expense inflation. A discounted cash flow method of valuation based on these cash flow projections has been used by C&W to arrive at its opinion of fair value for these properties.
C&W has adopted different approaches for the valuation of the leasehold and freehold assets as follows:
Freehold and long leasehold (the UK, Paris, Spain, the Netherlands, and Belgium)
The valuation is based on a discounted cash flow of the net operating income over a ten-year period and a notional sale of the asset at the end of the tenth year.
Assumptions:
• Net operating income is based on projected revenue received less projected operating costs together with a central administration charge of 6% of the estimated annual revenue, subject to a cap and collar. The initial net operating income is calculated by estimating the net operating income in the first twelve months following the valuation date.
• The net operating income in future years is calculated assuming either straight-line absorption from day one actual occupancy or variable absorption over years one to four of the cash flow period, to an estimated stabilised/mature occupancy level. In the valuation the assumed stabilised occupancy level for the trading stores (both freeholds and all leaseholds) open at 31 October 2025 averages 89.0% (FY 2024: 90.9%). The projected revenues and costs have been adjusted for estimated cost inflation and revenue growth. The average time assumed for stores to trade at their maturity levels is 15.7 months (FY 2024: 12.1 months).
• The capitalisation rates applied to existing and future net cash flows have been estimated by reference to underlying yields for industrial and retail warehouse property, yields for other trading property types such as purpose-built student housing and hotels, bank base rates, ten-year money rates, inflation, and the available evidence of transactions in the sector. The valuation included in the accounts assumes rental growth in future periods.
• The average freehold exit yield on UK freeholds is 5.36% (FY 2024: 5.21%), on France freeholds is 5.20% (FY 2024: 5.22%), on Spain freeholds is 5.72% (FY 2024: 5.49%), on the Netherlands freeholds is 5.13% (FY 2024: 4.99%), and on Belgium freeholds is 4.90% (FY 2024: 4.77%). The average freehold exit yield for all freeholds adopted is 5.32% (FY 2024: 5.19%).
• The future net cash flow projections (including revenue growth and cost inflation) have been discounted at a rate that reflects the risk associated with each asset. The average annual discount rate adopted (for both freeholds and leaseholds) in the UK portfolio is 9.19% (FY 2024: 8.81%), in the France portfolio is 8.75% (FY 2024: 8.76%), in the Spain portfolio is 8.80% (FY 2024: 8.60%), in the Netherlands portfolio is 8.55% (FY 2024: 7.26%), and in the Belgium portfolio is 8.41% (FY 2024: 8.12%). The average annual discount rate adopted (for both freeholds and all leaseholds) is 9.02% (FY 2024: 8.66%).
• The Group's investment property assets have been valued for the purposes of the financial statements after adjusting for notional purchaser's costs of approximately 6.65% (UK), 8.00% (Paris), 3.99% (Spain), 11.40% (the Netherlands), and 13.00% (Belgium) if they were sold directly as property assets. Sales plus purchaser's costs totalling approximately 7.90% (UK), 9.25% (Paris), 5.24% (Spain), 12.65% (the Netherlands), and 14.25% (Belgium) are assumed on the notional sales in the tenth year in relation to freehold and long leasehold stores. The valuation is an asset valuation which is strongly linked to the operating performance of the business. They would have to be sold with the benefit of operational contracts, employment contracts and customer contracts, which would be difficult to achieve except in a corporate structure. This approach follows the logic of the valuation methodology in that the valuation is based on a capitalisation of the net operating income after allowing a deduction for operational cost and an allowance for central administration costs. A sale in a corporate structure would result in a reduction in the assumed stamp duty land tax but an increase in other transaction costs reflecting additional due diligence resulting in a reduced notional purchaser's cost of c.2.0% of gross value. All the significant sized transactions that have been concluded in the UK in recent years were completed in a corporate structure.
Short leaseholds (UK)
The same methodology has been used as for freeholds, except that no sale of the assets in the tenth year is assumed but the discounted cash flow is extended to the expiry of the lease.
Short leaseholds (Paris)
In relation to the commercial leases in Paris, C&W has valued the cash flow projections in perpetuity due to the security of tenure arrangements in that market and the potential compensation arrangements in the event of the landlord wishing to take possession. The valuation treatment is therefore the same as for the freehold properties. The capitalisation rates on these stores reflect the risk of the landlord terminating the lease arrangements.
Short leaseholds (Spain)
In relation to the commercial leases in Spain, C&W has valued the cash flow projections in perpetuity due to the nature of the lease agreements which allow the tenant to renew the lease year on year into perpetuity. The valuation treatment is therefore the same as for the freehold properties. The capitalisation rates on these stores reflect the risk of the rolling lease arrangements.
Short leaseholds (the Netherlands)
The same methodology has been used as for freeholds, except that no sale of the assets in the tenth year is assumed but the discounted cash flow is extended to the expiry of the lease.
Short leaseholds (Belgium)
There are no short term leaseholds in Belgium.
Investment properties under construction
Investment properties under construction are initially measured at cost, including related transaction and borrowing costs. After initial recognition, investment properties under construction are held at fair value based on a market valuation by C&W at each balance sheet date, unless development of the property is not yet certain, in which case investment properties under construction would be held at cost. To establish certainty, the Group considers whether planning is unconditional, funding is in place, a full business case has been approved by the Board, and there is full control over the site.
C&W have valued investment properties under construction adopting the same methodology as set out above, which includes in any fair value calculation, the estimated costs of completion for each site, within the future cash flow forecasts.
Immature stores
C&W has assessed the value of each property individually. Where the stores in the portfolio are relatively immature and have low initial cash flow, C&W has endeavoured to reflect the nature of the cash flow profile for these properties in its valuation, and the higher associated risks relating to the as yet unproven future cash flow, by adjustment to the capitalisation rates and discount rates adopted. However, immature low cash flow stores of this nature are rarely, if ever, traded individually in the market, unless as part of a distressed sale or similar situation, although there is more evidence of such stores being traded as part of a group or portfolio transaction.
C&W states that, in practice, if an actual sale of the properties was to be contemplated then any immature low cash flow stores would normally be presented to the market for sale, lotted or grouped with other more mature assets owned by the same entity, in order to alleviate the issue of negative or low short term cash flow. This approach would enhance the marketability of the group of assets and assist in achieving the best price available in the market by diluting the cash flow risk.
C&W has not adjusted its opinion of fair value to reflect such a grouping of the immature assets with other properties in the portfolio and all stores have been valued individually. However, C&W highlights the matter to alert the Group to the manner in which the properties might be grouped or lotted in order to maximise their attractiveness to the marketplace.
C&W considers this approach to be a valuation assumption but not a special assumption, the latter being an assumption that assumes facts that differ from the actual facts existing at the valuation date and which, if not adopted, could produce a material difference in value.
Sensitivity of the valuation to assumptions
As noted in note 2 'Key sources of estimation uncertainty', self-storage valuations are complex, derived from data which is not widely publicly available and involves a degree of judgement. All other factors being equal, higher net operating income would lead to an increase in the valuation of a store and an increase in the capitalisation rate or discount rate would result in a lower valuation, and vice versa. Higher assumptions for stabilised occupancy, absorption rate, rental rate, and other revenue, and a lower assumption for operating costs, would result in an increase in projected net operating income, and thus an increase in valuation.
There are inter-relationships between the valuation inputs, and they are primarily determined by market conditions. The effect of an increase in more than one input could be to magnify the impact on the valuation. However, the impact on the valuation could be offset by the inter-relationship of two inputs moving in opposite directions: e.g. an increase in rent may be offset by a decrease in occupancy, resulting in no net impact on the valuation.
For these reasons we have classified the valuation of our property portfolio as Level 3 as defined by IFRS 13. Inputs to the valuation, some of which are 'unobservable' as defined by IFRS 13, include capitalisation yields, stable occupancy rates, and time to stabilised occupancy. The existence of an increase of more than one 'unobservable' input would augment the impact on the valuation. The impact on the valuation would be mitigated by the inter-relationship between unobservable inputs moving in opposite directions. For example, an increase in stable occupancy may be offset by an increase in yield, resulting in no net impact on the valuation. A sensitivity analysis showing the impact on valuations of changes in capitalisation rates and stable occupancy is shown below:
|
|
Impact of change in capitalisation rates £'m |
|
Impact of a change in stabilised occupancy assumption £'m |
|
Impact of a delay in stabilised occupancy assumption £'m |
||
|
|
25 bps decrease |
25 bps increase |
|
1% increase |
1% decrease |
|
24-month delay |
|
Reported group |
151.2 |
(137.2) |
|
50.6 |
(50.4) |
|
(39.2) |
14. Property, plant and equipment
|
|
Owner- occupied buildings £'m |
Motor vehicles £'m |
Fixtures and fittings £'m |
IFRS 16 leases £'m |
Total £'m |
|
Cost |
|
|
|
|
|
|
At 1 November 2024 |
1.9 |
1.8 |
10.9 |
0.6 |
15.2 |
|
Additions |
- |
0.4 |
2.5 |
0.2 |
3.1 |
|
Disposals |
- |
(0.1) |
(0.2) |
- |
(0.3) |
|
At 31 October 2025 |
1.9 |
2.1 |
13.2 |
0.8 |
18.0 |
|
Accumulated depreciation |
|
|
|
|
|
|
At 1 November 2024 |
0.2 |
0.9 |
7.8 |
0.6 |
9.5 |
|
Charge for the year |
- |
0.3 |
1.1 |
0.1 |
1.5 |
|
Disposals |
- |
(0.1) |
(0.1) |
- |
(0.2) |
|
At 31 October 2025 |
0.2 |
1.1 |
8.8 |
0.7 |
10.8 |
|
Net book value |
|
|
|
|
|
|
At 31 October 2025 |
1.7 |
1.0 |
4.4 |
0.1 |
7.2 |
|
At 31 October 2024 |
1.7 |
0.9 |
3.1 |
- |
5.7 |
|
|
Owner- occupied buildings £'m |
Motor vehicles £'m |
Fixtures and fittings £'m |
IFRS 16 leases £'m |
Total £'m |
|
Cost |
|
|
|
|
|
|
At 1 November 2023 |
1.7 |
1.4 |
9.5 |
0.6 |
13.2 |
|
Additions |
0.2 |
0.4 |
1.4 |
- |
2.0 |
|
At 31 October 2024 |
1.9 |
1.8 |
10.9 |
0.6 |
15.2 |
|
Accumulated depreciation |
|
|
|
|
|
|
At 1 November 2023 |
0.2 |
0.6 |
6.8 |
0.4 |
8.0 |
|
Charge for the year |
- |
0.3 |
1.0 |
0.2 |
1.5 |
|
At 31 October 2024 |
0.2 |
0.9 |
7.8 |
0.6 |
9.5 |
|
Net book value |
|
|
|
|
|
|
At 31 October 2024 |
1.7 |
0.9 |
3.1 |
- |
5.7 |
|
At 31 October 2023 |
1.5 |
0.8 |
2.7 |
0.2 |
5.2 |
15. Net assets per share
EPRA's Best Practices Recommendations guidelines for Net Asset Value ("NAV") metrics are EPRA Net Tangible Assets ("NTA"), EPRA Net Reinstatement Value ("NRV") and EPRA Net Disposal Value ("NDV").
EPRA NTA is considered to be the most relevant measure for the Group's business which provides sustainable long term progressive returns and is the primary measure of net assets. EPRA NTA assumes that entities buy and sell assets, thereby crystallising certain levels of unavoidable deferred tax. Due to the Group's REIT status, deferred tax is only provided at each balance sheet date on properties outside the REIT regime. As a result, deferred taxes are excluded from EPRA NTA for properties within the REIT regime. For properties outside of the REIT regime, deferred tax is included to the extent that it is expected to crystallise, based on the Group's track record and tax structuring.
The basic and diluted net assets per share have been calculated based on the following number of shares:
|
|
2025 Number |
2024 Number |
|
Shares in issue |
|
|
|
At year end |
218,490,500 |
218,490,500 |
|
Adjustment for Employee Benefit Trust (treasury) shares |
(70,531) |
(75,397) |
|
IFRS/EPRA number of shares (basic) |
218,419,969 |
218,415,103 |
|
Dilutive effect of Save As You Earn shares |
84,752 |
7,769 |
|
Dilutive effect of Long Term Incentive Plan shares |
1,194,321 |
567,621 |
|
IFRS/EPRA number of shares (diluted) |
219,699,042 |
218,990,493 |
EPRA NTA is shown in the table below:
|
|
2025 |
|
2024 |
|
||||||
|
|
Net assets £'m |
Basic net assets per share pence |
Diluted net assets per share pence |
|
Net assets £'m |
Basic net assets per share pence |
Diluted net assets per share pence |
|||
|
Statutory net asset value |
2,288.4 |
1,048 |
1,042 |
|
2,226.8 |
1,020 |
1,017 |
|||
|
Adjustments to exclude: |
|
|
|
|
|
|
|
|||
|
Deferred tax liabilities on the revaluation of investment properties |
176.7 |
|
|
|
155.4 |
|
|
|||
|
EPRA net asset value |
2,465.1 |
1,129 |
1,122 |
|
2,382.2 |
1,091 |
1,088 |
|||
Basic net assets per share is shareholders' funds divided by the number of shares at the year end. Diluted net assets per share is shareholders' funds divided by the number of shares at the year end, adjusted for dilutive share options of 1,279,073 shares (FY 2024: 575,390 shares). EPRA diluted net assets per share excludes deferred tax liabilities arising on the revaluation of investment properties. The EPRA NAV, which further excludes fair value adjustments for debt and related derivatives net of deferred tax, was £2,465.1 million (FY 2024: £2,382.2 million), giving EPRA NTA per share of 1,122 pence (FY 2024: 1,088 pence). The Directors consider that these alternative measures provide useful information on the performance and position of the Group.
EPRA adjusted balance sheet (non-statutory)
|
|
2025 £'m |
2024 £'m |
|
Assets |
|
|
|
Non-current assets |
3,547.0 |
3,302.7 |
|
Current assets |
44.0 |
58.4 |
|
Total assets |
3,591.0 |
3,361.1 |
|
Liabilities |
|
|
|
Current liabilities |
(165.9) |
(65.8) |
|
Non-current liabilities |
(960.0) |
(913.0) |
|
Total liabilities |
(1,125.9) |
(979.0) |
|
EPRA adjusted Net Asset Value |
2,465.1 |
2,382.2 |
|
EPRA adjusted basic net assets per share |
1,129 pence |
1,091 pence |
16. Trade and other receivables
|
|
2025 £'m |
2024 £'m |
|
Current |
|
|
|
Trade receivables |
25.2 |
21.9 |
|
Less: credit loss allowance |
(8.7) |
(6.6) |
|
Trade receivables - net |
16.5 |
15.3 |
|
Other receivables |
9.0 |
7.3 |
|
Prepayments |
6.1 |
9.1 |
|
|
31.6 |
31.7 |
The creation and release of credit loss allowances have been included in cost of sales in the income statement. The Group always measures the loss allowance for the trade receivables at an amount equal to lifetime expected credit loss. The expected credit losses on trade receivables are estimated using a provision matrix by reference to past default experience of the debtor and an analysis of the debtor's current financial position, adjusted for factors that are specific to the debtor and an analysis of the debtors, general economic conditions of the industry in which the debtors operate, and an assessment of both the current as well as the forecast direction of conditions at the reporting date.
There has been no change in the estimation techniques or significant assumptions made during the current reporting period. The Group writes off a trade receivable when there is information indicating that the debtors are in severe financial difficulty and there is no realistic prospect of recovery, e.g. when the debtor has been placed under liquidation or has entered into bankruptcy proceedings.
The following table details the risk profile of trade receivables based on the Group's provision matrix:
|
UK |
Not past due |
<28 days |
29-60 days |
>60 days |
Total |
|
Expected credit loss rate (%) |
- |
8.7% |
25.0% |
44.3% |
6.8% |
|
Estimated total gross carrying amount at default (£'m) |
7.7 |
2.3 |
1.2 |
0.7 |
11.9 |
|
Lifetime ECL (£'m) |
- |
(0.2) |
(0.3) |
(0.3) |
(0.8) |
|
Net trade receivables as at 31 October 2025 |
7.7 |
2.1 |
0.9 |
0.4 |
11.1 |
|
France |
Not past due |
<28 days |
29-60 days |
>60 days |
Total |
|
Expected credit loss rate (%) |
- |
9.9% |
25.5% |
74.0% |
62.3% |
|
Estimated total gross carrying amount at default (£'m) |
0.7 |
1.0 |
0.5 |
9.8 |
12.0 |
|
Lifetime ECL (£'m) |
- |
(0.1) |
(0.1) |
(7.3) |
(7.5) |
|
Net trade receivables as at 31 October 2025 |
0.7 |
0.9 |
0.4 |
2.5 |
4.5 |
|
UK |
Not past due |
<28 days |
29-60 days |
>60 days |
Total |
|
Expected credit loss rate (%) |
- |
11.8% |
20.0% |
83.3% |
8.4% |
|
Estimated total gross carrying amount at default (£'m) |
7.4 |
1.7 |
1.0 |
0.6 |
10.7 |
|
Lifetime ECL (£'m) |
- |
(0.2) |
(0.2) |
(0.5) |
(0.9) |
|
Net trade receivables as at 31 October 2024 |
7.4 |
1.5 |
0.8 |
0.1 |
9.8 |
|
France |
Not past due |
<28 days |
29-60 days |
>60 days |
Total |
|
Expected credit loss rate (%) |
- |
9.2% |
25.8% |
72.2% |
56.3% |
|
Estimated total gross carrying amount at default (£'m) |
1.1 |
0.9 |
0.5 |
7.7 |
10.2 |
|
Lifetime ECL (£'m) |
- |
(0.1) |
(0.1) |
(5.5) |
(5.7) |
|
Net trade receivables as at 31 October 2024 |
1.1 |
0.8 |
0.4 |
2.2 |
4.5 |
Outstanding trade receivables for the Expansion Markets totalled less than £2 million; therefore, the risk profile for this geography has been excluded.
The difference between expected credit loss rates in the UK and France is largely due to the differing processes for collecting overdue debt, with legal proceedings in France typically taking significantly longer than in the UK.
The above balances are short term (including other receivables) and therefore the difference between the book value and the fair value is not significant. Consequently, these have not been discounted.
Movement in the credit loss allowance:
|
|
2025 £'m |
2024 £'m |
|
Balance at the beginning of the year |
6.6 |
5.8 |
|
Amounts provided in the year |
3.2 |
3.2 |
|
Amounts written off as uncollectable |
(1.1) |
(2.4) |
|
Balance at the end of the year |
8.7 |
6.6 |
The carrying amounts of the Group's trade and other receivables are denominated in the following currencies:
|
|
2025 £'m |
2024 £'m |
|
Sterling |
17.2 |
19.2 |
|
Euros |
14.4 |
12.5 |
|
|
31.6 |
31.7 |
17. Cash and cash equivalents
|
|
2025 £'m |
2024 £'m |
|
Cash at bank and in hand |
11.0 |
25.3 |
The carrying amounts of the Group's cash and cash equivalents are denominated in the following currencies:
|
|
2025 £'m |
2024 £'m |
|
Sterling |
2.3 |
12.2 |
|
Euros |
8.7 |
13.1 |
|
|
11.0 |
25.3 |
In the previous financial year, there was £0.9 million of restricted cash which related to the provision in note 27. The restricted cash was held to settle any amounts owed to the French tax authorities pending results of the ongoing litigation. This cash was released to the Group in the current financial year and there is £nil restricted cash as at 31 October 2025.
18. Trade and other payables
|
|
2025 £'m |
2024 £'m |
|
Current |
|
|
|
Trade payables |
6.7 |
10.1 |
|
Other taxes and social security payable |
7.1 |
4.3 |
|
Other payables |
4.5 |
3.4 |
|
Accruals |
17.7 |
15.7 |
|
Deferred income |
18.0 |
18.3 |
|
|
54.0 |
51.8 |
The carrying amounts of the Group's trade and other payables are denominated in the following currencies:
|
|
2025 £'m |
2024 £'m |
|
Sterling |
33.2 |
33.7 |
|
Euros |
20.8 |
18.1 |
|
|
54.0 |
51.8 |
19. Borrowings
|
|
2025 £'m |
2024 £'m |
|
USPP Notes |
546.9 |
473.3 |
|
RCF - drawn |
347.8 |
355.7 |
|
Term loan |
68.2 |
- |
|
Debt issue costs |
(4.7) |
(4.8) |
|
|
958.2 |
824.2 |
As at 31 October 2025 the Group has US Private Placement Notes ("USPPs") of €377.1 million (FY 2024: €307.1 million) which have maturities between 2026 and 2033 with fixed-rate coupons of between 0.93% and 4.03% and of £215.5 million (FY 2024: £215.5 million) which have maturities between 2026 and 2031 with fixed-rate coupons of between 1.96% and 2.92%. The weighted average cost of interest on the overall USPPs at 31 October 2025 was 2.36% per annum. In addition, the Group has arranged a Revolving Credit Facility ("RCF") with its relationship banks. The RCF attracts a margin over SONIA/EURIBOR of between 1.25% and 1.45%, by reference to the Group's performance against its covenants.
In June 2025 the Group entered into a new Euro-denominated Term loan facility agreement for €77.5 million which has a maturity date of 30 June 2030. The interest on this loan has a fixed margin of between 1.25% and 1.45%, by reference to the Group's performance against its covenants, and a variable rate based on the three-month EURIBOR rate at the start of each quarter. At the same time, a matching interest rate swap was entered into with the same maturity date with the effect of fixing the interest rate of the Term loan (see note 20).
The €654.6 million of Euro denominated borrowings provides a natural hedge against the Group's investment in the Paris and Expansion Markets businesses, so the Group has applied net investment hedge accounting and the retranslation of these borrowings is recognised directly in the translation reserve.
Borrowings are stated after unamortised issue costs of £4.7 million (FY 2024: £4.8 million).
Borrowings are repayable as follows:
|
|
Group |
|
|
|
2025 £'m |
2024 £'m |
|
Within one year |
96.5 |
- |
|
Between one and two years |
65.1 |
93.7 |
|
Between two and five years |
634.3 |
630.9 |
|
After more than five years |
167.0 |
104.4 |
|
Borrowings |
962.9 |
829.0 |
|
Unamortised debt issue costs |
(4.7) |
(4.8) |
|
|
958.2 |
824.2 |
The effective interest rates at the balance sheet date were as follows:
|
|
2025 |
2024 |
|
USPP Notes - GBP |
2.55% |
2.55% |
|
USPP Notes - EUR |
2.24% |
1.83% |
|
RCF - GBP |
Monthly, quarterly or six-monthly SONIA plus 1.25% |
Monthly, quarterly or six-monthly SONIA plus 1.25% |
|
RCF - EUR |
Monthly, quarterly or six-monthly EURIBOR plus 1.25% |
Monthly, quarterly or six-monthly EURIBOR plus 1.25% |
|
Term loan - EUR |
Three-month EURIBOR plus 1.25% |
- |
In addition to the margin of 1.25%, the RCF and Term loan also had ESG targets enabling a reduction in the margin of up to 5bps to 1.20%. In the period these targets were all met.
The carrying amounts of the Group's borrowings are denominated in the following currencies:
|
|
2025 £'m |
2024 £'m |
|
Sterling |
387.5 |
464.5 |
|
Euros |
575.4 |
364.5 |
|
|
962.9 |
829.0 |
Borrowing facilities
The Group has the following undrawn committed borrowing facilities available at 31 October 2025 in respect of which all conditions precedent had been met at that date:
|
|
Floating rate |
|
|
|
2025 £'m |
2024 £'m |
|
Expiring beyond one year |
152.2 |
144.3 |
20. Financial instruments
Financial risk management
Financial risk management is an integral part of the way the Group is managed. In the course of its business, the Group is exposed primarily to interest rate risk, liquidity risk, credit risk and foreign exchange risk. The overall aim of the Group's financial risk management policies is to minimise potential adverse effects on financial performance and Net Asset Value ("NAV"). The Group manages the financial risks within policies and operating parameters approved by the Board of Directors and does not enter into speculative transactions. Treasury activities are managed centrally under a framework of policies and procedures approved and monitored by the Board. These objectives are to protect the assets of the Group and to identify and then manage financial risk. In applying these policies, the Group will utilise derivative instruments, but only for risk management purposes.
The principal financial risks facing the Group are described below.
Interest rate risk
The Group finances its operations through a mixture of retained profits, issued share capital, and borrowings. The Group borrows in Sterling and Euros at floating rates and, where necessary, uses interest rate swaps to convert these to fixed rates to generate the preferred interest rate profile and to manage its exposure to interest rate fluctuations. A 1ppt change in interest rates would have a £3.5 million (FY 2024: £3.5 million) impact on net interest. This sensitivity impact has been prepared by determining average floating interest rates and flexing these against average floating-rate deposits and borrowings by major currency area over the course of the year.
Liquidity risk
The Group's policy on liquidity risk is to ensure that sufficient cash is available to fund ongoing operations without the need to carry significant net debt over the medium term. The Group's principal borrowing facilities are provided by a group of core relationship banks in the form of term loans, overdrafts, revolving credit facilities, and notes. The quantum of committed borrowing facilities available to the Group is reviewed regularly and is designed to exceed forecast peak gross debt levels. Further details of the Group's borrowing facilities, including the repayment profile of existing borrowings and the amount of undrawn committed borrowing facilities, are set out in note 19.
Credit risk
Credit risk arises on financial instruments such as trade and other receivables. Policies and procedures exist to ensure that customers have an appropriate credit history and account customers are given credit limits that are monitored. Counterparty exposure positions are monitored regularly so that credit exposures to any one counterparty are within predetermined limits. Overall, the Group considers that it is not exposed to a significant amount of credit risk. The amount of trade receivables outstanding at the year end does not represent the maximum exposure to operational credit risk due to the normal patterns of supply and payment over the course of a year. Based on management information collected as at month ends the maximum level of net trade receivables at any one point during the year was £16.1 million (FY 2024: £15.6 million).
Foreign exchange risk
The Group operates internationally and is exposed to foreign exchange risk in respect of the Euro. Foreign exchange risk arises from future commercial transactions, recognised assets and liabilities, and net investments in foreign operations.
The Group has investments in foreign operations in France, Spain, the Netherlands, and Belgium, whose net assets are exposed to foreign currency translation risk. Currency exposure arising from the net assets of the Group's foreign operations is managed primarily through borrowings denominated in the relevant foreign currency.
The Group holds Euro denominated borrowings totalling €654.6 million (FY 2024: €364.5 million) and as such is exposed to foreign exchange risk on these borrowings. The foreign exchange risk relating to the borrowings provides a natural hedge against the Euro denominated assets of its operations in France, Spain, the Netherlands, and Belgium and is 100% effective. As a result, the Group applies net investment hedging in respect of these borrowings and the reduction in fair value during the year of £17.3 million (FY 2024: £6.9 million increase) was recognised in other comprehensive income.
At 31 October 2025, if Sterling had weakened by 10% against the Euro with all other variables held constant, pre-tax profit for the year would have been unchanged due to Euro bank balances held by UK entities (FY 2024: £0.1 million lower). Equity (the translation reserve) would have been £18.4 million higher (FY 2024: £34.7 million higher), arising primarily on translation of Euro denominated net assets held by subsidiary companies with a Euro functional currency less the Euro denominated borrowings.
The Group is not exposed to significant transaction foreign exchange risk as purchases are invoiced in either Sterling or Euros.
Capital risk
The Group's objectives when managing capital are to safeguard the Group's ability to continue as a going concern in order to provide returns for shareholders and benefits for other stakeholders and to maintain an optimal capital structure to reduce the cost of capital.
In order to maintain or adjust the capital structure, the Group may adjust the amount of dividends paid to shareholders, return capital to shareholders, issue new shares, or sell assets to reduce debt. Being a REIT, the Group is required to distribute as a dividend a minimum of 90% of its property rental income to shareholders. This is factored into the Group's capital risk management.
Consistent with others in the industry, the Group monitors capital on the basis of a loan-to-value ("LTV") ratio. The Group considers that an LTV ratio, defined as net debt (excluding derivatives and lease liabilities) as a proportion of the valuation of investment properties and investment properties under construction (excluding lease liabilities), below 40% represents an appropriate medium term capital structure objective. The Group's LTV ratio was 28.1% at 31 October 2025 (FY 2024: 25.1%).
The LTV ratios at 31 October 2025 and 2024 were as follows:
|
|
2025 £'m |
2024 £'m |
|
Borrowings (note 19) |
958.2 |
824.2 |
|
Lease liabilities (note 21) |
111.4 |
100.6 |
|
Less: cash and cash equivalents (note 17) |
(11.0) |
(25.3) |
|
Net debt |
1,058.6 |
899.5 |
|
Less: lease liabilities |
(111.4) |
(100.6) |
|
Net debt (excluding lease liabilities) |
947.2 |
798.9 |
|
IPs and IPUCs (excluding investment property lease liabilities) |
3,368.7 |
3,183.5 |
|
Loan-to-value ratio |
28.1% |
25.1% |
The Group gearing ratio is defined as total net debt divided by total capital. Total net debt is calculated as total borrowings (including current and non-current borrowings and lease liabilities as shown in the consolidated balance sheet) less cash and cash equivalents. Total capital is calculated as equity as shown in the consolidated balance sheet, plus net debt. The gearing ratio was 31.6% at 31 October 2025 (FY 2024: 28.8%).
The Group has complied with all of the covenants on its banking facilities during the year.
The fair value of borrowings is calculated as:
|
|
2025 |
|
2024 |
||
|
|
Book value £'m |
Fair value £'m |
|
Book value £'m |
Fair value £'m |
|
Borrowings |
958.2 |
931.8 |
|
824.2 |
759.6 |
Fair value hierarchy
IFRS 13 requires fair value measurements to be recognised using a fair value hierarchy that reflects the significance of the inputs used in the measurements, according to the following levels:
Level 1 - unadjusted quoted prices in active markets for identical assets or liabilities.
Level 2 - inputs other than quoted prices included within Level 1 that are observable for the asset or liability, either directly or indirectly.
Level 3 - inputs for the asset or liability that are not based on observable market data.
The table below shows the level in the fair value hierarchy into which fair value measurements have been categorised:
|
Assets per the balance sheet |
2025 £'m |
2024 £'m |
|
Amounts due from associates - Level 2 |
0.7 |
0.5 |
|
Liabilities per the balance sheet |
2025 £'m |
2024 £'m |
|
Borrowings - Level 2 |
962.9 |
829.0 |
There were no transfers between Level 1, 2, and 3 fair value measurements during the current or prior year.
Hedging arrangements
The new Euro-denominated Term loan facility agreement exposes the Group to a risk in the variability of interest payments due to possible changes in the three-month EURIBOR rate over the five-year loan term. In accordance with the Group's risk mitigation strategy, the variable interest payments have been hedged in full using an interest rate swap which has a notional value of €77.5 million and a five-year term. The variable interest rate on the swap is the three-month EURIBOR rate, and the fixed rate is 2.196%. Interest on the swap is paid on a quarterly basis in line with the interest payable on the Term loan. As the swap shares the same risk exposure as the loan, the hedge effectiveness has been assessed as 100%. The impact of credit risk is assessed to be immaterial. The swap and the Term loan together have been formally designated as having a hedging relationship and are accounted for as a cash flow hedge.
Derivatives designated as cash flow hedges as at 31 October 2025
|
|
Notional contract amount |
Fair value of derivative liability at year end based on fair value of hedged item |
Line item in statement of financial position |
Change in fair value of hedged item used as a basis to determine ineffectiveness |
Hedge effectiveness |
|
|
£'m |
£'m |
|
£'m |
% |
|
Interest rate swap |
68.2 |
- |
Borrowings |
- |
100% |
For the year ended 31 October 2025 no amounts (2024: no amounts) were reclassified to the income statement in respect of hedge ineffectiveness.
Maturity profile of derivative financial instruments as at 31 October 2025
|
|
Less than three months |
Three to twelve months |
One to three years |
Three to five years |
Total |
|
|
£'m |
£'m |
£'m |
£'m |
£'m |
|
Fixed payment |
(0.4) |
(1.1) |
(3.0) |
(2.5) |
(7.0) |
|
Floating receipt |
0.3 |
1.0 |
2.9 |
2.8 |
7.0 |
|
Net (payment)/receipt |
(0.1) |
(0.1) |
(0.1) |
0.3 |
- |
Financial instruments by category
|
Assets per the balance sheet |
Financial assets at amortised cost £'m |
Assets at fair value through profit and loss £'m |
Total £'m |
|
Trade receivables and other receivables excluding prepayments |
25.5 |
- |
25.5 |
|
Cash and cash equivalents |
11.0 |
- |
11.0 |
|
At 31 October 2025 |
36.5 |
- |
36.5 |
|
Liabilities per the balance sheet |
Other financial liabilities at amortised cost £'m |
Liabilities at fair value through profit and loss £'m |
Total £'m |
|
Borrowings (excluding lease liabilities) |
958.2 |
- |
958.2 |
|
Lease liabilities |
111.4 |
- |
111.4 |
|
Payables and accruals |
28.9 |
- |
28.9 |
|
At 31 October 2025 |
1,098.5 |
- |
1,098.5 |
|
Assets per the balance sheet |
Financial assets at amortised cost £'m |
Assets at fair value through profit and loss £'m |
Total £'m |
|
Trade receivables and other receivables excluding prepayments |
22.6 |
- |
22.6 |
|
Cash and cash equivalents |
25.3 |
- |
25.3 |
|
At 31 October 2024 |
47.9 |
- |
47.9 |
|
Liabilities per the balance sheet |
Other financial liabilities at amortised cost £'m |
Liabilities at fair value through profit and loss £'m |
Total £'m |
|
Borrowings (excluding lease liabilities) |
824.2 |
- |
824.2 |
|
Lease liabilities |
100.6 |
- |
100.6 |
|
Payables and accruals |
29.2 |
- |
29.2 |
|
At 31 October 2024 |
954.0 |
- |
954.0 |
The interest rate risk profile, after taking account of derivative financial instruments, was as follows:
|
|
2025 |
|
2024 |
||||
|
|
Floating rate £'m |
Fixed rate £'m |
Total £'m |
|
Floating rate £'m |
Fixed rate £'m |
Total £'m |
|
Borrowings |
347.8 |
610.4 |
958.2 |
|
355.7 |
468.5 |
824.2 |
The weighted average interest rate of the fixed-rate financial borrowing was 2.48% (FY 2024: 2.16%) and the weighted average remaining period for which the rate is fixed was 3.8 years (FY 2024: 4.3 years).
Maturity analysis
The table below analyses the Group's financial liabilities and non-settled derivative financial instruments into relevant maturity groupings based on the remaining period at the balance sheet date to the contractual maturity dates. The amounts disclosed in the table are the contractual undiscounted cash flows.
|
|
Less than one year £'m |
One to two years £'m |
Two to five years £'m |
More than five years £'m |
|
31 October 2025 |
|
|
|
|
|
Borrowings |
96.5 |
65.1 |
634.3 |
167.0 |
|
Lease liabilities |
16.3 |
15.7 |
38.2 |
79.5 |
|
Payables and accruals |
27.7 |
- |
- |
- |
|
|
140.5 |
80.8 |
672.5 |
246.5 |
|
|
Less than one year £'m |
One to two years £'m |
Two to five years £'m |
More than five years £'m |
|
31 October 2024 |
|
|
|
|
|
Borrowings |
9.3 |
103.1 |
657.4 |
123.6 |
|
Lease liabilities |
14.7 |
14.2 |
35.0 |
75.5 |
|
Payables and accruals |
28.6 |
- |
- |
- |
|
|
52.6 |
117.3 |
692.4 |
199.1 |
21. Lease liabilities
The Group leases certain of its investment properties under lease liabilities. The average remaining lease term is 13.6 years (FY 2024: 13.2 years).
|
|
Minimum lease payments |
|
Present value of minimum lease payments |
||
|
|
2025 £'m |
2024 £'m |
|
2025 £'m |
2024 £'m |
|
Within one year |
16.3 |
14.7 |
|
15.4 |
14.0 |
|
Within two to five years |
53.9 |
49.2 |
|
46.0 |
42.3 |
|
Greater than five years |
79.5 |
75.5 |
|
50.0 |
44.3 |
|
|
149.7 |
139.4 |
|
111.4 |
100.6 |
|
Less: future finance charges on lease liabilities |
(38.3) |
(38.8) |
|
- |
- |
|
Present value of lease liabilities |
111.4 |
100.6 |
|
111.4 |
100.6 |
|
|
2025 £'m |
2024 £'m |
|
Current |
15.4 |
14.0 |
|
Non-current |
96.0 |
86.6 |
|
|
111.4 |
100.6 |
Amounts recognised within the consolidated income statement include interest on lease liabilities of £5.8 million (FY 2024: £5.8 million). Amounts recognised in the consolidated statement of cash flows include lease liabilities principal payments of £10.3 million (FY 2024: £9.7 million) and interest on lease liabilities of £5.8 million (FY 2024: £5.8 million). The maturity analysis for lease liabilities under contractual undiscounted cash flows is included in note 20.
22. Deferred income tax
Deferred tax is calculated in full on temporary differences under the liability method using tax rates enacted in each respective jurisdiction corresponding to when they are expected to reverse. The movement on the deferred tax account was as shown below.
|
|
Note |
2025 £'m |
2024 £'m |
|
At 1 November 2024 |
|
149.1 |
132.6 |
|
Charge to income statement |
8 |
11.6 |
22.0 |
|
Exchange differences |
|
7.2 |
(5.5) |
|
At 31 October 2025 |
|
167.9 |
149.1 |
The movements in deferred tax assets and liabilities during the period are shown below.
|
Deferred tax liability |
Revaluation of investment properties £'m |
Other timing differences £'m |
Total £'m |
|
At 1 November 2023 |
139.2 |
- |
139.2 |
|
Charge to income statement |
21.7 |
- |
21.7 |
|
Exchange differences |
(5.5) |
- |
(5.5) |
|
At 31 October 2024 |
155.4 |
- |
155.4 |
|
At 1 November 2024 |
155.4 |
- |
155.4 |
|
Charge to income statement |
13.9 |
- |
13.9 |
|
Exchange differences |
7.4 |
- |
7.4 |
|
At 31 October 2025 |
176.7 |
- |
176.7 |
|
Deferred tax asset |
Other timing differences £'m |
Tax losses £'m |
Total £'m |
|
At 1 November 2023 |
0.8 |
5.8 |
6.6 |
|
Charge to income statement |
(0.2) |
(0.1) |
(0.3) |
|
At 31 October 2024 |
0.6 |
5.7 |
6.3 |
|
At 1 November 2024 |
0.6 |
5.7 |
6.3 |
|
Credit to income statement |
0.1 |
2.2 |
2.3 |
|
Exchange differences |
- |
0.2 |
0.2 |
|
At 31 October 2025 |
0.7 |
8.1 |
8.8 |
The deferred tax liability due after more than one year is £176.7 million (FY 2024: £155.4 million).
As at 31 October 2025, the Group had trading losses of £43.7 million (FY 2024: £34.3 million) and capital losses of £36.4 million (FY 2024: £36.4 million) in respect of its UK operations.
As at 31 October 2025, the Group had trading losses of £9.2 million (FY 2024: £11.0 million) in respect of its Netherlands and Belgium operations.
As at 31 October 2025, the Group had trading losses of £8.2 million (FY 2024: £5.5 million) in respect of its Spanish operations.
All losses can be carried forward indefinitely. A deferred tax asset of £8.1 million (FY 2024: £5.7 million) has been recognised in respect of these losses in the current period, recognising the extent to which the Group believes these losses will be utilised in the future to reduce income tax liabilities.
23. Called up share capital
|
|
2025 £'m |
2024 £'m |
|
Called up, allotted, and fully paid |
|
|
|
218,490,500 (FY 2024: 218,490,500) ordinary shares of 1 pence each |
2.2 |
2.2 |
Ordinary shares
The holders of the ordinary shares shall be entitled to one vote for each ordinary share.
During the year the Company issued nil ordinary shares (FY 2024: 451,081 ordinary shares).
Safestore Holdings plc Sharesave scheme
The Sharesave awards are savings-related awards accruing over a three-year period from 1 November 2024. There are no performance conditions attached to the awards; as such, the sole condition for vesting is continued service. The fair value of the Sharesave options granted during the year was assessed by an independent actuary using a Black-Scholes model based on the assumptions set out in the table below:
|
|
|
Grant date August 2025 (UK three years) |
|
Number of options granted |
|
136,738 |
|
Share price at grant date |
(pence) |
666 |
|
Exercise price |
(pence) |
523 |
|
Risk-free rate of interest |
(% per annum) |
3.78% |
|
Expected volatility |
(% per annum) |
29.9% |
|
Expected dividend yield |
(% per annum) |
4.58% |
|
Expected term to exercise |
(years) |
3.23 |
|
Value per option |
(pence) |
174 |
Safestore Long Term Incentive Plan
2025 LTIP scheme
The fair values of the 2025 LTIP Scheme awards granted in the accounting period were assessed by an independent actuary using a Monte Carlo model based on the assumptions set out in the table below. In determining an appropriate assumption for expected future volatility, the historical volatility of the share price of Safestore Holdings plc has been considered along with the historical volatility of comparator companies.
|
|
|
Grant date January 2025 |
||
|
|
|
(PBT EPS part) |
(MLA part) |
(ESG part) |
|
Number of options granted |
|
733,128 |
281,972 |
112,789 |
|
Weighted average share price at grant date |
(pence) |
613 |
613 |
613 |
|
Exercise price |
(pence) |
- |
- |
- |
|
Weighted average risk-free rate of interest |
(% per annum) |
4.20% |
4.20% |
4.20% |
|
Expected volatility |
(% per annum) |
31.0% |
31.0% |
31.0% |
|
Weighted average expected term to exercise |
(years) |
3.0 |
3.0 |
3.0 |
|
Weighted average value per option |
(pence) |
3.47 |
3.47 |
3.47 |
Retention scheme
The retention scheme awards granted in the accounting period accrue over a three-year period from 1 November 2025. There are no market performance conditions attached to the awards; as such, the conditions for vesting are revenue, MLA, and personal performance targets. The fair value of the options granted during the year was assessed by an independent actuary using a Black-Scholes model based on the assumptions set out in the table below:
|
|
|
Retention scheme |
|
Number of options granted |
|
558,452 |
|
Share price at grant date |
(pence) |
8.10 |
|
Exercise price |
(pence) |
- |
|
Risk-free rate of interest |
(% per annum) |
3.99% |
|
Expected volatility |
(% per annum) |
29.2% |
|
Expected dividend yield |
(% per annum) |
3.73% |
|
Expected term to exercise |
(years) |
3.29 |
|
Value per option |
(pence) |
716 |
|
|
|
|
Details of the awards outstanding under all of the Group's share schemes are set out below:
|
Date of grant |
At 31 October 2024 |
Granted |
Exercised |
Lapsed |
At 31 October 2025 |
Exercise price |
Expiry date |
|
Safestore Holdings plc Sharesave scheme |
|
|
|
|
|
|
|
|
20/08/2021 |
19,160 |
- |
- |
(19,160) |
- |
824.0p |
01/05/2025 |
|
22/08/2022 |
21,653 |
- |
- |
(11,419) |
10,234 |
896.0p |
01/05/2026 |
|
22/08/2023 |
112,078 |
- |
- |
(61,236) |
50,842 |
692.0p |
01/05/2027 |
|
14/08/2024 |
93,100 |
- |
- |
(69,424) |
23,676 |
645.0p |
01/05/2028 |
|
08/08/2025 |
- |
136,738 |
- |
(4,911) |
131,827 |
522.8p |
01/05/2029 |
|
Total |
245,991 |
136,738 |
- |
(166,150) |
216,579 |
|
|
|
Safestore Long Term Incentive Plan - 2017 |
|
|
|
|
|
|
|
|
05/02/2019 |
17,500 |
- |
- |
- |
17,500 |
0.1p |
28/09/2027 |
|
23/01/2020 |
5,731 |
- |
(2,000) |
- |
3,731 |
0.1p |
28/09/2027 |
|
Total |
23,231 |
- |
(2,000) |
- |
21,231 |
|
|
|
Safestore Long Term Incentive Plan - 2020 |
|
|
|
|
|
|
|
|
18/03/2020 |
28,916 |
- |
(739) |
- |
28,177 |
0.0p |
17/03/2030 |
|
Total |
28,916 |
- |
(739) |
- |
28,177 |
|
|
|
Safestore Long Term Incentive Plan - 2021 |
|
|
|
|
|
|
|
|
28/01/2021 |
26,047 |
- |
(5,738) |
- |
20,309 |
0.0p |
27/01/2031 |
|
Total |
26,047 |
- |
(5,738) |
- |
20,309 |
|
|
|
Safestore Long Term Incentive Plan - 2022 |
|
|
|
|
|
|
|
|
25/01/2022 |
213,499 |
- |
- |
(213,499) |
- |
0.0p |
24/01/2032 |
|
29/09/2022 |
3,968 |
- |
- |
(3,968) |
- |
0.0p |
24/01/2032 |
|
Total |
217,467 |
- |
- |
(217,467) |
- |
|
|
|
Safestore Long Term Incentive Plan - 2023 |
|
|
|
|
|
|
|
|
12/07/2023 |
644,507 |
- |
- |
(18,983) |
625,524 |
0.0p |
11/07/2033 |
|
Total |
644,507 |
- |
- |
(18,983) |
625,524 |
|
|
|
Safestore Long Term Incentive Plan - 2024 |
|
|
|
|
|
|
|
|
27/02/2024 |
800,562 |
- |
- |
(27,221) |
773,341 |
0.0p |
26/02/2034 |
|
Total |
800,562 |
- |
- |
(27,221) |
773,341 |
|
|
|
Safestore retention scheme - 2025 |
|
|
|
|
|
|
|
|
17/07/2024 |
- |
558,452 |
- |
(17,248) |
541,204 |
0.0p |
16/07/2034 |
|
Total |
- |
558,452 |
- |
(17,248) |
541,204 |
|
|
|
Safestore Long Term Incentive Plan - 2025 |
|
|
|
|
|
|
|
|
20/01/2025 |
- |
1,127,889 |
- |
(44,454) |
1,083,435 |
0.0p |
19/01/2035 |
|
Total |
- |
1,127,889 |
- |
(44,454) |
1,083,435 |
|
|
In addition, gross amounts totalling £nil (FY 2024: £nil) in respect of bonuses awarded to Executive Directors for the year ended 31 October 2025 will be deferred into shares which will vest at the end of two years following the financial year in which the bonus is earned. The grant date is the last day of the financial year in which the performance stage is assessed. The share entitlement will be determined in FY 2026.
The weighted average exercise price of outstanding options under the Sharesave scheme is 593.5 pence (FY 2024: 702.6 pence). The weighted average exercise price of options exercised under the Sharesave scheme was nil pence (FY 2024: 599.7 pence).
Own shares
Included within retained earnings are ordinary shares with a nominal value of £177 (FY 2024: £177) that represent shares held by the Safestore Employee Benefit Trust in satisfaction of awards under the Group's Long Term Incentive Plan and which remain unvested.
24. Cash flow from operating activities
Reconciliation of operating profit to net cash inflow from operating activities:
|
Cash generated from continuing operations |
Notes |
2025 £'m |
2024 £'m |
|
Profit before income tax |
|
127.1 |
398.6 |
|
Gain on revaluation of investment properties |
13 |
(23.1) |
(292.2) |
|
Share of profit in joint ventures and associates |
11, 12 |
(2.5) |
- |
|
Depreciation |
14 |
1.5 |
1.5 |
|
Net finance expense |
7 |
32.2 |
27.2 |
|
Employee share options |
|
2.0 |
(0.3) |
|
Changes in working capital: |
|
|
|
|
Decrease in trade and other receivables |
|
0.8 |
1.2 |
|
Increase/(decrease) in trade and other payables |
|
0.5 |
(2.6) |
|
Decrease in provisions |
|
- |
(0.3) |
|
Cash generated from continuing operations |
|
138.5 |
133.1 |
25. Analysis of movement in gross and net debt
|
|
2024 £'m |
Cash flows £'m |
Non-cash movements £'m |
2025 £'m |
|
Borrowings |
(824.2) |
(105.2) |
(28.8) |
(958.2) |
|
Lease liabilities |
(100.6) |
10.3 |
(21.1) |
(111.4) |
|
Total gross debt (liabilities from financing activities) |
(924.8) |
(94.9) |
(49.9) |
(1,069.6) |
|
Cash in hand |
25.3 |
(13.9) |
(0.4) |
11.0 |
|
Total net debt |
(899.5) |
(108.8) |
(50.3) |
(1,058.6) |
|
|
2023 £'m |
Cash flows £'m |
Non-cash movements £'m |
2024 £'m |
|
Borrowings |
(725.8) |
(110.3) |
11.9 |
(824.2) |
|
Lease liabilities |
(101.4) |
9.7 |
(8.9) |
(100.6) |
|
Total gross debt (liabilities from financing activities) |
(827.2) |
(100.6) |
3.0 |
(924.8) |
|
Cash in hand |
16.9 |
8.7 |
(0.3) |
25.3 |
|
Total net debt |
(810.3) |
(91.9) |
2.7 |
(899.5) |
The table above details changes in the Group's liabilities arising from financing activities, including both cash and non-cash changes. Liabilities arising from financing activities are those for which cash flows were, or future cash flows will be, classified in the Group's consolidated cash flow statement as cash flows from financing activities.
The cash flows from borrowings are made up of the net amount of proceeds from borrowings, repayment of borrowings and debt issuance costs.
Non-cash movements relate to the amortisation of debt issue costs of £1.4 million (FY 2024: £1.6 million), foreign exchange movements of £27.3 million (FY 2024: £13.2 million), and modifications due to lease re-gearings of £21.1 million (FY 2024: £8.9 million).
26. Employees and Directors
|
Staff costs (including Directors) for the Group during the year |
2025 £'m |
2024 £'m |
|
Wages and salaries |
30.6 |
26.9 |
|
Social security costs |
3.4 |
3.3 |
|
Other pension costs |
1.1 |
1.0 |
|
Share-based payments |
2.0 |
(0.3) |
|
|
37.1 |
30.9 |
During the period ended 31 October 2025, the Company's equity-settled share-based payment arrangements comprised the Safestore Holdings plc Sharesave scheme and the Safestore Long Term Incentive Plans. The number of awards made under each scheme is detailed in note 23. No options have been modified since grant under any of the schemes, other than the modification in respect of the LTIP awards for Executive Directors described in note 23.
|
Average monthly number of people (including Executive Directors) employed |
2025 Number |
2024 Number |
|
Sales |
698 |
646 |
|
Administration |
138 |
142 |
|
|
836 |
788 |
|
Key management compensation |
2025 £'m |
2024 £'m |
|
Wages and salaries |
2.8 |
2.9 |
|
Social security costs |
0.7 |
0.4 |
|
Post-employment benefits |
0.1 |
0.1 |
|
Share-based payments |
0.8 |
- |
|
|
4.4 |
3.4 |
The key management figures given above include Directors.
|
Directors |
2025 £'m |
2024 £'m |
|
Aggregate emoluments |
2.5 |
2.2 |
27. Provisions
In France, the basis on which property taxes have been assessed has been challenged by the tax authority for financial years 2011 onwards. In November 2022, the French Supreme Court delivered a final judgement in respect of litigation for years 2011 to 2013, which resulted in a partial success for the Group. The Group is separately pursuing litigation in respect of years since 2013 and has lodged an appeal with the French administrative tribunal against the issues included in assessments for 2013 onwards on which it was ultimately unsuccessful in the French Supreme Court for the earlier years. A provision is included in the consolidated financial accounts of £2.3 million at 31 October 2025 (FY 2024: £2.3 million) to reflect the increased uncertainty surrounding the likelihood of a successful outcome. Of the total provided, £nil has been released in relation to the year ended 31 October 2025 (FY 2024: £(0.2) million within cost of sales (Underlying EBITDA)). The litigation is expected to be resolved over the next few years.
It is possible that the French tax authority may appeal the decisions of the French Court of Appeal in which the Group was successful to the French Supreme Court. The maximum potential exposure in relation to these issues at 31 October 2025 is £0.8 million (FY 2024: £0.8 million). No provision for any further potential exposure has been recorded in the consolidated financial statements since the Group believes it is more likely than not that a successful outcome will be achieved, resulting in no additional liabilities.
28. Contingent liabilities
The Group has a contingent liability in respect of property taxation in the French subsidiary as disclosed in note 27.
29. Capital commitments
The Group had £50.0 million of capital commitments as at 31 October 2025 (FY 2024: £119.0 million).
30. Related party transactions
The Group's shares are widely held. Transactions between the Company and its subsidiaries, which are related parties, have been eliminated on consolidation and are not disclosed in this note.
Transactions with PBC Les Groues SAS
As described in note 11, the Group has a 24.9% interest in PBC Les Groues SAS ("PBC"). The total amount invested in PBC is included as part of its non-current investments in associates. During the period, the Group purchased a fully developed store called La Défense from PBC for £7.2 million (€8.5 million) (FY 2024: £nil (€nil)). The balance outstanding at 31 October 2025 included within trade and other receivables was £nil (FY 2024: £nil).
Transactions with CERF II German Storage Topco S.a.r.l ("CERF II")
As described in note 11, the Group has a 10.0% interest in CERF II German Storage Topco S.a.r.l ("CERF II"). The total amount invested is included as part of its non-current investments in associates. During the period, the Group recharged £0.5 million (FY 2024: £0.4 million) relating to management and development services and earned £0.2 million (FY 2024: £0.1 million) in interest income. The balance outstanding at 31 October 2025 was £0.3 million (FY 2024: £0.5 million).
Transactions with EasyBox
As described in note 12, the Group has a 50.0% interest in the EasyBox joint venture. The total amount invested is included as part of its non-current investments in joint ventures. Safestore Italia S.R.L. (a wholly owned subsidiary of the Group) acts as property manager for the joint venture. In its capacity as property manager, it incurs costs on behalf of the joint venture which are recharged in accordance with the property management agreement. The balance of these recharges outstanding at 31 October 2025 was £0.4 million (FY 2024: £nil). During the period, Safestore Italia S.R.L also received a management fee from the joint venture of £0.8 million (FY 2024: £nil). The balance outstanding in relation to management fees at 31 October 2025 was £nil (FY 2024: £nil).
RNS may use your IP address to confirm compliance with the terms and conditions, to analyse how you engage with the information contained in this communication, and to share such analysis on an anonymised basis with others as part of our commercial services. For further information about how RNS and the London Stock Exchange use the personal data you provide us, please see our Privacy Policy.

Latest directors dealings
- 5 hours ago Gran Tierra Energy Inc. (CDI)
- 5 hours ago Polar Capital Holdings
- 5 hours ago PZ Cussons
- 6 hours ago Grainger
- 6 hours ago Molten Ventures VCT