
Half-year Financial Report
Summary by AI BETAClose X


LEI: 549300Q7EXQQH6KF7Z84
11 September 2026
RTW Biotech Opportunities Ltd
Half-Yearly Report for the six months ended 30 June 2026
Robust NAV growth supported by improving sector sentiment, significant M&A activity and breakthrough clinical innovation across the portfolio
RTW Biotech Opportunities Ltd (the "Group", "RTW Bio" or the "Company"), the London Stock Exchange-listed investment company focused on identifying transformative assets with high growth potential across the life sciences sector, is pleased to announce its Half Year Results for the six months ended 30 June 2026. Today at 10:00 BST, Chief Investment Officer, Rod Wong, and Senior Director, Oliver Kenyon, will host a webinar via the London Stock Exchange Group's SparkLive platform, registration available here. On 22 September, they will host a live Q&A, email biotechopportunities@rtwfunds.com to request a registration link.
Roderick Wong, MD, Managing Partner and Chief Investment Officer of RTW Investments, LP (the "Investment Manager") commented:
"The first half of 2026 demonstrated both the resilience of the biotechnology sector and the strength of RTW Bio's full life cycle investment strategy. Despite heightened geopolitical volatility during the first quarter, the sector recovered strongly in the second quarter, supported by improving capital markets activity, accelerating M&A and positive clinical data. Against this backdrop, RTW Bio's NAV per Ordinary Share returned +16.5% and the share price returned +12.0%, increasing NAV to US$922.0 million. Since our listing in 2019, NAV per Ordinary Share has grown by +175.0%, representing an annualised return of +15.8%, highlighting the long-term value created through our disciplined approach to identifying and backing transformative healthcare innovation.
"Performance during the period was driven primarily by our public investments, which represented 86.2% of NAV at 30 June 2026. As full life cycle investors, we have long believed that public equities are where much of biotechnology's value creation becomes visible, and this was again evident during the period. Our largest contributor was Kailera Therapeutics, the RTW co-incubated obesity company whose IPO in April was, at the time, the largest biotechnology IPO in history. We also benefited from strong performance in holdings such as Oruka Therapeutics and Tango Therapeutics, both of which delivered compelling clinical data that reinforced our investment theses. While Insmed and certain other commercial-stage names detracted amid first-quarter risk aversion, we remain focused on the long-term fundamentals underpinning these businesses.
"Strategic activity remained a defining feature of the biotechnology landscape. During the first half, five public portfolio companies announced acquisitions, including Penumbra, RAPT, Apellis, Centessa and Apogee. Several transactions were completed at substantial premiums, underscoring the value embedded within innovative biotechnology companies and reflecting the urgent need for large pharmaceutical companies to replenish their pipelines ahead of significant patent expiries. We continue to view this backdrop as a powerful and lasting driver of value realisation across the portfolio.
"Within our private portfolio, the successful IPO of Kailera represented an important validation of our company-building capabilities and the advantages of our full life cycle model. At the same time, we continued to make progress across several high-conviction private investments. Corxel remains our largest private holding and continues to advance its obesity and cardiometabolic pipeline, including CX11, with important clinical milestones expected in the months ahead. While private valuations often lag periods of public market recovery, we remain highly encouraged by the underlying operational and scientific progress being made across the portfolio.
"Looking ahead, we remain constructive on the outlook for biotechnology. The sector is benefiting from a combination of improving market sentiment, active M&A, a more supportive regulatory environment and an increasingly robust innovation cycle. Beyond the near-term recovery, we believe healthcare is entering a period of exceptional scientific productivity, driven by advances in genomics, novel therapeutic modalities and artificial intelligence-driven drug discovery. Against this backdrop, RTW Bio remains well positioned to capture opportunities across both public and private markets."
Key highlights:
Strong H1 NAV and share price performance: The Group delivered a +16.5% NAV per Ordinary Share return and a +12.0% share price return over the first half, taking NAV to US$922.0 million. Since the 2019 IPO, NAV per Ordinary Share has returned +175.0%, an annualised +15.8%, with a total shareholder return of +132.7% since admission.
The largest biotech IPO on record: Kailera Therapeutics, a co-incubated company, listed on Nasdaq in April, raising US$625 million and closing 62.5% above the offer price on debut. The listing represented a 139% step-up from its 31 March carrying value. It contributed +3.8% to NAV, the largest single contribution in the period.
Accelerating M&A across the portfolio: Five public holdings, Penumbra, RAPT, Apellis, Centessa and Apogee announced acquisitions during the period, several at substantial premiums. These included AbbVie's US$10.9 billion acquisition of Apogee in June at a 50% premium. Ten portfolio companies have been subject to announced M&A over the preceding twelve months.
Improving regulatory and capital markets backdrop: New leadership at the FDA has seen 23 novel drugs approved in the first half, the highest first-half total since 2023. US biotech issuance reached approximately US$29.9 billion across 144 transactions, with thirteen IPOs raising US$5.1 billion, more than in the whole of 2025.
Positioned in fast-growing verticals: 90% of NAV is invested in companies with late-stage clinical assets or commercial products, and 88% in mid and small-cap biotech. The portfolio is increasingly concentrated in obesity and cardiometabolic disease. Corxel's oral GLP-1 CX11 announced positive Phase 2 topline in June and Kailera is advancing a broad obesity pipeline, alongside oncology franchises in bladder, pancreatic and breast cancer.
Financial summary:
|
|
As at 30 June 2026 |
Change over period |
As at 31 December 2025 |
|
Net asset value (Ordinary Shares) |
$922.0 million |
+15.1% |
$800.9 million |
|
Net asset value per Ordinary Share |
$2.86 |
+16.5% |
$2.45 |
|
Ordinary Share price |
$2.42 |
+12.0% |
$2.16 |
|
Share price discount to Net Asset Value |
(15.4%) |
(3.4%) |
(12.0%) |
|
Number of Ordinary Shares in issue |
322.4 million |
(1.2%) |
326.4 million |
|
Russell 2000 Biotech Index |
|
+28.2% |
|
|
Nasdaq Biotech Index |
|
+15.4% |
|
|
AIC Biotechnology & Healthcare Sector |
|
+0.5% |
|
Public Investments (+21.8%):
|
• |
Portfolio composition: As at 30 June 2026, public investments represented 86.2% of NAV, reflecting strong appreciation of the public portfolio during the period. The portfolio remained concentrated in conviction-led positions, with 24 companies representing more than 1% of NAV and accounting for 79.1% of NAV. |
|
• |
Principal driver of performance: The public book drove returns over the period. Following a risk-off environment in the first quarter, the public book recovered strongly in the second quarter, benefiting from improving market sentiment, positive clinical data, a supportive FDA backdrop and accelerating M&A activity. |
|
• |
CG Oncology: Material exposure was added over the first half, taking the position from 0.3% at the year end to the Group's largest holding. Phase 3 topline data from the PIVOT-006 trial in high-risk non-muscle invasive bladder cancer is expected in the third quarter. |
|
• |
Oruka Therapeutics: A leading contributor (+3.8%) following April Phase 2 data in plaque psoriasis. 64% of treated patients achieved complete clearance, suggesting best-in-class potential for ORKA-001. |
|
• |
Tango Therapeutics: Benefited from highly encouraging pancreatic cancer data, with its programme demonstrating a response rate exceeding 90% when combined with Revolution Medicines' RAS(ON) inhibitor, reinforcing conviction in the company's oncology platform. |
|
• |
Detractors: Insmed was the largest public detractor during the period, impacted by concerns around prescription trends and the sustainability of early launch demand for Brinsupri. Verastem also detracted following less mature clinical data than the market had anticipated. |
|
• |
Robust M&A activity: Ten portfolio companies have been subject to announced M&A over the preceding twelve months. The five agreed in the period were struck at premiums of between 19% and 163%, led by Apellis at 163%, Centessa at 70% and RAPT at 65%. |
Private Investments (+0.8%):
|
• |
Portfolio composition: Private investments represented 17.8% of NAV at 30 June 2026. Three private positions exceeded 1% of NAV, accounting for 7.7% of the portfolio, alongside a further 39 private companies with exposures below 1%. |
|
• |
Active company building: RTW Investments' incubation strategy continued to generate attractive opportunities. The Group added three new private investments during the period and remained focused on developing differentiated companies in areas of high unmet medical need. |
|
• |
Valuation lag: The weighting of private investments declined during the period, reflecting the strong performance of the public portfolio and the tendency for private valuations to lag public market recoveries. Despite this, the Investment Manager continues to see compelling long-term value across the private portfolio. |
|
• |
Kailera Therapeutics (+3.8% contribution): The period's largest contributor to NAV. Having co-incubated the company, RTW Bio benefited from Kailera's April IPO, which was the largest biotechnology IPO on record at the time, delivering a significant uplift to the Group's carrying value and demonstrating the strength of the full life cycle investment model. |
|
• |
Corxel: Remained the Group's largest private investment (28% of private investments). The company continues to advance its obesity and cardiometabolic pipeline, including CX11, with positive topline Phase 2 data announced in June and a global Phase 3 US study to launch in early 2027. |
|
• |
Ensoma (-1.6% impact): The largest detractor in the period, reflecting a declining cash runway, uncertainty over future financing and a lack of positive clinical data supporting its lead asset. The position was subsequently written down by 86%. |
|
• |
Realisation track record: Both 2026 IPOs to date, Aktis Oncology in January and Kailera in April, priced at an average step-up of 1.3x to carrying value. Obsidian Therapeutics also agreed a reverse merger with Galera Therapeutics during the period, since completed. |
Royalty investments (+0.2%):
|
• |
Uncorrelated portfolio revenue stream: Representing 1.8% of NAV, the royalty sleeve added +0.2% to NAV in the first half. These positions continue to provide differentiated, income-oriented exposure and durable cash flows that offer ballast during periods of biotechnology equity volatility. |
|
• |
4010 Royalty Fund: Underlying assets continued to perform in line with or ahead of underwriting expectations. Of the Group's US$31.5 million commitment, US$15.5 million (49%) was deployed at period end, with US$10.6 million of distributions received and a period-end value of US$13.1 million. The fund is expected to be 89% deployed by the first quarter of 2027. |
|
• |
Second royalty vehicle: Reflecting this performance and the growing opportunity to provide launch finance conditional on drug approval, RTW Investments has commenced fundraising for a second royalty fund. RTW Bio plans to participate, with a first close expected in the autumn. |
Post period-end events:
|
• |
Celcuity: On 14 July, Celcuity's lead asset, gedatolisib, received FDA approval after positive Phase 3 data in advanced breast cancer, representing an important validation of the Company's oncology investment strategy. |
|
• |
Yarrow Bioscience completed its reverse merger with VYNE Therapeutics: On 28 July, our seventh company creation completed its previously announced reverse merger, alongside a US$200 million concurrent private financing led by RTW Investments. The combined company began trading on the Nasdaq Global Select Market under the ticker symbol "YARW". |
|
• |
Obsidian Therapeutics completed its reverse merger with Galera Therapeutics: On 4 August, the private portfolio company completed its previously announced reverse merger, following a US$350 million private financing completed shortly before the transaction. The combined company began trading on Nasdaq under the ticker symbol "OBX". |
|
• |
Avere Therapeutics announced merger with NextCure Inc.: On 12 August, we announced the planned merger of private portfolio company Avere Therapeutics with public company NextCure Inc. ("NXTC"). |
|
• |
Alesta Therapeutics to be acquired by BioMarin: On 19 August, we announced the planned acquisition of private portfolio company Alesta by public company BioMarin, Inc. |
Enquiries:
|
RTW Investments, LP - Investment Manager Oliver Kenyon Krisha McCune (Investor Relations)
|
+44 (0)20 7959 6362 |
|
Cadarn Capital - PR & IR Partner Lucy Clark (PR) David Harris (Distribution) |
+44 (0)7984 184 461 / lucy@cadarncapital.com +44 (0)7368 883 211 / david@cadarncapital.com
|
|
Jefferies International Limited - Joint Corporate Broker Gaudi Le Roux Harry Randall-Knowles
|
+44 (0)20 7029 8000 |
|
BofA Securities - Joint Corporate Broker Edward Peel Alex Penney
|
+44 (0)20 7628 1000 |
|
Altum (Guernsey) Limited Joanna Duquemin Nicolle Sadie Morrison
|
+44 (0)1481 703 100 |
About Biotech Opportunities Ltd:
RTW Biotech Opportunities Ltd (LSE: RTW) is an investment fund focused on identifying transformative assets with high growth potential across the biopharmaceutical and medical technology sectors. Driven by a long-term approach to support innovative businesses, RTW Biotech Opportunities Ltd invests in companies developing next-generation therapies and technologies that can significantly improve patients' lives. RTW Biotech Opportunities Ltd is managed by RTW Investments, LP, a leading healthcare-focused entrepreneurial investment firm with deep scientific expertise and a strong track record of supporting companies developing life-changing therapies.
Visit the website at www.rtwbio.com for more information.
Highlights
RTW Biotech Opportunities Ltd ("RTW Bio", "the Company" or, with its subsidiaries, "the Group") is a life sciences and investment innovation fund focused on identifying transformative assets with high growth potential across the biopharma and medtech sectors. We're powering medical breakthroughs that have the potential to transform the wellbeing of people around the world.
30 June 2026 Financial Highlights
|
US$922.0 million Ordinary NAV 31 Dec 2025: US$800.9 million
|
US$2.86 NAV per Ordinary Share 31 Dec 2025: US$2.45
|
|
+175.0% Ordinary NAV return since inception 31 Dec 2025: +136.0%
|
+132.7% total shareholder return since admission 31 Dec 2025: +107.7%
|
|
+15.8% annualised Ordinary NAV return since inception |
+13.0% annualised total shareholder return since admission |
|
+16.5% Ordinary NAV per share return YTD 31 Dec 2025: +35.7%
|
+12.0% total shareholder return YTD 31 Dec 2025: +54.8%
|
|
1.2x Leverage¹ 31 Dec 2025: 1.2x
|
US$2.42 price per Ordinary Share 31 Dec 2025: US$2.16
|
¹ Leverage is calculated per the Commitment Method of the AIFMD. Real economic exposure at the fund and position level (1.1x) is ultimately what impacts NAV as some positions are partially or fully hedged.
Portfolio Highlights
|
Significant capital markets activities announced in the portfolio¹: 2 IPOs, 5 public acquisitions, 1 reverse merger
|
3 new private companies added in the period |
|
Public exposure²: 86% Private exposure²: 18% Royalty exposure²: 2% |
90% NAV exposure to companies with late-stage clinical trials or commercial products³
88% NAV exposure to mid and small-cap biotechs
|
|
Average multiple on invested capital (MOIC) of private investments to liquidity event since inception: 1.6x Average holding period of private investments to liquidity event: 19 months |
|
1 |
In the prior interim period capital markets activities were presented for the private portfolio only. Now they are shown for the full portfolio. |
|
2 |
Exposure is shown as economic exposure as a percentage of NAV, the result of which could be more or less than 100%. |
|
³ |
Development stage exposures are analysed on portfolio companies with 1% or greater exposure. Exposures have been converted to sum to 100%. |
RTW Bio's Purpose and Long-Term Strategy
Transforming the lives of millions
RTW Bio's long-term strategy is anchored in identifying sources of transformational innovation with significant commercial potential by engaging in deep scientific research and a rigorous idea generation process, complemented by years of investment, company building, and transactional expertise.
Innovation in modern medicine is abundant. There are more companies pursuing that innovation than ever before. Finding and developing those that will ultimately succeed takes deep expertise and a robust process. Science informs everything we do.
Why Invest?
RTW Bio offers shareholders the benefit of exposure to a wide swath of investments in private and public companies in a sector requiring specialist expertise that would typically be a barrier to entry for most. As a publicly traded investment company, RTW Bio democratises investing beyond the private fund universe. The following investment platforms, though not an exhaustive list, provide direct access to buying shares:
· AJ Bell
· Halifax
Chair's Statement
On behalf of the Board, I am pleased to present the Group's Interim Report and Accounts for the six-month period to 30 June 2026. The first quarter tested the resilience of the recovery in the sector that took hold through the latter part of 2025, as the outbreak of conflict in the Middle East drove a sharp reversal in risk appetite. In the second quarter, biotech recovered its footing and in June delivered strong monthly performance.
Performance
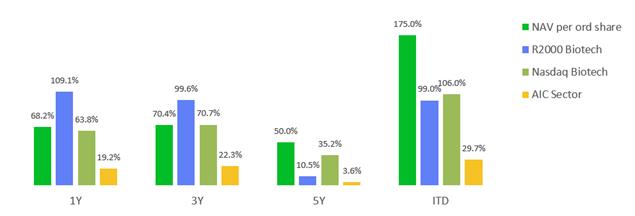
The Group's NAV per Ordinary Share returned +16.5% over the six-month period to 30 June 2026, compared with +28.2% for the Russell 2000 Biotechnology Index, +15.4% for the Nasdaq Biotechnology Index, and +0.5% for the AIC Biotechnology and Healthcare Sector. Since IPO in October 2019, the Group's NAV per Ordinary Share has compounded at +15.8% per annum, materially ahead of each of these reference indices and the peer group over the long term (see Figure 1).
The Group's share price returned +12.0% over the period. As is common during risk-off episodes, the share price lagged the NAV through the first-quarter volatility, and the discount to NAV consequently widened modestly from 12.0% at the year end to 15.4% at 30 June 2026. However, the discount remains tighter than the 28.8% at which the shares traded twelve months earlier, and the Board is confident that the combination of continued NAV outperformance, an active buyback programme, and improving sector sentiment provides a supportive backdrop for further progress on the rating over time.
Sector backdrop
The biotechnology sector entered 2026 with momentum, buoyed by a resurgent capital markets window and accelerating M&A. That momentum was interrupted in March, when geopolitical conflict reversed the capital flows that had been returning to the sector and pushed Treasury yields back towards prior highs. Commercial-stage and growth-oriented companies, which tend to be more widely held by generalist investors, bore the brunt of the ensuing risk aversion.
A combination of geopolitical de-escalation, change of leadership at the FDA, active M&A, and positive clinical data drove the sector sharply higher in June. The Board continues to frame sector risk around the familiar areas of regulatory policy, drug pricing and international trade, but over the period each of these was increasingly offset by the structural tailwinds of maturing science, disciplined capital allocation, and a strategic imperative for large pharma to replenish pipelines ahead of significant patent expiries.
Performance drivers
Performance over the period reflected a combination of company-specific successes and the broad recovery in the second quarter. The largest contributor was Kailera Therapeutics (+3.8%), the RTW-co-incubated obesity company, the IPO of which - at the time the largest in biotech history - delivered a substantial step-up over its carrying value. The upsized offering closed up 63% on the first day of trading, highlighting the strong demand for next-generation treatments for obesity.
The largest detractor in the first half was private investment Ensoma (-1.6%) after disappointing clinical data, reprioritising its pipeline and reducing head count.
M&A and the value of the portfolio
The Group again benefited meaningfully from strategic activity. Five public portfolio companies announced acquisitions during the period: Penumbra, RAPT, Apellis, Centessa, and Apogee, the latter acquired by AbbVie in June in a transaction valued at approximately US$10.9 billion. Several of these were struck at substantial premiums, underlining the latent value embedded within the portfolio and validating the Group's long-term, full life cycle approach to building exposure to high-quality innovation.
Capital allocation
Capital allocation remains a core focus for the Board. The Company evaluates share buybacks through a capital allocation lens, anchored in the core objective of long-term capital growth balanced with the parallel objective of narrowing the discount and recognising that maintaining sufficient liquidity is critical to protect and grow value in portfolio companies over time.
The buyback programme was initiated in July 2023 following the sale of Prometheus to Merck, with an initial commitment of up to $10 million. It was increased to $30 million in January 2024 following completion of the Arix Bioscience merger. In October 2025, the Board announced a further $15 million allocation considering heightened M&A activity within the portfolio. During the period under review, 4.0 million Ordinary Shares were repurchased at a cost of approximately US$8.6 million. Since the programme began through the end of the period, the Company has returned US$34.6 million to shareholders through buybacks.
The Board has previously stated that, should significant cash inflows be received through portfolio M&A, it remains its intention to consider returning a portion of realised gains to shareholders through NAV-accretive buybacks.
Annual General Meeting
The Company held its Annual General Meeting on 11 June 2026. I am pleased to report that all resolutions were passed without amendment, including the renewal of the share buyback authority. On behalf of the Board, I would like to thank shareholders for their continued engagement and support.
Outlook
Looking ahead, the Board remains optimistic. The recovery that began in the second half of 2025 has reasserted itself, and the underlying drivers appear durable: an active M&A market, supportive capital markets, an improving regulatory environment, and a rich calendar of clinical catalysts. Beyond the cyclical recovery, the Board shares the Investment Manager's conviction that the sector is entering a period of exceptional scientific productivity, underpinned by the convergence of genomics, new therapeutic modalities, and artificial intelligence. We believe RTW Bio is well positioned to capture the value these dynamics will create.
|
William Simpson |
|
|
Chair of the Board of Directors |
|
|
RTW Biotech Opportunities Ltd |
|
|
11 September 2026 |
|
Report of the Investment Manager
The sector ended the first half of 2026 sharply higher with the Russell 2000 Biotechnology Index up +28.2% year-to-date, +15.4% for the Nasdaq Biotechnology Index, and +0.5% for the AIC Biotechnology and Healthcare Sector, despite a difficult first quarter. Geopolitical tensions reversed institutional inflows into biotech, sending Treasury yields back towards prior highs and weighing most heavily on commercial-stage names. In June, a combination of de-escalation, positively received change of leadership at the FDA, the two largest acquisitions of the year, and a landmark IPO by Parabilis drove the sector to one of the strongest monthly gains in recent history.
As full life cycle investors, our conviction is that most value creation in biotech is first recognised in the public markets, while earlier engagement ahead of IPOs and other liquidity events remains an important source of long-term opportunity. Over the period, both these dynamics were on display: our public holdings drove performance as sentiment recovered, while our private book delivered Kailera's record-breaking IPO.
Table 1. Financial Highlights in the period
|
|
As at 30 June 2026 |
Change over period |
As at 31 December 2025 |
|
|
Net asset value (Ordinary Shares) |
$922.0 million |
+16.5% |
$800.9 million |
|
|
Net asset value per Ordinary Share |
$2.86 |
+16.5% |
$2.45 |
|
|
Ordinary Share price |
$2.42 |
+12.0% |
$2.16 |
|
|
Share price discount to Net Asset Value |
(15.4%) |
(3.4%) |
(12.0%) |
|
|
Number of Ordinary Shares in issue |
322.4 million |
(1.2%) |
326.4 million |
|
|
Russell 2000 Biotech Index |
|
+28.2% |
|
|
|
Nasdaq Biotech Index |
|
+15.4% |
|
|
|
AIC Biotechnology & Healthcare Sector |
|
+0.5% |
|
|
Figure 1. Historical Performance Characteristics as at 30 June 2026
Public Investments
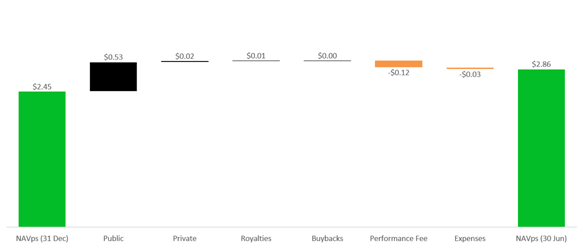
Public investments, representing 86.2% of NAV at 30 June 2026, were the principal driver of performance over the period, adding +21.8% to NAV. After a difficult first quarter in which commercial-stage names underperformed amid broad de-risking, seasonal prescription softness, and geopolitically-driven risk aversion, the public book recovered strongly in the second quarter. This was driven both by improving sentiment and a dense calendar of clinical and commercial catalysts. Over the first half we added material exposure to CG Oncology, whose lead asset cretostimogene is in a Phase 3 trial for high-risk non-muscle invasive bladder cancer with topline data expected in the second half. The oncology results that followed at ASCO - in pancreatic, breast, and bladder cancer - reinforced our conviction in the thesis.
Table 2. Public positions greater than 1% exposure as at 30 June 2026 compared to 31 December 2025¹,²
|
Portfolio Company |
Ticker |
Description |
Therapeutic Area |
Location |
$ Position Size in millions |
% NAV 30 June 2026 |
% NAV 31 December 2025 |
|
CG Oncology |
CGON |
Innovative therapeutics for bladder cancer. |
Oncology |
US/CAN |
$73.2 |
7.2% |
0.3% |
|
UroGen |
URGN |
Innovative treatments for bladder and specialty cancers. |
Oncology |
ROW |
$68.4 |
6.8% |
5.0% |
|
Kailera |
KLRA |
RTW Investments co-incubation developing treatments for obesity and related metabolic conditions. |
Metabolic |
US/CAN |
$59.7 |
5.9% |
3.4% |
|
Oruka |
ORKA |
Antibody therapies for chronic skin and inflammatory conditions. |
Inflammation & Immunology |
US/CAN |
$56.0 |
5.5% |
1.4% |
|
argenx SE |
ARGX |
Antibody treatments for autoimmune diseases. |
Inflammation & Immunology |
UK/EUR |
$55.2 |
5.5% |
2.2% |
|
Tango |
TNGX |
Therapies for pancreatic and lung cancer. |
Oncology |
US/CAN |
$50.2 |
5.0% |
0.1% |
|
Stoke |
STOK |
RNA-based medicines to restore protein expression. |
Neurology |
US/CAN |
$37.7 |
3.7% |
5.2% |
|
Celcuity |
CELC |
Treatments for breast and prostate cancer. |
Oncology |
US/CAN |
$37.2 |
3.7% |
0.3% |
|
Spyre |
SYRE |
Antibody therapies for inflammatory bowel disease. |
Inflammation & Immunology |
US/CAN |
$35.5 |
3.5% |
1.5% |
|
Erasca |
ERAS |
Precision oncology to treat RAS- and MAPK pathway-driven cancers. |
Oncology |
US/CAN |
$34.1 |
3.4% |
0.0% |
|
Immatics |
IMTX |
Targeted cancer immunotherapies. |
Oncology |
UK/EUR |
$31.2 |
3.1% |
2.7% |
|
PTC |
PTCT |
Rare neurological and metabolic conditions. |
Neurology |
US/CAN |
$25.0 |
2.5% |
11.6% |
|
Compass Pathways |
CMPS |
Novel treatments for mental health disorders. |
Neurology |
UK/EUR |
$21.3 |
2.1% |
1.2% |
|
GH Research |
GHRS |
Novel therapies for treatment-resistant depression. |
Neurology |
UK/EUR |
$21.2 |
2.1% |
1.2% |
|
Protagonist |
PTGX |
Peptide-based treatments for diseases with significant unmet medical need. |
Inflammation & Immunology |
US/CAN |
$20.6 |
2.0% |
1.6% |
|
uniQure |
QURE |
Gene therapies for patients with severe medical needs. |
Neurology |
UK/EUR |
$18.8 |
1.9% |
1.0% |
|
Ultragenyx |
RARE |
Novel therapeutics for rare and ultra-rare genetic diseases. |
Rare Disease |
US/CAN |
$17.7 |
1.8% |
0.3% |
|
Tarsus |
TARS |
First-in-class therapeutics for eye conditions. |
Ophthalmology |
US/CAN |
$16.7 |
1.7% |
2.8% |
|
Insmed |
INSM |
Serious and rare diseases. |
Pulmonary |
US/CAN |
$15.9 |
1.6% |
3.9% |
|
Establishment Labs² |
ESTA |
Medical technology company commercialising body shaping implants. |
Other |
US/CAN |
$13.4 |
1.3% |
1.0% |
|
Taysha |
TSHA |
Gene therapies for severe genetic diseases of the central nervous system. |
Neurology |
US/CAN |
$13.2 |
1.3% |
1.5% |
|
RadNet |
RDNT |
Leading US outpatient diagnostic imaging services. |
Other |
US/CAN |
$12.1 |
1.2% |
1.3% |
|
Aktis |
AKTS |
Alpha radiopharmaceuticals for cancer care. |
Oncology |
US/CAN |
$11.3 |
1.1% |
0.6% |
|
Tenax |
TENX |
Therapies for cardiopulmonary conditions. |
Cardiovascular |
US/CAN |
$11.2 |
1.1% |
1.1% |
|
Neurocrine |
NBIX |
Treatments for neurological and endocrine-related diseases. |
Rare Disease |
US/CAN |
$11.2 |
1.1% |
0.7% |
|
iRhythm |
IRTC |
Monitoring solutions to detect cardiac arrhythmias. |
Cardiovascular |
UK/EUR |
$11.1 |
1.1% |
1.0% |
|
Madrigal |
MDGL |
Treatments for MASH, a serious liver disease. |
Metabolic |
US/CAN |
$11.1 |
1.1% |
1.9% |
|
Milestone² |
MIST |
Nasal spray for acute at-home treatment of heart rhythm disorders. |
Cardiovascular |
US/CAN |
$10.6 |
1.0% |
1.3% |
|
|
|
|
|
|
Total>1%
Total <1% (45 companies) Total Public |
79.1%
7.1%
86.2% |
|
1 Positions are shown on a net basis. Any differences with the Schedule of Investments are due to short holdings and/or derivative securities.
2 Includes both public securities and private securities of publicly traded companies.
Kailera Therapeutics was the standout contributor, adding +3.8% to NAV. Having co-incubated the company, we retained our position through its April IPO - at the time the largest in biotech history - capturing a substantial step-up over the pre-IPO carrying value and demonstrating the value of our full life cycle model at its most productive.
Other large contributors included Oruka Therapeutics, which reported Phase 2 data suggesting best-in-class potential for ORKA-001 for psoriasis and Tango Therapeutics, which in June announced data from the Phase 1/2 of its drug vopimetostat in combination with Revolution Medicines' RAS(ON) inhibitor in pancreatic cancer. The combination shrank pancreatic cancer tumours by at least 30% in 11/12 patients in the trial, a 92% overall response rate.
Our development-stage holdings delivered meaningful alpha, concentrated around the ASCO oncology conference, an unusually consequential meeting for the portfolio. Celcuity presented Phase 3 data for gedatolisib in PIK3CA-mutant advanced breast cancer, more than doubling the time patients lived without disease progression relative to standard of care. Post period end, gedatolisib went on to receive FDA approval. Immatics presented Phase 1 data for IMA203 CD8 in heavily pre-treated ovarian cancer, achieving a 63% response rate including complete responses from a single infusion, a striking result in a historically immunotherapy-resistant tumour. In immunology, Spyre reported Phase 2 ulcerative colitis data that suggests it could have best-in-class efficacy, and our neuropsychiatric holdings Compass Pathways and GH Research benefited from an executive order accelerating approval pathways for psychedelic medicines. Compass also received a Commissioner's National Priority Voucher, which could shorten FDA review time.
The regime change at the FDA was directly beneficial for several of our rare and genetic medicines holdings. A test case for maturing FDA rare and genetic medicine policy, uniQure announced that the agency had reverted to accepting long-term data from its Phase 1/2 Huntington's disease study as the basis for filing, Replimune secured a willingness to re-review its previously rejected melanoma BLA, and Taysha and Neurogene both rose on renewed optimism around gene therapy for rare disease.
Figure 2. Performance breakdown for the period ending 30 June 2026
The largest public detractor was Insmed, one of a small number of commercial names affected by first-quarter prescription seasonality. The company beat sell-side consensus but fell short of more optimistic estimates. When management acknowledged on their earnings call that the early launch included a patient bolus - an initial surge that typically fades - and raised drug discontinuations for the first time, it triggered concerns about the sustainability of Brinsupri's demand trajectory. Other significant detractors included Verastem, which in June reported data from its Phase 1/2 across pancreatic, colorectal and lung cancers. Management downplayed efficacy ahead of the data, which was lacklustre and immature across all cohorts of patients. The vast majority had not hit the six-month follow up mark yet. The market had hoped for more definitive data, particularly given the pace of competing programmes from Revolution Medicines and others in RAS-driven cancers.
Private Investments
Private investments represented 17.8% of NAV at 30 June 2026 and returned +0.8%. Kailera Therapeutics, our second-largest private holding entering the year, went public on Nasdaq in April, raising US$625 million in the largest biotech IPO on record at the time. The shares closed 62.5% above the offer price on debut, a 139% step-up from RTW Bio's 31 March 2026 carrying value.
The largest detractor in the period was private portfolio company Ensoma, returning -1.6% in the first half of the year after a lack of positive clinical data supporting its lead asset, reprioritising its pipeline and reducing head count.
Table 3. Private positions greater than 1% exposure, as at 30 June 2026 compared to 31 December 2025 ¹
|
Portfolio Company |
Description |
Therapeutic Area |
Location |
$ Position Size in millions |
% NAV 30 June 2026 |
% NAV 31 December 2025 |
|
Corxel |
RTW Investments-incubated company committed to targeting underserved patients with cardiometabolic diseases. |
Metabolic |
ROW |
$50.0 |
4.9% |
6.2% |
|
Artios |
Breakthrough cancer treatments that target DNA Damage Response pathways. |
Oncology |
UK/EUR |
$15.0 |
1.5% |
1.6% |
|
Prolium |
RTW Investments-incubated company developing bispecific antibodies for autoimmune diseases. |
Inflammation & Immunology |
US/CAN |
$13.6 |
1.3% |
1.5% |
|
|
|
|
|
Total > 1% |
7.7% |
|
|
|
|
|
|
Total < 1% (39 companies) |
10.1% |
|
|
|
|
|
|
Total Private |
17.8% |
|
¹ Positions are shown on a net basis. Any differences with the Schedule of Investments are due to short holdings and/or derivative securities.
Corxel, our RTW-incubated cardiometabolic company developing an oral GLP-1 for obesity and Type 2 diabetes, is the Group's largest private investment. Its US$287 million Series D-1 financing completed in January supports the advancement of the CX11 obesity treatment pill through a US Phase 2 study, with positive topline results reported in June demonstrating up to 11.5% weight loss at 36 weeks and no slowing trajectory . We continue to view obesity and cardiometabolic disease as one of the most compelling secular themes in the sector, and our private portfolio is increasingly concentrated in areas of durable structural tailwind. In particular, we believe the oral format is as consequential as the mechanism. Injectable GLP-1s have proven the demand; a pill unlocks the patients who won't or can't use them.
We remained active in company creation, which we regard as a distinctive source of long-term value. Since inception, RTW Investments has launched ten NewCos, reflecting the increasing maturity of our company creation engine and its capacity to source, structure, and build around differentiated assets. Except for the first, which was founded prior to RTW Bio's launch, RTW Bio has participated in nine, as detailed in Table 4 below. Two of these NewCos, Yarrow Bioscience and Serapha Bio, have pursued reverse merger paths to public listing, each executed alongside sizable concurrent Series A and PIPE financing commitments that provided substantial capital at the point of transition. Yarrow completed its public listing on 28 July 2026, and we expect two additional portfolio companies to achieve public listings by year-end or Q1 2027. We aim to continue the cadence of innovative development and achieving value inflection and liquidity events that characterise RTW's full life cycle approach to company creation.
Sourcing for the NewCo portfolio has been very successful in drawing from multiple, complementary channels: clinical-stage assets originating from China, externalisation of non-core programmes from large pharma, and novel development strategies ideated internally. This diversified approach has allowed RTW Bio to build a pipeline of companies spanning multiple therapeutic areas and stages of development while maintaining the disciplined and derisked underwriting standards central to RTW's investment philosophy.
Clinical progress across the NewCo portfolio also continues to build momentum. Corxel will be initiating a global Phase 3 study in obesity in early 2027. Yarrow is conducting a Phase 2 study for Graves' Disease, Amani will be initiating a Phase 1b study in schizophrenia, and Prolium is executing in a Phase 1/2 study as well as several trials across multiple autoimmune disorders including lupus. Two additional NewCos, to be unveiled later, are developing preclinical-stage therapeutics for neurodegeneration and neuropsychiatric disorders respectively. Taken together, this progress reflects the maturation of RTW's team, process, and company creation infrastructure, with an engine we believe is now capable of launching three to five high potential new biotech companies per year.
Table 4. Summary of RTW Investments-created NewCos as at 30 June 2026
|
NewCo Investment |
Ticker |
Initial Investment |
Area of Focus |
$ Position Size In millions |
% NAV 30 June 2026 |
|
Rocket Pharmaceuticals |
RCKT |
09 November 2015¹ |
Rare Disease |
$8.8 |
0.9% |
|
Corxel Pharmaceuticals |
Private |
10 February 2020 |
Metabolic |
$50.0 |
4.9% |
|
Yarrow Biotechnology |
Private |
14 May 2021 |
Neurology |
$0.01 |
0.0% |
|
Kailera Therapeutics |
KRTX |
12 June 2024 |
Metabolic |
$59.7 |
5.9% |
|
Prolium Bioscience |
Private |
09 January 2025 |
Inflammation & Immunology |
$13.6 |
1.3% |
|
Amani Therapeutics |
Private |
19 August 2025 |
Neuropsychiatry |
$7.4 |
0.7% |
|
Yarrow Bioscience |
YARW |
18 December 2025 |
Endocrinology |
$8.2 |
0.8% |
|
Serapha Bio |
Private |
18 June 2026 |
Gene Editing |
$7.5 |
0.7% |
|
NewCo 8 |
Private |
2H 2026² |
Neurodegeneration |
$0 |
0% |
|
NewCo 9 |
Private |
21 May 2026 |
Neuropsychiatry |
$0.4 |
0.0% |
¹ RTW Bio invested in Rocket after it had already gone public.
² NewCo 8 was created in April 2026 but is yet to be funded.
Royalties
The Group's royalty positions, contributing +0.2% over the period and representing 1.8% of NAV, continued to provide differentiated, income-oriented exposure that offers ballast during periods of equity volatility. The Group's primary royalty exposure is through the RTW Investments-managed 4010 Royalty Fund, whose underlying assets continued to perform in-line with or ahead of underwriting expectations. The 4010 Royalty Fund was 49% deployed as at 30 June 2026 and is expected to be 89% deployed by the first quarter of 2027. Reflecting this compelling performance and the growing opportunity to provide launch finance conditional on drug approval, the Investment Manager has commenced fundraising for a second royalty fund, in which RTW Bio plans to participate, with a first close expected in the autumn.
Table 5. Royalty positions greater than 1% exposure as at 30 June 2026 compared to 31 December 2025
|
Portfolio Company |
Description |
Therapeutic Area |
Location |
$ Position Size in millions |
% NAV 30 June 2026 |
% NAV 31 December 2025 |
|
4010 Royalty |
Private RTW-managed fund aiming to generate returns from rights to royalty stream distributions from life sciences companies. |
Various |
US/CAN |
$13.1 |
1.3% |
1.7% |
|
|
|
|
|
Total > 1% |
1.3% |
|
|
|
|
|
|
Total < 1% |
0.5% |
|
|
|
|
|
|
Total Royalty |
1.8% |
|
Table 6. 4010 Royalty Fund as at 30 June 2026
|
4010 Royalty Fund |
|
|
Commitment |
$31.5m |
|
Deployed |
$15.5m (49%) |
|
Undeployed |
$16.0m (51%) |
|
Distributions received |
$10.6m |
|
Period-End Value |
$13.1m |
Portfolio Breakdown and Top Positions
Figure 3. NAV capital breakdown as at 30 June 2026 and 31 December 2025
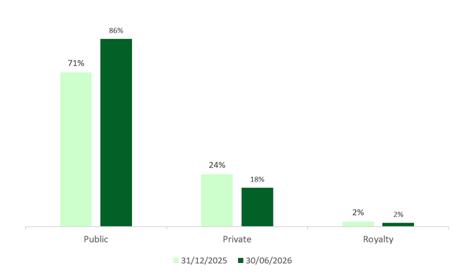
Table 7. Top 10 positions as at 30 June 2026¹
|
Portfolio Company |
Description |
Ticker |
Therapeutic Area |
Clinical stage |
Upcoming catalyst |
% NAV |
|
CG Oncology |
Innovative therapeutics for bladder cancer. |
CGON |
Oncology |
Phase 3/Pivotal |
P3 topline data Q326 |
7.2% |
|
UroGen |
Innovative treatments for bladder and specialty cancers. |
URGN |
Oncology |
Commercial |
Quarterly Zusduri earnings |
6.8% |
|
Kailera |
RTW Investments co-incubated company developing treatments for obesity and related metabolic conditions. |
KLRA |
Metabolic |
Phase 3/Pivotal |
P3 oral + injectable mid27 |
5.9% |
|
Oruka |
Antibody therapies for chronic skin and inflammatory conditions. |
ORKA |
Inflammation & Immunology |
Phase 2 |
Psoriasis wk 28 follow-on data Q326 |
5.5% |
|
argenx SE |
Antibody treatments for autoimmune diseases. |
ARGX |
Inflammation & Immunology |
Commercial |
Quarterly Vygart Earnings |
5.5% |
|
Tango |
Vopimetostat for pancreatic and lung cancer. |
TNGX |
Oncology |
Phase 2 |
Present P1/2 vopi + daraxon at ESMO Q426
|
5.0% |
|
Corxel |
RTW Investments-incubated company targeting underserved patients with cardiometabolic diseases. |
Private |
Metabolic |
Phase 3/Pivotal |
CX11 global P3 study to launch early 2027 |
4.9% |
|
Stoke |
RNA-based medicines to restore protein expression. |
STOK |
Neurology |
Phase 3/Pivotal |
P3 topline data mid 2027 |
3.7% |
|
Celcuity |
Gedatolisib for advanced breast cancer and metastatic castration resistant prostate cancer. |
CELC |
Oncology |
Phase 3/Pivotal |
Launch and Q4 sales of gedatolisib |
3.7% |
|
Spyre |
Antibody therapies for inflammatory bowel disease and rheumatic diseases. |
SYRE |
Inflammation & Immunology |
Phase 2 |
Ulcerative colitis Part B topline data in 2027 |
3.5% |
¹ Positions are shown on a net basis. Any differences with the Schedule of Investments are due to short holdings and/or derivative securities.
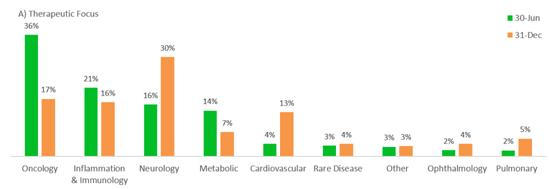
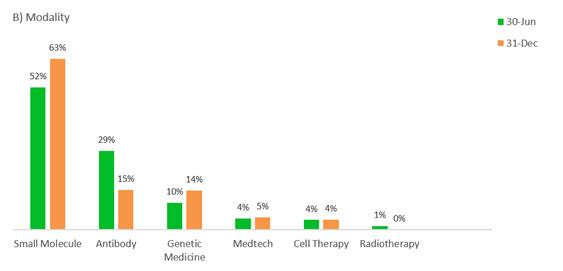
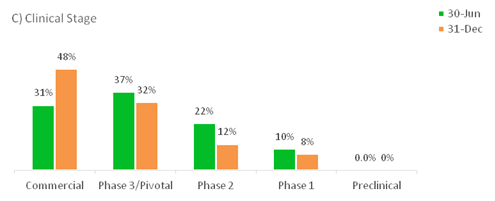
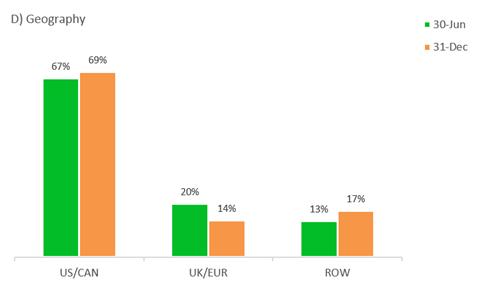
Figure 4. Breakdown of portfolio positions greater than 1% exposure as a percentage of NAV, adjusted to sum to 100%, by (A) Therapeutic Focus, (B) Modality, (C) Clinical Stage and (D) Geography as at 30 June 2026 and 31 December 2025. Therapeutic Focus, Modality and Geography do not include royalty vehicles
Private Portfolio Valuations and Cash Runway Analysis
The private positions are the foundation of the Group's strategy. They are built on our rigorous assessment of the best investment opportunities we can find. We are highly selective in this area, focusing only on companies with both well-founded science and attractive commercial prospects. We have benefited from this discipline when navigating a challenging capital markets environment. Our private portfolio remains well-sized and well-funded.
As at 30 June 2026, the average cash runway of our private companies was 16 months. The decrease in the 0-6 months category and the increase in the 6-12 months category was largely due to Corxel's US$287 million Series D1 financing completed in January; Corxel is the Group's largest private holding at US$50 million and represents 28% of the private book. The decrease in the >24 months category was due to two private investments going public during the period via IPO (Aktis and Kailera) and one reverse merger completed post period-end (Yarrow) and thus being disregarded from the analysis as at period end.
Figure 5. Private portfolio - approximate cash runway as at 30 June 2026 and 31 December 20251
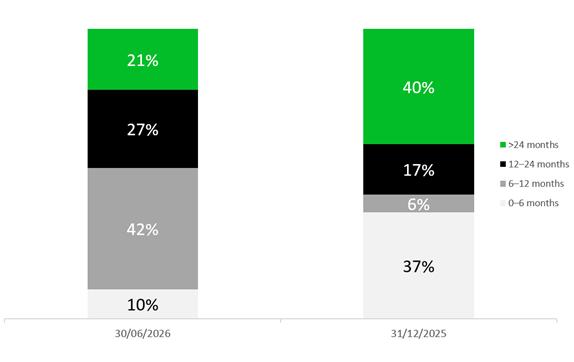
¹ Cash runway is presented as a percentage of private NAV.
We hold our private company investments at 'fair value', i.e., the price that would be received to sell an asset or paid to transfer a liability in an orderly transaction between market participants. Valuations are assessed in accordance with US GAAP, using techniques consistent with the International Private Equity and Venture Capital ("IPEV") Guidelines, including, but not limited to, the income approach and the market approach. Valuations are adjusted both during regular cycles and on an ad hoc basis in response to 'trigger events', which may include changes in fundamentals, an intention to carry out an IPO, financing transactions or changes in the valuations of comparable public companies. This process ensures that private companies are valued both fairly and timely.
The Board delegates valuation of the private investments to the Investment Manager, while the Board's Audit Committee oversees the integrity of the valuation process and conducts an independent review of the Investment Manager's policies and procedures twice a year, during the interim and annual statements, and on an ad hoc basis when appropriate.
The process is overseen by the Investment Manager's Valuation Committee. The committee is supported by a valuation team independent from the investment team and receives advice from two independent third-party valuation firms. The Valuation Committee approves valuations of private company investments on a monthly basis and incorporates independent third-party analysis no less frequently than twice a year to determine the fair value of each material private investment.
Figures 6-8. Private Valuation Statistics for H1 2026
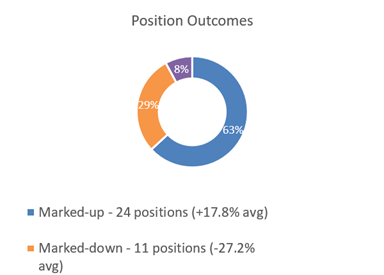
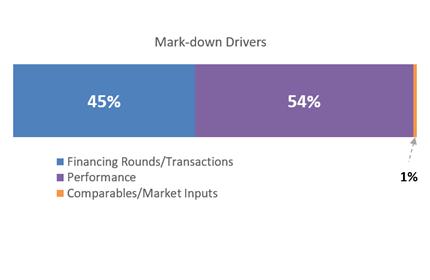
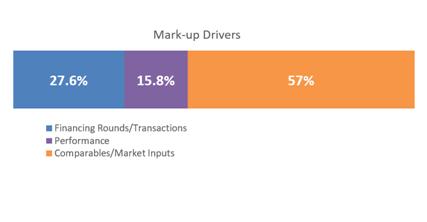
Table 8. Private Valuation Statistics for H1 2026¹
|
Statistic |
H1 2026 |
|
Number of revaluations in H1 2026² |
35 |
|
Average revaluations per investment |
1 |
|
Average time since last third-party valuation (weeks) |
5.2 |
|
Average time since last financing round (years) |
1.1 |
|
Average MOIC to go-public event³ |
+1.3x |
¹ Does not include certain immaterial positions acquired as part of the Arix transaction or private securities of public companies.
² Approximately half of RTW Bio's private investments were valued based on observable inputs from recent financing transactions. The balance was valued utilising alternative methodologies, including the income approach, market approach, and probability-weighted expected return method (PWERM), as deemed appropriate.
³ Includes 2 IPOs.
In the first half of 2026, 38 private and royalty positions underwent 35 valuation adjustments, averaging one per position. 24 positions were marked up by an average of +17.8%, while 11 positions were marked down by an average of -27.2%, resulting in an average overall valuation change of +3.3%. The balance remained unchanged. Around 0.9% of markdowns were primarily driven by changes to relative comparables or market-based inputs, while 56.6% of markups were primarily driven by comparables, 27.6% by financing rounds or specific transactions and 15.8% by company performance. At year-end, the average time since the last third-party valuation was just 5.2 weeks, and the average time since the last financing round was around 13 months.
We believe the value of the private portfolio is best demonstrated by go-public events or transactions. In H1 2026, there were two IPOs, Aktis Oncology and Kailera, with average step-ups from holding value of 1.3x. Private company Obsidian Therapeutics announced a reverse merger with Galera Therapeutics which closed post period-end, further validating the latent value within our portfolio. These continue to illustrate the strong potential of the portfolio, consistent with our historical experience. These events help us to calibrate our valuation process and continue to illustrate the strong potential of the portfolio.
Figure 9. Average Multiple of Invested Capital (MOIC) by vintage on 1) privates to liquidity event, 2) fully exited positions and 3) privates with no liquidity event
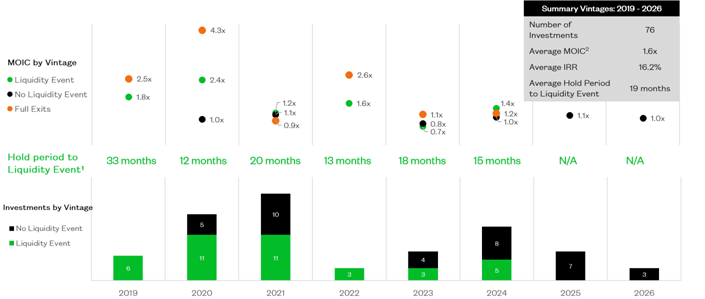
As at 30 June 2026. Past performance is not indicative of future results.
¹ Liquidity event = IPO, SPAC merger, reverse merger, acquisition from private.
² Multiple of Invested Capital ("MOIC") represents the ratio of total value to the corresponding amount of total capital invested, expressed as a multiple. Gross MOIC is utilised, calculated before management fees, carried interest, taxes and other expenses, which would reduce performance and the rate of return.
Sector Review
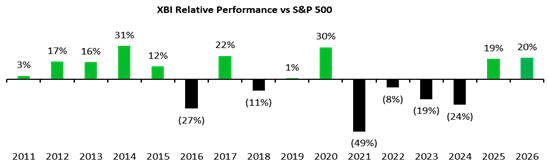
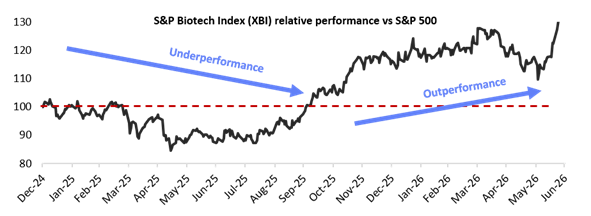
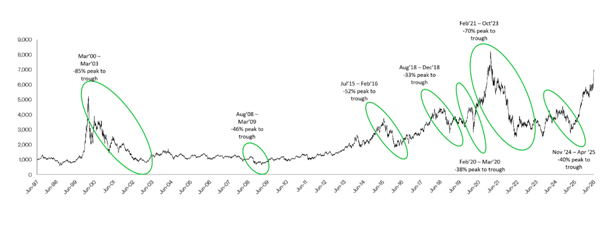
The first half of 2026 continued the recovery that began in the second half of 2025, interrupted but not derailed by the first-quarter geopolitical shock. Having ended a four-year bear market in 2025, biotech reasserted its leadership in the first half of 2026: the XBI finished the period up +28.7% year-to-date, outpacing the S&P 500 by more than 18 points, the Nasdaq by around 10 points, and the Russell 2000 by nearly 6 points. June alone accounted for a +15.5% gain, among the largest monthly returns in the sector's recent history as the market decoupled sharply from broader equities. Notwithstanding this strength, biotech valuations remain well below their 2021 peaks, and the sector remains, in our view, under-owned and attractively valued.
Figure 10. Sector outperformance after an unprecedented four years' underperformance of the broader market¹
¹ Bloomberg as at 30 June 2026.
Figure 11. After a rocky start, the XBI ended the year up vs S&P 500 and continues to outperform 1
¹ Bloomberg as at 30 June 2026.
Figure 12. Russell 2000 Biotechnology Index Value¹
¹ Bloomberg as at 30 June 2026.
M&A
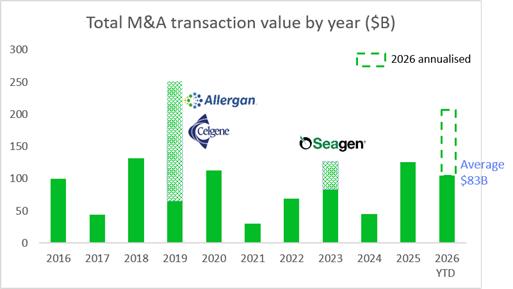
M&A was the defining feature of the first half. Strategic appetite from large-cap pharma remains structurally robust, driven by significant looming patent expiries with up to $300 billion of branded revenue at risk and balance sheets bolstered by growing obesity-franchise revenues. First-quarter announced deal value reached approximately US$48.5 billion, placing 2026 on track to be among the strongest years on record, and June delivered the year's two largest transactions - GSK's US$10.6 billion acquisition of Nuvalent and AbbVie's US$10.9 billion acquisition of our portfolio company Apogee ("APGE"). Across the portfolio, five holdings were subject to acquisition during the period as set out in the table below, several at substantial premiums, underscoring how deeply discounted certain names had become relative to their strategic worth.
Table 9. Acquisitions of portfolio companies over the preceding twelve months
|
Announced |
Portfolio Company |
Acquiring Company |
Transaction value |
Premium to closing share price |
|
July 2025 |
Verona |
Merck |
$10.0bn |
23% |
|
September 2025 |
Merus |
Genmab |
$8.0bn |
41% |
|
September 2025 |
Alcyone (private) |
Biogen |
$85m + milestones |
* |
|
October 2025 |
Akero |
Novo Nordisk |
$5.2bn |
17% |
|
October 2025 |
Avidity |
Novartis |
$12bn |
46% |
|
January 2026 |
Penumbra |
Boston Scientific |
$14.5bn |
19% |
|
January 2026 |
RAPT |
GSK |
$2.2bn |
65% |
|
April 2026 |
Apellis |
Biogen |
$5.6bn |
163% |
|
April 2026 |
Centessa |
Eli Lilly |
$6.3bn |
70% |
|
June 2026 |
Apogee |
AbbVie |
$10.9bn |
50% |
*Alcyone was a private portfolio position at the time of acquisition. The transaction value represented a 242% uplift on the Company's $2.1 million carrying value.
Figure 13. 2026 deal value is already nearing FY 2025, a big M&A year, as large pharma seeks to reload pipelines¹
¹ Societe Generale (January 2026), LifeSci Capital (July 2026).
Capital markets
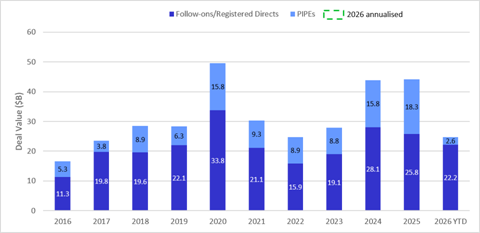
The financing window was more open in the first half of 2026 than it had been in years. Total US-listed biotech issuance reached approximately US$29.9 billion across 144 transactions - a more than twofold increase in dollar volume on the comparable prior-year period. Secondary issuances in the second quarter were among the strongest in two years, and the IPO market delivered its best quarterly proceeds since 2021: thirteen biotech companies went public in the half, raising US$5.1 billion, versus just eight raising US$1.7 billion in the whole of 2025. The reopened IPO market has skewed decisively towards larger, later-stage offerings, with the majority of 2026 debuts pricing at US$300 million or above.
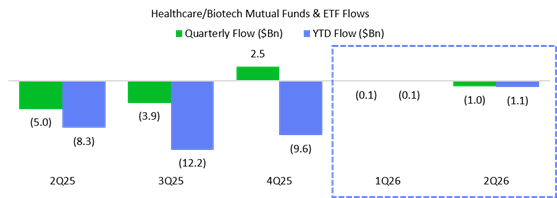
Figure 14. Biotech fund flows rallied in year-end 2025 before flattening in early 2026¹
¹ Raymond James report as at 1 July 2026.
Regulatory environment
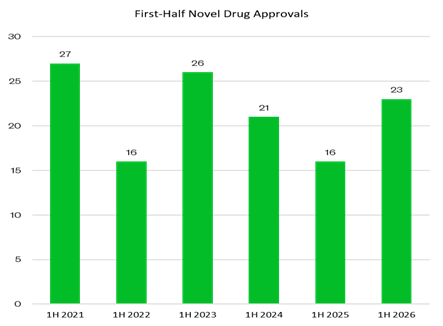
The most consequential development of the first half was the change of leadership at the FDA. After a sustained period of unexpected Complete Response Letters and shifting evidentiary standards, against which the RTW Institute advocated actively (through a coalition letter to the administration), Commissioner Marty Makary resigned in May, followed by most of the senior leadership appointed during his tenure. Interim head Kyle Diamantas has moved swiftly to reverse several of the more controversial prior decisions, a clear signal of the administration's intent to prioritise pro-innovation, pro-rare disease leadership. We were encouraged that the agency approved 23 novel drugs in the first half, the highest first-half total since 2023, demonstrating that staff changes have not impaired the process of getting treatments to patients. We expect the appointment of permanent leadership to add further momentum. Two federal initiatives point in the same direction: the Department of Health and Human Services' Operation Trailblazer uses artificial intelligence ("AI") to compress US clinical development timelines, and NIH's Bio Genesis Mission aims to double the pace of biomedical innovation from discovery to health impact within the next five to ten years. Together they represent a concrete signal of where the administration wants to take the sector.
Figure 15. The pace of first-half novel drug approvals accelerated despite FDA staff turnover¹
¹ Endpoints news, UBS Research, FDA, HHS, July 2026.
Figure 16. Biotech funding by secondary deal type ($B)1,2
1 LifeSci Capital, July 2026 (for 2026 YTD)
2 Jefferies, January 2026 (for prior years)
The structural case
Beyond the cyclical recovery, three structural forces are reshaping what is possible in drug development: the plummeting cost of genetic information combined with increasingly accessible and high quality genomic data sets, which is expanding the druggable target landscape; a proliferation of new therapeutic modalities now reaching clinical and commercial fruition; and the growing impact of artificial intelligence, most immediately in compressing the administrative and enrolment burden of clinical trials, where for example fewer than 5% of eligible cancer patients currently participate despite the majority being willing. We believe these forces can drive the pace of novel drug approvals from 50-60 per year towards 100 or more within the decade. ASCO 2026 offered a preview of what that pipeline looks like in practice.
Outlook
We enter the second half of 2026 with a portfolio well-positioned for a continuation of the recovery. High-conviction catalysts lie ahead: CG Oncology's Phase 3 bladder cancer topline data, Oruka's week 28 psoriasis follow-on data in the third quarter and Kailera's Phase 3 oral and injectable data in mid-2027. We remain especially excited by oncology, where new approaches have the potential to reset the standard of care in pancreatic, breast and bladder cancers; by obesity and cardiometabolic disease, where oral and next-generation mechanisms are coming to the fore; by immunology; and by neuropsychiatry, including psychedelic medicines advancing towards important milestones.
The commercial opportunity in biotech continues to broaden. As of early 2026, industry analysis suggested that roughly 40% of XBI-listed companies had at least one approved product, with the potential to double over the next 18 months, and that recent product launches have beaten pre-launch revenue expectations by a wide margin relative to prior cohorts. We believe RTW Bio's balanced exposure across commercial and development-stage assets, an approach that differentiates us from many peers, positions the portfolio to benefit from this maturation, while our company creation engine and the launch of a second royalty vehicle extend our reach across the full life cycle.
The M&A backdrop remains constructive, the financing window open, and the regulatory environment materially improved. Combined with the structural trends underpinning the sector, we believe this represents a compelling environment for long-term value creation.
Post period-end updates and other key portfolio company events
· On 28 July, private portfolio company and seventh RTW new company creation Yarrow Bioscience completed its previously announced reverse merger with VYNE Therapeutics and $200 million concurrent private financing led by RTW Investments. The combined company began trading on the Nasdaq Global Select Market under the ticker "YARW".
· On 4 August, private portfolio company Obsidian Therapeutics completed its previously announced reverse merger with Galera Therapeutics and $350 million private financing completed just prior to the transaction. The combined company began trading on the Nasdaq under the ticker "OBX".
· On 12 August, we announced the planned merger of private portfolio company Avere Therapeutics with public company NextCure Inc. ("NXTC").
· On 19 August, we announced that BioMarin entered into an agreement to acquire private portfolio company Alesta Therapeutics.
· On 19 August, we appointed Jefferies International Limited as Joint Corporate Broker.
· Post period end and through the date of this interim report, the Company bought back 779,602 Ordinary Shares at an average price of US$2.46 for a total cost of US$1,916,905 including transaction costs of US$2,881.
|
RTW Investments, LP |
|
|
11 September 2026 |
|
Strategy in Action
Impact Focus: CG Oncology

7.2% of NAV (31 December 2025: 0.3%)
DESCRIPTION
CG Oncology (ticker: CGON) is a clinical stage immuno-oncology company developing therapies for bladder cancer. Their investigational drug, cretostimogene, is an intravesically delivered (directly into the bladder) oncolytic immunotherapy with a dual mechanism of action. Several Phase 2 and 3 clinical studies are exploring its potential to treat multiple types of non-muscle invasive bladder cancer (NMIBC). Cretostimogene has received FDA Fast Track and Breakthrough Therapy designations and the company has initiated a rolling BLA submission to the FDA for cretostimogene monotherapy in high-risk BCG-unresponsive NMIBC, with completion expected in 2026.
THE NEED
Bladder cancer is the sixth most common type of cancer in the United States, with roughly 80,000-84,000 new cases diagnosed each year. NMIBC represents 75% of newly diagnosed bladder cancer cases. Men account for three-quarters of newly diagnosed cases while women are often diagnosed with more advanced disease and have worse survival rates. The current standard of care has meaningful limitations with 40-60% of patients experiencing tumour recurrence within two years and constrained access to first-line treatment. Because the disease is chronic and highly recurrent, patients frequently endure repeated resections under general anaesthesia, which carry significant morbidity and cumulative risk, underscoring the value of an effective, bladder-sparing, non-surgical alternative.
KEY UPCOMING CATALYST
· Phase 3 NMIBC topline data readout from the PIVOT-006 trial expected in Q3 2026
Impact Focus: Oruka Therapeutics

5.5% of NAV (31 December 2025: 1.4%)
DESCRIPTION
Oruka Therapeutics (ticker: ORKA) is a clinical-stage biotechnology company developing biologics to target plaque psoriasis, psoriatic arthritis, and other dermatologic and inflammatory indications. Lead programme ORKA-001 is designed to block cytokines that play key roles in the pathogenesis of psoriasis and other inflammatory diseases and has the potential for once-yearly dosing. Oruka's plaque psoriasis data in April far exceeded expectations with 64% of treated patients achieving complete clearance of their psoriasis, superior to Abbvie's Skyrizi. The company's differentiation rests on convenience and durability: by re-engineering validated, commercially successful mechanisms for dramatically extended dosing intervals, Oruka aims to improve both efficacy and adherence relative to existing therapies that require injections several times a year.
THE NEED
Psoriasis is a chronic autoimmune skin disorder characterised by inflammation that manifests as itchy, painful plaques and scales on the skin. It affects an estimated 125 million people worldwide. One in three develop psoriatic arthritis, which can lead to joint pain and stiffness and permanent joint damage. Patients with psoriasis are at greater risk of developing other conditions, such as obesity, diabetes, cardiovascular disease, and depression. The current standard requires patients to self-inject multiple times per year, a burden that weighs on long-term adherence. A therapy capable of reducing dosing frequency from four-to-six times per year to once or twice could represent a meaningful commercial and clinical differentiator in a large, well-established market.
KEY UPCOMING CATALYST
· Phase 2a EVERLAST-A 28 week data in Q3 2026.
Statement of Principal Risks and Uncertainties for the Remaining
Six Months of the Year to 31 December 2026
As described in the Group's annual consolidated financial statements for the year ended 31 December 2025, the Group's principal and emerging risks and uncertainties include the following:
The Group has five principal categories of risk in its risk register, namely:
· Investment Risks
· Operational Risks
· Governance/Reputational Risks
· External Risks
· Emerging Risks
The Board believes that these risks are unchanged in respect of the remaining six months of the year to 31 December 2026.
Further information in relation to these principal risks and uncertainties may be found on pages 32 to 34 of the Group's annual report and audited consolidated financial statements for the year ended 31 December 2025.
These inherent risks associated with investments in the biotech and pharmaceutical sector could result in a material adverse effect on the Group's performance and value of the Ordinary Shares.
Risks are mitigated and managed by the Board through continual review, policy setting and regular reviews of the Group's risk matrix by the Audit Committee to ensure that procedures are in place with the intention of minimising the impact of the above-mentioned risks. The Board carried out a formal review of the risk matrix at the Audit Committee meeting held on 9 September 2026. The Board relies on periodic reports provided by the Investment Manager and Administrator regarding risks that the Group faces. When required, experts will be employed to gather information and/or provide expert advice, including tax and legal advisers.
Statement of Directors' Responsibilities
The Directors confirm to the best of their knowledge that:
- the unaudited interim consolidated financial statements have been prepared in conformity with US generally accepted accounting principles and give a true and fair view of the assets, liabilities, financial position and profit or loss of the Group; and
- the interim management report (which includes the Chair's Statement, Report of the Investment Manager and Statement of Principal Risks and Uncertainties) together with the unaudited interim consolidated financial statements include a fair review of the information required by:
a. DTR 4.2.7R of the Disclosure Guidance and Transparency Rules, being an indication of important events that have occurred during the first six months of the financial year and their impact on the unaudited interim consolidated financial statements; and a description of the principal risks and uncertainties for the remaining six months of the financial year; and
b. DTR 4.2.8R of the Disclosure Guidance and Transparency Rules, being related party transactions that have taken place during the first six months of the current financial year and that have materially affected the financial position or performance of the Group during that period; and any changes in the related party transactions described in the last annual report that could do so.
The Directors are responsible for the maintenance and integrity of the corporate and financial information included on the Group's website (www.rtwbio.com). Legislation in Guernsey governing the preparation and dissemination of financial statements may differ from legislation in other jurisdictions.
By order of the Board
|
William Simpson Chair 11 September 2026 |
Paul Le Page Director 11 September 2026 |
The financial information set out below is an extract from the unaudited condensed consolidated interim financial statements of the Group for the six months ended 30 June 2026 and does not comprise the Group's full interim financial statements.
The condensed consolidated interim financial statements have been reviewed, but not audited, by the Group's independent auditor, whose review report was unmodified.
The Group's interim report for the six months ended 30 June 2026, including the condensed consolidated interim financial statements and related notes, will be made available on the Group's website, www.rtwbio.com, in due course.
RTW Biotech Opportunities Ltd
Unaudited Interim Consolidated Statement of Assets and Liabilities
as at 30 June 2026 and 31 December 2025
(Expressed in United States Dollars)
|
|
30 June 2026 (unaudited) |
|
31 December 2025 (audited) |
|
|
|
|
|
|
ASSETS: |
|
|
|
|
Investments in securities, at fair value (cost at 30 June 2026: $773,130,089; 31 December 2025: $582,193,845) |
1,104,681,955 |
|
794,317,535 |
|
Derivative contracts, at fair value (cost at 30 June 2026: $51,068,488; 31 December 2025: $53,367,469) |
150,981,373 |
|
146,792,049 |
|
Cash and cash equivalents |
3,653,807 |
|
5,986,177 |
|
Due from brokers |
47,120,242 |
|
120,003,965 |
|
Receivable from unsettled trades |
3,909,793 |
|
495,756 |
|
Other assets |
1,071,834 |
|
1,446,088 |
|
|
|
|
|
|
TOTAL ASSETS |
1,311,419,004 |
|
1,069,041,570 |
|
|
|
|
|
|
LIABILITIES: |
|
|
|
|
Securities sold short, at fair value (proceeds at 30 June 2026: $149,291,187; 31 December 2025: $97,804,817) |
210,206,365 |
|
160,552,645 |
|
Derivative contracts, at fair value (proceeds at 30 June 2026: $nil; 31 December 2025: $nil) |
6,312,315 |
|
2,601,035 |
|
Due to brokers |
80,098,454 |
|
39,415,179 |
|
Payable for unsettled trades |
925,401 |
|
439,098 |
|
Payable for share buyback |
851,490 |
|
- |
|
Accrued expenses |
1,235,979 |
|
810,759 |
|
|
|
|
|
|
TOTAL LIABILITIES |
299,630,004 |
|
203,818,716 |
|
|
|
|
|
|
TOTAL NET ASSETS |
1,011,789,000 |
|
865,222,854 |
|
|
|
|
|
|
NET ASSETS attributable to Ordinary Shares (shares at 30 June 2026: 322,421,264; 31 December 2025: 326,373,649) |
922,042,276 |
|
800,879,465 |
|
|
|
|
|
|
NET ASSETS attributable to Non-Controlling Interest |
89,746,724 |
|
64,343,389 |
|
|
|
|
|
|
NAV per Ordinary Share |
2.8597 |
|
2.4539 |
RTW Biotech Opportunities Ltd
Unaudited Interim Consolidated Condensed Schedule of Investments
as at 30 June 2026
(Expressed in United States Dollars)
|
|
|
|
|
|
|
|
|
|
||
|
Descriptions |
Number of Shares |
|
Cost |
|
Fair Value |
|
Percentage of Net Assets |
|
||
|
|
|
|
|
|
|
|
|
|
|
|
|
Investments in securities, at fair value |
|
|
|
|
|
|
|
|
||
|
|
|
|
|
|
|
|
|
|
|
|
|
Common stocks |
|
|
|
|
|
|
|
|
||
|
|
United States |
|
|
|
|
|
|
|
|
|
|
|
Healthcare |
|
|
|
|
|
|
|
|
|
|
|
Madrigal Pharmaceuticals, Inc. |
218,276 |
|
50,398,109 |
|
117,203,298 |
|
11.58 |
|
|
|
|
CG Oncology, Inc. |
920,927 |
|
52,320,835 |
|
65,431,863 |
|
6.47 |
|
|
|
|
Spyre Therapeutics, Inc. |
736,465 |
|
17,773,548 |
|
65,383,363 |
|
6.46 |
|
|
|
|
Kailera Therapeutics, Inc. |
2,711,432 |
|
29,058,272 |
|
59,732,847 |
|
5.90 |
|
|
|
|
Oruka Therapeutics, Inc. |
588,063 |
|
19,264,990 |
|
55,965,956 |
|
5.53 |
|
|
|
|
UroGen Pharma Ltd. |
544,389 |
|
8,140,399 |
|
20,033,515 |
|
1.98 |
|
|
|
|
Others* |
|
|
275,832,139 |
|
362,429,137 |
|
35.83 |
|
|
|
|
Total United States |
|
|
452,788,292 |
|
746,179,979 |
|
73.75 |
|
|
|
|
|
|
|
|
|
|
|
|
|
|
|
|
Netherlands |
|
|
|
|
|
|
|
|
|
|
|
Healthcare |
|
|
|
|
|
|
|
|
|
|
|
argenx SE |
13,819 |
|
4,228,921 |
|
12,812,233 |
|
1.27 |
|
|
|
|
Others* |
|
|
21,045,421 |
|
30,840,943 |
|
3.04 |
|
|
|
|
Total Netherlands |
|
|
25,274,342 |
|
43,653,176 |
|
4.31 |
|
|
|
|
|
|
|
|
|
|
|
|
|
|
|
|
Ireland |
|
|
|
|
|
|
|
|
|
|
|
Healthcare |
|
|
9,857,947 |
|
20,369,581 |
|
2.01 |
|
|
|
|
|
|
|
|
|
|
|
|
|
|
|
|
China |
|
|
|
|
|
|
|
|
|
|
|
Healthcare |
|
|
4,313,732 |
|
5,677,970 |
|
0.57 |
|
|
|
|
|
|
|
|
|
|
|
|
|
|
|
|
British Virgin Islands |
|
|
|
|
|
|
|
|
|
|
|
Healthcare |
|
|
3,359,563 |
|
5,173,314 |
|
0.52 |
|
|
|
|
|
|
|
|
|
|
|
|
|
|
|
|
Australia |
|
|
|
|
|
|
|
|
|
|
|
Healthcare |
|
|
842,953 |
|
956,472 |
|
0.10 |
|
|
|
|
|
|
|
|
|
|
|
|
|
|
|
|
Canada |
|
|
|
|
|
|
|
|
|
|
|
Healthcare |
|
|
3,118,965 |
|
530,066 |
|
0.05 |
|
|
|
|
|
|
|
|
|
|
|
|
|
|
|
|
Cayman Islands |
|
|
|
|
|
|
|
|
|
|
|
Healthcare |
|
|
208,472 |
|
279,828 |
|
0.03 |
|
|
|
|
|
|
|
|
|
|
|
|
|
|
|
|
Singapore |
|
|
|
|
|
|
|
|
|
|
|
Healthcare |
|
|
530,171 |
|
242,637 |
|
0.02 |
|
|
|
|
|
|
|
|
|
|
|
|
|
|
|
|
Switzerland |
|
|
|
|
|
|
|
|
|
|
|
Healthcare |
|
|
2,496 |
|
48,980 |
|
0.00 |
|
|
|
|
|
|
|
|
|
|
|
|
|
|
|
|
France |
|
|
|
|
|
|
|
|
|
|
|
Healthcare |
|
|
3,930,888 |
|
32,970 |
|
0.00 |
|
|
|
|
|
|
|
|
|
|
|
|
||
|
* No individual investment security or contract constitutes greater than 5 per cent. of net assets. |
||||||||||
|
|
|
|||||||||
RTW Biotech Opportunities Ltd
Unaudited Interim Consolidated Condensed Schedule of Investments (continued)
as at 30 June 2026
(Expressed in United States Dollars)
|
|
|
|
|
|
|
|
|
|
||
|
Descriptions |
Number of Shares |
|
Cost |
|
Fair Value |
|
Percentage of Net Assets |
|
||
|
|
|
|
|
|
|
|
|
|
|
|
|
Investments in securities, at fair value (continued) |
|
|
|
|
|
|
|
|
||
|
|
|
|
|
|
|
|
|
|
|
|
|
Common stocks (continued) |
|
|
|
|
|
|
|
|
||
|
|
United Kingdom |
|
|
|
|
|
|
|
|
|
|
|
Healthcare |
|
|
4,887 |
|
0 |
|
0.00 |
|
|
|
|
|
|
|
|
|
|
|
|
|
|
|
Total common stocks |
|
|
504,232,708 |
|
823,144,973 |
|
81.36 |
|
||
|
|
|
|
|
|
|
|
|
|
|
|
|
Convertible preferred stocks |
|
|
|
|
|
|
|
|
||
|
|
United States |
|
|
|
|
|
|
|
|
|
|
|
Healthcare* |
|
|
88,736,219 |
|
83,337,447 |
|
8.24 |
|
|
|
|
|
|
|
|
|
|
|
|
|
|
|
|
China |
|
|
|
|
|
|
|
|
|
|
|
Healthcare |
|
|
52,426,741 |
|
39,571,398 |
|
3.91 |
|
|
|
|
|
|
|
|
|
|
|
|
|
|
|
|
United Kingdom |
|
|
|
|
|
|
|
|
|
|
|
Healthcare |
|
|
16,347,749 |
|
18,735,057 |
|
1.85 |
|
|
|
|
|
|
|
|
|
|
|
|
|
|
|
|
Netherlands |
|
|
|
|
|
|
|
|
|
|
|
Healthcare |
|
|
2,661,370 |
|
3,806,024 |
|
0.38 |
|
|
|
|
|
|
|
|
|
|
|
|
|
|
|
|
Switzerland |
|
|
|
|
|
|
|
|
|
|
|
Healthcare |
|
|
567,046 |
|
1,409,576 |
|
0.13 |
|
|
|
|
|
|
|
|
|
|
|
|
|
|
|
|
Belgium |
|
|
|
|
|
|
|
|
|
|
|
Healthcare |
|
|
0 |
|
0 |
|
0.00 |
|
|
|
|
|
|
|
|
|
|
|
|
|
|
|
Total convertible preferred stocks |
|
|
160,739,125 |
|
146,859,502 |
|
14.51 |
|
||
|
|
|
|
|
|
|
|
|
|
||
|
American depository receipts |
|
|
|
|
|
|
|
|
||
|
|
Netherlands |
|
|
|
|
|
|
|
|
|
|
|
Healthcare |
|
|
|
|
|
|
|
|
|
|
|
argenx SE |
60,324 |
|
43,235,392 |
|
55,966,797 |
|
5.53 |
|
|
|
|
|
|
|
|
|
|
|
|
|
|
|
|
United Kingdom |
|
|
|
|
|
|
|
|
|
|
|
Healthcare |
|
|
20,167,861 |
|
34,567,842 |
|
3.42 |
|
|
|
|
|
|
|
|
|
|
|
|
|
|
|
|
Cayman Islands |
|
|
|
|
|
|
|
|
|
|
|
Healthcare |
|
|
6,131,695 |
|
8,864,741 |
|
0.87 |
|
|
|
|
|
|
|
|
|
|
|
|
|
|
|
|
China |
|
|
|
|
|
|
|
|
|
|
|
Healthcare |
|
|
6,095,682 |
|
5,359,349 |
|
0.53 |
|
|
|
|
|
|
|
|
|
|
|
|
|
|
|
|
France |
|
|
|
|
|
|
|
|
|
|
|
Healthcare |
|
|
163,125 |
|
173,905 |
|
0.02 |
|
|
|
|
|
|
|
|
|
|
|
|
|
|
|
Total American depository receipts |
|
|
75,793,755 |
|
104,932,634 |
|
10.37 |
|
||
|
|
|
|
|
|
|
|
|
|
|
|
|
* No individual investment security or contract constitutes greater than 5 per cent. of net assets. |
||||||||||
|
|
|
|
|
|
|
|
|
|
||
RTW Biotech Opportunities Ltd
Unaudited Interim Consolidated Condensed Schedule of Investments (continued)
as at 30 June 2026
(Expressed in United States Dollars)
|
|
|
|
|
|
|
|
|
|
|
|
Descriptions |
|
|
Cost |
|
Fair Value |
|
Percentage of Net Assets |
|
|
|
|
|
|
|
|
|
|
|||
|
Investments in securities, at fair value (continued) |
|
|
|
|
|
|
|||
|
|
|
|
|
|
|
|
|
|
|
|
Investment in private investment companies |
|
|
|
|
|
|
|
||
|
Cayman Islands |
|
|
|
|
|
|
|
|
|
|
Healthcare |
|
|
11,599,074 |
|
13,050,149 |
|
1.29 |
|
|
|
|
|
|
|
|
|
|
|
|
|
|
Ireland |
|
|
|
|
|
|
|
|
|
|
Healthcare |
|
|
3,221,986 |
|
5,025,331 |
|
0.50 |
|
|
|
|
|
|
|
|
|
|
|
|
|
|
Total investment in private investment companies |
|
|
14,821,060 |
|
18,075,480 |
|
1.79 |
|
|
|
|
|
|
|
|
|
|
|
|
|
|
Convertible notes |
|
|
|
|
|
|
|
||
|
Canada |
|
|
|
|
|
|
|
|
|
|
Healthcare |
|
|
7,512,664 |
|
8,351,842 |
|
0.83 |
|
|
|
|
|
|
|
|
|
|
|
|
|
|
United States |
|
|
|
|
|
|
|
|
|
|
Healthcare |
|
|
9,491,981 |
|
2,910,458 |
|
0.29 |
|
|
|
|
|
|
|
|
|
|
|
|
|
|
British Virgin Islands |
|
|
|
|
|
|
|
|
|
|
Healthcare |
|
|
367,692 |
|
406,922 |
|
0.03 |
|
|
|
|
|
|
|
|
|
|
|
|
|
|
Total convertible notes |
|
|
17,372,337 |
|
11,669,222 |
|
1.15 |
|
|
|
|
|
|
|
|
|
|
|
|
|
|
Revenue based financing agreement |
|
|
|
|
|
|
|
|
|
|
United States |
|
|
|
|
|
|
|
|
|
|
Healthcare |
|
|
160,732 |
|
144 |
|
0.00 |
|
|
|
|
|
|
|
|
|
|
|
|
|
|
Corporate bonds |
|
|
|
|
|
|
|
|
|
|
Bermuda |
|
|
|
|
|
|
|
|
|
|
Healthcare |
|
|
10,372 |
|
0 |
|
0.00 |
|
|
|
|
|
|
|
|
|
|
|
|
|
|
Total investments in securities, at fair value |
|
773,130,089 |
|
1,104,681,955 |
|
109.18 |
|
||
|
|
|
|
|
|
|
|
|
|
|
RTW Biotech Opportunities Ltd
Unaudited Interim Consolidated Condensed Schedule of Investments (continued)
as at 30 June 2026
(Expressed in United States Dollars)
|
|
|
|
|
|
|
|
|
|
||
|
Descriptions |
Number of contracts |
|
Cost |
|
Fair Value |
|
Percentage of Net Assets |
|
||
|
|
|
|
|
|
|
|
|
|
|
|
|
Derivative contracts - assets, at fair value |
|
|
|
|
|
|
|
|||
|
|
|
|
|
|
|
|
|
|
|
|
|
Equity swaps |
|
|
|
|
|
|
|
|
||
|
|
United States |
|
|
|
|
|
|
|
|
|
|
|
Healthcare |
|
|
|
|
|
|
|
|
|
|
|
UroGen Pharma Ltd. |
|
1,140,123 |
|
|
|
28,209,223 |
|
2.79 |
|
|
|
CG Oncology, Inc. |
|
108,718 |
|
|
|
1,033,332 |
|
0.10 |
|
|
|
Others* |
|
|
|
|
|
45,757,604 |
|
4.52 |
|
|
|
Total United States |
|
|
|
|
|
75,000,159 |
|
7.41 |
|
|
|
|
|
|
|
|
|
|
|
|
|
|
|
Netherlands |
|
|
|
|
|
|
|
|
|
|
|
Healthcare |
|
|
|
|
|
3,928,512 |
|
0.39 |
|
|
|
|
|
|
|
|
|
|
|
|
|
|
|
British Virgin Islands |
|
|
|
|
|
|
|
|
|
|
|
Healthcare |
|
|
|
|
|
2,534,083 |
|
0.25 |
|
|
|
|
|
|
|
|
|
|
|
|
|
|
|
Ireland |
|
|
|
|
|
|
|
|
|
|
|
Healthcare |
|
|
|
|
|
1,459,863 |
|
0.14 |
|
|
|
|
|
|
|
|
|
|
|
|
|
|
|
United Kingdom |
|
|
|
|
|
|
|
|
|
|
|
Healthcare |
|
|
|
|
|
927,956 |
|
0.09 |
|
|
|
|
|
|
|
|
|
|
|
|
|
|
|
Taiwan |
|
|
|
|
|
|
|
|
|
|
|
Healthcare |
|
|
|
|
|
50,914 |
|
0.01 |
|
|
|
|
|
|
|
|
|
|
|
|
|
|
Total equity swaps |
|
|
|
|
|
83,901,487 |
|
8.29 |
|
|
|
|
|
|
|
|
|
|
|
|
|
|
|
Warrants |
|
|
|
|
|
|
|
|
|
|
|
|
United States |
|
|
|
|
|
|
|
|
|
|
|
Healthcare |
|
|
|
|
|
|
|
|
|
|
|
UroGen Pharma Ltd. |
|
173,940 |
|
3,043,776 |
|
6,400,818 |
|
0.63 |
|
|
|
Others* |
|
|
|
29,773,104 |
|
38,730,070 |
|
3.83 |
|
|
|
Total United States |
|
|
|
32,816,880 |
|
45,130,888 |
|
4.46 |
|
|
|
|
|
|
|
|
|
|
|
|
|
|
|
British Virgin Islands |
|
|
|
|
|
|
|
|
|
|
|
Healthcare |
|
|
|
1,349,970 |
|
2,787,677 |
|
0.28 |
|
|
|
|
|
|
|
|
|
|
|
|
|
|
|
Canada |
|
|
|
|
|
|
|
|
|
|
|
Healthcare |
|
|
|
3,353,935 |
|
1,725,772 |
|
0.17 |
|
|
|
|
|
|
|
|
|
|
|
|
|
|
|
United Kingdom |
|
|
|
|
|
|
|
|
|
|
|
Healthcare |
|
|
|
571,830 |
|
1,147,246 |
|
0.11 |
|
|
|
|
|
|
|
|
|
|
|
|
|
|
Total warrants |
|
|
|
38,092,615 |
|
50,791,583 |
|
5.02 |
|
|
|
|
|
|
|
|
|
|
|
|
|
|
|
|
|
|
|
|
|
|
|
|
|
|
|
* No individual investment security or contract constitutes greater than 5 per cent. of net assets. |
||||||||||
|
|
|
|
||||||||
RTW Biotech Opportunities Ltd
Unaudited Interim Consolidated Condensed Schedule of Investments (continued)
as at 30 June 2026
(Expressed in United States Dollars)
|
|
|
|
|
|
|
|
|
|
||
|
Descriptions |
|
|
Cost |
|
Fair Value |
|
Percentage of Net Assets |
|
||
|
|
|
|
|
|
|
|
|
|
|
|
|
Derivative contracts - assets, at fair value (continued) |
|
|
|
|
|
|
|
|||
|
|
|
|
|
|
|
|
|
|
|
|
|
Contingent value rights |
|
|
|
|
|
|
|
|
||
|
|
China |
|
|
|
|
|
|
|
|
|
|
|
Healthcare |
|
|
|
10,669,103 |
|
13,575,255 |
|
1.34 |
|
|
|
|
|
|
|
|
|
|
|
|
|
|
|
United States |
|
|
|
|
|
|
|
|
|
|
|
Healthcare |
|
|
|
2,306,770 |
|
2,480,165 |
|
0.25 |
|
|
|
|
|
|
|
|
|
|
|
|
|
|
|
United Kingdom |
|
|
|
|
|
|
|
|
|
|
|
Healthcare |
|
|
|
0 |
|
222,795 |
|
0.02 |
|
|
|
|
|
|
|
|
|
|
|
|
|
|
|
Switzerland |
|
|
|
|
|
|
|
|
|
|
|
Healthcare |
|
|
|
0 |
|
10,088 |
|
0.00 |
|
|
|
|
|
|
|
|
|
|
|
|
|
|
|
Denmark |
|
|
|
|
|
|
|
|
|
|
|
Healthcare |
|
|
|
0 |
|
0 |
|
0.00 |
|
|
|
|
|
|
|
|
|
|
|
|
|
|
Total contingent value rights |
|
|
|
12,975,873 |
|
16,288,303 |
|
1.61 |
|
|
|
|
|
|
|
|
|
|
|
|
|
|
|
Total derivative contracts - assets, at fair value |
|
51,068,488 |
|
150,981,373 |
|
14.92 |
|
|||
|
|
|
|
|
|
|
|
|
|
|
|
RTW Biotech Opportunities Ltd
Unaudited Interim Consolidated Condensed Schedule of Investments (continued)
as at 30 June 2026
(Expressed in United States Dollars)
|
|
|
|
|
|
|
|
|
|
|
||||
|
Descriptions |
|
Number of Shares |
Proceeds |
|
Fair Value |
|
Percentage of Net Assets |
|
|||||
|
|
|
|
|
|
|
|
|
|
|
|
|
||
|
Securities sold short, at fair value |
|
|
|
|
|
|
|
|
|
||||
|
|
|
|
|
|
|
|
|
|
|
|
|
||
|
Common stocks |
|
|
|
|
|
|
|
|
|
||||
|
|
United States |
|
|
|
|
|
|
|
|
|
|
||
|
|
Healthcare |
|
|
|
|
|
|
|
|
|
|
||
|
|
Madrigal Pharmaceuticals, Inc. |
|
|
197,624 |
63,803,128 |
|
106,114,207 |
|
10.49 |
|
|||
|
|
Others* |
|
|
|
|
75,804,484 |
|
93,082,557 |
|
9.20 |
|
||
|
|
Total United States |
|
|
|
|
139,607,612 |
|
199,196,764 |
|
19.69 |
|
||
|
|
|
|
|
|
|
|
|
|
|
|
|
||
|
|
Ireland |
|
|
|
|
|
|
|
|
|
|
||
|
|
Healthcare |
|
|
|
|
1,948,127 |
|
3,553,534 |
|
0.35 |
|
||
|
|
|
|
|
|
|
|
|
|
|
|
|
||
|
|
Netherlands |
|
|
|
|
|
|
|
|
|
|
||
|
|
Healthcare |
|
|
|
|
510,174 |
|
462,875 |
|
0.05 |
|
||
|
|
|
|
|
|
|
|
|
|
|
|
|
||
|
|
Cayman Islands |
|
|
|
|
|
|
|
|
|
|
||
|
|
Healthcare |
|
|
|
|
149,000 |
|
279,828 |
|
0.03 |
|
||
|
|
|
|
|
|
|
|
|
|
|
|
|
||
|
|
Singapore |
|
|
|
|
|
|
|
|
|
|
||
|
|
Healthcare |
|
|
|
|
555,035 |
|
242,637 |
|
0.02 |
|
||
|
|
|
|
|
|
|
|
|
|
|
|
|
||
|
|
Canada |
|
|
|
|
|
|
|
|
|
|
||
|
|
Healthcare |
|
|
|
|
51,795 |
|
53,202 |
|
0.01 |
|
||
|
|
|
|
|
|
|
|
|
|
|
|
|
||
|
Total common stocks |
|
|
|
|
142,821,743 |
|
203,788,840 |
|
20.15 |
|
|||
|
|
|
|
|
|
|
|
|
|
|
|
|||
|
American depository receipts |
|
|
|
|
|
|
|
|
|
||||
|
|
United Kingdom |
|
|
|
|
|
|
|
|
|
|
||
|
|
Healthcare |
|
|
|
|
3,316,924 |
|
3,656,266 |
|
0.36 |
|
||
|
|
|
|
|
|
|
|
|
|
|
|
|
||
|
|
Cayman Islands |
|
|
|
|
|
|
|
|
|
|
||
|
|
Healthcare |
|
|
|
|
3,152,520 |
|
2,761,259 |
|
0.27 |
|
||
|
|
|
|
|
|
|
|
|
|
|
|
|
||
|
Total American depository receipts |
|
|
|
|
6,469,444 |
|
6,417,525 |
|
0.63 |
|
|||
|
|
|
|
|
|
|
|
|
|
|
|
|
||
|
Total securities sold short, at fair value |
|
|
149,291,187 |
|
210,206,365 |
|
20.78 |
|
|||||
|
|
|
|
|
|
|
|
|
|
|||||
|
|
|
|
|
|
|
|
|
|
|||||
|
* No individual investment security or contract constitutes greater than 5 per cent. of net assets. |
|
||||||||||||
|
|
|
|
|
|
|
|
|
|
|
|
|||
RTW Biotech Opportunities Ltd
Unaudited Interim Consolidated Condensed Schedule of Investments (continued)
as at 30 June 2026
(Expressed in United States Dollars)
|
Descriptions |
|
|
|
Fair Value |
|
Percentage of Net Assets |
|
||
|
|
|
|
|
|
|
|
|
|
|
|
Derivative contracts - liabilities, at fair value |
|
|
|
|
|
|
|||
|
|
|
|
|
|
|
|
|
|
|
|
Equity swaps |
|
|
|
|
|
|
|
||
|
|
United States |
|
|
|
|
|
|
|
|
|
|
Healthcare |
|
|
|
|
6,310,767 |
|
0.62 |
|
|
|
|
|
|
|
|
|
|
|
|
|
|
Taiwan |
|
|
|
|
|
|
|
|
|
|
Healthcare |
|
|
|
|
1,548 |
|
0.00 |
|
|
|
|
|
|
|
|
|
|
|
|
|
Total derivative contracts - liabilities, at fair value |
|
6,312,315 |
|
0.62 |
|
||||
|
|
|
|
|
|
|
|
|
|
|
|
|
|
|
|
|
|
|
|
|
|
RTW Biotech Opportunities Ltd
Audited Consolidated Condensed Schedule of Investments
as at 31 December 2025
(Expressed in United States Dollars)
|
|
|
|
|
|
|
|
|
|
||
|
Descriptions |
Number of Shares |
|
Cost |
|
Fair Value |
|
Percentage of Net Assets |
|
||
|
|
|
|
|
|
|
|
|
|
|
|
|
Investments in securities, at fair value |
|
|
|
|
|
|
|
|
||
|
|
|
|
|
|
|
|
|
|
|
|
|
Common stocks |
|
|
|
|
|
|
|
|
||
|
|
United States |
|
|
|
|
|
|
|
|
|
|
|
Healthcare |
|
|
|
|
|
|
|
|
|
|
|
Madrigal Pharmaceuticals, Inc. |
218,276 |
|
50,398,109 |
|
127,110,846 |
|
14.69 |
|
|
|
|
Others* |
|
|
230,870,447 |
|
347,437,367 |
|
40.16 |
|
|
|
|
Total United States |
|
|
281,268,556 |
|
474,548,213 |
|
54.85 |
|
|
|
|
|
|
|
|
|
|
|
|
|
|
|
|
Netherlands |
|
|
|
|
|
|
|
|
|
|
|
Healthcare |
|
|
15,251,071 |
|
27,913,322 |
|
3.23 |
|
|
|
|
|
|
|
|
|
|
|
|
|
|
|
|
Ireland |
|
|
|
|
|
|
|
|
|
|
|
Healthcare |
|
|
9,857,947 |
|
9,842,741 |
|
1.14 |
|
|
|
|
|
|
|
|
|
|
|
|
|
|
|
|
China |
|
|
|
|
|
|
|
|
|
|
|
Healthcare |
|
|
|
|
|
|
|
|
|
|
|
Corxel Pharmaceuticals Ltd. |
541,205 |
|
216,482 |
|
376,774 |
|
0.04 |
|
|
|
|
Others* |
|
|
1,503,264 |
|
1,478,645 |
|
0.17 |
|
|
|
|
Total China |
|
|
1,719,746 |
|
1,855,419 |
|
0.21 |
|
|
|
|
|
|
|
|
|
|
|
|
|
|
|
|
British Virgin Islands |
|
|
|
|
|
|
|
|
|
|
|
Healthcare |
|
|
785,183 |
|
1,612,762 |
|
0.19 |
|
|
|
|
|
|
|
|
|
|
|
|
|
|
|
|
Singapore |
|
|
|
|
|
|
|
|
|
|
|
Healthcare |
|
|
530,171 |
|
709,954 |
|
0.08 |
|
|
|
|
|
|
|
|
|
|
|
|
|
|
|
|
Cayman Islands |
|
|
|
|
|
|
|
|
|
|
|
Healthcare |
|
|
627,810 |
|
707,129 |
|
0.08 |
|
|
|
|
|
|
|
|
|
|
|
|
|
|
|
|
Canada |
|
|
|
|
|
|
|
|
|
|
|
Healthcare |
|
|
2,922,276 |
|
581,227 |
|
0.07 |
|
|
|
|
|
|
|
|
|
|
|
|
|
|
|
|
France |
|
|
|
|
|
|
|
|
|
|
|
Healthcare |
|
|
3,930,888 |
|
32,970 |
|
0.00 |
|
|
|
|
|
|
|
|
|
|
|
|
|
|
|
|
Switzerland |
|
|
|
|
|
|
|
|
|
|
|
Healthcare |
|
|
2,498 |
|
12,468 |
|
0.00 |
|
|
|
|
|
|
|
|
|
|
|
|
|
|
|
|
United Kingdom |
|
|
|
|
|
|
|
|
|
|
|
Healthcare |
|
|
4,887 |
|
0 |
|
0.00 |
|
|
|
|
|
|
|
|
|
|
|
|
|
|
|
Total common stocks |
|
|
316,901,033 |
|
517,816,205 |
|
59.85 |
|
||
|
|
|
|
|
|
|
|
|
|
||
|
* No individual investment security or contract constitutes greater than 5 per cent. of net assets. |
||||||||||
|
|
|
|||||||||
RTW Biotech Opportunities Ltd
Audited Consolidated Condensed Schedule of Investments (continued)
as at 31 December 2025
(Expressed in United States Dollars)
|
|
|
|
|
|
|
|
|
|
||
|
Descriptions |
Number of Shares |
|
Cost |
|
Fair Value |
|
Percentage of Net Assets |
|
||
|
|
|
|
|
|
|
|
|
|
|
|
|
Investments in securities, at fair value (continued) |
|
|
|
|
|
|
|
|
||
|
|
|
|
|
|
|
|
|
|
|
|
|
Convertible preferred stocks |
|
|
|
|
|
|
|
|
||
|
|
United States |
|
|
|
|
|
|
|
|
|
|
|
Healthcare* |
|
|
109,993,354 |
|
116,467,545 |
|
13.46 |
|
|
|
|
|
|
|
|
|
|
|
|
|
|
|
|
China |
|
|
|
|
|
|
|
|
|
|
|
Healthcare |
|
|
|
|
|
|
|
|
|
|
|
Corxel Pharmaceuticals Ltd. |
29,462,131 |
|
48,316,157 |
|
37,637,332 |
|
4.35 |
|
|
|
|
Others* |
|
|
4,110,584 |
|
2,994,795 |
|
0.35 |
|
|
|
|
Total China |
|
|
52,426,741 |
|
40,632,127 |
|
4.70 |
|
|
|
|
|
|
|
|
|
|
|
|
|
|
|
|
United Kingdom |
|
|
|
|
|
|
|
|
|
|
|
Healthcare |
|
|
16,347,749 |
|
17,253,492 |
|
1.99 |
|
|
|
|
|
|
|
|
|
|
|
|
|
|
|
|
Netherlands |
|
|
|
|
|
|
|
|
|
|
|
Healthcare |
|
|
2,661,370 |
|
2,831,535 |
|
0.33 |
|
|
|
|
|
|
|
|
|
|
|
|
|
|
|
|
Switzerland |
|
|
|
|
|
|
|
|
|
|
|
Healthcare |
|
|
567,047 |
|
1,448,181 |
|
0.17 |
|
|
|
|
|
|
|
|
|
|
|
|
|
|
|
|
Belgium |
|
|
|
|
|
|
|
|
|
|
|
Healthcare |
|
|
0 |
|
0 |
|
0.00 |
|
|
|
|
|
|
|
|
|
|
|
|
|
|
|
Total convertible preferred stocks |
|
|
181,996,261 |
|
178,632,880 |
|
20.65 |
|
||
|
|
|
|
|
|
|
|
|
|
||
|
American depository receipts |
|
|
|
|
|
|
|
|
||
|
|
United Kingdom |
|
|
|
|
|
|
|
|
|
|
|
Healthcare |
|
|
19,709,601 |
|
26,879,274 |
|
3.11 |
|
|
|
|
|
|
|
|
|
|
|
|
|
|
|
|
Netherlands |
|
|
|
|
|
|
|
|
|
|
|
Healthcare |
|
|
12,797,852 |
|
20,498,156 |
|
2.37 |
|
|
|
|
|
|
|
|
|
|
|
|
|
|
|
|
China |
|
|
|
|
|
|
|
|
|
|
|
Healthcare |
|
|
15,257,803 |
|
11,767,132 |
|
1.36 |
|
|
|
|
|
|
|
|
|
|
|
|
|
|
|
|
Cayman Islands |
|
|
|
|
|
|
|
|
|
|
|
Healthcare |
|
|
2,418,187 |
|
4,778,005 |
|
0.55 |
|
|
|
|
|
|
|
|
|
|
|
|
|
|
|
|
France |
|
|
|
|
|
|
|
|
|
|
|
Healthcare |
|
|
215,338 |
|
260,084 |
|
0.03 |
|
|
|
|
|
|
|
|
|
|
|
|
|
|
|
Total American depository receipts |
|
|
50,398,781 |
|
64,182,651 |
|
7.42 |
|
||
|
|
|
|
|
|
|
|
|
|
|
|
|
|
|
|
|
|
|
|
|
|
||
|
* No individual investment security or contract constitutes greater than 5 per cent. of net assets. |
||||||||||
|
|
|
|
|
|
|
|
|
|
||
RTW Biotech Opportunities Ltd
Audited Consolidated Condensed Schedule of Investments (continued)
as at 31 December 2025
(Expressed in United States Dollars)
|
|
|
|
|
|
|
|
|
|
|
|
Descriptions |
Number of Shares |
|
Cost |
|
Fair Value |
|
Percentage of Net Assets |
|
|
|
|
|
|
|
|
|
|
|||
|
Investments in securities, at fair value (continued) |
|
|
|
|
|
|
|||
|
|
|
|
|
|
|
|
|
|
|
|
Investment in private investment companies |
|
|
|
|
|
|
|
||
|
Cayman Islands |
|
|
|
|
|
|
|
|
|
|
Healthcare |
|
|
10,427,832 |
|
14,933,990 |
|
1.73 |
|
|
|
|
|
|
|
|
|
|
|
|
|
|
Ireland |
|
|
|
|
|
|
|
|
|
|
Healthcare |
|
|
3,221,986 |
|
5,083,675 |
|
0.58 |
|
|
|
|
|
|
|
|
|
|
|
|
|
|
Total investment in private investment companies |
|
|
13,649,818 |
|
20,017,665 |
|
2.31 |
|
|
|
|
|
|
|
|
|
|
|
|
|
|
Convertible notes |
|
|
|
|
|
|
|
||
|
Canada |
|
|
|
|
|
|
|
|
|
|
Healthcare |
|
|
7,512,664 |
|
8,314,309 |
|
0.96 |
|
|
|
|
|
|
|
|
|
|
|
|
|
|
China |
|
|
|
|
|
|
|
|
|
|
Healthcare |
|
|
|
|
|
|
|
|
|
|
Corxel Pharmaceuticals Ltd. |
434,154 |
|
4,341,540 |
|
4,657,461 |
|
0.54 |
|
|
|
|
|
|
|
|
|
|
|
|
|
|
British Virgin Islands |
|
|
|
|
|
|
|
|
|
|
Healthcare |
|
|
367,692 |
|
384,738 |
|
0.04 |
|
|
|
|
|
|
|
|
|
|
|
|
|
|
United States |
|
|
|
|
|
|
|
|
|
|
Healthcare |
|
|
6,857,124 |
|
294,411 |
|
0.03 |
|
|
|
|
|
|
|
|
|
|
|
|
|
|
Total convertible notes |
|
|
19,079,020 |
|
13,650,919 |
|
1.57 |
|
|
|
|
|
|
|
|
|
|
|
|
|
|
Revenue based financing agreement |
|
|
|
|
|
|
|
|
|
|
United States |
|
|
|
|
|
|
|
|
|
|
Healthcare |
|
|
160,731 |
|
17,215 |
|
0.00 |
|
|
|
|
|
|
|
|
|
|
|
|
|
|
Corporate bonds |
|
|
|
|
|
|
|
|
|
|
Bermuda |
|
|
|
|
|
|
|
|
|
|
Healthcare |
|
|
8,201 |
|
0 |
|
0.00 |
|
|
|
|
|
|
|
|
|
|
|
|
|
|
Total investments in securities, at fair value |
|
582,193,845 |
|
794,317,535 |
|
91.80 |
|
||
|
|
|
|
|
|
|
|
|
|
|
|
|
|||||||||
RTW Biotech Opportunities Ltd
Audited Consolidated Condensed Schedule of Investments (continued)
as at 31 December 2025
(Expressed in United States Dollars)
|
|
|
|
|
|
|
|
|
|
||
|
Descriptions |
|
|
Cost |
|
Fair Value |
|
Percentage of Net Assets |
|
||
|
|
|
|
|
|
|
|
|
|
|
|
|
Derivative contracts - assets, at fair value |
|
|
|
|
|
|
|
|||
|
|
|
|
|
|
|
|
|
|
|
|
|
Equity swaps |
|
|
|
|
|
|
|
|
||
|
|
United States |
|
|
|
|
|
|
|
|
|
|
|
Healthcare* |
|
|
|
|
|
66,216,532 |
|
7.65 |
|
|
|
|
|
|
|
|
|
|
|
|
|
|
|
Netherlands |
|
|
|
|
|
|
|
|
|
|
|
Healthcare |
|
|
|
|
|
5,155,637 |
|
0.60 |
|
|
|
|
|
|
|
|
|
|
|
|
|
|
|
British Virgin Islands |
|
|
|
|
|
|
|
|
|
|
|
Healthcare |
|
|
|
|
|
1,822,897 |
|
0.21 |
|
|
|
|
|
|
|
|
|
|
|
|
|
|
|
United Kingdom |
|
|
|
|
|
|
|
|
|
|
|
Healthcare |
|
|
|
|
|
1,220,685 |
|
0.14 |
|
|
|
|
|
|
|
|
|
|
|
|
|
|
|
China |
|
|
|
|
|
|
|
|
|
|
|
Healthcare |
|
|
|
|
|
659 |
|
0.00 |
|
|
|
|
|
|
|
|
|
|
|
|
|
|
Total equity swaps |
|
|
|
|
|
74,416,410 |
|
8.60 |
|
|
|
|
|
|
|
|
|
|
|
|
|
|
|
Warrants |
|
|
|
|
|
|
|
|
|
|
|
|
United States |
|
|
|
|
|
|
|
|
|
|
|
Healthcare* |
|
|
|
33,374,028 |
|
50,258,814 |
|
5.81 |
|
|
|
|
|
|
|
|
|
|
|
|
|
|
|
Canada |
|
|
|
|
|
|
|
|
|
|
|
Healthcare |
|
|
|
3,420,906 |
|
2,796,175 |
|
0.32 |
|
|
|
|
|
|
|
|
|
|
|
|
|
|
|
British Virgin Islands |
|
|
|
|
|
|
|
|
|
|
|
Healthcare |
|
|
|
1,349,970 |
|
2,367,620 |
|
0.27 |
|
|
|
|
|
|
|
|
|
|
|
|
|
|
|
United Kingdom |
|
|
|
|
|
|
|
|
|
|
|
Healthcare |
|
|
|
101,902 |
|
313,708 |
|
0.04 |
|
|
|
|
|
|
|
|
|
|
|
|
|
|
Total warrants |
|
|
|
38,246,806 |
|
55,736,317 |
|
6.44 |
|
|
|
|
|
|
|
|
|
|
|
|
|
|
|
|
|
|
|
|
|
|
|
|
|
|
|
* No individual investment security or contract constitutes greater than 5 per cent. of net assets. |
||||||||||
|
|
|
|
||||||||
RTW Biotech Opportunities Ltd
Audited Consolidated Condensed Schedule of Investments (continued)
as at 31 December 2025
(Expressed in United States Dollars)
|
|
|
|
|
|
|
|
|
|
||
|
Descriptions |
Number of contracts |
|
Cost |
|
Fair Value |
|
Percentage of Net Assets |
|
||
|
|
|
|
|
|
|
|
|
|
|
|
|
Derivative contracts - assets, at fair value (continued) |
|
|
|
|
|
|
|
|||
|
|
|
|
|
|
|
|
|
|
|
|
|
Contingent value rights |
|
|
|
|
|
|
|
|
||
|
|
China |
|
|
|
|
|
|
|
|
|
|
|
Healthcare |
|
|
|
|
|
|
|
|
|
|
|
Corxel Pharmaceuticals Ltd. |
|
1,066,910 |
|
10,669,103 |
|
11,230,324 |
|
1.30 |
|
|
|
|
|
|
|
|
|
|
|
|
|
|
|
United States |
|
|
|
|
|
|
|
|
|
|
|
Healthcare |
|
|
|
4,451,560 |
|
5,398,910 |
|
0.63 |
|
|
|
|
|
|
|
|
|
|
|
|
|
|
|
Switzerland |
|
|
|
|
|
|
|
|
|
|
|
Healthcare |
|
|
|
0 |
|
10,088 |
|
0.00 |
|
|
|
|
|
|
|
|
|
|
|
|
|
|
|
Denmark |
|
|
|
|
|
|
|
|
|
|
|
Healthcare |
|
|
|
0 |
|
0 |
|
0.00 |
|
|
|
|
|
|
|
|
|
|
|
|
|
|
Total contingent value rights |
|
|
|
15,120,663 |
|
16,639,322 |
|
1.93 |
|
|
|
|
|
|
|
|
|
|
|
|
|
|
|
Total derivative contracts - assets, at fair value |
|
53,367,469 |
|
146,792,049 |
|
16.97 |
|
|||
|
|
|
|
|
|
|
|
|
|
|
|
RTW Biotech Opportunities Ltd
Audited Consolidated Condensed Schedule of Investments (continued)
as at 31 December 2025
(Expressed in United States Dollars)
|
|
|
|
|
|
|
|
|
|
|
||||
|
Descriptions |
|
Number of Shares |
Proceeds |
|
Fair Value |
|
Percentage of Net Assets |
|
|||||
|
|
|
|
|
|
|
|
|
|
|
|
|
||
|
Securities sold short, at fair value |
|
|
|
|
|
|
|
|
|
||||
|
|
|
|
|
|
|
|
|
|
|
|
|
||
|
Common stocks |
|
|
|
|
|
|
|
|
|
||||
|
|
United States |
|
|
|
|
|
|
|
|
|
|
||
|
|
Healthcare |
|
|
|
|
|
|
|
|
|
|
||
|
|
Madrigal Pharmaceuticals, Inc. |
|
|
189,769 |
59,779,698 |
|
110,510,079 |
|
12.77 |
|
|||
|
|
Others* |
|
|
|
|
30,691,215 |
|
41,972,639 |
|
4.85 |
|
||
|
|
Total United States |
|
|
|
|
90,470,913 |
|
152,482,718 |
|
17.62 |
|
||
|
|
|
|
|
|
|
|
|
|
|
|
|
||
|
|
Ireland |
|
|
|
|
|
|
|
|
|
|
||
|
|
Healthcare |
|
|
|
|
1,948,127 |
|
1,897,660 |
|
0.22 |
|
||
|
|
|
|
|
|
|
|
|
|
|
|
|
||
|
|
Singapore |
|
|
|
|
|
|
|
|
|
|
||
|
|
Healthcare |
|
|
|
|
555,035 |
|
709,954 |
|
0.08 |
|
||
|
|
|
|
|
|
|
|
|
|
|
|
|
||
|
|
Netherlands |
|
|
|
|
|
|
|
|
|
|
||
|
|
Healthcare |
|
|
|
|
510,174 |
|
359,233 |
|
0.04 |
|
||
|
|
|
|
|
|
|
|
|
|
|
|
|
||
|
|
Canada |
|
|
|
|
|
|
|
|
|
|
||
|
|
Healthcare |
|
|
|
|
182,894 |
|
185,947 |
|
0.03 |
|
||
|
|
|
|
|
|
|
|
|
|
|
|
|
||
|
Total common stocks |
|
|
|
|
93,667,143 |
|
155,635,512 |
|
17.99 |
|
|||
|
|
|
|
|
|
|
|
|
|
|
|
|||
|
American depository receipts |
|
|
|
|
|
|
|
|
|
||||
|
|
United Kingdom |
|
|
|
|
|
|
|
|
|
|
||
|
|
Healthcare |
|
|
|
|
3,316,925 |
|
3,997,134 |
|
0.46 |
|
||
|
|
|
|
|
|
|
|
|
|
|
|
|
||
|
|
Netherlands |
|
|
|
|
|
|
|
|
|
|
||
|
|
Healthcare |
|
|
|
|
820,749 |
|
919,999 |
|
0.11 |
|
||
|
|
|
|
|
|
|
|
|
|
|
|
|
||
|
Total American depository receipts |
|
|
|
|
4,137,674 |
|
4,917,133 |
|
0.57 |
|
|||
|
|
|
|
|
|
|
|
|
|
|
|
|
||
|
Total securities sold short, at fair value |
|
|
97,804,817 |
|
160,552,645 |
|
18.56 |
|
|||||
|
|
|
|
|
|
|
|
|
|
|||||
|
|
|
|
|
|
|
|
|
|
|||||
|
* No individual investment security or contract constitutes greater than 5 per cent. of net assets. |
|
||||||||||||
|
|
|
|
|
|
|
|
|
|
|
|
|||
RTW Biotech Opportunities Ltd
Audited Consolidated Condensed Schedule of Investments (continued)
as at 31 December 2025
(Expressed in United States Dollars)
|
Descriptions |
|
|
|
Fair Value |
|
Percentage of Net Assets |
|
||
|
|
|
|
|
|
|
|
|
|
|
|
Derivative contracts - liabilities, at fair value |
|
|
|
|
|
|
|||
|
|
|
|
|
|
|
|
|
|
|
|
Equity swaps |
|
|
|
|
|
|
|
||
|
|
United States |
|
|
|
|
|
|
|
|
|
|
Healthcare |
|
|
|
|
1,816,027 |
|
0.21 |
|
|
|
|
|
|
|
|
|
|
|
|
|
|
Ireland |
|
|
|
|
|
|
|
|
|
|
Healthcare |
|
|
|
|
772,452 |
|
0.09 |
|
|
|
|
|
|
|
|
|
|
|
|
|
|
Taiwan |
|
|
|
|
|
|
|
|
|
|
Healthcare |
|
|
|
|
12,556 |
|
0.00 |
|
|
|
|
|
|
|
|
|
|
|
|
|
Total derivative contracts - liabilities, at fair value |
|
2,601,035 |
|
0.30 |
|
||||
|
|
|
|
|
|
|
|
|
|
|
|
|
|
|
|
|
|
|
|
|
|
RTW Biotech Opportunities Ltd
Unaudited Interim Consolidated Statement of Operations
for the six-month periods ended 30 June 2026 and 30 June 2025
(Expressed in United States Dollars)
|
|
1 January 2026 to 30 June 2026 (unaudited) |
|
1 January 2025 to 30 June 2025 (unaudited) |
|
|
|
|
|
|
Investment income |
|
|
|
|
Interest income (net of withholding taxes of $nil; 30 June 2025: $nil) |
3,816,173 |
|
2,882,320 |
|
Other income |
4,942,442 |
|
1,887,044 |
|
Dividends (net of withholding tax rebate of $nil; 30 June 2025: $64,343) |
- |
|
25,018,901 |
|
Total investment income |
8,758,615 |
|
29,788,265 |
|
|
|
|
|
|
|
|
|
|
|
Expenses |
|
|
|
|
Management fees |
4,990,253 |
|
3,668,870 |
|
Interest expense |
4,225,363 |
|
3,625,918 |
|
Research costs |
755,860 |
|
669,362 |
|
Professional fees |
543,817 |
|
1,028,876 |
|
Administrative fees |
506,188 |
|
374,785 |
|
Audit fees |
197,533 |
|
232,975 |
|
Directors' fees |
176,047 |
|
151,927 |
|
Dividends |
- |
|
174 |
|
Other expenses |
522,603 |
|
694,125 |
|
Total expenses |
11,917,664 |
|
10,447,012 |
|
|
|
|
|
|
Net investment income/(loss) |
(3,159,049) |
|
19,341,253 |
|
|
|
|
|
|
Realised and change in unrealised gain/(loss) on investments, derivatives and foreign currency transactions |
|
|
|
|
Net realised gain/(loss) on securities and foreign currency transactions |
42,187,569 |
|
(1,016,201) |
|
Net change in unrealised gain/(loss) on securities and foreign currency translation |
120,901,581 |
|
(53,826,207) |
|
Net realised gain/(loss) on derivative contracts |
6,513,756 |
|
4,193,445 |
|
Net change in unrealised gain/(loss) on derivative contracts |
2,777,025 |
|
(9,428,650) |
|
|
|
|
|
|
Net realised and unrealised gain/(loss) on investments, derivatives and foreign currency transactions |
172,379,931 |
|
(60,077,613) |
|
|
|
|
|
|
Net increase/(decrease) in net assets resulting from operations |
169,220,882 |
|
(40,736,360) |
RTW Biotech Opportunities Ltd
Unaudited Interim Consolidated Statement of Changes in Net Assets
for the six-month period ended 30 June 2026
(Expressed in United States Dollars)
|
|
Ordinary Share Class |
|
Non-Controlling Interest |
|
|
|
|
|
|
Net assets, beginning of period |
800,879,465 |
|
64,343,389 |
|
|
|
|
|
|
Operations |
|
|
|
|
Net investment income/(loss) |
(3,159,049) |
|
- |
|
Net realised gain/(loss) on securities and foreign currency transactions |
42,187,569 |
|
- |
|
Net change in unrealised gain/(loss) on securities and foreign currency translation |
120,901,581 |
|
- |
|
Net realised gain/(loss) on derivative contracts |
6,513,756 |
|
- |
|
Net change in unrealised gain/(loss) on derivative contracts |
2,777,025 |
|
- |
|
Income/(loss) attributable to Non-Controlling Interest |
(39,503,241) |
|
39,503,241 |
|
|
|
|
|
|
Net change in net assets resulting from operations |
129,717,641 |
|
39,503,241 |
|
|
|
|
|
|
Capital transactions |
|
|
|
|
Share buyback (Gross of $12,813 transaction costs; 30 June 2025: $10,147) |
(8,554,830) |
|
- |
|
Performance Allocation distribution |
- |
|
(14,099,906) |
|
Net change in net assets resulting from capital transactions |
(8,554,830) |
|
(14,099,906) |
|
|
|
|
|
|
Net assets, end of period |
922,042,276 |
|
89,746,724 |
RTW Biotech Opportunities Ltd
Unaudited Interim Consolidated Statement of Changes in Net Assets
for the six-month period ended 30 June 2025
(Expressed in United States Dollars)
|
|
Ordinary Share Class |
|
Non-Controlling Interest |
|
|
|
|
|
|
Net assets, beginning of period |
606,921,161 |
|
25,722,524 |
|
|
|
|
|
|
Operations |
|
|
|
|
Net investment income/(loss) |
19,341,253 |
|
- |
|
Net realised gain/(loss) on securities and foreign currency transactions |
(1,016,201) |
|
- |
|
Net change in unrealised gain/(loss) on securities and foreign currency translation |
(53,826,207) |
|
- |
|
Net realised gain/(loss) on derivative contracts |
4,193,445 |
|
- |
|
Net change in unrealised gain/(loss) on derivative contracts |
(9,428,650) |
|
- |
|
Income/(loss) attributable to Non-Controlling Interest |
1,538,582 |
|
(1,538,582) |
|
|
|
|
|
|
Net change in net assets resulting from operations |
(39,197,778) |
|
(1,538,582) |
|
|
|
|
|
|
Capital transactions |
|
|
|
|
Share buyback (Gross of $10,147 transaction costs; 30 June 2024: $22,681) |
(6,708,388) |
|
- |
|
Net change in net assets resulting from capital transactions |
(6,708,388) |
|
- |
|
|
|
|
|
|
Net assets, end of period |
561,014,995 |
|
24,183,942 |
RTW Biotech Opportunities Ltd
Unaudited Interim Consolidated Statement of Cash Flows
for the six-month periods ended 30 June 2026 and 30 June 2025
(Expressed in United States Dollars)
|
|
1 January 2026 to 30 June 2026 (unaudited) |
|
1 January 2025 to 30 June 2025 (unaudited) |
||||
|
Cash flows from operating activities |
|
|
|
||||
|
Net increase/(decrease) in net assets resulting from operations |
169,220,882 |
|
(40,736,360) |
||||
|
Adjustments to reconcile net change in net assets resulting from operations to net cash provided by/(used in) operating activities: |
|
|
|
||||
|
Net realised (gain)/loss on securities and foreign currency transactions |
(42,187,569) |
|
1,016,201 |
||||
|
Net change in unrealised (gain)/loss on securities and foreign currency translation |
(121,693,576) |
|
53,826,207 |
||||
|
Net realised (gain)/loss on derivative contracts |
(6,513,756) |
|
(4,193,445) |
||||
|
Net change in unrealised (gain)/loss on derivative contracts |
(2,777,025) |
|
9,428,650 |
||||
|
Effect of exchange rate changes on cash and cash equivalents |
398,545 |
|
(1,113,758) |
||||
|
Purchases of investments in securities |
(327,902,220) |
|
(199,936,589) |
||||
|
Proceeds from sales of investments in securities |
156,302,394 |
|
142,741,710 |
||||
|
Proceeds from securities sold short |
88,356,793 |
|
58,927,403 |
||||
|
Payments for securities sold short |
(13,982,896) |
|
(16,765,694) |
||||
|
Proceeds from derivative contracts |
18,786,125 |
|
8,701,968 |
||||
|
Payments for derivative contracts |
(9,973,388) |
|
(25,454,592) |
||||
|
Accretion of bond discount |
(2,171) |
|
(2,171) |
||||
|
Changes in operating assets and liabilities: |
|
|
|
||||
|
Other assets |
374,254 |
|
33,841 |
||||
|
(Receivable from)/payable for unsettled trades |
(2,927,734) |
|
4,080,685 |
||||
|
Due to brokers |
40,683,275 |
|
24,986,274 |
||||
|
Accrued expenses |
425,220 |
|
124,274 |
||||
|
Net cash provided by/(used in) operating activities |
(53,412,847) |
|
15,664,604 |
||||
|
|
|
|
|
||||
|
Cash flows from financing activities |
|
|
|
||||
|
Share buyback |
(7,703,340) |
|
(6,708,388) |
||||
|
Performance Allocation distribution |
(14,099,906) |
|
- |
||||
|
Net cash provided by/(used in) financing activities |
(21,803,246) |
|
(6,708,388) |
||||
|
Net change in cash and cash equivalents |
(75,216,093) |
|
8,956,216 |
||||
|
Cash, cash equivalents, and restricted cash, beginning of the period |
125,990,142 |
|
33,350,500 |
||||
|
Cash, cash equivalents, and restricted cash, end of the period |
50,774,049 |
|
42,306,716 |
||||
|
|
|||||||
|
At 30 June 2026, the amounts categorised in cash, cash equivalents, and restricted cash include the following: |
|||||||
|
Cash and cash equivalents |
3,653,807 |
|
2,661,257 |
||||
|
Due from brokers |
47,120,242 |
|
39,645,459 |
||||
|
Total |
50,774,049 |
|
42,306,716 |
||||
|
|
|
|
|
||||
|
Supplemental disclosure of cash flow information |
|
|
|
||||
|
Cash paid during the period for interest |
3,817,529 |
|
3,543,147 |
||||
|
|
|
|
|
||||
General Company Information
|
Structure |
Closed-end Investment Fund |
|
Domicile |
Guernsey |
|
Listing |
London Stock Exchange |
|
Launch date |
30 October 2019 |
|
Dividend policy |
To be reinvested |
|
Management fee |
1.25% |
|
Performance fee |
20% with an 8.0% annualised and compounded- since-inception hurdle |
|
ISIN |
GG00BKTRRM22 |
|
SEDOL |
BKTRRM2 |
|
Ticker |
RTW |
|
LEI |
549300Q7EXQQH6KF7Z84 |
|
Index inclusion |
FTSE 250, FTSE All-Share |
|
Website |
Glossary
Defined Terms
|
"AATD" or "alpha-1 antitrypsin deficiency" |
an inherited genetic disorder in which the body does not produce enough functional alpha-1 antitrypsin, a protein that protects the lungs from damage caused by inflammatory enzymes, leading to lung disease and/or liver disease; |
|
"ABHL" |
Arix Bioscience Holdings Limited, a wholly owned subsidiary of the Subsidiary which was acquired as part of the Arix Bioscience plc acquired entities and assets; |
|
"Adjusted Net Asset Value" |
the Net Asset Value adjusted by deducting the unrealised gains and unrealised losses in respect of private Portfolio Companies; |
|
"Administrator" |
Altum (Guernsey) Limited; |
|
"Admission" |
means admission of the Ordinary Shares to trading on the Main Market of the London Stock Exchange on 30 October 2019; |
|
"AIC" |
the Association of Investment Companies; |
|
"AIC Code" |
the AIC Code of Corporate Governance dated February 2019; |
|
"AIFM" |
means Alternative Investment Fund Manager; |
|
"AIFMD" |
the Alternative Investment Fund Managers Directive; |
|
"Annual Report" |
the Annual Report and audited financial statements; |
|
"Antibody" |
a large Y-shaped blood protein that can stick to the surface of a virus, bacteria, or receptor on a cell; |
|
"Antibody-Oligonucleotide Conjugates" or "AOC" |
molecules that combine structures of an antibody and an oligo; |
|
"Arix" |
Arix Bioscience plc, the company whose assets the Group acquired in February 2024; |
|
"ASCO" |
annual conference held by the American Society of Clinical Oncology; |
|
"Autoimmune diseases" |
conditions, where the immune system mistakenly attacks a body tissue; |
|
"Bispecifics" |
bispecific antibodies (BsAbs) have two distinct binding domains that can bind to two antigens or two epitopes (an antigen part) of the same antigen simultaneously; |
|
"Brinsupri" |
an approved drug developed by Insmed that is a treatment for non-cystic fibrosis bronchiectasis (NCFB); |
|
"Calculation Date" |
31 December or, if such date is not a business day, the previous business day; |
|
"Cardiometabolic diseases" |
a group of common but often preventable conditions including heart attack, stroke, diabetes, insulin resistance and non-alcoholic fatty liver disease; |
|
"Cardiovascular disease" |
conditions affecting heart and vascular system; |
|
"Clinical stage" or "clinical trial" |
a therapy in development goes through a number of clinical trials to ensure its safety and efficacy. Trials in human subjects range from Phase 1 to Phase 3; |
|
"Companies Law" |
the Companies (Guernsey) Law, 2008 (as amended); |
|
"the Company" |
RTW Biotech Opportunities Ltd (or RTW Bio), a company incorporated in Guernsey as a closed-ended Investment Company; |
|
"Contingent Value Rights" or "CVRs" |
Securities sometimes received during mergers, acquisitions, or divestitures designed to provide additional compensation or benefits contingent upon the occurrence of specific future events, such as regulatory approvals, milestones related to product development or commercialisation, or the achievement of certain financial targets; |
|
"Corporate Brokers" |
Bank of America and Jefferies International Limited; |
|
"CRS" |
Common Reporting Standard; |
|
"CX-11" |
also known as VCT220, oral small-molecule GLP-1 receptor agonist; |
|
"Danon Disease" |
a rare genetic heart condition in children, predominantly boys; |
|
"Directors" or "Board" |
the directors of the Company and the Subsidiary as at the date of this document and "Director" means any one of them; |
|
"DTR" |
Disclosure Guidance and Transparency Rules of the UK's FCA; |
|
"ESMO" |
European Society for Medical Oncology, a global, annual conference held for clinicians, researchers, patient advocates, journalists and healthcare industry representatives; |
|
"Fanconi Anaemia" |
a rare genetic blood condition in young children; |
|
"FATCA" |
the Foreign Account Tax Compliance Act; |
|
"FCA" |
the Financial Conduct Authority; |
|
"FDA" |
the United States Food and Drug Administration; |
|
"FRC" |
the Financial Reporting Council; |
|
"FTC" |
the Federal Trade Commission; |
|
"Gene therapy" |
a biotechnology that uses gene delivery systems to treat or prevent a disease; |
|
"Genetic Medicine" |
an approach to treat or prevent a disease using gene therapy or RNA medicines; |
|
"GFSC" |
the Guernsey Financial Services Commission; |
|
"GFSC Code"
|
the GFSC Finance Sector Code of Corporate Governance as amended in June 2021; |
|
"GLP-1" |
drugs that mimic the action of naturally occurring hormone glucagon-like peptide-1, which is produced in the intestines. Plays a crucial role in regulating blood sugar levels by stimulating insulin release, slowing stomach emptying and reducing appetite; |
|
"Greater China" |
encompasses mainland China, Macau, Hong Kong and Taiwan; |
|
"the Group" |
RTW Biotech Opportunities Ltd (or RTW Bio), and its subsidiaries, RTW Biotech Opportunities Operating Ltd, Arix Bioscience Holdings Limited and RTW Biotech ALI LLC; |
|
"HCM" or "Hypertrophic cardiomyopathy" |
a cardiovascular disease characterised by an abnormally thick heart muscle; |
|
"Intravesical" |
administered directly into the bladder; |
|
"Investment Manager" |
RTW Investments, LP, also called RTW Investments; |
|
"IPEV"
|
the International Private Equity and Venture Capital Valuation (IPEV) Guidelines set out recommendations, intended to represent current best practice, on the valuation of Private Capital Investments; |
|
"IPO" |
an initial public offering; |
|
"IRA" |
Inflation Reduction Act of 2022; |
|
"ISDA" |
International Swaps and Derivatives Association; |
|
"ITD" |
inception to date; |
|
"LAD-I" |
Leukocyte adhesion deficiency, a rare genetic disorder of immunodeficiency in young children; |
|
"Listing Rules" |
the listing rules made under section 73A of the Financial Services and Markets Act 2000 (as set out in the FCA Handbook), as amended; |
|
"London Stock Exchange" |
London Stock Exchange plc; |
|
"LSE" |
London Stock Exchange's main market for listed securities; |
|
"MASH" |
metabolic dysfunction-associated steatohepatitis; |
|
"Medtech" |
medical technology subsector of healthcare; |
|
"Myotonic Dystrophy" |
a genetic condition that affects muscle function; |
|
"Nasdaq Biotech" or "NBI" |
a stock market index made up of securities of NASDAQ-listed companies classified according to the Industry Classification Benchmark as either the Biotechnology or the Pharmaceutical industry; |
|
"Net Asset Value" or "NAV" |
the value of the assets of the Group less its liabilities, calculated in accordance with the valuation guidelines established by the Board; |
|
"New Performance Allocation Shares" |
performance allocation shares of no-par value in the capital of the Subsidiary; |
|
"NIH" |
National Institutes of Health, a part of the U.S. Department of Health & Human Services; |
|
"Non-Cystic Fibrosis Bronchiectasis (NCFB)" |
a chronic pulmonary disorder in which the bronchi become permanently dilated due to a cycle of inflammation and complications from prior infections; |
|
"Notional Ordinary Shares" |
Performance Ordinary Shares, in which receipt of such shares has been deferred; |
|
"Official List" |
the official list of the UK Listing Authority; |
|
"Oligonucleotides" or "Oligos" |
short DNA or RNA molecules that have a wide range of applications in genetic testing and research; |
|
"Oncology" |
a therapeutic area focused on diagnosis, prevention, and treatment of cancer; |
|
"Ophthalmic conditions" |
conditions affecting the eye; |
|
"Ordinary Shares" |
the Ordinary Shares of the Company; |
|
"Performance Allocation Shares" |
performance allocation shares of no-par value in the capital of the Company (prior to the 1 December 2022 reorganisation), or performance allocation shares of no-par value in the capital of the Subsidiary (with effect from the 1 December 2022 reorganisation); |
|
"Performance Allocation Period" |
each period ending on a Calculation Date and beginning on the business day immediately following the last Performance Allocation Period in respect of which a Performance Allocation has been allocated; |
|
"PIPE" |
private investment in a public equity; |
|
"Portfolio Companies" |
private and public companies in the Group's portfolio; |
|
"Prospectus" |
the prospectus of the Company, most recently updated on 5 January 2024 and available on the Company's website (www.rtwbio.com); |
|
"PWERM" |
probability-weighted expected return method; |
|
"Radiopharmaceuticals" |
pharmaceutical consisting of a radioactive compound used in radiation therapy; |
|
"Rare disease" |
a disease that affects a small percentage of the population; |
|
"Registrar" |
MUFG Corporate Markets (Guernsey) Limited; |
|
"RNA medicines" |
a type of biotechnology that uses RNA to treat a disease; |
|
"ROW" |
the rest of the world (outside of the US, Canada, UK and Europe); |
|
"RTW Institute" |
RTW Investments-launched, independent, non-profit policy research organisation; |
|
"Russell 2000 Biotechnology Index" or "RGUSHSBT" or "R2kB" |
a stock index of small cap biotechnology and pharmaceutical companies; |
|
"Small molecule" |
a compound that can regulate a biologic activity; |
|
"SPAC" |
Special Purpose Acquisition Company; |
|
"the SPV" |
RTW Biotech ALI LLC; |
|
"Sub-Administrator" |
Morgan Stanley Fund Services USA LLC; |
|
"the Subsidiary" or "OpCo" |
RTW Biotech Opportunities Operating Ltd; |
|
"Type 1 Diabetes" or "TD1" |
a type of insulin resistance; |
|
"Total shareholder return" |
the percentage increase or decrease in the price per share during the reporting period; |
|
"UK AIFMD" |
refers to a domestic regime of laws regulating the management and marketing of alternative investment funds and fund managers in the UK, which generally maintains the rules set out in the European Union's AIFMD as implemented at the end of the transition period following Brexit; |
|
"UK Code" |
the UK Corporate Governance Code 2024 published by the Financial Reporting Council in January 2024; |
|
"UK-Guernsey IGA" |
The UK-Guernsey Intergovernmental Agreement for the Automatic Exchange of Information; |
|
"US GAAP" |
United States Generally Accepted Accounting Principles; |
|
"Valuation Committee" |
Valuation Committee of the Investment Manager; |
|
"WACC" |
weighted average cost of capital; |
|
|
|
Listing of portfolio company abbreviations used throughout this report
|
Shorthand Company Name |
Legal Company Name |
|
Aktis |
Aktis Oncology |
|
Amani |
Amani Therapeutics |
|
ALI |
American Laboratories Inc. |
|
Apellis |
Apellis Pharmaceuticals, Inc. |
|
Apogee |
Apogee Therapeutics, Inc. |
|
argenx |
argenx SE |
|
Artios |
Artios Pharma, Inc. |
|
Celcuity |
Celcuity Inc. |
|
Centessa |
Centessa Pharmaceuticals plc |
|
CG Oncology |
CG Oncology Inc. |
|
Compass |
Compass Pathways plc |
|
Corxel |
Corxel Pharmaceuticals |
|
Ensoma |
Ensoma, Inc. |
|
Erasca |
Erasca, Inc. |
|
Establishment Labs |
Establishment Labs, Inc. |
|
GH Research |
GH Research PLC |
|
Immatics |
Immatics N.V. |
|
Insmed |
Insmed Incorporated |
|
iRhythm |
iRhythm Technologies, Inc. |
|
Kailera |
Kailera Therapeutics |
|
Madrigal |
Madrigal Pharmaceuticals, Inc. |
|
Milestone |
Milestone Pharmaceuticals, Inc. |
|
Neurocrine |
Neurocrine Biosciences, Inc. |
|
Neurogene |
Neurogene, Inc. |
|
Oruka |
Oruka Therapeutics, Inc. |
|
Penumbra |
Penumbra, Inc. |
|
Prolium |
Prolium Bioscience, Inc. |
|
Protagonist |
Protagonist Therapeutics, Inc. |
|
PTC |
PTC Therapeutics, Inc. |
|
RadNet |
RadNet, Inc. |
|
RAPT |
RAPT Therapeutics, Inc. |
|
Replimune |
Replimune Group Inc. |
|
RTW Royalty 2 |
RTW Fund 2 (royalty deal for Jelmyto) |
|
RTW Royalty Fund |
4010 Royalty Fund, a private fund created and managed by RTW Investments, LP. |
|
Savara |
Savara, Inc. |
|
Serapha |
Serapha Bio, Inc. |
|
Spyre |
Spyre Therapeutics, Inc. |
|
Stoke |
Stoke Therapeutics, Inc. |
|
Tango |
Tango Therapeutics, Inc. |
|
Tarsus |
Tarsus Pharmaceuticals, Inc. |
|
Taysha |
Taysha Gene Therapies, Inc. |
|
Tenax |
Tenax Therapeutics, Inc. |
|
Ultragenyx |
Ultragenyx Pharmaceuticals, Inc. |
|
uniQure |
uniQure biopharma B.V. |
|
UroGen |
UroGen Pharma |
|
Verastem |
Verastem, Inc. |
|
Yarrow Bioscience |
Yarrow Bioscience, Inc. |
Alternative Performance Measures
|
APM |
Definition |
Purpose |
Calculation |
|
Available Cash |
Cash held by the Group's Bankers, Prime Brokers and ISDA counterparties. |
A measure of the Group's liquidity, working capital and investment level. |
Cash and cash equivalents, Due from brokers, Receivable from unsettled trades and other miscellaneous current assets, less Due to brokers, Payable for unsettled trades and other miscellaneous current liabilities on the Statement of Assets & Liabilities.
|
|
NAV per Ordinary Share |
The Group's NAV divided by the number of Ordinary Shares. |
A measure of the value of one Ordinary Share. |
The net assets attributable to Ordinary Shares on the statement of financial position divided by the number of Ordinary Shares in issue as at the calculation date. |
|
Price per share |
The Company's closing share price on the London Stock Exchange for a specified date. |
A measure of the supply and demand for the Company's shares. |
Extracted from the official list of the London Stock Exchange. |
|
NAV Growth |
The percentage increase or decrease in the NAV per Ordinary share during the reporting period. |
A key measure of the success of the Investment Manager's investment strategy. |
The quotient of the NAV per share at the end of the period and the NAV per share at the beginning of the period minus one expressed as a percentage. |
|
Share price growth/Total Shareholder Return |
The percentage increase or decrease in the price per share during the reporting period. |
A measure of the return that could have been obtained by holding a share over the reporting period. |
The quotient of the price per share at the end of the period and the price per share at the beginning of the period minus one, expressed as a percentage. The measure excludes transaction costs. |
|
Share Price Premium/ (Discount) |
The amount by which the Ordinary Share price is higher/lower than the NAV per Ordinary Share, expressed as a percentage of the NAV per ordinary share. |
A key measure of supply and demand for the Company's shares. A premium implies excess demand versus supply and vice versa. |
The quotient of the price per share at the end of the period and the NAV per share at the end of the period minus one, expressed as a percentage. |
|
Multiple on Invested Capital (MOIC or MOC) |
The multiple that measures value that an investment has generated. |
A measure to evaluate performance of the realised and unrealised investments. |
The ratio between initial capital invested in a portfolio company and current value of the investment. It is a gross metric and calculation is performed before fees and incentive. |
|
Extended Internal Rate of Return (XIRR) |
The percentage or single rate of return when applied to all transactions in a portfolio company. |
A measure of return which is used when multiple investments have been made over time into a portfolio company. |
The rate also expressed as a percentage that calculates the returns on the total investment made with increments through a given period. |
|
Ongoing Charges Ratio |
The recurring costs that the Group has incurred during the period excluding performance fees and one-off legal and professional fees, expressed as a percentage of the Group's average NAV for the period. |
A measure of the minimum gross profit that the Group needs to produce to make a positive return for shareholders. |
Calculated in accordance with the AIC methodology detailed at the web link below: https://www.theaic.co.uk/sites/default/files/documents/AICOngoingChargesCalculationMay12.pdf
|
|
Leverage |
As defined by the AIFMD, any method by which the AIFM increases the exposure of an AIF it manages, whether through borrowing of cash securities, or leverage embedded in derivative positions or by any other means. |
A measure of the excess of the Group's investments exposure over its total net assets. |
Calculated in accordance with the AIFMD's gross and commitment methodologies as outlined in Articles 7 and 8 of the Delegated Regulation 231/2013: https://eur-lex.europa.eu/legal-content/EN/TXT/?uri=CELEX%3A32013R0231 |
|
Economic Exposure |
Economic exposure represents the Group's total economic interest in an underlying security, measured as the closing price of the security multiplied by the number of shares held or referenced across all instruments held by the Group.
|
Economic exposure is presented to reflect the Group's aggregate economic interest in an underlying security across all instruments on a consistent and comparable basis.
|
Closing price multiplied by the shares held or referenced across all instruments. |
-- ENDS --
RNS may use your IP address to confirm compliance with the terms and conditions, to analyse how you engage with the information contained in this communication, and to share such analysis on an anonymised basis with others as part of our commercial services. For further information about how RNS and the London Stock Exchange use the personal data you provide us, please see our Privacy Policy.

Latest directors dealings
- 18 minutes ago Mitchells & Butlers
- 34 minutes ago Prudential
- 1 hour ago Oxford Instruments
- 1 hour ago BHP Group Limited NPV (DI)
- 3 hours ago Hilton Food Group