
Annual Financial Report
Summary by AI BETAClose X

30 July 2026
|
Platform HG Financing Plc
Platform Housing Group Limited
|
Results for the year to 31 March 2026
The following report provides a summary of Platform Housing Group's ('Platform' / 'the Group') performance for the year ending 31 March 2026. All financial figures agree to Platform's Financial Statements, which have been subject to external audit by KPMG.
Highlights
· Social housing lettings turnover growth of 6% to £317.8m (Mar-25: £299.7m)
· Shared ownership sales turnover of £40.4m moderated in year in line with tenure changes and delays caused by infrastructure and planning approvals from statutory authorities (Mar-25: £48.7m)
· Overall turnover of £384.6m up by 2.7% (Mar-25: £374.5m)
· Social housing lettings surpluses and margins of 27% (Mar-25: 31.6%) affected by asset investment and maintenance costs pressures
· Development completions up a third to 1,380 (Mar-25: 1,036) with developments starting on site for a further 1,556 homes (Mar-25: 1,645)
· Lowest-ever arrears of 2.0% (Mar-25: 2.4%)
· £250m sustainable bonds issued at record low spread for social housing sector
· Helen Gillett appointed as Group Board Chair
|
At or for the year to March |
|
2025 |
2026 |
Change |
|
|
|
|
|
|
|
Turnover |
|
£374.5m |
£384.6m |
2.7% |
|
Social housing lettings turnover |
|
£299.7m |
£317.8m |
6.0% |
|
Operating surplus(1) |
|
£98.6m |
£87.8m |
-11.0% |
|
New homes completed |
|
1,036 |
1,380 |
33.2% |
|
Investment in new homes |
|
£287.9m |
£328.7m |
14.2% |
|
Investment in existing homes(5) |
|
£62.5m |
£62.2m |
-0.5% |
|
Share of turnover from social housing lettings |
|
80.0% |
82.6% |
+2.6ppt |
|
Social housing lettings margin(2) |
|
31.6% |
27.0% |
-4.6ppt |
|
Operating margin(2)(6) |
|
26.2% |
22.7% |
-3.5ppt |
|
Current tenant arrears(3)(4) |
|
2.4% |
2.0% |
-0.4ppt |
|
Gearing(4)(7) |
|
40.4% |
40.2% |
-0.2ppt |
|
EBITDA-MRI interest cover(7) |
|
169% |
149% |
-20.0ppt |
Notes
(1) Surplus excluding gains on disposal of property, plant and equipment
(2) Regulator for Social Housing Value for Money Metric
(3) Current tenant arrears includes all general needs tenants (this excludes shared ownership properties)
(4) Figures as at 31 March (as opposed to accumulated over the period to March)
(5) Investment in existing homes includes capital expenditure on maintenance and decarbonisation works
(6) Operating margin excludes surplus on sales of fixed assets
(7) Calculated in accordance with Platform's tightest funding restriction
Kevin Bolt, Platform's Interim Chief Executive Officer commented:
"This year saw the end of Platform's 2021-26 Corporate Strategy and during this period the organisation has made significant progress in an operational environment that has changed and developed significantly. Externally, Tenant Satisfaction Measures have been established, as has the Housing Ombudsman's Complaint process and the Housing Regulator's new Inspection process. Awaab's Law has been enacted as a response to the tragic death of Awaab Ishak from the inhalation of mould spores. The Strategic Partnership working with Homes England has been developed to encourage organisations to stretch their new home ambitions and the Building Safety Regulator has been established. The economic outlook has ebbed and flowed and suffered as a result of political uncertainty, conflict and accelerated global warming.
Against this backdrop, Platform has matured as an organisation, improving in all aspects of its customer service, strengthening its financial management and developed many much-needed new homes.
During the year Platform continued to step up its asset investment programme, a pattern that will continue over the coming years. This investment is core to the organisation's continued progress and underpins the continuous improvement of its repairs service. It is also central to the enhancement of customer satisfaction, the driving force for the organisation and I am pleased to be able to report that Platform's overall satisfaction improved from 81% to 85% during the year. Whilst we are looking to go much further, this improvement is an encouraging step forwards.
Platform has also delivered for its new customers with the continuation of its new homes programme in line with its commitments as a Homes England Strategic Partner. It completed 1,380 new homes across the organisation's operational area, as well as starting a further 1,556 homes in line with Affordable Housing Programme commitments.
The new Corporate Strategy, which will be published in the Autumn of 2026, will see further investment in homes and repairs services as the organisation addresses the intrinsics of its operational performance to ensure that it has a solid foundation on which to build its future. The Strategy will also build on its localities approach in order to better deliver services to customers and repairs.
Housing Associations are long term businesses and Platform's 2025/26 performance reflects the organisation's embedded strategies, whilst showing resilience in the face of an evolving regulatory environment and uncertain economic conditions. Whilst operating margins have come under pressure, it has continued to deliver for its current and future customers whilst ensuring it is continuing to invest for the future. These achievements have been delivered by Platform's committed Team working alongside partners and stakeholders and I would like to take this opportunity to thank our investors for their continued support."
Disclaimer
These materials have been prepared by Platform Housing solely for use in publishing and presenting its results in respect of the year ended 31 March 2026.
These materials do not constitute or form part of and should not be construed as, an offer to sell or issue, or the solicitation of an offer to buy or acquire securities of Platform Housing in any jurisdiction or an inducement to enter into investment activity. No part of these materials, nor the fact of their distribution, should form the basis of, or be relied on or in connection with, any contract or commitment or investment decision whatsoever. Neither should the materials be construed as legal, tax, financial, investment or accounting advice. The information presented herein does not constitute a prospectus for the purposes of the Public Offers and Admissions to Trading Regulations 2024 (SI 2024/105) or the Prospectus Rules: Admission to Trading on a Regulated Market sourcebook (PRM Rules) of the UK Financial Conduct Authority (FCA).
These materials contain statements with respect to the financial condition, results of operations, business and future prospects of Platform Housing that are forward-looking statements. By their nature, forward-looking statements involve risk and uncertainty because they relate to events and depend on circumstances that will occur in the future. There are a number of factors that could cause actual results and developments to differ materially from those expressed or implied by these forward-looking statements, including many factors outside Platform Housing's control. Among other risks and uncertainties, the material or principal factors which could cause actual results to differ materially are: the general economic, business, political and social conditions in the key markets in which Platform Housing operates; the ability of Platform Housing to manage regulatory and legal matters; the reliability of Platform Housing's technological infrastructure or that of third parties on which it relies; interruptions in Platform Housing's supply chain and disruptions to its development activities; Platform Housing's reputation; and the recruitment and retention of key management. No representations are made as to the accuracy of such forward looking statements, estimates or projections or with respect to any other materials herein. Actual results may vary from the projected results contained herein.
These materials contain certain information which has been prepared in reliance on publicly available information (the "Public Information"). Numerous assumptions may have been used in preparing the Public Information, which may or may not be reflected herein. Actual events may differ from those assumed and changes to any assumptions may have a material impact on the position or results shown by the Public Information. As such, no assurance can be given as to the Public Information's accuracy, appropriateness or completeness in any particular context, or as to whether the Public Information and/or the assumptions upon which it is based reflect present market conditions or future market performance. Platform Housing does not make any representation or warranty as to the accuracy or completeness of the Public Information.
These materials are believed to be in all material respects accurate, although it has not been independently verified by Platform and does not purport to be all-inclusive. The information and opinions contained in these materials do not purport to be comprehensive, speak only as of the date of this announcement and are subject to change without notice. Except as required by any applicable law or regulation, Platform Housing expressly disclaims any obligation or undertaking to release publicly any updates or revisions to any information contained herein to reflect any change in its expectations with regard thereto or any change in events, conditions or circumstances on which any such information is based.
None of Platform Housing, its advisers nor any other person shall have any liability whatsoever, to the fullest extent permitted by law, for any loss arising from any use of the materials or its contents or otherwise arising in connection with the materials. No representations or warranty is given as to the achievement or reasonableness of any projections, estimates, prospects or returns contained in these materials or any other information. Neither Platform nor any other person connected to it shall be liable (whether in negligence or otherwise) for any direct, indirect or consequential loss or damage suffered by any person as a result of relying on any statement in or omission from these materials or any other information and any such liability is expressly disclaimed.
Any reference to "Platform" or "Platform Housing" means Platform Housing Group Limited and its subsidiaries from time to time and their respective directors, representatives or employees and/or any persons connected with them.
Operating review
Introduction
This has been one of the most challenging years for Platform in recent times, with cost pressures from maintenance activities added to regulatory requirements of the newly introduced Awaab's Law, and a continued commitment to invest in improving services and homes, as well as build more much-needed new housing. As a consequence, we have fallen short of our golden rule of achieving a 30% margin for social housing lettings activities. Pressure will be on this margin again in 2026/27, but the Group Board have kept the rule in place as we look to regain this position in the coming years.
It is pleasing to report that good progress has been made on delivering for customers. Overall satisfaction with our services saw further increases for the third year in a row, averaging 85% for the year, up from 71% just three years ago.
New home developments started on site were again high at around 1,600, with completions in the year nearly 1,400, the highest number for over five years and enough to see Platform feature in the ten largest developers in the sectors 'Top 50 Biggest Builders Survey'.
The Group's financial position remains robust, with A+ ratings with S&P and Fitch affirmed in the year, with the S&P outlook revised to negative, to sit alongside Fitch's. We retain strong liquidity and this was bolstered in the year by issuing a £250m bond with a record low spread for the social housing sector, and arranging a further £100m revolving credit facility. The additional funding will help support our on-going investment objectives as we continue to improve our services, enhance the quality and sustainability of our homes, and build new homes for those unable to access the private market.
Service review
Supporting our customers, welfare benefits and arrears
We offer a suite of services that ensure our customers are supported to achieve the best outcomes available. These include keeping in touch with all of our customers, help with employment, debt advice through to direct support from our Wellbeing Fund.
Our Successful Tenancies Team provide help and advice to customers who are experiencing financial difficulties and supported approximately 7,000 customers in the year, helping to achieve £4.3m in financial outcomes by optimising benefits, savings and rental income (March 2025: £3.9m).
Our Wellbeing Fund helps us target those customers who are most in need with essentials such as food, clothing and white goods. The fund, which was originally established during the Covid-19 pandemic, was maintained for the fifth year in a row, allocating £1.1m to help approximately 2,700 customers (Mar-25: £1.1m and approximately 3,000 customers).
We use customer satisfaction to help us gauge whether our services are improving as measured through our extensive suite of transactional surveys. Customer satisfaction increased to 85% in the year (Mar-25: 81%), which continues the trend in overall satisfaction levels seen over the last three years.
|
Time Period |
Satisfaction
|
Target |
|
Year to Mar 23 |
71% |
75% |
|
Year to Mar 24 |
76% |
75% |
|
Year to Mar 25 |
81% |
75% |
|
Year to Mar 26 |
85% |
80% |
On top of customer satisfaction recorded in our transactional surveys, we also report on Tenant Satisfaction Measures (TSMs) for our Regulator. The TSMs are annual perception surveys undertaken by an independent research agency, with c2,900 customers contacted over the course of the year. We are pleased to see that Low-cost Rented Accommodation (LCRA) measures experienced a 4.9% increase in overall satisfaction. This was accompanied with improvement across all 12 measures. Since TSMs were introduced by the regulator in 2023/24, we have seen some significant improvements:
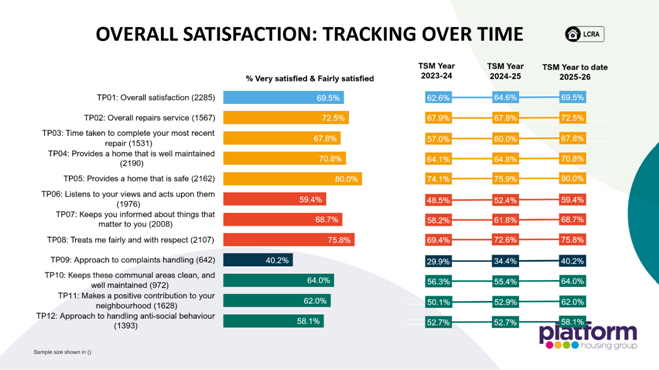
Some of the greatest improvements have been in the following measures:
· Time taken to complete repairs has improved by 10.8%
· Listening to customer views and acting upon them has gone up by 10.9%
· Keeping customers informed has gone up by 10.5%
· Approach to complaint handling has gone up by 10.3%
· Making a positive contribution to the neighbourhood has gone up by 11.9%
We are currently working on improvement plans to drive further improvements across the LCRA measures.
Our Low Cost Home Ownership accommodation has experienced adverse movements in four out of the nine measures in comparison to the prior-year. There is a comprehensive action plan in place for improvements in this area. We recognise that low scores in this area are a sector-wide problem and our Chief Operations Officer is leading a working group with colleagues from the East Midlands National Housing Federation Group to see how, as a sector, we can work together to drive improvements.
Our arrears performance continues to perform structurally better than the previous year, with arrears of 2% down on the prior year figure of 2.4%, saving £0.8m. Improving arrears performance has been driven by a number of enhancements to systems and processes, including:
· The introduction of a new case management system that flags when manual intervention is needed, reducing the time taken by colleagues to review cases and enabling greater focus on more complex and higher risk cases. This has reduced debt escalation and lowered reliance on legal actions. Compared to the previous year, we have achieved a 17% reduction in evictions and a 38% reduction in court applications
· Our Universal Credit 'bot' has continued to process claims efficiently and accurately without the need for human intervention, resulting in considerable time savings
· We continued our collaboration with Allpay and Voicescape to implement a 'Pay by Link' solution, enabling customers to make rent payments via a secure link sent by text message. This initiative generated over £2.3m in rent payments during the year and highlights the considerable progress being made in modernising the Group's income collection approach.
Voids management
At the end of the year there were 379 void rental properties (Mar-25: 322) and 230 void properties awaiting sale on a shared ownership basis (Mar-25: 84). Void loss as a proportion of turnover was 1.75% (£5.4m), up from 1.6% (£4.8m) in the prior year. The year-on-year increase was driven by the time void homes were in for repair, as we saw the extent of repair work required to bring homes back into a lettable standard increase. Relet times for all tenures remained greater than the 30-day target at 61 days, up from 52 in the prior year. Work started in the year to develop a fully automated voids and lettings process, which will increase efficiency and improve the overall customer onboarding journey. This will continue throughout 2026/27 with an aim to deliver the system before the end of the financial year.
Digital integration and security
This year our focus has moved from delivering major corporate systems to transforming our core property services, strengthening our data capability and continuing to improve our cyber resilience.
A key priority will be the implementation of Totalmobile Field First as our end-to-end property solution. Working closely with colleagues across the business, we have begun transforming the way repairs, compliance and field operations are managed, providing a modern mobile platform that simplifies processes, improves scheduling and gives operatives access to the information they need wherever they are working. This programme forms the foundation of our future property operating model and will continue to evolve over the coming years.
We have also launched our Together in Data programme, built on Microsoft Fabric, which will establish a single modern data and reporting platform for the Group. By bringing data together into a common platform, we will improve reporting, enable faster and more consistent decision making, and create the foundations for the responsible use of artificial intelligence and advanced analytics across the organisation.
Alongside this investment, we have continued to mature our data governance framework. During the year we strengthened data ownership and stewardship arrangements, and introduced improved governance, quality monitoring and accountability to ensure data is managed as a strategic business asset.
Cyber security remains a strategic priority. During the year we successfully achieved recertification to the ISO 27001 Information Security Management Standard, demonstrating our continued commitment to protecting customer and business information. We have continued to strengthen our cyber security controls through improvements to identity and privileged access management, security monitoring, conditional access policies and the rollout of Data Loss Prevention capabilities across our Microsoft 365 environment. We have also progressed our governance for the responsible adoption of artificial intelligence, including preparations for ISO 42001 certification.
By continuing to align our technology, property, data and cyber security strategies, we are creating a secure, resilient and modern digital foundation that supports better services, better decision making and improved outcomes for our customers and colleagues.
Asset management
Our asset management priorities continue to focus on the provision of safe, quality and sustainable homes to our customers. The governance of our assets has been strengthened in the year by bringing together the Assets Directorate and our maintenance services subsidiary, Platform Property Care (PPC). The combined team will be led by our Chief Property Officer, who formerly managed the PPC business.
We transitioned our operations from a centrally governed service provision to a localities-based model during the year, allowing maintenance activities to align with housing operatives in order to offer a more tailored approach and improve service and delivery to customers. The roll-out of this localities model will be further refined as we head into 2026/27, supported by more detailed locality-based reporting to aid in better decision making.
Work has taken place to ensure compliance with targets associated with Awaab's Law phase 1, which came into force during the year and is used to identify and assess risks to the health and wellbeing of people in their own home. Systems, policies and processes are now in place to ensure compliance and all affected employees have received training. Further preparation is on-going in readiness for Phase 2 roll-out, which is expected in October 2026.
We continue to see an increased number of repairs logged, particularly for emergency works and this diverts resources from planned to responsive repairs. In addition, the scope of work required to return void properties to our lettable standard remains at a significant level. The subcontractor market continues to be difficult and PPC has continued to progress the internalisation of delivery where appropriate.
During the year a decision was made by all three members to close the Cost Sharing Group (CSG) that delivered maintenance services to Platform Housing Limited (PHL), as well as two external providers (Rooftop Housing Group and Stonewater Limited). The CSG was formally closed in June 2026 and PPC will continue to provide maintenance services to PHL, with resources re-directed into internal delivery to mitigate costs.
Environmental, social and governance ('ESG')
Platform considers ESG to be a key part of its core operations and has a Sustainability Strategy that includes targets for improvements across all areas of the organisation. We continue to support the sector and investor led Sustainability Reporting Standard (SRS) and link much of our new funding to sustainability-related frameworks, including our Sustainable Finance Framework (the Framework) for bonds issuance.
Environmental
Platform is committed to achieving an Energy Performance Certificate (EPC) C rating by 2030 and to reach net zero carbon by 2050. This aligns with preparations for the Government-led Decent Homes 2 and Minimum Energy Standards, which are due to come into effect in the coming years and replace the current EPC methodology. To achieve this, we will improve home energy efficiency through a combination of fabric and technology upgrades, phasing out the installation of gas boilers, electrifying the vehicle fleet and developing 'zero bills' new homes.
Changes to the EPC methodology during the year resulted in the Standard Assessment Procedure (SAP) scores (that underpin EPC ratings) of our homes reducing to 73.8 from 74.1 (under the old EPC methodology the score would have increased to 74.3). This resulted in the percentage of our homes that meet an energy rating of EPC C, or better, staying static at 81%. In spite of this change we are confident in our ability to meet the 2030 deadline and are expanding our Warm Homes Programme and the improvements completed in empty homes in order to support this.
Our Retrofit Team has established a programme based on the principles of fabric first, future proofing and no fossil fuels to ensure that we achieve our carbon reduction targets. In the year we installed the following retrofit measures:
|
Homes fitted |
FY2026 |
FY2025 |
|
Air source heat pumps |
329 |
226 |
|
Solar PV panels |
495 |
385 |
|
Insulation measures |
978 |
309 |
We have set interim carbon reduction targets that align with the requirements set out within the Science Based Targets Initiative Corporate Net Zero Standard. Progress is measured against a FY2025 base year.
|
Emissions tCO2e |
2024/25 |
2025/26 |
|
Scope 1/2 |
3,798 |
3,464 |
|
Scope 3 |
156,984 |
158,643 |
|
Homes1 |
41,356 |
42,052 |
|
Per home |
|
|
|
Scope 1/2 |
0.09 |
0.08 |
|
Scope 3 |
3.80 |
3.84 |
1Homes are those owned and managed and include all homes reported as such in Platform's Financial Statements, excluding those where we do not have the ability to influence energy efficiency improvements, such as leasehold properties, private rented and shared ownership.
Overall our scope one and two emissions reduced both in absolute terms and as a proportion of our homes. This was supported by our move to 100% REGO-backed renewable electricity. Scope 3 emissions are largely produced by our homes under management and purchased goods and services, which both account for approximately half of the emissions in this area. Purchased goods and services are largely made up of development-related expenditures and increased by approximately 6% in the year as Platform pushed ahead with development activity. Scope 3 emissions that related to housing assets decreased in the year, which is pleasing in light of growth in homes overall, and demonstrates efficiencies brought about by retrofit and other sustainable improvements.
|
Emissions tCO2e |
24/25 |
25/26 |
|
Scope 3 - homes |
75,635 |
74,919 |
|
Homes owned |
41,356 |
42,052 |
|
Per home |
1.83 |
1.78 |
We recognise that transparency matters and have achieved Achilles Carbon Reduce Certification in the year, having measured greenhouse gas emissions in accordance with ISO 14064-1:2018. The Achilles Carbon Reduce Programme is a leading carbon emissions verification and reduction programme developed by climate scientists to support organisations to build best practice, achieve long-term sustained carbon action and report scope 1, 2 and 3 emissions with confidence. Figures for the 2024/25 and 2025/26 financial years have been certified through the Achilles Programme and we intend to continue to use the accreditation moving forwards.
Delivering sustainable communities and energy efficient homes which benefit the wider environment continues to be a key focus. This year saw the first completions at Trentside in Nottingham, where Platform partnered with Octopus Energy to deliver 82 'zero bills' and a further 69 net zero carbon new homes, which were built with heat pumps, solar PV and battery storage.
Platform is now represented on the Future Homes Hub (FHH) and Construction Working Group, which focusses on improving the production and performance of homes in operation. We have also joined the FHH Place and Nature Steering Group which will look at "places and developments that are consistently low carbon, nature-rich, resilient, healthy, well designed and beautiful". Partnering with peers in the social housing and housebuilding sectors will support Platform in developing and delivering on our Sustainability Strategy, aligning with evolving regulations and best practice.
Social
Making a social contribution is at the core of what we do, by managing existing affordable housing, delivering new affordable housing and actively enhancing the communities in which we operate. We aim to deliver social value across all areas of our business, with particular focus on community cohesion and wellbeing.
We are committed to providing genuinely affordable housing and as at March 2026 our rents were 63% of open market rent in the areas in which we operate (Mar-25: 63%). Over 99% of all of our homes are for an affordable tenure and during the year 99% of our homes developed were affordable tenures.
We are committed to being both a landlord and a developer of places that provide positive neighbourhoods to our customers. Our Community Engagement Officers work hand-in hand with community representatives to ensure that we provide value to the communities in which we operate. We have continued to run our 'Community Conversation' roadshow events throughout 2025. In total we held 22 events across our localities and spoke to over 270 customers in their local communities. This programme has proven to be a successful way to engage with customers and provide them with information and support.
We operated a range of initiatives in the year, including:
· Our Communities Connected initiative, which includes a range of community events, neighbourhood clear-ups, fitness activities, environmental initiatives, community safety promotion and digital inclusion sessions. Over 100 volunteering opportunities were provided across our areas and nearly 900 hours were given by volunteers, including Platform colleagues
· Our Community Chest Fund, which supports charitable organisations, voluntary groups and other clubs to make a difference in their community. The fund supported 108 projects with £158,000 of funding in the year
· Our Community Kindness Campaign, which provided funding to community groups who help those in need, supported 174 initiatives with £81,000 in funding
· An educational programme delivered by Villiers Park Educational Trust that will tackle social mobility amongst secondary school pupils across Lincolnshire. The programme will target up to 60 children in year 10, helping them to build confidence and develop skills to enhance their future career prospects
· Providing two part-time Community Builder roles funded by the UK Shared Prosperity and Homes for Ukraine Funds. During the year the roles received the High Sheriffs Award in recognition of work undertaken to establish a Welcome Hub, providing language classes, yoga and therapeutic crafts to resettled communities, including Ukrainians
· Providing digital inclusion sessions to help enable customers to access food bank vouchers, energy bills advice, to seek employment and master IT basics. These sessions are complemented by sourcing low-cost, high performance refurbished laptops for our customers at half the cost of new, similar products.
We again ran a Wellbeing Fund in the year, providing short-term support to customers experiencing financial difficulties. Over the year the fund has allocated £1.1m to support c2,700 customers with essentials such as food, household items and energy vouchers.
Governance
The activities of the Group are supported by a commitment to the highest standards of governance. This is recognised by the Regulator of Social Housing, who performed an annual stability check in December 2025 and re-affirmed Platform's governance and viability ratings of 'G1/V1' (the highest grading available).
In addition to regulatory assessments, we are rated by both S&P Global (S&P) and Fitch Ratings (Fitch). Our A+ rating was affirmed by S&P following an annual review in January 2026, with the outlook updated to negative (formerly stable), reflecting S&P's assessment of cost pressures faced by Platform. The S&P rating sits alongside our A+ (negative outlook) rating with Fitch, which was affirmed in October 2025.
We recognise the value that comes from having Board members with broad and varied experience. Throughout 2025/26 we have remained committed to maintaining an inclusive Board structure that reflects a broad range of viewpoints and experiences relevant to our operations.
Platform's Group Chair, John Weguelin, retired at the end of the year and Helen Gillett was appointed. Helen brings more than 30 years' experience in customer service leadership, working across social housing, telecoms and the water industry. She most recently served as Senior Independent Director on the Board of Orbit Group Ltd, where she chaired the Customer Service Committee and acted as the statutory Member Responsible for Complaints.
During the year Elizabeth Froude, Platform's Group Chief Executive (CEO) left and an interim CEO, Kevin Bolt, was appointed. A permanent CEO, Emma Palmer, was announced in July 2026. Emma, who has been Chief Executive of Eastlight Homes for the last eight years, brings deep and broad sector leadership experience and has a highly regarded track record of delivering positive outcomes for residents, colleagues and wider stakeholders. Emma will take up the role in September 2026.
Development review
Strategy
Platform's delivery has continued in line with our strategy and land led approach. We have maintained a pipeline of schemes to deliver quality, affordable and sustainable homes to help address the housing shortage in our areas of operations. Our ambition is to deliver as much social and affordable housing as our financial strength can reasonably support. Growth - considered, consistent and long-term, continues to be a key goal for Platform, however, this will only be done whilst balancing financial resilience and remains behind our retrofit and customer priorities.
Home building programme
We started 1,556 new homes in 2025/26, broadly in line with our annual target of 1,600 and completed 1,380 new homes, against a target of approximately 1,600. This demonstrates resilient delivery in the face of a number of systemic constraints, most notably delays associated with third party infrastructure provision, particularly highways-related works. This delivery, despite a challenging environment, continues to place Platform as a larger developer of affordable housing, both regionally and nationally, as demonstrated by being in the top ten largest developers for completions and starts-on-site for the year (source: Inside Housing's 'Top 50 Biggest Builders' Survey').
All 1,380 completions achieved for 2025/26 were for affordable tenures; 20% were built for social rent, 31% for affordable rent, 4% for rent to buy and 45% for shared ownership.
|
|
Affordable Rent |
Social Rent |
Shared Ownership |
Rent To Buy |
Total |
|
New homes |
431 |
274 |
621 |
54 |
1,380 |
Performance against Homes England targets was exceeded in the year, starting 1,133 affordable homes and delivering 941 completions. Further grant of £60m was secured in the year in order to deliver over 600 homes in addition to our SP2 delivery targets. We have submitted a bid for the new Social and Affordable Housing Programme (2026 - 2036) to secure part of the £27.3bn available, albeit we have had to revise this bid on the request of Homes England. Our revised bid will re-profile our grant allocation and reduce delivery accordingly over the coming years.
Development expenditures of £328.7m were up on the prior year figure of £287.9m as we continue to build more much needed housing. As at 31 March 2026, Platform owned a total of 51,366 homes (Mar-25: 50,094).
Customers
We continue to focus on our customers, delivering homes that are high quality, affordable and sustainable. Customer satisfaction for our newly developed homes remains a high priority and it's pleasing that levels of 84% (Mar-25: 80%) were experienced during the year, combined with the lowest ever number of average defects per property, due to our robust in-house quality inspection regime.
Sustainability
In order to deliver for our customers we need to build homes that are highly energy efficient. The average SAP rating, a measure of energy efficiency which is scored out of 100 (with 100 representing a zero-energy cost), for our 1,380 completions was 88.6, an improvement on the previous year (Mar-25: 86.1) and close to achieving an overall average EPC rating of 'A', the highest rating available (EPC A ratings are given for SAP scores of 92 and above). Of all our completions, 31% (426 new homes) had an EPC rating of A (the remainder were 'B'), 43% (597) were completed without gas heating systems and 40% (557) incorporated solar PV.
Shared ownership sales
Platform's exposure to the housing sales market remained limited to sales of the shared ownership product in the year. We saw robust demand for these sales, with strong levels of enquiries and reservations.
There were 481 shared ownership sales recorded against a target of 643 due to delays in handovers, which were affected by delays to third party infrastructure provision outlined above.
Financial review
Turnover
In the year to 31 March 2026 total turnover increased by 2.7% to £384.6m (Mar-25: £374.5m). Social housing lettings turnover increased by 6% to £317.8m (Mar-25: £299.7m), in part due to rental inflationary increases and in part due to a year-on-year increase in social housing homes, with 1,036 new homes completed in the year to March 2025 and a further 1,380 homes in the year to March 2026.
|
At or for the year to March |
|
2025 |
2026 |
|
|
|
|
£m |
£m |
Change |
|
|
|
|
|
|
|
Social housing lettings turnover |
|
299.7 |
317.8 |
6.0% |
|
Shared ownership first tranche sales |
|
48.7 |
40.4 |
-17.0% |
|
Other social housing activities |
|
2.9 |
4.6 |
58.6% |
|
Total social housing turnover |
|
351.3 |
362.8 |
3.3% |
|
Non-social housing activities |
|
23.2 |
21.8 |
-6.0% |
|
Total turnover |
|
374.5 |
384.6 |
2.7% |
Turnover from shared ownership first tranche sales of £40.4m was down on the prior year (Mar-25: £48.7m) due to lower numbers of sales, which were 9% down on the prior year, and lower levels of equity purchased of 28% (Mar-25: 34%). This was mitigated to an extent by higher sales prices, which were 8% higher than the prior year. The number of unsold shared ownership homes at the end of the year was 230 (Mar-25: 84), of which 87 were reserved for purchase.
|
Opening unsold at April 2025 |
84 |
|
New completions |
624 |
|
Transfers from other tenures |
3 |
|
Sales |
(481) |
|
Unsold at March 2026 |
230 |
|
Of which reserved for purchase |
87 |
Turnover from all social housing activities of £362.8m (Mar-25: £351.3m) accounted for 94.3% (Mar-25: 93.8%) of Platform's total turnover in the period.
Operating costs and costs of sale
Total costs increased 7.7% to £297.4m (Mar-25: £276.2m). Operating costs (from both social and non-social activities) increased 12.3% to £262.9m (Mar-25: £234.2m) and costs of sales decreased 17.6% to £34.6m (Mar-25: £42m).
|
At or for the year to March |
|
2025 |
2026 |
|
|
|
|
£m |
£m |
Change |
|
|
|
|
|
|
|
Social housing lettings operating costs |
|
205.1 |
232.0 |
13.1% |
|
Other social housing costs |
|
|
|
|
|
- shared ownership costs of sale |
|
42.0 |
34.6 |
-17.6% |
|
- other social housing operating costs |
|
8.1 |
10.4 |
28.4% |
|
Total social housing costs |
|
255.2 |
276.9 |
8.5% |
|
Other non-social housing operating costs |
|
21.0 |
20.5 |
-2.4% |
|
Total costs |
|
276.2 |
297.4 |
7.7% |
Social housing lettings operating costs make up the majority of costs and these increased by 13.1% to £232m (Mar-25: £205.1m). The increases in costs were driven in part by revenue growth of 6% as new homes came into management, combined with above-inflationary increases in routine maintenance activities.
Shared ownership cost of sales decreased by 17.6%, slightly above related turnover decreases (17%), with sales price growth slightly ahead of associated costs growth, improving margins.
Net Interest costs
Net interest payable and financing costs increased by £3.4m to £55.4m (Mar-25: £52m). This was largely due a £250m sustainable bond (with a coupon of 5.52%), issued in November 2025 and lower interest receivable of £0.7m, net of capitalised interest, which was £1.7m higher than the prior year because of housing developments undertaken and one-off loan breakage costs of £1.3m that were incurred in the prior year due to strategic refinancing.
Surpluses and margins
Maintaining surpluses is a crucial part of our business model. We reinvest 100% of surpluses into enhancing our services, building more homes and improving existing homes. Investment into existing homes has helped to improve the quality and sustainability of homes, as well as customer satisfaction, but has had an adverse effect on surpluses and margins. Operating surpluses and margins are down on the prior year due to this investment, cost challenges in revenue maintenance and some one-off expenses.
Maintenance expenditures have been affected by a clearance of older jobs, which has resulted in more work being carried out by contractors. Damp and condensation mould costs have been high in the year, albeit there are signs that case numbers are beginning to moderate. In addition, void costs have been higher than the prior year, with a higher number of cases and cost per job experienced. Additional costs have also been incurred due to the roll out of Awabs Law in October 2025.
Operating surpluses excluding fixed assets sales of £87.8m were down 11% on the prior year period (Mar-25: £98.6m) and operating surpluses including fixed asset sales decreased by 6.3% to £98.8m (Mar-25: £105.4m). Surpluses from social housing lettings decreased by 9.3% to £85.8m (Mar-25: £94.6m).
Operating margins were 22.7% excluding fixed asset sales (Mar-25: 26.2%), 25.7% including fixed asset sales (Mar-25: 28.2%) and 27% from social housing lettings (Mar-25: 31.6%). The social housing lettings margin of 27% is below the golden rule of 30%. The golden rule will remain in place, with plans to return to that level in the coming years, however, heightened investment and cost pressures will impact margins as we head into the 2026/27 financial year.
Shared ownership sales surpluses were £5.8m (Mar-25: £6.7m), representing 5.9% of total operating surpluses (Mar-25: 6.4%). Sales margins of 14.4% are up on the prior year (Mar-25: 13.8%), supported by robust demand in our areas of operation.
Sales of fixed assets, which include subsequent staircasing sales of shared ownership homes and homes acquired under the 'right to buy' scheme, had surpluses and margins of £11m and 46% (Mar-25: £6.9m / 44%).
The net surplus after tax and pension adjustments was £43m in comparison to £53.4m in the prior year, which was affected by the items outlined above.
|
At or for the year to 31 March |
2025 |
2026 |
||
|
|
Amount |
Margin |
Amount |
Margin |
|
|
£m |
% |
£m |
% |
|
|
|
|
|
|
|
Social housing lettings surplus |
94.6 |
31.6 |
85.8 |
27 |
|
Shared ownership sales surplus |
6.7 |
13.8 |
5.8 |
14.4 |
|
Overall operating surplus(1) |
98.6 |
26.2 |
87.8 |
22.7 |
|
Surplus after tax(2) |
53.4 |
13.5 |
43 |
11.6 |
Notes
(1) Excluding gains on disposal of property, plant and equipment
(2) Excluding pension-related actuarial adjustments
The table below shows a reconciliation of Platform's year-on-year Total Comprehensive Income.
|
|
Income |
Expenditure |
Surplus |
|
|
£m |
£m |
£m |
|
Surplus after tax - March 2025 |
|
|
50.7 |
|
One-off loan breakage costs |
|
|
1.3 |
|
Pension actuarial losses |
|
|
2.7 |
|
Adjusted surplus after tax - March 2025 |
|
|
54.7 |
|
|
|
|
|
|
Social housing lettings turnover |
18.1 |
|
18.1 |
|
Social housing costs: |
|
|
|
|
Repairs and maintenance |
|
(20.6) |
|
|
Management costs |
|
0.2 |
|
|
Depreciation |
|
(3.8) |
|
|
Service costs |
|
(2.5) |
|
|
Impairment |
|
(1.2) |
|
|
Rent Losses from Bad Debts |
|
1.0 |
|
|
|
|
|
(26.9) |
|
Property sales(1) |
(8.3) |
7.4 |
(0.9) |
|
Gains on disposal of property, plant and equipment |
8.6 |
(4.4) |
4.2 |
|
Other social housing activities |
1.7 |
(2.3) |
(0.6) |
|
Non-social housing activities |
(1.4) |
0.5 |
(0.8) |
|
Net interest costs |
(0.7) |
(5.8) |
(6.5) |
|
Capitalised interest |
|
1.7 |
1.7 |
|
Tax |
|
(0.4) |
(0.4) |
|
Other |
|
|
0.4 |
|
Surplus after tax before one-off charges - March 2026 |
|
|
43.0 |
|
Pension actuarial gains |
1.6 |
|
1.6 |
|
Surplus after tax - March 2026 |
|
|
44.6 |
Notes
(1) Property sales consist of shared ownership first tranche sales
Treasury review
Funding activity
Platform completed a £100m revolving credit facility in March 2026, helping to strengthen medium-term liquidity. At the same time, facilities of £225m were restructured in order to modernise terms and improve the cost of borrowing. Under the restructure, maturity dates have been shortened and a one-off break gain of £5.9m recognised, which will be amortised over the remaining life of the debt. This funding complemented the £250m sustainable bonds issued in November 2025, which achieved a record sector-low spread to gilts for an own named bond issue. The bonds have a maturity of 14 years and a coupon of 5.52%.
Ratings activity
Platform is rated A+ (negative outlook) by both S&P and Fitch. The rating with Fitch was affirmed in October 2025. The rating with S&P was affirmed in January 2026 and the outlook was updated to 'negative' at the same time (formerly 'stable'), due to S&P's assessment of potential future cost pressures.
Debt and liquidity
Net debt was £1,689m (Mar-25: £1,526m). Net debt comprised nominal values of £1,370m in bond issues, £80m in private placements and £379m in term loan and revolving credit facilities, partially offset by cash and equivalents of £130m and non-cash accounting adjustments of £10m.
Platform's weighted average cost of finance was 3.81% (Mar-25: 3.56%). The increase on the prior year is largely due to the £250m 5.52% sustainable bond issued in November 2025.
Liquidity at quarter four was £630m, including undrawn committed facilities, short term investments and cash and cash equivalents, which is sufficient to meet all forecast needs until into 2027 (with new finance required at that point to maintain 18 months of liquidity in line with policy).
Financial ratios
Platform monitors its performance against various financial ratios, including Value for Money (VfM) Metrics reported to the Regulator of Social Housing (the Regulator) and ratios it is required to comply with under its financing arrangements. The narrative below outlines performance against Platform's funding arrangements.
Gearing, measured as the ratio of net debt to the gross book value of housing properties, was 40.4% (Mar-25: 40.2%). Gearing has remained broadly static in the last year as further borrowing has been balanced with capital expenditures net of operating, grant and sales revenues.
EBITDA-MRI interest cover was 149% (Mar-25: 169%). The year-on-year movement is driven by a planned increase in investment into existing homes, cost pressures on revenue maintenance as outlined above, and increased interest expense due to financing activities.
Review of value for money (VfM) performance
Obtaining VfM ensures Platform make the best use of resources and is an essential part of delivering its charitable objectives. Platform assesses its performance against the Regulator of Social Housing in England's VfM metrics for the year in the context of a group of other comparable social housing providers. This analysis is helpful as these metrics are defined by the regulator and reported across the sector, providing a greater degree of comparability.
Peer group information is not available for the period to 31 March 2026, so a comparison against the year to March 2025 has been undertaken. The 13 peers included in the analysis are set out in the footnotes to the table.
|
|
Peer Group |
Platform |
||||
|
RSH VfM metric1/2 |
Lowest |
Average3 |
Highest |
Mar-25 |
Rank4 |
Mar-26 |
|
|
|
|
|
|
|
|
|
Reinvestment |
3.9% |
8.4% |
10.8% |
10.1% |
4 |
10.4% |
|
New supply (social housing units) |
0.9% |
2.0% |
2.8% |
2.1% |
7 |
2.8% |
|
New supply (non-social housing units)5 |
0.0% |
0.1% |
0.3% |
0.0% |
1 |
0.0% |
|
Gearing |
27.2% |
46.3% |
52.6% |
44.2% |
5 |
45.1% |
|
EBITDA-MRI interest cover |
-33% |
95% |
193% |
143% |
3 |
108% |
|
Headline social housing CPU6 |
4,573 |
5,458 |
6,998 |
4,777 |
4 |
5,160 |
|
Operating margin (SHL)6 |
15.0% |
24.4% |
33.0% |
31.6% |
2 |
27% |
|
Operating margin (total) |
9.4% |
20.4% |
30.0% |
26.2% |
3 |
22.7% |
|
Return on capital employed |
1.7% |
3.0% |
4.8% |
3.0% |
6 |
2.5% |
Notes
(1) Sample of social housing providers includes Platform, Bromford-Flagship, Citizen, East Midlands Housing, Green Square Accord, Guinness, Home Group, Jigsaw, Longhurst, Midland Heart, Orbit, Sanctuary, Stonewater and Walsall Housing. We may evolve the make-up of the sample in future.
(2) See: https://www.gov.uk/government/publications/value-for-money-metrics-technical-note
(3) Unweighted or simple average of performance across the selected group of social housing providers
(4) Platform ranking is based on performance against peers as reported in the year to March 2025
(5) A low focus on building non-social housing is viewed as giving a strong ranking due to property market risks related with such activities
(6) CPU: cost per unit; SHL: social housing lettings
Our VfM strategy continues to underpin our Corporate Strategy. VfM is driven through a suite of strategies and business processes that work together to help us invest in our business, customers, colleagues and communities in a way that delivers maximum positive impact and demonstrable value for money.
The Board recognises its responsibility for taking a comprehensive approach to VfM that achieves continuous improvement in Platform's performance on running costs and the use of our assets. This continues to be particularly difficult due to the competing challenges of improving our homes and services to customers whilst absorbing increasing costs. The current geo-political environment creates more uncertainty and means we must be more vigilant in how we allocate our resources.
Investing in quality, affordable and sustainable homes is a key component of our Corporate Strategy. This is reflected in our rates of reinvestment, which remained high at 10.4% (Mar-25: 10.1%). It is also seen in our levels of completions, which increased to 2.8% of total stock (Mar-25: 2.1%).
Cost pressures outlined further up in this report have affected our EBITDA-MRI interest cover ratio, margins and social housing cost per unit.
We continue to have no exposure to the outright sales market, other than through our affordable 'shared ownership' product.
Outlook
Platform remains committed to operating in a prudent manner, maintaining financial strength whilst investing in customer services, existing homes and the development of new housing. The Group will be monitoring the change in leadership for the UK Government, together with conflict in the Middle-East and is well placed to weather what is a very uncertain landscape.
In the coming year turnover is expected to grow in line with rental increases of 4.8% (set at September 2025 UK consumer price index plus one per cent) and new units coming into management. Operating costs are expected to be affected by continued investment into our services and the quality and sustainability of our homes. This will impact social housing cost per unit and interest cover, and some margin pressures will mean we do not expect to achieve our 30% margin target for social housing lettings activity.
Our development pipeline for the coming year is expected to continue at pace, with completions reflecting two years of starts totalling over 3,000. Given the long-term strategic nature of our business, we are beginning to work on the longer-term pipeline, securing an interest in sites that will deliver completions in the medium term, with our early involvement and lead role ensuring influence and control over design and quality. The announcement by Homes England relating to the re-profiling of grant allocations for the 2026-2036 Affordable Homes Programme will, however, impact the pace at which we can deliver new housing.
There are currently signs that unfavourable economic conditions are beginning to affect demand for shared ownership homes. Higher interest rates and the cost-of-living squeeze may have a detrimental impact on owner occupier housing demand going forwards, affecting sales volumes and margins. The shared ownership product (which Platform is principally exposed to) is a sub-set of housing that has its own demand drivers, including buyers migrating from outright sales when affordability is stressed, which may help mitigate sales market pressures as we move forwards.
In the longer term our resilient, low-risk financial and operating model leaves us well placed to continue delivering our strategic objectives, centred on the provision and maintenance of high quality, affordable and sustainable housing, alleviating the Midlands housing shortage and providing enhanced life prospects for more local people.
Financial Statements
Legal Status
Platform Housing Group (the parent company) is incorporated in England under the Co-operative and Community Benefit Societies Act 2014 and is registered with the RSH as a Private Registered Provider of Social Housing. The registered office is 1700 Solihull Parkway, Birmingham Business Park, Solihull, B37 7YD.
Platform Housing Group comprises the following entities:
|
Name |
Incorporation |
Registration |
|
Platform Housing Group Limited |
Co-operative and Community Benefit Societies Act 2014 |
Registered |
|
Platform Housing Limited |
Co-operative and Community Benefit Societies Act 2014 |
Registered |
|
Platform Property Care Limited |
Companies Act 2006 |
Non-registered |
|
Platform New Homes Limited |
Companies Act 2006 |
Non-registered |
|
Platform HG Financing PLC |
Companies Act 2006 |
Non-registered |
|
Waterloo Homes Limited (Dormant) |
Companies Act 2006 |
Non-registered |
Basis of Accounting
The Group's financial statements have been prepared in accordance with applicable United Kingdom Accounting Generally Accepted Accounting Practice (UK GAAP), the Statement of Recommended Practice for registered housing providers: Housing SORP 2018 Update and Financial Reporting Standard 102 ('FRS 102'). Platform Housing Group is a Public Benefit Entity under the requirements of FRS 102. The Group is required under the Co-operative and Community Benefit Societies (Group Accounts) Regulations 1969 to prepare consolidated Group accounts.
The financial statements comply with the Co-operative and Community Benefit Societies Act 2014, the Co-operative and Community Benefit Societies (Group Accounts) Regulations 1969, the Housing and Regeneration Act 2008 and the Accounting Direction for Private Registered Providers of Social Housing 2022. Following the implementation of FRS 102, housing properties are stated at deemed cost at the date of transition and additions are recorded at cost. Investment properties are recorded at valuation. The accounts are presented in sterling and are rounded to the nearest £1,000.
As a Public Benefit Entity, The Group has applied the 'PBE' prefixed paragraphs of FRS102.
Statement of Comprehensive Income for the year ended 31 March 2026
|
|
|
2026 |
2025 |
|
|
|
Note |
£000 |
£000 |
|
|
|
|
|
|
|
|
Turnover |
1&2 |
384,161 |
374,464 |
|
|
|
|
|
|
|
|
Operating Expenditure |
1&2 |
(262,857) |
(234,276) |
|
|
Cost of Sales |
1&2 |
(34,568) |
(41,953) |
|
|
Gain on disposal of property, plant and equipment |
|
11,026 |
6,854 |
|
|
Increase in valuation of investment properties |
|
577 |
347 |
|
|
|
|
|
|
|
|
Operating Surplus |
|
98,789 |
105,436 |
|
|
|
|
|
|
|
|
Interest receivable |
4 |
4,004 |
4,677 |
|
|
Interest payable and financing costs |
4 |
(59,416) |
(56,654) |
|
|
|
|
|
|
|
|
Surplus before tax |
|
43,377 |
53,459 |
|
|
|
|
|
|
|
|
Taxation |
|
(375) |
(102) |
|
|
|
|
|
|
|
|
Surplus for the year after tax |
|
43,002 |
53,357 |
|
|
|
|
|
|
|
|
Actuarial gain in respect of pension schemes |
|
1,631 |
(2,658) |
|
|
|
|
|
|
|
|
Total comprehensive income for the year |
|
44,633 |
50,699 |
|
The Group's results all relate to continuing activities.
Statement of Financial Position at 31 March 2026
|
|
|
2026 |
2025 |
|
|
|
Note |
£000 |
£000 |
|
|
Fixed assets |
|
|
|
|
|
Housing properties |
5 |
3,746,965 |
3,461,915 |
|
|
Other tangible fixed assets |
|
36,320 |
25,440 |
|
|
Intangible fixed assets |
|
17,710 |
13,913 |
|
|
Investment properties |
|
18,257 |
17,680 |
|
|
Homebuy loans receivable |
|
6,546 |
6,967 |
|
|
Fixed asset investments |
|
18,740 |
20,231 |
|
|
Investment in subsidiaries |
|
- |
- |
|
|
|
|
3,844,538 |
3,546,146 |
|
|
Current assets |
|
|
|
|
|
Stocks: Housing properties for sale |
|
52,918 |
39,516 |
|
|
Stocks: Other |
|
632 |
412 |
|
|
Trade and other Debtors |
|
20,133 |
17,473 |
|
|
Cash and cash equivalents |
|
130,385 |
48,144 |
|
|
|
|
204,068 |
105,545 |
|
|
|
|
|
|
|
|
Less: Creditors: amounts falling due within one year |
|
(108,826) |
(109,677) |
|
|
|
|
|
|
|
|
Net current (liabilities)/assets |
|
95,242 |
(4,132) |
|
|
|
|
|
|
|
|
Total assets less current liabilities |
|
3,939,780 |
3,542,014 |
|
|
|
|
|
|
|
|
Creditors: amounts falling due after more than one year |
|
(2,690,918) |
(2,333,577) |
|
|
|
|
|
|
|
|
Provisions for liabilities |
|
|
|
|
|
Pension provision |
|
(5,891) |
(10,099) |
|
|
|
|
|
|
|
|
Total net assets |
|
1,242,971 |
1,198,338 |
|
|
|
|
|
|
|
|
Reserves |
|
|
|
|
|
Non-equity share capital |
|
- |
- |
|
|
Income and expenditure reserve |
|
1,027,416 |
982,376 |
|
|
Revaluation reserve |
|
215,555 |
215,962 |
|
|
Total reserves |
|
1,242,971 |
1,198,338 |
|
Consolidated Statement of Changes in Reserves
|
|
Income and Expenditure Reserve |
Property Revaluation Reserve |
Investment Revaluation Reserve |
Total |
|
|
£000 |
£000 |
£000 |
£000 |
|
|
|
|
|
|
|
Balance at 1 April 2024 |
931,507 |
216,132 |
101 |
1,147,740 |
|
Surplus for the year |
53,357 |
- |
- |
53,357 |
|
Actuarial loss on pension scheme |
(2,658) |
- |
- |
(2,658) |
|
Valuation in the year |
- |
- |
(101) |
(101) |
|
Transfer between reserves |
170 |
(170) |
- |
- |
|
|
|
|
|
|
|
Balance at 31 March 2025 |
982,376 |
215,962 |
- |
1,198,338 |
|
|
|
|
|
|
|
Surplus for the year |
43,002 |
- |
- |
43,002 |
|
Actuarial gain on pension scheme |
1,631 |
- |
- |
1,631 |
|
Valuation in the year |
- |
- |
- |
- |
|
Transfer between reserves |
407 |
(407) |
- |
- |
|
|
|
|
|
|
|
Balance at 31 March 2026 |
1,027,416 |
215,555 |
- |
1,242,971 |
Consolidated Statement of Cash Flows for the year ended 31 March 2026
|
|
2026 |
|
2025 |
|
|
£000 |
|
£000 |
|
|
|
|
|
|
Net cash generated from operating activities (see note i below) |
118,117 |
|
159,108 |
|
|
|
|
|
|
Cash flow from investing activities |
|
|
|
|
Purchase of tangible and intangible fixed assets |
(353,595) |
|
(319,132) |
|
Proceeds from sales of tangible fixed assets |
24,063 |
|
13,996 |
|
Grants received |
111,615 |
|
124,236 |
|
Interest received |
3,054 |
|
3,824 |
|
Homebuy and Festival Property Purchase loans repaid |
421 |
|
304 |
|
|
|
|
|
|
Cash flow from financing activities |
|
|
|
|
Interest paid |
(59,554) |
|
(54,062) |
|
New secured loans |
343,000 |
|
250,000 |
|
Repayment of borrowings |
(104,800) |
|
(160,946) |
|
|
|
|
|
|
Corporation tax paid |
(80) |
|
- |
|
|
|
|
|
|
Net change in cash and cash equivalents |
82,241 |
|
17,328 |
|
|
|
|
|
|
Cash and cash equivalents at the beginning of the year |
48,144 |
|
30,816 |
|
Cash and cash equivalents at the end of the year |
130,385 |
|
48,144 |
|
|
|
|
|
|
Note i |
|
|
|
|
Surplus for the year |
43,377 |
|
53,459 |
|
|
|
|
|
|
Adjustments for non-cash items |
|
|
|
|
Depreciation of tangible fixed assets |
50,792 |
|
46,624 |
|
Amortisation of grants |
(7,674) |
|
(5,727) |
|
Impairment losses |
1,224 |
|
- |
|
Movement in properties and other assets in the course of sale |
(13,402) |
|
10,572 |
|
(Increase)/decrease in stock |
(220) |
|
(171) |
|
(Increase)/decrease in trade and other debtors |
(2,651) |
|
5,839 |
|
Increase/(decrease) in trade and other creditors |
1,778 |
|
5,120 |
|
Movement in investments |
1,491 |
|
(800) |
|
|
|
|
|
|
Adjustments for investing or financing activities |
|
|
|
|
Surplus from sale of tangible fixed assets |
(11,026) |
|
(7,168) |
|
Interest payable |
59,416 |
|
56,654 |
|
Interest receivable |
(4,004) |
|
(4,677) |
|
Movement in fair value of financial instruments |
(407) |
|
(270) |
|
Increase in valuation of investment property |
(577) |
|
(347) |
|
|
|
|
|
|
Net cash generated from operating activities |
118,117 |
|
159,108 |
1. Turnover, Cost of Sales, Operating Expenditure and Operating Surplus
|
Group |
Year ended 31 March 2026 |
|||
|
|
Turnover |
Cost of Sales |
Operating Expenditure |
Operating Surplus / (Deficit) |
|
|
£000 |
£000 |
£000 |
£000 |
|
|
|
|
|
|
|
Social housing lettings |
317,839 |
- |
(232,011) |
85,828 |
|
|
|
|
|
|
|
Other social housing activities |
|
|
|
|
|
Development services |
- |
- |
(6,793) |
(6,793) |
|
Management services |
183 |
- |
(484) |
(301) |
|
Support services |
398 |
- |
(357) |
41 |
|
Sale of Shared Ownership first tranche |
40,363 |
(34,568) |
- |
5,795 |
|
Other |
4,044 |
- |
(2,736) |
1,308 |
|
|
44,988 |
(34,568) |
(10,370) |
50 |
|
|
|
|
|
|
|
Activities other than social housing |
|
|
|
|
|
Developments for sale |
- |
- |
- |
- |
|
Student accommodation |
- |
- |
(6) |
(6) |
|
Market rents |
951 |
- |
(306) |
645 |
|
Other |
20,833 |
- |
(20,164) |
669 |
|
|
21,784 |
- |
(20,476) |
1,308 |
|
|
|
|||
|
|
|
|
|
|
|
Total |
384,611 |
(34,568) |
(262,857) |
87,186 |
|
Gain on disposal of property, plant and equipment |
|
11,026 |
|
Increase in valuation of investment properties |
|
577 |
|
Operating Surplus |
|
98,789 |
1. Turnover, Cost of Sales, Operating Expenditure and Operating Surplus (continued)
|
Group |
Year ended 31 March 2025 |
|||
|
|
Turnover |
Cost of Sales |
Operating Expenditure |
Operating Surplus / (Deficit) |
|
|
£000 |
£000 |
£000 |
£000 |
|
|
|
|
|
|
|
Social housing lettings |
299,749 |
- |
(205,170) |
94,579 |
|
|
|
|
|
|
|
Other social housing activities |
|
|
|
|
|
Development services |
- |
- |
(5,662) |
(5,662) |
|
Management services |
126 |
- |
(1,028) |
(902) |
|
Support services |
415 |
- |
(887) |
(472) |
|
Sale of Shared Ownership first tranche |
48,671 |
(41,953) |
- |
6,718 |
|
Other |
2,340 |
- |
(516) |
1,824 |
|
|
51,552 |
(41,953) |
(8,093) |
1,506 |
|
|
|
|
|
|
|
Activities other than social housing |
|
|
|
|
|
Developments for sale |
- |
- |
- |
- |
|
Student accommodation |
- |
- |
(7) |
(7) |
|
Market rents |
935 |
- |
(696) |
239 |
|
Other |
22,228 |
- |
(20,310) |
1,918 |
|
|
|
|
|
|
|
|
23,163 |
- |
(21,013) |
2,150 |
|
|
|
|
|
|
|
Total |
374,464 |
(41,953) |
(234,276) |
98,235 |
2. Turnover and Operating Expenditure for Social Housing Lettings
|
|
Year ended 31 March 2026
|
|||||
|
|
General Needs Housing |
Affordable Rent |
Supported Housing & Housing for older people |
Low Cost Home Ownership |
Intermediate rent |
Total |
|
|
£000 |
£000 |
£000 |
£000 |
£000 |
£000 |
|
Income |
|
|
|
|
|
|
|
Rent receivable net of identifiable service charges |
172,030 |
64,415 |
17,107 |
30,315 |
3,148 |
287,015 |
|
Service charge income |
7,887 |
2,064 |
7,558 |
5,001 |
1 |
22,511 |
|
Other grants |
1,056 |
228 |
3 |
51 |
- |
1,338 |
|
Amortised government grants |
3,023 |
2,322 |
230 |
1,366 |
34 |
6,975 |
|
Other income |
- |
- |
- |
- |
- |
- |
|
Turnover from social housing lettings |
183,996 |
69,029 |
24,898 |
36,733 |
3,183 |
317,839 |
|
|
|
|
|
|
|
|
|
|
|
|
|
|
|
|
|
Management |
(21,486) |
(7,021) |
(4,985) |
(5,281) |
(570) |
(39,343) |
|
Service charge costs |
(16,762) |
(4,265) |
(11,501) |
(5,097) |
(569) |
(38,194) |
|
Routine maintenance |
(59,463) |
(13,970) |
(6,483) |
(549) |
(776) |
(81,241) |
|
Planned maintenance |
(7,621) |
(1,994) |
(723) |
(28) |
(59) |
(10,425) |
|
Major repairs expenditure |
(4,538) |
(6,631) |
(2,945) |
(96) |
(301) |
(14,511) |
|
Bad debts |
(529) |
(153) |
(99) |
(27) |
(42) |
(850) |
|
Depreciation of housing properties |
(26,501) |
(12,160) |
(2,627) |
(4,256) |
(679) |
(46,223) |
|
Impairment of housing properties |
(910) |
(314) |
- |
- |
- |
(1,224) |
|
Operating expenditure on social housing lettings |
(137,810) |
(46,508) |
(29,363) |
(15,334) |
(2,996) |
(232,011) |
|
|
|
|
|
|
|
|
|
Operating surplus on social housing lettings |
46,186 |
22,521 |
(4,465) |
21,399 |
187 |
85,828 |
|
|
|
|
|
|
|
|
|
Void losses |
(2,923) |
(770) |
(642) |
(915) |
(159) |
(5,409) |
2. Turnover and Operating Expenditure for Social Housing Lettings (continued)
|
|
Year ended 31 March 2025
|
|||||
|
|
General Needs Housing |
Affordable Rent |
Supported Housing & Housing for older people |
Low Cost Home Ownership |
Intermediate rent |
Total |
|
|
£000 |
£000 |
£000 |
£000 |
£000 |
£000 |
|
Income |
|
|
|
|
|
|
|
Rent receivable net of identifiable service charges |
166,205 |
59,041 |
17,052 |
27,044 |
3,106 |
272,448 |
|
Service charge income |
7,647 |
1,949 |
7,353 |
3,725 |
- |
20,674 |
|
Other grants |
- |
- |
- |
- |
- |
- |
|
Amortised government grants |
2,828 |
1,667 |
227 |
947 |
30 |
5,699 |
|
Other income |
716 |
159 |
2 |
51 |
- |
928 |
|
Turnover from social housing lettings |
177,396 |
62,816 |
24,634 |
31,767 |
3,136 |
299,749 |
|
|
|
|
|
|
|
|
|
|
|
|
|
|
|
|
|
Management |
(22,520) |
(6,489) |
(5,221) |
(4,816) |
(485) |
(39,531) |
|
Service charge costs |
(15,372) |
(4,162) |
(11,043) |
(4,667) |
(470) |
(35,714) |
|
Routine maintenance |
(46,614) |
(11,441) |
(5,096) |
(474) |
(604) |
(64,229) |
|
Planned maintenance |
(7,523) |
(2,132) |
(599) |
(101) |
(114) |
(10,469) |
|
Major repairs expenditure |
(8,200) |
(1,776) |
(710) |
(109) |
(95) |
(10,890) |
|
Bad debts |
(1,119) |
(384) |
(174) |
(120) |
(47) |
(1,844) |
|
Depreciation of housing properties |
(23,623) |
(11,315) |
(2,590) |
(4,186) |
(716) |
(42,430) |
|
Impairment of housing properties |
- |
(63) |
- |
- |
- |
(63) |
|
Operating expenditure on social housing lettings |
(124,971) |
(37,762) |
(25,433) |
(14,473) |
(2,531) |
(205,170) |
|
|
|
|
|
|
|
|
|
Operating surplus on social housing lettings |
52,426 |
25,054 |
(799) |
17,294 |
605 |
94,579 |
|
|
|
|
|
|
|
|
|
Void losses |
(2,553) |
(695) |
(686) |
(767) |
(94) |
(4,795) |
3. Units
Social housing properties in management at end of period
|
|
2026 |
2025 |
|||||
|
|
Owned and managed |
Managed not owned |
Total managed |
Owned not managed |
Total Owned |
Total Managed |
Total Owned |
|
|
Number |
Number |
Number |
Number |
Number |
Number |
Number |
|
General Needs |
29,753 |
13 |
29,766 |
- |
29,753 |
29,029 |
29,022 |
|
Affordable rent |
9,012 |
- |
9,012 |
- |
9,012 |
8,598 |
8,598 |
|
Supported |
578 |
- |
578 |
112 |
690 |
550 |
615 |
|
Housing for older people |
2,169 |
- |
2,169 |
- |
2,169 |
2,706 |
2,706 |
|
Intermediate rent |
540 |
- |
540 |
- |
540 |
488 |
488 |
|
Total |
42,052 |
13 |
42,065 |
112 |
42,164 |
41,371 |
41,429 |
|
|
|
|
|
|
|
|
|
|
*Shared Ownership <100% |
7,484 |
- |
7,484 |
- |
7,484 |
7,001 |
6,995 |
|
Social Leased @100% sold |
1,190 |
- |
1,190 |
20 |
1,210 |
1,158 |
1,158 |
|
Total social |
50,726 |
13 |
50,739 |
132 |
50,858 |
49,530 |
49,582 |
|
|
|
|
|
|
|
|
|
|
Non-social housing |
|
|
|
|
|
|
|
|
Non-social rented |
111 |
- |
111 |
- |
111 |
111 |
111 |
|
Non-social leased |
397 |
- |
397 |
- |
397 |
401 |
401 |
|
|
|
|
|
|
|
|
|
|
Total stock |
51,234 |
13 |
51,247 |
132 |
51,366 |
50,042 |
50,094 |
1The equity proportion of a shared ownership property is counted as one unit.
4. Net Interest
|
Interest receivable and similar income |
2026 |
|
2025 |
|
||
|
|
£000 |
|
£000 |
|
||
|
On financial assets measured at amortised cost: |
|
|
|
|
||
|
Interest receivable |
4,004 |
|
4,677 |
|
||
|
|
|
|
|
|
||
|
|
4,004 |
|
4,677 |
|
||
|
Interest payable and financing costs |
|
|
|
|||
|
|
|
|
|
|||
|
On financial liabilities measured at amortised cost: |
|
|
|
|||
|
Loans repayable |
63,505 |
|
57,675 |
|||
|
Loan breakage costs |
(24) |
|
1,277 |
|||
|
Costs associated with financing |
3,695 |
|
3,778 |
|||
|
|
67,176 |
|
62,730 |
|||
|
On defined benefit pension scheme: |
|
|
|
|||
|
Expected return on plan assets |
(2,431) |
|
(2,201) |
|||
|
Interest on scheme liabilities |
2,899 |
|
2,609 |
|||
|
|
468 |
|
408 |
|||
|
On financial liabilities measured at fair value: |
|
|
|
|||
|
Interest capitalised on housing properties |
(8,228) |
|
(6,484) |
|||
|
|
|
|
|
|||
|
|
59,416 |
|
56,654 |
|||
5. Tangible Fixed Assets - Housing Properties
|
|
Housing Properties held for letting |
Housing Properties in the course of construction |
Completed Shared Ownership Properties |
Shared Ownership Properties in the course of construction |
Total |
|
|
£000 |
£000 |
£000 |
£000 |
£000 |
|
Cost |
|
|
|
|
|
|
At 1 April 2025 |
2,890,451 |
287,494 |
658,591 |
69,088 |
3,905,624 |
|
Additions |
77 |
165,380 |
274 |
154,691 |
320,422 |
|
Works to existing properties |
62,167 |
- |
- |
- |
62,167 |
|
Disposals |
(10,348) |
- |
(9,191) |
- |
(19,539) |
|
Fair value disposal |
(103) |
- |
- |
- |
(103) |
|
Transfer (to)/from current assets |
- |
- |
559 |
(47,029) |
(46,470) |
|
Interest capitalised |
-
|
4,264 |
- |
3,964 |
8,228 |
|
Schemes completed |
165,870 |
(165,870) |
119,214 |
(119,214) |
- |
|
At 31 March 2026 |
3,108,114 |
291,268 |
769,447 |
61,500 |
4,230,329 |
|
|
|
|
|
|
|
|
Depreciation |
|
|
|
|
|
|
At 1 April 2025 |
412,407 |
- |
31,302 |
- |
443,709 |
|
Charge for the year |
40,738 |
- |
4,135 |
- |
44,873 |
|
Impairment |
1,216 |
- |
- |
- |
1,216 |
|
Disposals |
(6,132) |
- |
(302) |
- |
(6,434) |
|
At 31 March 2026 |
448,229 |
- |
35,135 |
- |
483,364 |
|
|
|
|
|
|
|
|
Net Book Value |
|
|
|
|
|
|
At 31 March 2026 |
2,659,885 |
291,268 |
734,312 |
61,500 |
3,746,965 |
|
|
|
|
|
|
|
|
At 31 March 2025 |
2,478,044 |
287,494 |
627,289 |
69,088 |
3,461,915 |
RNS may use your IP address to confirm compliance with the terms and conditions, to analyse how you engage with the information contained in this communication, and to share such analysis on an anonymised basis with others as part of our commercial services. For further information about how RNS and the London Stock Exchange use the personal data you provide us, please see our Privacy Policy.

Latest directors dealings
- 3 minutes ago Gresham House Energy Storage Fund
- 6 minutes ago Ashmore Group
- 9 minutes ago Ashmore Group
- 33 minutes ago St James's Place
- 36 minutes ago St James's Place