Bido Drilling Results
Summary by AI BETAClose X
The information contained within this announcement is deemed by the Company to constitute inside information as stipulated under the UK Market Abuse Regulation
19 January 2026
Panthera Resources Plc
("Panthera" or "the Company")
Bido Drilling Results
Gold exploration and development company Panthera Resources Plc (AIM:PAT), with assets in West Africa and India, is pleased to announce that positive results have been returned for Reverse Circulation ("RC") drilling samples from the Bido Project in Burkina Faso. This RC drilling took place in the second half of 2025 as announced on 18 July 2025, and represented limited, shallow testing of a total of 5 targets. The delay in the final release of information has been due to a combination of weather delays during the wet season and several iterations of re-verifying assays using the Photon Assay technique, as described below.
Highlights
· Maiden exploration drilling programme at Kwademen has confirmed historical zones of gold mineralisation
· Targets 1 and 2
o KWD25-RC-001
§ 12m @ 0.2 g/t Au from surface
§ 18m @ 0.54 g/t Au from 72m
§ 2m sample loss from 78m
§ 1m @ 6.57 g/t Au from 80m
§ 1m @ 0.73 g/t Au from 81m
o KWD25-RC-017
§ 10m @ 0.72 g/t Au from surface
§ 5m @ 4.95 g/t Au from 35m
§ 1m @ 19.2 g/t Au from 36m
o KWD25-RC-003 intersected 24m @ 0.61 g/t from 26m including
§ 1m @ 8.25 g/t Au from 26m
§ 1m @ 3.41 g/t Au from 37m
· Target 5
o KWD25-RC-014A intersected 4m @ 2.52 g/t Au from 34m including
§ 1m @ 3.94 g/t Au from 34m
§ 1m @ 5.38 g/t Au from 35m
Commenting on the results, Mark Bolton, Managing Director of Panthera said:
"The maiden drilling programme by Panthera at the Kwademen prospect has delivered outstanding high-grade intersections within several broad zones of mineralisation that remain open in multiple directions. This bodes well in a strong, rising gold price environment."
About the Bido Project
The Company has now completed the earn-in obligations at Bido in Burkina Faso and owns an 80% interest in the project. The Company may acquire the remaining 20% by expenditure of a further US$1,000,000 on exploration and development within two years, subject to the vendor's rights of a buy-back right of 1% interest in the Tenements and Associated Rights for the price of US$1,000,000. A royalty will be payable to the vendor on all minerals produced by exercise of rights under the Tenements which shall be calculated at the rate of 1% of the net smelter returns (NSR) on all minerals extracted from the Properties pursuant to the Tenements, inclusive of any withholding tax (if any) payable in respect of those royalties and shall be paid quarterly. Payments via the NSR will be capped at US$3 million in total.
The Bido permit in Burkina Faso (Figure 1) is located some 125km WSW of the capital Ouagadougou. The tenement lies within the Boromo greenstone belt which is principally composed of Paleoproterozoic Birimian terrain within the West African Man Craton. This belt also hosts the Poura gold deposit (1 to 2 Moz), situated about 50 km to the SSW of the area, as well as numerous gold occurrences. The Perkoa VMS deposit is located about 35 km to the north of the area.
The Kwademen Prospect (Figure 1) was originally identified from an analysis of historical data from exploration undertaken in the 1980s, culminating in trenching and diamond drilling. This work was undertaken by BUVOGMI, the national geological service of Haute Volta (former name of Burkina-Faso) under financing of the United Nations Development Program (UNDP). It targeted base metals and gold.
In that early historical work several interesting intervals were intersected in different holes which were not followed up at the time, we understand for different reasons, among which the more plausible is the ending of the financing of the UNDP program. Exploration was then on 'ice' until resumed in 2014 when Panthera's joint-venture partner attracted foreign interest in further exploration.
The company's experienced in-country and international geological team have completed systematic geological mapping, data compilation, geochemical and geophysical surveys and interpretation of the database to identify drill targets, some of which represent the priority targets in this round of exploration drilling.
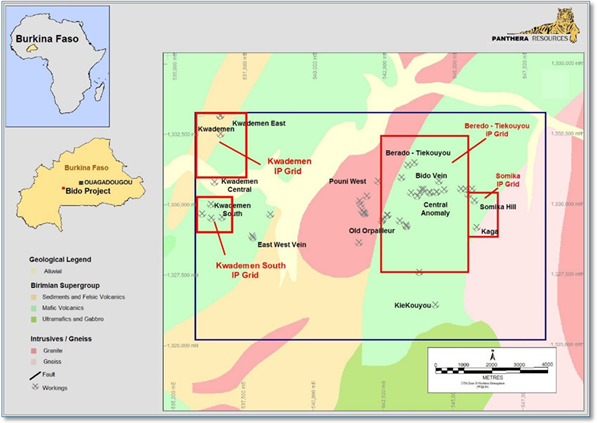
Figure 1: Bido Project Location, Prospects and Geophysical Survey Grid Locations
Drilling Programme
An RC drilling program targeting the Kwademen prospect has been completed with 19 holes completed for 1858.9 metres advance which includes several re-drilled holes where original holes had to be abandoned due to weather and drilling equipment issues. Drilling conditions were hard due to the advanced stage of the rainy season and its particular wetness in 2025, with some holes encountering strong underground water ingress. This, combined with equipment failure and constraints, led to a very delayed completion of drilling.
The Kwademen prospect is located on the north-western part of the Bido tenement limits (Figure 1). Panthera Resources started exploration work on the area doing compilation work followed by soil sampling in 2018. The soil sampling program consisted of sampling on east-west lines spaced of 200 m with sampling repeated at 50m interval on each line. An Induced Polarized (IP) survey was conducted in 2023 and consisted of a gradient survey exploring the ground at a relatively constant depth of 50m followed by a Pole-Dipole survey on some selected lines to help determining the depth of the anomalies identified by gradient as long as determining the dip of the chargeable structures. More recently and prior to the finalisation of this proposal for drilling, a program of systematic mapping of all orpailleurs shafts and areas of eluvial workings was completed.
A plan showing the location of the drilling and targets is shown in Figure 2 below, where Targets 1 to 5 are represented as Lines 1 to 5.
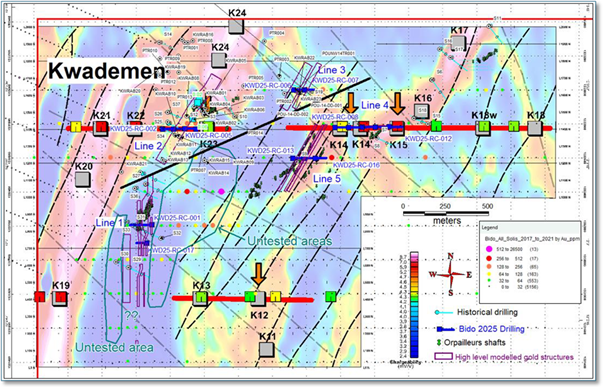
Figure 2: Plan View of the drilling at the Kwademen prospect
Drilling Results
Based on the results of the 2m samples analysis (analysed at SGS Laboratory in Ouagadougou by a Fire Assay of a 50gm aliquot) received best results of the drilling program are summarized in Table 1 below. The intervals were re-assayed at 1 metre split intervals, also provided in Table 1.
The Company had concern that the potential for nuggety gold may occur in some of the intersections and elected to re-assay the 1m splits using the PhotonAssay method as provided by Intertek in Ghana, the intervals are also provided in Table 1. The method analyses a 500gm split using sample irradiation (reference - PhotonAssay - Chrysos Corporation ) the method involves "hitting samples with high-energy X-rays, Chrysos PhotonAssay™ technology causes excitation of atomic nuclei allowing enhanced analysis of gold, silver, copper and other elements in as little as two minutes". The Company completed a comparison of the analytical methods and found that no significant grade variations occurred (see Chart 1 and Table 1 below).
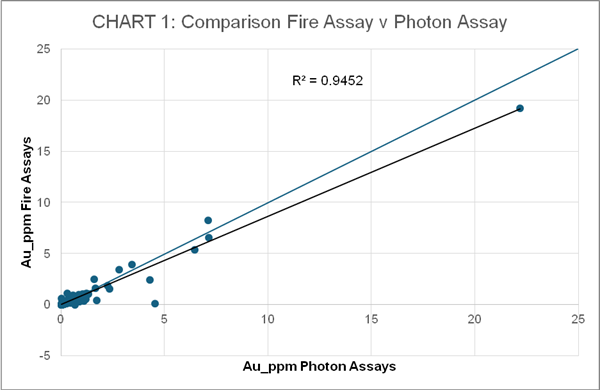
Table 1: Best results of the 2025 drilling program
|
HOLE |
2 m splits (Fire Assay) best intercepts |
Re-assay (Fire Assay) at 1 m splits best intercepts |
Re-assay (PhotonAssay) at 1 m splits best intercepts |
|
KWD25-RC-001 |
12 m @ 0.2 g/t Au from 0 m |
12 m @ 0.17 g/t Au from 0 m |
12 m @ 0.21 g/t Au from 0 m |
|
KWD25-RC-001 |
8 m @ 0.15 g/t Au from 36 m |
8 m @ 0.18 g/t Au from 36 m |
8 m @ 0.16 g/t Au from 36 m |
|
KWD25-RC-001 |
6 m @ 0.27 g/t Au from 56 m |
6 m @ 0.31 g/t Au from 56 m |
6 m @ 0.26 g/t Au from 56 m |
|
KWD25-RC-001 |
18 m @ 0.54 g/t Au from 72 m No chips recovery between 78 m and 80 m. 0 g/t assumed for this interval here although it is in the richer part of the mineralisation |
18 m @ 0.61g/t Au from 72 m No chips recovery between 78 m and 80 m. 0 g/t assumed for this interval here although it is in the richer part of the mineralisation |
18 m @ 0.72g/t Au from 72 m No chips recovery between 78 m and 80 m. 0 g/t assumed for this interval here although it is in the richer part of the mineralisation |
|
KWD25-RC-001 |
4 m @ 0.96 g/t from 126 m |
4 m @ 0.56 g/t from 126 m |
4 m @ 0.72 g/t from 126 m |
|
KWD25-RC-003 |
24 m @ 0.61 g/t Au from 18 m incl. 12 m @ 1.0 g/t Au from 26 m |
24 m @ 0.72 g/t Au from 18 m incl. 12 m @ 1.2 g/t Au from 26 m |
24 m @ 0.64 g/t Au from 18 m incl. 12 m @ 1.03 g/t Au from 26 m |
|
KWD25-RC-006 |
4 m @ 0.19 g/t Au from 24 m |
4 m @ 0.16 g/t Au from 24 m |
4 m @ 0.14 g/t Au from 24 m |
|
KWD25-RC-006 |
6 m @ 0.13 g/t Au from 34 m |
6 m @ 0.20 g/t Au from 34 m |
6 m @ 0.18 g/t Au from 34 m |
|
KWD25-RC-006 |
2 m @ 1.58 g/t Au from 46 m |
2 m @ 0.42 g/t Au from 46 m |
2 m @ 0.51 g/t Au from 46 m |
|
KWD25-RC-006 |
22 m @ 0.33 g/t Au from 62 m |
22 m @ 0.28 g/t Au from 62 m |
22 m @ 0.26 g/t Au from 62 m |
|
KWD25-RC-007 |
6 m @ 0.28 g/t Au from 32 m |
6 m @ 0.21 g/t Au from 32 m |
6 m @ 0.19 g/t Au from 32 m |
|
KWD25-RC-007 |
4 m @ 0.43 g/t Au from 44 m |
4 m @ 0.35 g/t Au from 44 m |
4 m @ 0.29 g/t Au from 44 m |
|
KWD25-RC-013 |
14 m @ 0.53 g/t Au from 32 m |
14 m @ 0.51 g/t Au from 32 m |
14 m @ 0.49 g/t Au from 32 m |
|
KWD25-RC-014A |
4 m @ 2.52 g/t Au from 34 m incl. 2 m @ 4.73 g/t Au from 34 m |
4 m @ 2.46 g/t Au from 34 m incl. 2 m @ 4.66 g/t Au from 34 m |
4 m @ 2.58 g/t Au from 34 m incl. 2 m @ 4.93 g/t Au from 34 m |
|
KWD25-RC-017 |
10 m @ 0.72 g/t Au from 0 m |
10 m @ 0.40 g/t Au from 0 m |
10 m @ 0.41 g/t Au from 0 m |
|
KWD25-RC-017 |
8 m @ 0.68 g/t Au from 34 m |
8 m @ 3.12 g/t Au from 34 m incl. 1 m @ 19.2 g/t Au from 36 m repeated with Photon assay returned 22.17 g/t Au (see Table 2) |
8 m @ 3.79 g/t Au from 34 m incl. 1 m @ 22.17 g/t Au from 36 m |
|
KWD25-RC-017 |
4 m @ 0.24 g/t Au from 56 m |
4 m @ 0.23 g/t Au from 56 m |
4 m @ 0.17 g/t Au from 56 m |
|
KWD25-RC-017 |
6 m @ 0.31 g/t Au from 66 m (hole stopped at 72 m within mineralisation) |
6 m @ 0.35 g/t Au from 66 m (hole stopped at 72 m within mineralisation) |
6 m @ 0.22 g/t Au from 66 m (hole stopped at 72 m within mineralisation) |
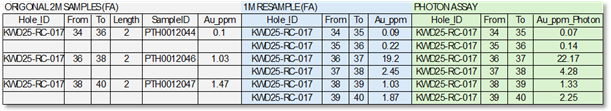
To verify repeatability of the samples collected at 2m intervals the Company collected splits of mineralised zones at 1m intervals. The 1m splits were initially analysed at SGS Laboratory in Ouagadougou by a Fire Assay of a 50g aliquot. This more detailed sampling gave similar results to the original 2m split sampling (Table 1). The exception being for an interval in hole KWD25-RC-017 where resampling at 1 m intervals gave 5m @ 4.95 g/t Au from 35m to 40m and included 36m to 37m @ 19.2 g/t Au. Note original 2m sample split (Fire Assay) from 36m to 38m returned 1.03 g/t Au while re assay by Photon Assay of the 1m interval, 36m to 37m, returned 22.17 g/t Au as shown in table 2 below.
Table 2: Comparison of results in hole KWD25-RC-017
At Target 1 (testing continuity of historical holes where gold intervals of 24 m @ 1.38 g/t Au from 143 m, 9 m @ 0.51 g/t Au and 10 m @ 0.57 g/t Au reported in three holes):
• Hole KWD-RC-001 started directly within a gold intersection with 12 m @ 0.2 g/t from 0 m within colluvium and saprolite horizon. Two other gold zones were intersected at 36 m with 8 m @ 0.15 g/t Au within a tuff with minor patchy pyrite and at 56 m with 6 m @ 0.27 g/t Au within tuff with local pyrrhotite and weak pervasive carbonate alteration. A further zone was intersected from 72 m over 18 m with an average of 0.54 g/t, including 12 m @ 0.7 g/t Au, within a tuff with pyrite and pyrrhotite (0.5% to 2%) and weak pervasive chlorite and carbonate alteration. The interval from 80 m to 82 m returned 3.2 g/t Au and the interval 126 m with 0.96 g/t Au over 4 m (Figure 3).
• Hole KWD25-RC-017 (Figure 4) tested the Target 1 zone for the continuity of the mineralisation about 100 m south of KWD25-RC-001. The hole also started directly within the gold mineralisation with 10 m @ 0.72 g/t Au from surface in a laterite with laminated and smoky quartz fragments horizon. This was followed by 8 m @ 0.68 g/t Au from 34 m within a tuff with laminated quartz veinlets and weakly pervasive chlorite alteration. The interval from 56 m returned 4 m @ 0.24 g/t Au with patchy pyrrhotite and quartz stringers. Mineralisation was also intersected from 66 m to 72 m (where the hole stopped due technical issues). This interval reports 6 m @ 0.31 g/t Au from 66 m. Both KWD25-RC-001 and KWD25-RC-017 started directly within gold mineralisation demonstrating the extension of the mineralisation may extend to the east (large soil anomaly) as shown on Figure 2.
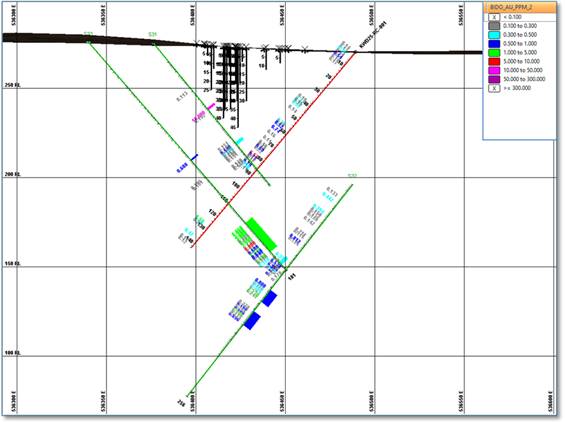
Figure 3: Section View of Target 1 and Section view Hole KWD-RC-001
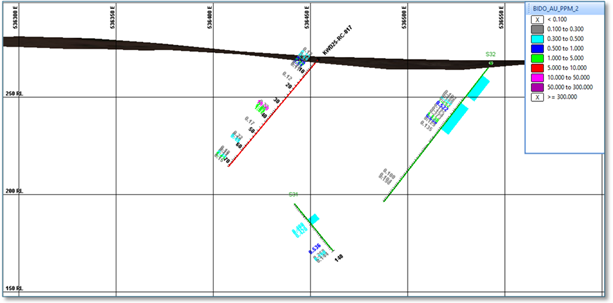
Figure 4: Section View of Target 1 and Section view Hole KWD-RC-017
Target 2 (testing combined geophysical (IP) and soil anomalies and coincident historical drill results such as 16 m @ 1.07 g/t Au, 11 m @ 0.40 g/t Au and 13 m @ 0.53 g/t Au) was drilled with 4 holes (KWD25-RC-002, KWD25-RC-003, KWD25-RC-004 and KWD25-RC-005), Figure 5.
• Hole KWD25-RC-003 intersecting 24 m @ 0.61 g/t from 26 m was intersected in this hole and this include 12 m @ 1.0 g/t Au within a dacite/tuff horizon with local patchy pyrite and pyrrhotite and quartz stringers.
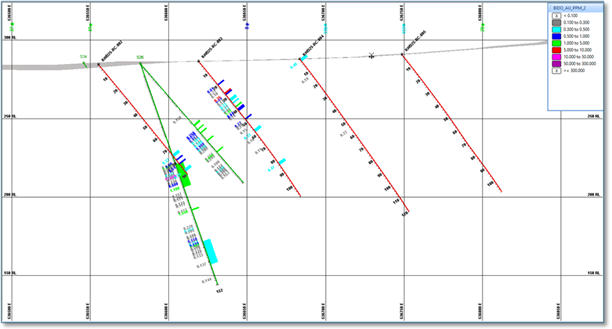
Figure 5: Section View of Target 2 and Section view Holes KWD-RC-002 to KWD-RC-005
Target 3 (testing an area to include follow up of a RAB hole drilled in 2014 reporting 13 m @ 22.11 g/t Au to the end of hole (reference the company's AIM Admission Document)) included drilling of two holes (Figure 6),
• KWD25-RC-006 returned a gold interval of 2 m @ 1.58 g/t from 46 m within a tuff with minor pyrite, pyrrhotite and weak pervasive chlorite and carbonate alteration followed by a broader zone of 22 m @ 0.33 g/t Au from 62 m within the same lithological unit. Other less relevant intervals in this hole were to 4 m @ 0.19 g/t Au from 24 m and 6 m @ 0.13 g/t Au from 34 m.
• Hole KWD25-RC-007 was drilled to the east of KWD25-RC-006 and intersected 6 m @ 0.28 g/t Au from 32 m within and andesite with patchy pyrite and pyrrhotite followed by 4 m @ 0.43 g/t Au from 44 m within the same lithological unit.
The hole KWD25-RC-006 successfully intersected a zone of gold mineralisation at depth below a previously reported RAB hole KWRAB23 drilled in 2014 (reference the Company's AIM Admission Document) that reported a gold interval of 13 m @ 22.11 g/t Au from 20 m. This included 1 m @ 45.5 g/t from 21 m and 1 m @ 9.79 g/t from 25 m. The new drilling has successfully identified this vein system to dip westwards, thus further focused testing of this potentially higher-grade vein system, and its strike extent will be planned.
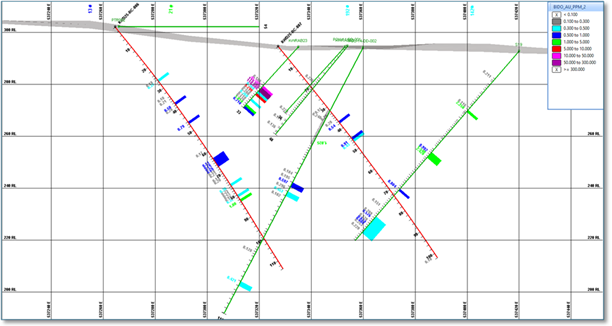
Figure 6: Section View of Target 3 and Section view Holes KWD-RC-006 and KWD-RC-007
Target 4 (axis of high chargeability IP anomalies and gold in soil anomalies) was tested with 5 drill holes (KWD25-RC-008 to KWD25-RC-12): no significant gold intersections were returned despite the moderate to high presence of alteration pyrite and pyrrhotite, in some relevant intervals. It was elected to send selected intervals of these holes to Ghana for PhotonAssay as a further check methodology, but results were comparable to the original fire assay.
Target 5 (an area where a high chargeability IP anomaly is located underneath a recently dug and extensive line of orpailleurs shafts) was partly tested with 4 holes, KWD25-RC-013 to KWD25-RC-016 (Figure 7). Significant intersections were:
• KWD25-RC-013 returned 14 m @ 0.53 g/t from 32 m in quartz stringers and weak pervasive chlorite.
• KWD25-RC-014A returned 4 m @ 2.52 g/t Au from 34 m, including 2 m @ 4.73 g/t Au, in graphitic shist with laminated smoky quartz veining and pervasive carbonate alteration. A further interval of 8 m @ 0.29 g/t Au from 54 m within graphitic shist with smoky quartz veining, local patchy pyrite, pyrrhotite and pervasive chlorite alteration was returned.
• Unfortunately, holes KWD25-RC-015 and KWD25-RC-016 did not return significant gold intersections.
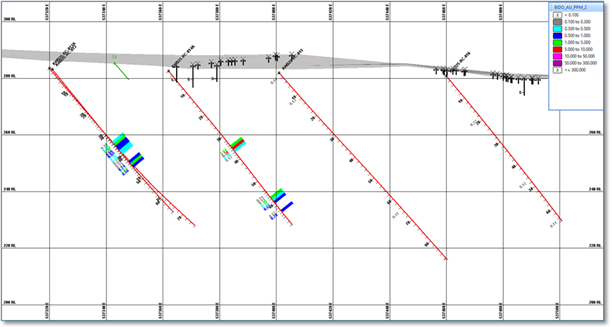
Figure 7: Section View of Target 5 and Section view Holes KWD-RC-013 to KWD-RC-016
Analysis of Results
Kwademen is part of the Bido/Boromo greenstone belt (often also linked with the Poura belt), a Paleoproterozoic Birimian volcano‑sedimentary terrane that hosts multiple gold and base‑metal deposits including Poura and Perkoa. Kwademen is located within a shear corridor, where tholeiitic to calc‑alkaline basalts, andesites and related volcano‑sedimentary rocks are strongly deformed and metamorphosed to lower‑greenschist facies[1].
Gold at and near Kwademen is described[2] as shear‑hosted orogenic mineralisation, with alteration and sulphide dissemination (biotite‑chlorite, carbonate, oxides) associated with deformed volcanic rocks in the Kwademen‑Baguiomo shear zone and the Kwademen mineralisation is considered to be localized in these shears, with gold pits and artisanal workings aligned along the main shear direction. In addition to gold, the Kwademen prospect has some potential for polymetallic (Cu‑Zn±Pb±Au) style mineralisation. This style is described[3] as a volcanogenic massive sulphide-type (VMS), best represented by the Perkoa deposit; the latter is not an immediate target for our exploration at this time.
This drill programme has supported our exploration model with the identification of wide zones of quartz veining, alteration (pervasive carbonate, chlorite and silica) and associated sulphides coincident with the wider gold intersections. Sulphides are generally represented by boxwork textures or limonite replacing sulphides, but occasionally fresh pyrite and/or arsenopyrite has been logged.
The limited programme of drilling has successfully upgraded 4 of the 5 targets tested in this programme with wide but low-grade gold intersections with identified along strike extension potential.
This successful programme of drilling will provide follow up locations for detailed future drilling work.
Contacts
Panthera Resources PLC
Mark Bolton (Managing Director) +61 411 220 942
contact@pantheraresources.com
Allenby Capital Limited (Nominated Adviser & Joint Broker) +44 (0) 20 3328 5656
John Depasquale / Vivek Bhardwaj (Corporate Finance)
Kelly Gardiner (Sales & Corporate Broking)
VSA Capital Limited (Joint Broker) +44 (0) 20 3005 5000
Andrew Monk / Andrew Raca
AlbR Capital Limited (Joint Broker) +44 (0) 20 7399 9400
Colin Rowbury
Subscribe for Regular Updates
Follow the Company on Twitter at @PantheraPLC
For more information and to subscribe to updates visit: pantheraresources.com
Qualified Persons
The technical information contained in this disclosure has been read and approved by Ian S Cooper (BSc, ARSM, FAusIMM, FGS), who is a qualified geologist and acts as the Qualified Person under the AIM Rules - Note for Mining and Oil & Gas Companies. Mr Cooper is a geological consultant to Panthera Resources PLC.
Glossary
|
Au:
|
The chemical element for Gold |
|
Diamond Core
|
Diamond core drilling uses a diamond cutting bit, which rotates at the end of a steel rod (tube) allowing for a solid column of rock to be recovered from the tube at the surface.
|
|
g/t:
|
Grammes per Tonne (Metric) |
|
JORC or JORC Code: |
Australasian Code for Reporting of Mineral Resources and Ore Reserves of December 2012 ("JORC Code") as prepared by the Joint Ore Reserves Committee of the Australasian Institute of Mining and Metallurgy. Terms including Measured, Indicated and Inferred Resources as defined therein
|
|
RC Drilling: |
Reverse Circulation drilling, or RC drilling, uses rods with inner and outer tubes, the drill cuttings are returned to surface inside the rods. The drilling mechanism is a pneumatic reciprocating piston known as a hammer driving a tungsten-steel drill bit. |
|
IP: |
Induced polarization (IP) is a geophysical imaging technique used to identify the electrical chargeability of subsurface materials
|
|
Fire Assay or FA: |
Fire assay method has been practiced since ancient times and remains the industry-standard technique for determining gold content in all sample types. This well-understood technique provides accurate results across geological sample types. However, practiced skill is essential to achieving a successful fire assay. A range of fire assay methods are available with 30g or 50g sample aliquots taken after a larger representative sample has been crushed and pulverised for homogenisation. Multiple options for detection ranges to suit the needs of the project. |
|
PhotonAssay: |
The method analyses a 500gm split using sample irradiation (reference - PhotonAssay - Chrysos Corporation ) the method involves "hitting samples with high-energy X-rays, Chrysos PhotonAssay™ technology causes excitation of atomic nuclei allowing enhanced analysis of gold, silver, copper and other elements in as little as two minutes". |
Forward-looking Statements
This news release contains forward-looking statements that are based on the Company's current expectations and estimates. Forward-looking statements are frequently characterised by words such as "plan", "expect", "project", "intend", "believe", "anticipate", "estimate", "suggest", "indicate" and other similar words or statements that certain events or conditions "may" or "will" occur. Such forward-looking statements involve known and unknown risks, uncertainties and other factors that could cause actual events or results to differ materially from estimated or anticipated events or results implied or expressed in such forward-looking statements. Such factors include, among others: the actual results of current exploration activities; conclusions of economic evaluations; changes in project parameters as plans continue to be refined; possible variations in ore grade or recovery rates; accidents, labour disputes and other risks of the mining industry; delays in obtaining governmental approvals or financing; and fluctuations in metal prices. There may be other factors that cause actions, events or results not to be as anticipated, estimated or intended. Any forward-looking statement speaks only as of the date on which it is made and, except as may be required by applicable securities laws, the Company disclaims any intent or obligation to update any forward-looking statement, whether as a result of new information, future events or results or otherwise. Forward-looking statements are not guarantees of future performance and accordingly, undue reliance should not be put on such statements due to the inherent uncertainty therein.
**ENDS**
[1] Ouiya, P. , Tarnagda, A. and Fozing, M. (2024) Characteristics of Gold Mineralization at the Baguiomo Gold Panning Site, Koudougou Region, Burkina Faso, West Africa. Open Journal of Geology, 14, 1-18. doi: 10.4236/ojg.2024.141001.
[2] Tarnagda, F., Ouiya, P., & Sawadogo, S. (2023). Identifying Areas of High Gold Potential Using Geochemical Prospecting Methods: The Tenado area in the Boromo Birimian Belt, West-Central Burkina Faso, West Africa. European Scientific Journal, ESJ, 24, 599.
[3] Cheik Abba Cissé Ouangaré, Séta Naba, Patrick Lachassagne,
Enhancement of the geological mapping in weathered plutonic and metamorphic rocks areas using village water supply wells data (lithology and hydrochemistry), Heliyon, Volume 10, Issue 22, 2024,
RNS may use your IP address to confirm compliance with the terms and conditions, to analyse how you engage with the information contained in this communication, and to share such analysis on an anonymised basis with others as part of our commercial services. For further information about how RNS and the London Stock Exchange use the personal data you provide us, please see our Privacy Policy.


Latest directors dealings
- 35 minutes ago BHP Group Limited NPV (DI)
- 2 hours ago Sintana Energy Inc.
- 2 hours ago accesso Technology Group
- 2 hours ago Iofina
- 2 hours ago Allergy Therapeutics