Audited Final Results
Summary by AI BETAClose X
The information contained within this announcement is deemed by the Company to constitute inside information pursuant to Article 7 of EU Regulation 596/2014 as it forms part of UK domestic law by virtue of the European Union (Withdrawal) Act 2018 as amended.
18 March 2026
Nexteq plc
("Nexteq" or the "Group")
Audited Final Results
Performance in line, significant reorganisation to deliver three-year plan
Nexteq (AIM: NXQ), a leading technology solutions provider to customers in selected industrial markets, is pleased to announce its audited full year results for the 12 months ended 31 December 2025.
|
|
Year ended 31 December 2025 |
|
Year ended 31 December 2024 |
|
Change |
|
|
|
|
|
|
|
|
|
|
|
|
|
|
|
Group Revenue |
$90.2m |
|
$86.7m |
|
4% |
|
Quixant Revenue |
$60.1m |
|
$54.8m |
|
10% |
|
Densitron Revenue |
$30.1m |
|
$31.9m |
|
(6%) |
|
Gross margin |
32.8% |
|
35.9% |
|
(310 bps) |
|
Adjusted profit before tax1 |
$3.6m |
|
$4.8m |
|
(25%) |
|
Adjusted EBITDA1 |
$6.2m |
|
$5.9m |
|
4% |
|
Group profit before tax |
$3.2m |
|
$1.7m |
|
88% |
|
Adjusted diluted earnings per share1 |
3.63c |
|
5.08c |
|
(29%) |
|
Diluted earnings per share |
3.14c |
|
0.48c |
|
554% |
|
Operating cashflow |
$3.5m |
|
$13.0m |
|
(73%) |
|
Net cash2 |
$25.0m |
|
$29.1m |
|
(14%) |
1Adjusted for amortisation of customer relationships, technology and order backlog, share based payments, and revaluation of investment property. For further details refer to note 1 and note 5 of the condensed consolidated financial statements.
2Net cash is a non-GAAP measure of cash inflows from operations less cash tax paid
FINANCIAL HIGHLIGHTS
|
· |
Group revenue increased 4% driven by demand from our Quixant gaming customers. o Quixant revenues increased 10%, with gaming hardware platform volumes increasing in the year with greater diversification of revenues across the customer base. o Densitron revenues down 6%, with softer demand across all industrial sectors. |
| · |
Gross margin reduced by 310bps to 32.8%, despite a record gross margin % for Densitron. o Quixant margin impacted by changes in customer and product mix, alongside component price increases from the surge in memory pricing eroding margin %. o Densitron delivered its highest ever gross margin % driven by strong new business wins from its strategy to deliver fully integrated solutions beyond displays. |
|
· |
Adjusted profit before tax reduced 25% to $3.6m (2024: $4.8m), an Adjusted PBT margin of 4.0% (2024: 5.5%). |
|
· |
Reported profit before tax increased 88% to $3.2m (2024: $1.7m), with a Reported PBT margin up to 3.5% (2024: 2.0%), reflecting lower adjusting items despite memory pricing pressures and a $0.7m development cost write-off. |
|
· |
Operating cash conversion remained above 100%, with net cash of $25.0m (2024: $29.1m) after $3.6m returned to shareholders and $4.0m of capital investment. |
|
· |
Dividend of 3.9p per share proposed (2024: 3.7p per share) reflecting confidence in the long-term prospects of the business and strong cash generation. |
OPERATIONAL HIGHLIGHTS
Product innovation and launches
|
· |
Prodeck won awards at two shows in 2025, with key third party software integrations added. |
|
· |
Launchpad gaming software platform showcased at G2E. |
|
· |
IQON3, our latest gaming computer based on DDR-5 memory launched at G2E. |
|
· |
Tactila progressing towards mass production phase with pre-mass production units shipped from Taiwan. |
Customer delivery and market engagement
|
· |
Successfully delivered Quixant cabinets which went live in UK casino venues and Scandinavian cruise ships. |
|
· |
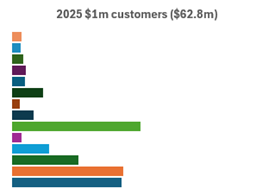
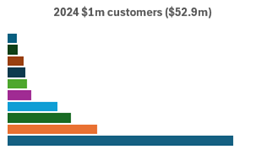
Increased the number of $1m customers to 14 (2024: 10), delivering better revenue diversification. |
Supply chain and cost management
|
· |
Executed strategic buys of key components in H2 2025 to ensure supply and minimise the impact of sharply increasing prices in the memory market for DDR-4. |
CURRENT TRADING OUTLOOK
|
· |
In the Gaming market vertical, the acquisition of the Group's historically largest customer has led to a reduced revenue expectation in the Quixant brand, but we are generating significant interest in Launchpad and IQON-3 following ICE trade show in January, with first Launchpad customer purchase order received and secured GLi evaluated platform foundation for Launchpad. A continued focus on new product development will see new products launched throughout 2026. |
|
· |
The impact of component shortages and subsequent cost increases is yet to be fully seen, but this along with the consequences of tariffs and accelerating geopolitical conflict is creating customer uncertainty, and a reluctance for end users to commit to capital expenditure. Nexteq has however committed to further strategic buys of DDR-4 and DDR-5 to counter increasing market prices and extended delivery times. |
|
· |
Industrial display market verticals offer Nexteq a significant growth opportunity as we focus on full system display delivery |
|
· |
Strong balance sheet with a significant net cash position, and with continuing good operating cash generation, positioning the Group for future organic and acquisitive growth. |
|
· |
Post period, the Company completed the acquisition of a new office in Taipei, Taiwan for total consideration of $15.5m, funded in part through a $12.2m mortgage facility, and has entered into an agreement to sell its existing Taipei property for $3.7m. |
Duncan Faithfull, Chief Executive Officer of Nexteq plc, commented:
"Nexteq is now in the second phase of the growth plan, as presented at the Capital Markets Day in February 2025. We achieved our financial commitments in 2025, despite the decline in volume from our historically biggest gaming customer being steeper than previously anticipated, following its acquisition. As with the recent post pandemic years, the trading environment remained complicated, with the potential tariffs and global geopolitical uncertainty impacting customers' confidence.
Against this backdrop, we have been proactive in managing both the availability and rising cost of DDR4 memory, a key component of our gaming hardware platforms. These dynamics emerged through the second half of 2025 and continue into 2026 as AI-driven demand absorbs supplier capacity. Building on Nexteq's strong track record of navigating supply chain disruption, we have taken decisive mitigating actions, including qualifying alternative supply options, running a structured customer testing and validation programme for alternative DDR4 sources, and implementing price actions to reflect higher manufacturing costs and protect gross margins. We continue to monitor this into 2026.
Throughout 2025, we remained focused in progressing our technology 'building blocks' essential for pipeline and revenue growth, with the commitment to innovation, and momentum from the successful product launches of Launchpad, IQON3 and display solutions development. Trade shows early in 2026 have built pipeline opportunities for our innovations, resulting in our first order for Launchpad software licenses, with further customer win news flow expected.
It is a true honour to lead, and work with such a talented, committed and energetic group of people. They are a constant source of inspiration, and we are confident that Nexteq, with its OneNexteq agenda, will go from strength to strength as our new products and solutions progress our revenue diversification and growth potential."
Carol Thompson, Non-Executive Chair of Nexteq plc, commented:
"During 2025, we made significant progress laying the groundwork to position Nexteq for long-term success. While we are not immune to the market-wide headwinds that many businesses are navigating, whether from tariffs and trade policy, memory and storage availability and costs, or broader geopolitical uncertainty, we have a strong track record of managing our supply chain and steering through challenges. We retain our conviction in the growth potential of this business, and remain positive about the mid to long term future of Nexteq."
Investor Presentation
Nexteq is hosting an online presentation open to all investors today via Investor Meet Company at 10.00am. Anyone wishing to join the session should register here:
https://www.investormeetcompany.com/nexteq-plc/register-investor
1 The consensus forecasts for the year ended 31 December 2025 are $85.5m revenue, $6.0m adjusted EBITDA and $3.6m adjusted profit before tax.
|
Nexteq plc Carol Thompson, Non-Executive Chair Duncan Faithfull, Chief Executive Officer Matt Staight, Chief Financial Officer
|
Tel: +44 (0)1223 892 696 |
|
Nominated Adviser and Broker: Cavendish Capital Markets Ltd Matt Goode / Teddy Whiley / Andrea Callaghan (Corporate Finance) Harriet Ward (ECM)
|
Tel: +44 (0) 20 7220 0500 |
|
Financial PR: Alma Strategic Communications Hilary Buchanan / Emma Thompson |
Tel: +44 (0)20 3405 0205 |
About Nexteq
Nexteq (AIM: NXQ) is a strategic technology solutions provider to customers in selected industrial markets. Its innovative technology enables the manufacturers of global electronic equipment to outsource the design, development and supply of non-core aspects of their product offering. By outsourcing elements of their technology stack to Nexteq, customers can focus their product development effort on the most critical drivers of their business' success.
Our solutions are delivered through a global sales team and leverage the Group's electronic hardware, software, display and mechanical engineering expertise. Our Taiwan operation is at the heart of Asian supply networks and facilitates cost effective manufacturing and strategic supply chain management.
The Group operates in six countries and services over 500 customers across 47 countries.
Nexteq operates two distinct brands: Quixant, a specialised computer platforms provider, and Densitron, leaders in human machine interface technology, each with dedicated sales, account management and product innovation teams. Founded in 2005, and later floating on the London Stock Exchange's AIM stock market as Quixant plc, the Group rebranded to Nexteq in 2023.
Further information on Nexteq and its divisions can be found at www.nexteqplc.com.
CHAIR'S STATEMENT
My introduction to Nexteq was as Non-Executive Director three years ago. It was a privilege to be asked to become Chair during 2025 and have an opportunity to shape the future of the business, working with its very talented and engaging senior team to take advantage of the opportunities emerging from new technology innovations and territories, and refreshed strategy to reach wider audiences.
Nexteq is a diverse, ambitious and creative company, evolving confidently at pace in a global economic environment, which continues to be uncertain with well-documented headwinds impacting most technology-organisations.
Assisting and supporting the Nexteq Executive management team in delivering the commitments made in the three-year plan continues to be a balanced mixture of challenging, fascinating and rewarding. Quixant and Densitron serving our vertical markets through fit-for-purpose platforms that enable customers to focus on the user experience and delight their end users. The key to delivering our growth remains in the focus of developing new technology, and in delighting our customers through our innovation, supply chain excellence and our expert, dedicated and energetic team.
Review of 2025
2024 was a year of significant change within the organisation, therefore it was important in 2025 that the business settled into new leadership and was given new, clear and measurable goals to coalesce around multiple deliverables, with one mission.
In February 2025, the Group held a Capital Markets Day (CMD) to unveil a set of objectives designed to ensure the Group focussed on creating exciting new technology to drive growth in challenging market conditions, across our verticals. Progress has been made against these objectives despite the 'headwinds' in our markets around the impact of tariffs; continuing component shortages and cost increases, and the significant impact of our historically largest customer being acquired in 2025.
To have delivered revenue growth in a year in the midst of such external forces, demonstrates the resilience of the Group and the entire Nexteq team. Historically, revenue concentration in a single major customer meant that a rapid reduction in that business could have created meaningful short-term disruption and risked slowing our investment and growth plans. Instead, we responded by using the change as a catalyst to sharpen our strategy, accelerate new thinking, and translate insight into new products and commercial wins. The team have demonstrated resilience and creativity, which is the bedrock of a flexible and robust team focused on execution and sustainable growth.
The business delivered its revenue and adjusted PBT commitments, alongside delivering positive operating cashflow, ending the year with $25.0m net cash (2024: $29.1m),after returns to shareholders through its dividends of $3.0m and $0.6m via our share buyback programme. The Group moves into 2026 with exciting new products launching and a growing customer opportunity pipeline of new Nexteq IP based solutions.
Headwinds continue, but new products bring optimism
At the CMD in February 2025, the Group outlined its 'signposts to success', and its objective to hit $108m revenue, gross margins of 35%-38% and adjusted EBITDA margins of 10%-15% by the end of 2027. Subsequent material news regarding the acquisition of the Group's historically largest customer, led to the market announcement in December 2025 outlining the impact on 2026 performance and on the timing of the three-year plan outcome, with the financial objectives now targeted for 2028.
The Executive leadership team is resolute that the business is making informed and high-quality decisions and will continue to focus on what is within its control, with a clear focus on delivering new technology innovation.
In October 2025, Launchpad™ - our software platform for land-based gaming - was introduced at G2E in the US. The Launchpad platform enables customers to accelerate time-to-market in regulated jurisdictions while focusing internal effort on content and player experience. The platform was officially unveiled to the wider market at ICE Barcelona in January 2026. Whilst delivering the essential differentiators to our customers, this software innovation allows us to generate software recurring revenue opportunities alongside the repeatable model of the gaming computers. The latest computer offerings of the IQON 3 and the IQON Air 3, bring true innovation and the latest technology to our customers, incorporating the latest DDR5 memory solution. The opportunity pipeline for Launchpad is developing, and we secured our first customer in February 2026 for this new software based revenue.
Equally exciting is the continuing development of Densitron's unique Tactila HMI solution, alongside the award winning ProDeck, providing Densitron's customers truly innovative, differentiated display, touch and tactile solutions. Throughout 2026 the growing customer base adopting Tactila will be on-boarded and is expected to contribute to Group revenue, as longer integration cycles complete.
With this as a backdrop you will see acceleration of our plans around targeting new market verticals with our 'OneNexteq' range of technologies and solutions, where we combine our embedded computing and HMI technologies to create new solutions for our customers. The thought leadership, and engineering capability in Nexteq is a truly inspirational combination, and will continuously drive the development of our product roadmaps.
We will continue to target M&A activity to accelerate capability development, market expertise, and revenue growth, but will do so in a structured way, and will be rightly demanding in what M&A opportunities can bring. Whilst the 'headwinds' will impact revenue and margin in 2026, the potential for exceptional growth in 2027 and beyond is clearly in sight.
Sustainable growth
Our commitment to long-term, sustainable value creation remains a central component of our evolution. In addition to being Carbon Neutral in 2025, the Group continues to make progress towards its target of achieving Net Zero emissions by 2050. The work completed against the five UN Sustainability Development Goals (SDGs) identified for the Group includes expanding apprenticeships and continuing our contribution to carbon reduction initiatives.
Dividend and share buyback programme
The Board has agreed to maintain the existing progressive dividend policy as this is supported by the healthy operating cash flow and strong cash balance. This strength enables us to fund investment and strategic change while continuing to return value to shareholders - a position that is a rare privilege for AIM-listed companies in the current environment.
As a result, the Board considers it appropriate to recommend a full-year dividend of 3.9p per share (2024: 3.7 per share).
The Group's original share buyback programme, launched in H2 of 2024, returned $0.6m of cash to shareholders during 2025 (the balance of the total $7.6m bought back since 2024) with 100% of the approved buybacks having been completed by the first half of 2025. A subsequent share buyback programme was launched at the end of 2025, which has resulted in buybacks in early 2026. On expiry of the current buyback programme, the Board intends to seek a new authority at the AGM for a further buyback programme. It is intended that the further buyback programme would be used selectively, if approved.
Looking ahead
Whilst we have continuing headwinds to deal with, we look forward to 2026 and beyond with a clear direction and true enthusiasm. By focusing on the things that we can control and having strategies to pivot around issues which we cannot, I believe that Nexteq can deliver an exciting future for its wonderful team of colleagues; its customers; partners and investors.
On behalf of the Board, I would like to express our gratitude to the OneNexteq team for their skills, energy and resilience, and I look forward to celebrating our successes in 2026 and beyond.
Carol Thompson
Chair
CHIEF EXECUTIVE'S REPORT
2025 in summary
2025 was a year of successful delivery for Nexteq, and I am extremely proud of our achievements. We exceeded the commitments set out at our Capital Markets Day (CMD) in February, despite well-documented external headwinds including a significant change in the customer mix, tariffs, ongoing component supply-chain constraints, and unexpected end-of-life (EOL) issues. The business continued to perform strongly, underpinned by excellent customer service and the successful delivery of market-leading, technology-based products and solutions. Our ability to execute against our plans in a challenging environment demonstrates the resilience of our operating model, the strength of our customer and technology proposition, and the skill and determination of our team.
Nexteq is an exceptional technology product business. The 'OneNexteq' objective gathered momentum as we focussed on what sets us apart in our markets: our ability to combine all of the skills across the Group to deliver a unique innovation agenda.
Whilst 2025 did have its challenges, the Group delivered revenues of $90.2m (FY24: $86.7m), 5% ahead of guidance given at the Capital Markets Day. This is testament to the Group's product development approach; customer relationships and effective management of three significant 'headwinds':
1. Tariffs. The Group implemented targeted actions ensuring the impact of tariffs was minimised. In the Gaming sector, the team managed to secure zero tariff impact, whilst in the Industrial Displays markets, a small increase to the original tariff level was seen, with the impact passed down the supply chain. The real impact was from tariffs on other components within customers' bills of materials which increased end-product costs and reduced customer demand, indirectly impacting Nexteq.
2. Component supply chain issues. Throughout 2025, the impact of significant growth in AI solution providers relating to server development has meant DDR4; DDR5 and SSD availability has been seriously impacted with the volume being devoured by these AI organisations. This has led to eye-watering and regular price increases across these products, leading to Bill of Material (BoM) cost increases across our customer base. The Group has a strong track record of managing supply chains and customer demand through a combination of revised commercial terms and strategic component stock purchases, utilising the strength of Nexteq's balance sheet to ensure integrity of supply for our customers and minimising the impact of Nexteq's gross margin.
3. Customer mix changes. The biggest impact on 2025 outcome was the changing customer mix. The Group's historically largest customer was acquired by private equity in 2025, leading to a significant reduction in their volume in year. Whilst this acquisition was known from the start of the year, the volume risk crystallised sooner, and more dramatically than predicted. We previously anticipated a prudent 25% board volume reduction, but the reduction was actually 70%, as the new organisation aggressively rationalised its product range to deliver operating cost savings. It is important to note that this customer was historically the Group's largest customer from a revenue and margin perspective, highlighting the outstanding performance to deliver the revenue growth of 4% for the Group in 2025.
Nonetheless, operational challenges can be the catalyst for innovation. Through the launch of a new gaming hardware platform, we deepened an existing customer relationship, helping to mitigate some of the impact of the sudden volume reduction. The innovative new platform delivered enhanced graphics performance, supporting our customers' product development and enabling them to win significant volume, and generating new revenue for the Group. This new revenue was significant, but with a lower margin yield, and this will continue to be a 'new reality' for Nexteq to deal with on a continuing basis.
2025 was a year of integrating key business structures as we pushed ahead with our OneNexteq agenda, to collaborate as much as possible to best utilise the tremendous skills we have. We have combined our skills across the Product teams, Operations and customer technical support to make us operationally efficient, and highly effective in delivering new product roadmaps.
Positive operating cash generation continues
Nexteq operates a highly efficient business model, resulting in strong and consistent operating cash generation across the Group. In 2025, this underpinned the dividend payment of $3.0m, and the return of $0.6m back to shareholders through our first share Buyback programme. Even with this, the Group ended with $25.0m of net cash, giving us the flexibility to introduce a further share Buyback programme, consider targeted 'bolt-on' M&A, and invest in sourcing critical components through strategic stock purchases.
Growth strategy: performance vs strategic objectives
At the CMD in February, we outlined the 'signposts to success' for the three-year plan, with the key objectives for customer and product development to support long-term growth. These have become the driving force behind OneNexteq's delivery agenda.
We made progress across our signposts to success and I am delighted with the focus the business has on these pillars of achievement.
Signposts to success:
1. Pipeline Growth. Under our new OneNexteq sales leadership focus, and with the new Group Customer Relationship Management (CRM) system in place, the business had set an objective to deliver 50% growth to total contract value (TCV) of $630m by the end of 2027. We are on track to deliver this challenging objective, developing our pipeline to a value of over $480m by year end 2025.
2. Nexteq IP revenue. The development of proprietary intellectual property is a core pillar of the Group's product strategy. The Group set the objective to generate $10m of revenue from newly created Nexteq IP by FY2027. $3m new Nexteq IP revenue was achieved through the Group's gaming turnkey cabinet solutions and its innovative HMI offering, particularly through its award winning ProDeck solution. With committed orders in place for 2026 and new innovations being introduced, the Group is well positioned to deliver further progress towards this objective.
3. Number of $1m customers. Diversification of our revenue is a constant focus and growing the number of $1m customers from both the Quixant and Densitron brands, will make our business healthier in the long term and reduce customer concentration. In 2024, the Group had ten $1m-value customers, and this grew to 14 in 2025, with growth delivered across both brands. Quixant had eight $1m customers (2024: seven) and Densitron had six (2024: three). A clear focus on organic growth in current accounts, supported by product development efforts has enabled us to deliver this. We are onboarding several customers wins that are expected to scale to deliver the 2027 goal of 20 $1m-value customers.
Product Innovation: progress against 2025 objectives
The Group's three-year plan defined key product deliverables for 2025, supporting the execution of its longer-term strategy.
1. Develop and launch Tactila HMI solution - ACHIEVED
Three top ten broadcasters have adopted the market leading Rotary Dial technology and are being on-boarded through Q1 and Q2 of 2026. Revenue will commence in H2 2026 as planned, with mass production taking place in Taiwan. We also celebrated several prestigious industry awards in recognition of the innovation and performance of our ProDeck solution.
2. Grow the Core business of Densitron by 10% - STILL IN PROGRESS
The Core Densitron business had a difficult 2024, with both North America and Rest of the World regions being impacted by key components going End of Life (EOL). New business was secured during 2025, however, given Densitron's long product development and customer integration cycles, the revenue impact will be weighted to 2026 and beyond.
3. Develop new Gaming Platforms for the two largest customers - ACHIEVED
We successfully developed and delivered bespoke new platforms for our two largest customers in 2025. Both platforms utilise the latest technology to allow maximum creativity in support of impressive new game content that will drive cabinet sales for them, incorporating the new Quixant computer. The new platform in our historically largest customer is a game changer, however, following the acquisition described above, volumes are expected to reduce in the near term, while presenting a significant opportunity to broaden our relationship with the acquirer.
4. Develop a groundbreaking new Gaming hardware platform - ACHIEVED
The IQON 3 and IQON Air 3 are our next-generation gaming computers, delivering market-leading AMD processing at a highly competitive price point. Available in fan and fanless configurations, they provide greater power and performance, and unlock new market opportunities by supporting a wider range of customer deployments.
Crucially, these solutions were the first we delivered without shortage-driven design compromises, instead engineered for long-term supply chain resilience and incorporating the latest DDR5 memory. The offering was launched in the USA at G2E in October 2025 and brought to the European market at ICE 2026, with strong market feedback and early customer validation.
5. Successful market launch of our software solution Launchpad - ACHIEVED
In 2025, Quixant delivered meaningful innovation in gaming software with the launch of Launchpad, a platform designed to transform how customers deploy and manage gaming content. By enabling customers to outsource both the hardware and software platform, Launchpad allows them to focus resources on game development, supporting stronger content, increased cabinet sales, and higher demand for Quixant solutions.
Launchpad is offered alongside our hardware platforms and provides opportunity to generate recurring revenue for Nexteq. Importantly, the platform also enables online gaming companies to bring their content into land-based environments, opening access to new market opportunities.
Delivering Tactila, ProDeck, IQON 3 and Launchpad demonstrates renewed momentum in product development across Nexteq. We have focused on innovation and clear market differentiation, with the benefits of this investment expected to be realised through 2026 and beyond.
Gaming review - Quixant
Quixant is a market-leading provider of technology solutions to the land-based gaming market, predominantly dealing with game manufacturers that sell slot machines to a range of operators, from Casinos through to individual leisure venues. Quixant supplies gaming computers, monitors and full turnkey cabinets and has expanded its offering to include software platforms - enabling customers to focus their R&D investment on creating better game content.
Our customers succeed through outstanding gameplay and content; Quixant provides the specialist technology that enables game designers to maximise creativity and performance. We offer a broad portfolio spanning different price points and graphics capabilities, underpinned by a common Quixant Software Suite across our computer range. This standardised platform allows customers to deploy different PCs within their estate to match game performance requirements, while maintaining a consistent development and operational environment.
Since 2020, when the Covid pandemic started, Quixant has become expert in managing the impact of component shortages. Through its internal team of engineers, we are able to switch between component manufacturers based on availability, which means that our customers can ensure continuity of supply in supply constrained component circumstances. Component supply issues continued throughout 2025, with DDR4 memory and SSDs the latest challenge as AI-driven demand tightened availability and increased pricing. DDR4 supply was further constrained as the market transitioned to newer standards, with manufacturers prioritising higher-value DDR5 production and phasing DDR4 toward end-of-life. Switching supplier of memory takes considerable engineering resources for us and our customers, and we work with them to minimise the impact of these changes. However, sharply rising costs have impacted percentage margins, as price increases have been passed through to customers without generating incremental margin on the higher cost base. This is an essential element of how we work with our partners - we believe in the long-term benefit of partnership , with a very loyal and stable customer base as a result.
Throughout 2025, Quixant focused on regaining the innovation leadership in the gaming sector. The division made strong progress against this objective through the development of new gaming hardware platforms and the launch of its innovative gaming software offering, described above. This enabled new customer wins and expansion, contributing to revenue growth of 10% to $60.2m (2024: $54.8m), offsetting significant volume reductions from the division's historically largest customer. As a result, Quixant increased its share of Group revenue to 67% in 2025 (2024: 63%). North America continues to be Quixant's largest market, representing 77% of divisional revenue (2024: 75%).
Growth was driven by two key factors: the addition of a new customer in North America, our largest by volume/revenue in 2025, and the successful deployment of turnkey cabinets into the UK market for the first time.
Gross margins were impacted by the DDR4 challenges and the replacement of revenue from our historically largest customer. The supply challenges around DDR4 necessitated the testing of a substantial number of alternative DDR4 solutions to ensure continuity of supply and optimised pricing. This also required coordinating our customers to test the new DDR4 variants to ensure compliance with their regulatory requirements.
The development of the Launchpad software solution is a true piece of gaming innovation and opens up a new opportunity for the business through recurring revenue models, as well as the potential of allowing online game content providers an entry point into the land-based environment. Quixant, as ever, is driving the technology agenda through its unique position in this market.
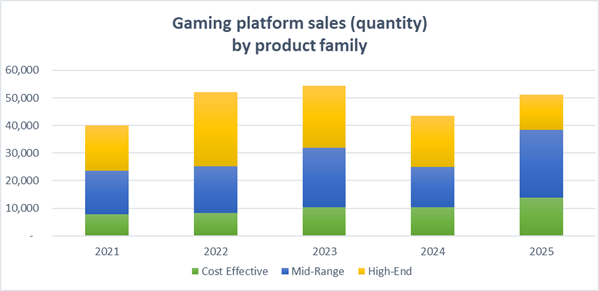
Quixant creates Hardware Platforms relevant to market requirements for power: price ratio. It has three core ranges of solutions:
· IQ: Cost effective range - designed for performance at great prices.
· IQON: Mid-range - more power; drives more screens, offering great performance value.
· QMAX : Customised solutions to ensure maximum performance.
The total number of gaming hardware platforms sold increased significantly in 2025 vs 2024. The 18% increase was driven by a sharp increase in the IQ range as we secured market penetration across the USA and LatAm; and the IQON range introduced a new product with which we secured significant growth from an existing customer, giving a 67% uplift in this mid-range product family. The QMAX solutions declined as a result of the changes in ownership of the historically largest customer.
Industrial Displays review - Densitron
Our Densitron brand is critical to our OneNexteq strategy, where computer backed displays give specific opportunity across multiple target verticals, and will drive growth through the remainder of the three-year plan.
The brand, having celebrated its 50th anniversary, is a true expert in creating advanced HMI solutions and the development and supply of display technologies tailored to customers' specific requirements. Our engineering teams are focused on the development of new IP-based solutions, which we are taking across multiple market verticals. Our supply chain expertise provides customers with a clear advantage in quality, responsiveness and speed to market.
Densitron operates globally, with North America being its largest market. Revenue declined by 6% year-on-year in 2025, driven by EOL component complexity, ongoing customer de-stocking, and tariff-related pressure on customer end markets. Customer engagement remains strong across development cycles, positioning the business well for a recovery as market conditions improve.
Complementing this is a new Sales and Marketing structure designed to provide more presence across the sales regions and specifically targeted campaigns to our target verticals, including Medical and Life Sciences, Test and Measurement and Broadcast and ProAV. These are already showing excellent promise, and the business expects future growth from these market specific campaigns.
Margin management continues to be a focus of the business. Densitron continued its progress increasing margins to a record position after multiple years of margin increase. This is a result of winning new business at strong margins through the delivery of fully integrated display solutions, embedding more of our technology capability into our customers' end products, which adds more value to those products.
Product innovation has delivered the Tactila and ProDeck platforms. Tactila continued its transition from development into commercialisation during 2025, progressing customer wins towards mass production. Consistent with the typically long sales cycles in these markets, revenue is expected to build through 2026, with a focus on converting a strong pipeline for this key innovation.
2026 Focus areas
Nexteq will focus on a core set of objectives to develop our OneNexteq approach and to continuously delight our customers:
|
1. |
Awesome new product delivery. Our Tactila; Launchpad; ProDeck and IQON solutions will be executed flawlessly |
|
2. |
Continued focus on R&D. We are world class engineers. Solving customer problems with new solutions across OneNexteq is what we live for. |
|
3. |
Collaboration. As a global organisation, create and develop exceptional teams who have a customer led approach and who have a 'talk to each other mentality |
|
4. |
Be easy to do business with. Make the business run like clockwork. Do one thing better every day and make the Densitron customer experience continuously amazing. |
|
5. |
Effective supplier management. Working with our suppliers to create new products and solutions which aid our R&D efforts |
Despite the well documented challenges in our markets around component shortages and costs; the impact of tariffs on a business which has most of its business in North America; and the accelerating geopolitical uncertainty, Nexteq is focussing on what it can control and delivering the innovative technology building blocks which can deliver profitable revenue growth for long term shareholder value creation. Nexteq is a business built upon engineering expertise, and utilising the technology skills in the business will deliver an exciting future for the Group.
Duncan Faithfull
Chief Executive Officer
Financial Review
Revenue growth and operating cash flows
Statutory results
Group revenue was $90.2m, 4% higher than the $86.7m delivered in 2024. Gross profit was $29.6m (2024: $31.1m), a reduction of 5% over the prior year, with gross margins at 32.8% (2024: 35.9%). Operating expenses were $27.3m (2024: $30.8m), resulting in operating profit of $2.3m (2024: $0.3m). Net finance income was $0.8m (2024: $1.4m), resulting in profit before tax of $3.2m (2024: $1.7m) and an income tax expense of $1.2m (2024: $1.4m), equivalent to an effective tax rate of 39.0% (2024: 82.0%). Basic earnings per share (EPS) were 3.21cents (2024: 0.48cents), an increase of 569%. Diluted EPS were 3.14cents (2024: 0.48cents), an increase of 554%.
Revenue
Quixant revenues were $60.1m, an increase of 10% on the prior year (2024: $54.8m). Unit sales increased to 51,247 platforms delivered in the year, increasing 18% on the prior year (2024: 43,569). Demand for our mid-range PCs grew substantially, with growth in the cost-effective range also, but there was lower demand for our high-end products in 2025. The increase in overall Quixant revenues was largely due to the increased unit sales.
Densitron delivered revenue of $30.1m, a decrease of 6% on the prior year (2024: $31.9m), with demand continuing to be impacted by end-of-life challenges. New business revenues for Densitron were at substantially higher average selling prices as a result of the Group's focus on delivering full solutions rather than standalone displays.
Gross profit and gross profit margin
The Group generated gross profit during the year of $29.6m (2024: $31.1m) representing a gross margin of 32.8% (2024: 35.9%). Densitron delivered a historic high gross margin supported by new business wins delivering customer solutions at higher margins, whilst Quixant gross margin reduced as a result of customer and product mix changes, and component memory price challenges.
Adjusted operating expenses
Adjusted operating expenses decreased by 3% to $26.8m (2024: $27.8m). See Note 1 to the condensed consolidated financial statements for a reconciliation of adjusted operating expenses to operating expenses. The Group continued to invest in sales activities with travel and marketing spend at $2.4m (2024: $2.6m), the reductions reflecting an increased focus on digital marketing activities. The reductions in headcount implemented at the end of 2024 resulted in average employees reducing to 212 in 2025 from 223 in 2024. Payroll costs were $19.6m, in line with the prior year (2024: $19.6m), reflecting the impact of inflation, performance related bonuses and severance costs off-setting the reduction in headcount.
During the year, Group expenditure on R&D increased to $4.9m (2024: $4.6m). These costs relate to investment activities principally undertaken in Taiwan, Italy, and the UK. Of these costs, $2.3m were capitalised (2024: $1.8m) as the Group continued to focus on developing innovative new products including Launchpad and Tactila, with amortisation for the year on total capitalised development costs of $1.4m (2024: $1.2m). During the year the Group abandoned in-progress development projects with a carrying value of $0.7m (2024: $0.1m). These decisions were taken following internal review, where it was determined that the projects no longer met the criteria to capitalise product development cost as set out in IAS38. These projects were primarily focused on solutions incorporating DDR4 memory where availability and pricing challenges have impacted the viability of the intended products.
Impairment of trade receivables remained low, with an impairment loss recorded in the current year of $0.1m compared with $0.2m in 2024. The Group also recognised exchange rate gains of $0.4m (2024: $0.4m exchange rate gains). Management continued its measures to have natural hedges in place to limit the impact of foreign exchange fluctuations, which were more volatile than the previous financial year.
Adjusted operating expenses also benefited from a $0.1m R&D tax credit (2024: $0.1m charge). Since 2023 the Group qualified for the large company Research and Development Expenditure Credit (RDEC) regime due to the size of the Company's balance sheet. Under the RDEC scheme the tax credits are recognised within operating expenses in line with the R&D expense.
Valuation of Aruze-related assets
Balances related to Aruze Philippines Manufacturing Inc. ('APMI'), have been provided for in previous years, including a receivable balance of $1.0m owed by APMI to the Group arising from the sale of goods. The Group continues to take steps to recover this balance as part of APMI's voluntary liquidation procedure, which has been in progress in the Philippine courts since 22 August 2023.
During the year, the Group sold the final balance of raw materials, which had previously been written down to a value of $0.2m that were originally earmarked for use by APMI. The raw material inventory was sold for its recoverable value of $0.2m. Finished goods with $0.2m (2024: $0.2m) are included in Nexteq Group's balance sheet at 31 December 2025, with $Nil (2024: $2.2m) inventory provision remaining at 31 December 2025 in respect of APMI.
Net finance income
Finance income decreased to $0.8m (2024: $1.4m) as central banks lowered interest rates driving a lower return on the Group's cash balances, alongside a reduction in the average cash balance compared with the previous year. Finance expense of $0.2m (2024: $0.0m) principally related to leases.
Adjusted profit before tax
Adjusted profit before tax reduced by 25% to $3.6m (2024: $4.8m). The adjustments to statutory profit before tax of $0.5m (2024: $3.1m) consisted of:
|
· |
Share-based payments charge of $0.5m (2024: $0.8m credit). During the year, the Group granted further Long-Term Incentive Plan (LTIP) shares to employees. The LTIP awards vest in three years providing continuous employment during the period, and attainment of performance conditions relating to earnings per share (EPS). |
|
· |
Amortisation of acquired intangibles charge of $0.2m (2024: $0.3m). This charge relates to intangible assets recognised in the acquisition of Densitron and IDS. |
|
· |
Gain on disposal of investment property of $0.2m (2024: $Nil). During the year, the Group disposed of an area of land owned by the Group at Blackheath in London. The Group had written off the previously booked value of the land. |
|
· |
On 9 July 2025 the property was sold and cash proceeds of $205,846 were received on disposal. In addition to this, directly attributable legal fees of $4,982 were incurred, resulting in net proceeds of $200,864. |
Taxation
The Group recognised a corporation tax charge of $1.2m in the year, compared with $1.4m in 2024. The tax charge consists of a current tax charge of $1.1m (2024: $0.9m) and a deferred tax charge of $0.1m (2024: $0.5m) relating to the movement in deferred tax assets and liabilities in the current year.
The effective tax rate on statutory profit before tax decreased to 39.0% (2024: 82.0%). The prior year tax rate was higher due to $3.2m of tax losses being derecognised due to uncertainty over the recoverability. Going forward, we expect the effective tax rate to decrease to be approximately 16%−19% as profits increase, depending on the regional mix of profits and product mix sold, which impact the UK patent box claims.
Earnings per share
Basic EPS increased by 569% to 3.21c per share (2024: 0.48c per share). Adjusted diluted earnings per share decreased by 29% to 3.63c per share (2024: 5.08c per share).
Balance sheet
Non-current assets decreased to $20.5m as at 31 December 2025 (31 December 2024: $22.1m) mainly due to the $1.1m reclassification of the Group's property in Balsham, Cambridge as an asset held for sale.
Current assets increased to $68.5m at 31 December 2025 (31 December 2024: $63.4m) mainly due to a significant increase in trade and other receivables to $25.6m at 31 December 2025 from $16.5m at 31 December 2024, reflecting the strong trading activity at the end of the year. This was partly offset by a decrease of Cash and cash equivalents by $4.2m from $29.5m at the start of the year to $25.3m at 31 December 2025.
Cash flow
The Group generated $3.5m cash from operating activities in the year (2024: $13.0m). Adjusted operating cash flow, which excludes tax payments, was $4.1m (2024: $15.5m), which represented 112% of adjusted profit before tax (2024: 324%). This exceeded the Group's 2025 cash conversion KPI target of 100%.
The Group capitalised $2.3m of development costs (2024: $1.8m), which reflects the continued development of new products as the Group expands its product portfolio.
The Group finished 2025 with net cash of $25.0m (2024: $29.1m), comprising cash and cash equivalents of $25.3m (2024: $29.5m) and gross debt of $0.3m (2024: $0.4m). The debt relates to a mortgage over the Group's offices in Taiwan.
Dividend
The Board proposes a dividend for the year ended 31 December 2025 of 3.9p per share (2024: 3.7p per share). This dividend will be payable on 30 May 2026 to all Shareholders on the register on 2 May 2026. The corresponding ex-dividend date is 1 May 2026.
Foreign exchange
The Group reports its results in US Dollars as this is the principal currency in which it trades with customers, with approximately 90% (2024: 93%) of our revenues denominated in US Dollars.
The Group's reported results are impacted by US Dollar movements against currencies in the territories in which it operates, principally Pounds Sterling, Euros and Taiwan Dollars. The following are the average and closing rates for the current and prior year:
|
|
|
Average rate |
|
|
Income statement |
|
2025 |
2024 |
|
USD/GBP |
|
1.32 |
1.28 |
|
USD/Euro |
|
1.13 |
1.08 |
|
USD/TWD |
|
0.032 |
0.031 |
|
|
|
|
|
|
|
|
Closing rate |
|
|
Balance sheet |
|
2025 |
2024 |
|
USD/GBP |
|
1.35 |
1.26 |
|
USD/Euro |
|
1.18 |
1.04 |
|
USD/TWD |
|
0.032 |
0.031 |
As most of the Group's revenues are denominated in US Dollars, the impact of foreign exchange movements on reported revenues was minimal in 2025 and 2024. The impact on foreign exchange movement on profit before tax is mostly due to operating expenses incurred in Pound Sterling and Taiwan Dollars.
The average US Dollar exchange rate against currencies in the territories in which the Group operates for 2025 were similar to 2024 levels, resulting in a negligible impact on adjusted operating expenses, when compared to 2024 average rates. The Group recognised translational foreign exchange rate gains of $0.4m in 2025 (2024: $0.4m exchange rate gain), with $Nil impact year over year.
Alternative performance measures (APMs)
Throughout this preliminary announcement, alternative performance measures (APMs) are used to describe the Group's performance. These are not recognised under UK-adopted international accounting standards or other generally accepted accounting principles (GAAP). When reviewing Nexteq's performance, the Board and management team focus on adjusted results in addition to statutory results.
APMs are non-GAAP measures and provide supplementary information to assist with the understanding of the Group's financial results and with evaluation of operating performance for the periods presented in the preliminary announcement. APMs, however, are not a measure of financial performance under IFRS and should not be considered a substitute for measures determined in accordance with IFRS. APMs have been provided for the following reasons:
1) To present users of the preliminary announcement with a clear view of what we consider to be the results of our underlying operations, enabling consistent comparisons over time and making it easier for users of the report to identify trends.
2) To provide additional information to users of the preliminary announcement about our financial performance or financial position.
3) To show the performance measures that are linked to remuneration for the Executive Directors.
Matt Staight
Chief Financial Officer
CONSOLIDATED STATEMENT OF PROFIT AND LOSS AND OTHER COMPREHENSIVE INCOME
For the years ended 31 December 2025 and 2024
|
|
|
2025 |
2024 |
|
|
Note |
$'000 |
$'000 |
|
Revenue |
3 |
90,227 |
86,678 |
|
Cost of sales |
|
(60,618) |
(55,568) |
|
Gross profit |
|
29.609 |
31,110 |
|
Operating expenses |
|
(27,298) |
(30,809) |
|
Operating profit |
|
2,311 |
301 |
|
Finance income |
|
1,006 |
1,448 |
|
Finance expense |
|
(165) |
(28) |
|
Profit before tax |
|
3,152 |
1,721 |
|
Taxation |
4 |
(1,227) |
(1,410) |
|
Profit for the year |
|
1,925 |
311 |
|
Other comprehensive income/(expense) for the year, net of income tax |
|
|
|
|
Items that are or may be reclassified subsequently to profit or loss: Foreign currency translation differences |
|
1,096 |
(1,449) |
|
Total comprehensive income / (expense) for the year |
|
3,021 |
(1,138) |
|
Basic earnings per share |
5 |
$0.0321 |
$0.0048 |
|
Diluted earnings per share |
5 |
$0.0314 |
$0.0048 |
The Italian subsidiary, Quixant Italia Srl, is 99% owned by the Group. The comprehensive income and equity attributable to the non-controlling interests in this subsidiary are not material.
The consolidated statement of profit and loss and other comprehensive income has been prepared on the basis that all operations are continuing operations.
CONSOLIDATED BALANCE SHEET
As at 31 December 2025 and 2024
|
|
|
Group |
|
|
|
|
|
2025 $'000 |
2024 $'000 |
|
|
Non-current assets |
|
|
|
|
|
Property, plant and equipment |
|
4,643 |
5,688 |
|
|
Intangible assets |
|
11,342 |
11,494 |
|
|
Right-of-use assets |
|
2,025 |
2,403 |
|
|
Investment property |
|
− |
− |
|
|
Investments in Group companies and associated undertakings |
|
− |
− |
|
|
Deferred tax assets |
|
2,425 |
2,476 |
|
|
Trade and other receivables |
|
61 |
61 |
|
|
|
|
20,496 |
22,122 |
|
|
Current assets |
|
16,456 |
|
|
|
Inventories |
|
17,435 |
|
|
|
Trade and other receivables |
|
25,647 |
16,461 |
|
|
Cash and cash equivalents |
|
25,306 |
29,469 |
|
|
Assets held for sale |
|
1,066 |
− |
|
|
|
|
68,475 |
63,365 |
|
|
Total assets |
|
88,971 |
85,487 |
|
|
Current liabilities |
|
(93) |
|
|
|
Loans and borrowings |
|
(87) |
|
|
|
Trade and other payables |
|
(15,456) |
(11,775) |
|
|
Tax payable |
|
− |
- |
|
|
Lease liabilities |
|
(448) |
(501) |
|
|
|
|
(15,997) |
(12,363) |
|
|
Non-current liabilities |
|
|
|
|
|
Loans and borrowings |
|
(191) |
(271) |
|
|
Provisions |
|
(530) |
(355) |
|
|
Lease liabilities |
|
(1,752) |
(1,878) |
|
|
|
|
(2,473) |
(2,504) |
|
|
Total liabilities |
|
(18,470) |
(14,867) |
|
|
Net assets |
|
70,501 |
70,620 |
|
|
Equity attributable to equity holders of the parent |
|
|
|
|
|
Share capital |
|
106 |
106 |
|
|
Treasury shares Share premium |
|
(7,612) 6,747 |
(6,996) 6,747 |
|
|
Share-based payments reserve |
|
1,068 |
888 |
|
|
Retained earnings |
|
71,355 |
72,134 |
|
|
Translation reserve |
|
(1,163) |
(2,259) |
|
|
Total equity |
|
70,501 |
70,620 |
|
CONSOLIDATED STATEMENT OF CHANGES IN EQUITY
FOR THE YEARS ENDED 31 DECEMBER 2025 and 2024
|
|
Share Capital |
Treasury Shares |
Share Premium |
Translation Reserve |
Share-Based Payments |
Retained Earnings |
Total Equity |
|
|
$'000 |
$'000 |
$'000 |
$'000 |
$'000 |
$'000 |
$'000 |
|
Balance at 1 January 2024 |
106 |
- |
6,747 |
(810) |
1,905 |
74,398 |
82,346 |
|
Total comprehensive expense for the year |
- |
|
- |
- |
- |
311 |
311 |
|
Profit for the year |
- |
||||||
|
Other comprehensive expense |
- |
- |
- |
(1,449) |
- |
- |
(1,449) |
|
Total comprehensive expense for the year |
- |
- |
- |
(1,449) |
- |
311 |
(1,138) |
|
Transactions with owners, recorded directly in equity |
|
|
|
|
|
|
|
|
Treasury shares purchased |
- |
(6,996) |
- |
- |
- |
- |
(6,996) |
|
Share-based payment credit |
- |
- |
- |
- |
(751) |
- |
(751) |
|
Deferred tax on share-based payment expense |
- |
- |
- |
- |
21 |
- |
21 |
|
Reserve transfer |
- |
- |
- |
- |
(261) |
261 |
- |
|
Share based payment awards |
- |
- |
- |
- |
(26) |
- |
(26) |
|
Dividend paid |
- |
- |
- |
- |
- |
(2,836) |
(2,836) |
|
Exercise of share options |
- |
- |
- |
- |
- |
- |
- |
|
Total contributions by and distributions to owners |
- |
(6,996) |
- |
- |
(1,017) |
(2,575) |
(10,588) |
|
Balance at 31 December 2024 |
106 |
(6,996) |
6,747 |
(2,259) |
888 |
72,134 |
70,620 |
|
|
Share Capital |
Treasury Shares |
Share Premium |
Translation Reserve |
Share-Based Payments |
Retained Earnings |
Total Equity |
|
|
$'000 |
$'000 |
$'000 |
$'000 |
$'000 |
$'000 |
$'000 |
|
Balance at 1 January 2025 |
106 |
(6,996) |
6,747 |
(2,259) |
888 |
72,134 |
70,620 |
|
Total comprehensive income for the year |
- |
|
- |
- |
- |
1,925 |
1,925 |
|
Profit for the year |
- |
||||||
|
Other comprehensive income |
- |
- |
- |
1,096 |
- |
- |
1,096 |
|
Total comprehensive income for the year |
- |
- |
- |
1,096 |
- |
1,925 |
3,021 |
|
Transactions with owners, recorded directly in equity |
|
|
|
|
|
|
|
|
Treasury shares purchased |
- |
(642) |
- |
- |
- |
- |
(642) |
|
Share-based payment expense |
- |
- |
- |
- |
481 |
- |
481 |
|
Deferred tax on share-based payment expense |
- |
- |
- |
- |
(9) |
- |
(9) |
|
Reserve transfer |
- |
- |
- |
- |
(248) |
248 |
- |
|
Dividend paid |
- |
- |
- |
- |
- |
(2,974) |
(2,974) |
|
Exercise of share options |
- |
26 |
- |
- |
(44) |
22 |
4 |
|
Total contributions by and distributions to owners |
- |
(616) |
- |
- |
180 |
(2,704) |
(3,140) |
|
Balance at 31 December 2025 |
106 |
(7,612) |
6,747 |
(1,163) |
1,068 |
71,355 |
70,501 |
CONSOLIDATED CASH FLOW STATEMENT
FOR THE YEARS ENDED 31 DECEMBER 2025 and 2024
|
|
|
Group |
|
|||
|
|
|
2025 |
2024 |
|
|
|
|
|
|
$'000 |
$'000 |
|
|
|
|
Cash flows from operating activities |
|
1,925 |
|
|
|
|
|
Profit for the year |
|
311 |
|
|
||
|
Adjustments for: |
|
2,185 |
|
|
|
|
|
Depreciation and amortisation |
|
2,151 |
|
|
||
|
Loss on disposal of property, plant and equipment |
|
14 |
118 |
|
|
|
|
Impairment losses on intangible assets |
|
712 |
2,922 |
|
|
|
|
Depreciation of leased assets |
|
702 |
642 |
|
|
|
|
Increase in provision for doubtful debts |
|
109 |
245 |
|
|
|
|
Movement in provisions |
|
150 |
44 |
|
|
|
|
R&D tax (credit)/expense |
|
(121) |
142 |
|
|
|
|
Taxation charge |
|
1,227 |
1,410 |
|
|
|
|
Finance income |
|
(1,006) |
(1,448) |
|
|
|
|
Finance expense |
|
165 |
28 |
|
|
|
|
Exchange rate gains |
|
21 |
234 |
|
|
|
|
Share-based payment expense/(credit) |
|
481 |
(751) |
|
|
|
|
Operating cash flows before movement in working capital |
|
6,564 |
6,048 |
|
|
|
|
(Increase)/Decrease in trade and other receivables |
|
(7,947) |
9,741 |
|
|
|
|
Decrease in inventories |
|
1,533 |
5,745 |
|
|
|
|
Increase/(Decrease) in trade and other payables |
|
3,911 |
(6,020) |
|
|
|
|
|
|
4,061 |
15,514 |
|
|
|
|
Interest paid |
|
(1) |
(13) |
|
|
|
|
Tax paid |
|
(598) |
(2,524) |
|
|
|
|
Net cash from operating activities |
|
3,462 |
12,977 |
|
|
|
|
Cash flows from investing activities |
|
|
|
|
|
|
|
Addition of development costs |
|
(1,744) |
(1,228) |
|
|
|
|
Purchase of property, plant and equipment |
|
(293) |
(980) |
|
|
|
|
Property purchase deposit |
|
(1,517) |
- |
|
|
|
|
Addition of externally purchased intangible assets |
|
(535) |
(650) |
|
|
|
|
Interest received |
|
1,006 |
1,345 |
- |
|
|
|
Net cash used in investing activities |
|
(3,083) |
(1,513) |
|
|
|
|
Cash flows from financing activities |
|
(91) |
|
|
|
|
|
Repayment of borrowings |
|
(87) |
|
|
||
|
Mortgage interest paid |
|
(7) |
(9) |
|
|
|
|
Lease liability interest paid |
|
(151) |
(5) |
|
|
|
|
Payment of lease liabilities principal |
|
(566) |
(709) |
|
|
|
|
Purchase of Treasury shares |
|
(642) |
(6,996) |
|
|
|
|
Exercise of share options |
|
4 |
- |
|
|
|
|
Dividends paid |
|
(2,974) |
(2,836) |
|
|
|
|
Net cash used in financing activities |
|
(4,427) |
(10,642) |
|
|
|
|
Net increase in cash and cash equivalents |
|
(4,048) |
822 |
|
|
|
|
Cash and cash equivalents at 1 January |
|
29,469 |
28,406 |
|
|
|
|
Foreign exchange rate movements |
|
(115) |
241 |
|
|
|
|
Cash and cash equivalents at 31 December |
|
25,306 |
29,469 |
|
|
|
NOTES TO THE CONDENSED CONSOLIDATED FINANCIAL STATEMENTS
1. General information
The financial information set out above and below, does not constitute the company's statutory accounts for the years ended 31 December 2025 or 2024 but is derived from those accounts. Statutory accounts for 2024 have been delivered to the registrar of Companies, and those for 2025 will be delivered in due course. The auditor has reported on those accounts; their reports were (i) unqualified, (ii) did not include a reference to any matters to which the auditor drew attention by way of emphasis without qualifying their report, and (iii) did not contain a statement under section 498 (2) or (3) of the Companies Act 2006.
While the financial information included in this preliminary announcement has been prepared in accordance with the recognition and measurement criteria of UK-adopted international accounting standards and as applied in accordance with the provisions of the Companies Act 2006, this announcement does not itself contain sufficient information to comply with UK-adopted international accounting standards. The Company expects to publish full Financial Statements that comply with UK-adopted international accounting standards during March 2026.
Going concern
The Group's operational and financially robust position is supported by:
|
- |
Positive operating cash generation, leading to a net cash balance of $25.0m at 31 December 2025 (31 December 2024: $29.1m). |
|
- |
The Group returned $3.6m (2024: $9.8m) to shareholders through its annual dividend and share buyback programme. |
In undertaking a going concern assessment, the Directors have reviewed financial projections for a period of at least twelve months from the date of this report (the assessment period). Management prepared a base case scenario based on the approved budget for 2026 and forecasts for the first three months of 2027. Management also prepared a severe but plausible downside scenario, using the following key assumption:
- A 25% reduction in 2026 and 2027 Quixant revenues to replicate the impact that a downturn similar to that experienced in 2019 would have on the Group's revenues.
In this scenario, the Group continues to have sufficient cash reserves and working capital to continue operating as a going concern through the review period.
While the Directors have no reason to believe that customer revenues and receipts will decline to the point that the Group no longer has sufficient resources to fund its operations, should this occur, the Group would look to take out additional funding facilities, as well as making further reductions in controllable costs. There would also be an opportunity to sell certain property and inventory assets to accelerate cash generation and/or mitigate risk.
Consequently, the Directors are confident that the Group and Company will have sufficient funds to continue to meet its liabilities as they fall due for at least 12 months from the date of approval of the financial statements (17 March 2026) and, therefore, have prepared these financial statements on a going concern basis.
Use of judgements and estimates
The preparation of financial information in conformity with UK-adopted international accounting standards requires the use of certain critical accounting estimates. It also requires management to exercise its judgement in the process of applying the Group accounting policies. The areas involving a higher degree of judgement and estimation relate to the recoverability of goodwill, valuation of Quixant CGU inventory, capitalisation of development costs and deferred tax asset recognition. Estimates and underlying assumptions are reviewed on an annual basis. Revisions to estimates are recognised prospectively.
Significant estimates
Recoverability of goodwill
The estimated recoverable amounts of CGUs have been determined based on the higher of value-in-use calculations and fair value less costs to sell. These calculations require the use of estimates and assumptions that are subjective due to the inherent uncertainty involved in forecasting and discounting future cash flows. Reasonably possible changes to the assumptions in the future may lead to material adjustments to the carrying value of CGUs.
Quixant inventory valuation in the Quixant CGU
Inventories, which comprise goods held for resale, are stated at the lower of cost and net realisable value, on a weighted average cost basis. The estimated recoverable amount of the inventory balance in the Quixant CGU for the Group financial statements and in the Parent Company financial statements is subjective, due to the inherent uncertainty involved in forecasting of future sales. Provisions are made to write down any slow-moving or obsolete inventory to net realisable value.
As at 31 December 2025, the Group balance sheet and Parent company balance sheet included Quixant inventory of $13.9m (2024: $13.9m) and $10.5m (2024: $10.6m) respectively. The provision against slow-moving and obsolete inventory for the Group as at 31 December 2025 is $3.3m (2024: $4.9m) and in the Parent company is $2.5m (2024: $4.4m). A difference of 5.0% in the provision as a percentage of gross inventory would give rise to a difference of +/- $0.8m in gross margin. The choice of a 5.0% change for the determination of sensitivity represents the change to the level of provisioning for the prior year.
Deferred tax asset recognition
A deferred tax asset is recognised only to the extent that it is probable that sufficient taxable profits will be available to utilise the temporary difference. The Group has made estimates on the likelihood that future taxable profit will utilise the tax losses, meaning the deferred tax assets being realised by the Group is contingent upon the estimates regarding future tax profits of the Group in the jurisdiction where the loss exists. At the reporting date, the Group had unused tax loss of $15.3m (2024: $16.8m) available for offset against future profits.
In order to support the recognition of $3.1m (2024: $3.4m) deferred tax asset on losses, modelling was undertaken to review the recovery period of the deferred tax asset. The modelling was based on management forecasts for the subsequent five years and showed that the deferred tax asset on losses is expected to be fully recovered by 2030. A probability weighted model was used to determine the loss recoverability.
This modelling is judgemental given the forward-looking nature of performance, taking into account inherent uncertainties constraining the expected level of profit as appropriate. Changes in the estimates will affect future taxable profits and therefore the recoverability of the deferred tax assets. The value of unrecognised tax losses in the UK as at 31 December 2025 is $3.2m (2024: $3.2m). The losses may be carried forward indefinitely.
Reconciliation of adjusted performance measures
The Group uses certain alternative performance measures to evaluate performance and as a method to provide Shareholders with clear and consistent reporting. The Directors consider that these represent a more consistent measure of performance by removing items of income or expense that are considered significant by virtue of their size, nature or incidence or which have a distortive effect on current year earnings and are relevant to an understanding of the Group's financial performance, cash generation and liquidity position. These measures include Adjusted Profit before tax, Adjusted Profit after tax, Adjusted Operating expenses, Adjusted EBITDA, Adjusted Operating cash flow and Net cash. The adjusted measures are not defined terms under IFRS and may therefore not be comparable with similarly titled measures reported by other companies. They are not intended to be a substitute for, or superior to, IFRS measures. See below for analysis of the adjusting items in reaching adjusted performance measures.
Adjusted Profit before tax
|
|
2025 |
2024 |
|
|
$'000 |
$'000 |
|
Profit before tax |
3,152 |
1,721 |
|
Adjustments: |
|
|
|
Amortisation of customer relationships, technology and order backlog1 |
182 |
271 |
|
Share-based payments expense/(credit)2 |
481 |
(751) |
|
Restructuring charges3 |
- |
665 |
|
Impairment of goodwill4 |
- |
2,873 |
|
Gain on disposal of investment property5 |
(201) |
- |
|
Adjusted Profit before tax |
3,614 |
4,779 |
|
Adjusted Profit before tax % (Adjusted Profit before tax/Revenue) |
4.0% |
5.5% |
1. The amortisation of customer relationships, technology and order backlog has been excluded as it is not a cash expense to the Group.
2. Share-based payments expense/(credit) has been excluded as it is not a cash-based expense/(credit).
3. Restructuring charges relates to leaver costs incurred in headcount reduction actions taken in December 2024.
4. The impairment of goodwill has been excluded as it is not a cash expense to the Group.
5. The gain on disposal of investment property has been excluded as it is non-recurring item.
Adjusted Profit after tax
|
|
|
|
|
|
2025 |
2024 |
|
|
$'000 |
$'000 |
|
Profit after tax |
1,925 |
311 |
|
Adjustments: |
|
|
|
Amortisation of customer relationships, technology and order backlog1 |
182 |
271 |
|
Share-based payments expense2 |
481 |
(751) |
|
Restructuring charges3 |
- |
665 |
|
Impairment of goodwill4 |
- |
2,873 |
|
Gain on disposal of investment property5 |
(201) |
- |
|
Non-recurring tax benefits6 |
(166) |
(46) |
|
Adjusted Profit after tax |
2,221 |
3,323 |
6. Tax on adjusted items relating to amortisation of customer relationships, technology and order backlog of $Nil (2024: $Nil), share-based payment expense of $0.5m (2024: credit of $0.8m) and restructuring charges of $Nil (2024: $0.7m).
Adjusted Operating expenses
|
|
|
|
|
|
2025 |
2024 |
|
|
$'000 |
$'000 |
|
Operating expenses |
(27,298) |
(30,809) |
|
Adjustments: |
|
|
|
Amortisation of customer relationships, technology and order backlog1 |
182 |
271 |
|
Share-based payments expense/(credit)2 |
481 |
(751) |
|
Restructuring charges3 |
- |
665 |
|
Impairment of goodwill4 |
- |
2,873 |
|
Gain on disposal of investment property5 |
(201) |
- |
|
Adjusted Operating expenses |
(26,836) |
(27,751) |
Adjusted EBITDA
|
|
2025 |
2024 |
|
|
$'000 |
$'000 |
|
Adjusted Profit before tax |
3,614 |
4,779 |
|
Adjustments: |
|
|
|
Interest |
(841) |
(1,420) |
|
Depreciation |
1,174 |
1,094 |
|
Amortisation |
2,242 |
1,476 |
|
Adjusted EBITDA |
6,189 |
5,929 |
Adjusted Operating cash flow
|
|
2025 |
2024 |
|
|
$'000 |
$000 |
|
Net cash from operating activities |
3,462 |
12,972 |
|
Add back: |
|
|
|
Tax paid |
598 |
2,524 |
|
Adjusted Operating cash flow |
4,060 |
15,496 |
|
Adjusted Operating Cash conversion % (Adjusted operating cash flow/Adjusted profit before tax) |
112% |
324% |
Net cash
|
|
Group |
Company |
||
|
|
2025 |
2024 |
2025 |
2024 |
|
|
$'000 |
$'000 |
$'000 |
$'000 |
|
Analysis of net cash |
|
|
|
|
|
Cash and bank balances |
25,306 |
29,469 |
20,284 |
25,212 |
|
Bank loans falling due within one year |
(93) |
(87) |
(93) |
(87) |
|
Bank loans falling due after more than one year |
(191) |
(271) |
(191) |
(271) |
|
Net cash |
25,022 |
29,111 |
20,000 |
24,854 |
2. Business and geographical segments
The Chief Operating Decision Maker (CODM) in the organisation is an executive management committee comprising the Board of Directors. The segmental information is presented in a format consistent with management information. The Group assesses the performance of the segments based on a measure of revenue and operating profit. The segmental split of the balance sheet is not reviewed by the CODM, and they do not look at assets/liabilities of each division separately but combined as a group. Therefore, this split for assets has not been included.
The operating segments applicable to the Group are as follows:
|
· |
Quixant - Design, development and manufacturing of gaming platforms and display solutions for the casino gaming and slot machine industry. |
|
· |
Densitron - Sale of electronic display products to global industrial markets. IDS is included in the Densitron reporting segment, since the nature of IDS business, the products that are sold and the market that the business operates in are all consistent with that segment. |
Reconciliation of segment results to profit after tax:
|
|
2025 |
2024 |
|
|
$'000 |
$'000 |
|
Quixant |
11,432 |
12,100 |
|
Densitron |
4,944 |
3,152 |
|
Segment results |
16,376 |
15,252 |
|
Corporate cost |
(14,065) |
(14,952) |
|
Operating profit |
2,311 |
301 |
|
Net finance income/(expense) |
841 |
1,420 |
|
Profit before tax |
3,152 |
1,721 |
|
Taxation |
(1,227) |
(1,410) |
|
Profit after tax |
1,925 |
311 |
|
|
|
Year to 31 December 2025 |
|
Year to 31 December 2024 |
||||||||
|
|
|
$'000 |
|
$'000 |
|
$'000 |
|
$'000 |
|
$'000 |
|
$'000 |
|
|
|
Quixant |
|
Densitron |
|
Total1 |
|
Quixant |
|
Densitron |
|
Total1 |
|
Other information |
|
|
|
|
|
|
|
|
|
|
|
|
|
Depreciation of owned assets |
|
132 |
|
14 |
|
146 |
|
110 |
|
11 |
|
121 |
|
Amortisation of intangible assets |
|
992 |
|
402 |
|
1,394 |
|
847 |
|
387 |
|
1,234 |
|
Impairment of intangible assets2 |
|
712 |
|
- |
|
712 |
|
- |
|
2,922 |
|
2,922 |
|
|
|
1,836 |
|
416 |
|
2,252 |
|
957 |
|
3,320 |
|
4,277 |
1 Depreciation and amortisation of $1,165k (2024: $796k) were not allocated to segments as these are considered corporate costs.
2 Includes impairment of Densitron CGU Goodwill of $Nil (2024: $2,873k impairment of Densitron Europe CGU).
3. Analysis of revenue
|
|
|
2025 |
|
2025 |
|
2025 |
|
2024 |
|
2024 |
|
2024 |
|
|
|
|
$'000 |
|
$'000 |
|
$'000 |
|
$'000 |
|
$'000 |
|
$'000 |
|
|
|
|
Quixant |
|
Densitron1 |
|
Total |
|
Quixant |
|
Densitron1 |
|
Total |
|
|
By primary geographical market |
|
|
|
|
|
|
|
|
|
|
|
|
|
|
Asia |
|
2,926 |
|
8,453 |
|
11,379 |
|
1,727 |
|
8,286 |
|
10,013 |
|
|
Australia |
|
397 |
|
66 |
|
463 |
|
1,870 |
|
30 |
|
1,900 |
|
|
UK |
|
2,307 |
|
2,969 |
|
5,276 |
|
2,805 |
|
2,062 |
|
4,867 |
|
|
Europe excl. UK |
|
7,787 |
|
7,946 |
|
15,733 |
|
6,656 |
|
8,711 |
|
15,367 |
|
|
North America |
|
46,640 |
|
9,106 |
|
55,746 |
|
41,301 |
|
11,619 |
|
52,920 |
|
|
Rest of World |
|
107 |
|
1,523 |
|
1,630 |
|
407 |
|
1,204 |
|
1,611 |
|
|
|
|
60,164 |
|
30,063 |
|
90,227 |
|
54,766 |
|
31,912 |
|
86,678 |
|
1 2025 Densitron revenue from products splits into Densitron $29.0m (2024: $31.0m) and IDS $1.1m (2024: $0.9m). IDS revenue included service revenue of $0.5m (2024: $0.4m) recognised throughout the performance period.
The above analysis includes sales to individual countries in excess of 10% of total turnover of:
|
|
2025 |
2024 |
|
|
$'000 |
$'000 |
|
USA |
54,800 |
51,840 |
Three customers (2024: two customers) individually accounted for more than 10% of Group revenues in 2025, with revenues of $13.5m (2024: $1.9m), $11.8m (2024: $9.0m) and $11.7m (2024: $22.2m), respectively. These revenues are attributable to the Quixant segment.
4. Taxation
Recognised in the profit and loss account
|
|
2025 |
2024 |
|
|
$'000 |
$'000 |
|
Current tax expense |
- |
|
|
UK corporation tax |
3 |
|
|
Foreign tax |
1,211 |
1,063 |
|
Adjustments for prior years |
(43) |
(152) |
|
Current tax expense |
1,168 |
914 |
|
Deferred tax |
(223) |
|
|
Origination and reversal of temporary differences |
350 |
|
|
Adjustments for prior years |
282 |
136 |
|
Change in deferred tax rate |
- |
10 |
|
Deferred tax |
59 |
496 |
|
Total tax expense in the income statement |
1,227 |
1,410 |
Reconciliation of effective tax rate
|
|
2025 |
2024 |
|
|
$'000 |
$'000 |
|
Profit for the year |
1,925 |
311 |
|
Total taxation expense |
1,227 |
1,410 |
|
Profit excluding taxation |
3,152 |
1,721 |
|
Tax using the UK corporation tax rate of 25% (2023: 23.52%) |
788 |
430 |
|
Non-deductible expenses |
118 |
96 |
|
Fixed asset differences |
62 |
81 |
|
|
|
|
|
Patent box tax relief1 |
(338) |
(1,187) |
|
Foreign tax expensed |
302 |
296 |
|
Capital gains |
26 |
- |
|
Change in deferred tax rate to 25% |
- |
10 |
|
Effect of tax rates in foreign jurisdictions |
67 |
(14) |
|
Unrecognised tax losses |
- |
811 |
|
Deferred tax credited directly to equity |
9 |
21 |
|
Change to estimates related to prior years |
239 |
(16) |
|
Impairment of goodwill |
- |
718 |
|
Other |
(46) |
164 |
|
Total taxation expense in statement of profit and loss |
1,227 |
1,410 |
1 The Group has elected into the UK patent box regime under which patent box profits from certain patents are taxed at a reduced rate of corporation tax.
Deferred tax credit arising in the reporting period and not recognised in net profit or loss or other comprehensive income but directly credited to equity:
|
|
2025 |
2024 |
|
|
$'000 |
$'000 |
|
Deferred tax asset - share-based payments |
(9) |
(21) |
|
Total |
(9) |
(21) |
5. Earnings per ordinary share (EPS)
|
|
2025 |
2024 |
|
|
$'000 |
$'000 |
|
Earnings |
|
|
|
Earnings for the purposes of basic and diluted EPS being net profit attributable to equity shareholders |
1,925 |
311 |
|
Number of shares |
Number |
Number |
|
Weighted average number of ordinary shares for the purpose of basic EPS |
59,975,348 |
65,002,312 |
|
Effect of dilutive potential ordinary shares: |
1,249,656 |
|
|
Share options |
369,742 |
|
|
Weighted number of ordinary shares for the purpose of diluted EPS |
61,225,004 |
65,372,054 |
|
Basic earnings per share |
$0.0321 |
$0.0048 |
|
Diluted earnings per share |
$0.0314 |
$0.0048 |
|
Calculation of adjusted diluted earnings per share: |
$'000 |
$'000 |
|
Earnings |
|
|
|
Earnings for the purposes of basic and diluted EPS being net profit attributable to equity shareholders |
1,925 |
311 |
|
Adjustments |
|
|
|
Amortisation of customer relationships, technology and order backlog |
182 |
271 |
|
Share-based payments expense |
481 |
(751) |
|
Restructuring charges |
- |
665 |
|
Impairment of goodwill |
- |
2,873 |
|
|
(201) |
- |
|
|
2,387 |
3,369 |
|
Tax effect of adjustments |
(166) |
(46) |
|
Adjusted earnings |
2,221 |
3,323 |
|
Adjusted basic earnings per share |
$0.0370 |
$0.05111 |
|
Adjusted diluted earnings per share |
$0.0363 |
$0.05088 |
6. Post balance sheet events
The Group's second share buyback programme approving the repurchase of up to 5,990,849 shares, launched at the end of 2025. This did not result in any shares being repurchased before 31 December 2025 under this programme. After the reporting date, the Company has purchased 3,984,263 ordinary shares as at 17 March 2026 under the programme for an aggregate consideration of $3.9m. Shares repurchased under the share buyback programme are held in treasury.
The Company, through its Taiwan branch, made an offer in December 2025 for the purchase of a new office in Taipei, Taiwan. This non-binding offer included a returnable guarantee deposit of $0.2m, with a further $1.6m deposit transferred before 31 December 2025. This total of $1.8m was included within prepayments at the reporting date.
In 2026, a further $1.5m deposit has been paid. Following Board approval, on 6th March 2026 the property acquisition was completed for a total consideration of $15.5m, with $12.2m funding provided through a new mortgage facility with TCB bank. The mortgage funding is secured on a 20-year repayment with an interest rate of 1.95%.
On 10th March 2026, the Company entered into agreement to sell its existing property in Taipei for consideration of $3.7m. The transaction is scheduled to complete towards the end of 2026, once the Company has moved into its new office.
There were no other material post balance sheet events that were required to be disclosed.
RNS may use your IP address to confirm compliance with the terms and conditions, to analyse how you engage with the information contained in this communication, and to share such analysis on an anonymised basis with others as part of our commercial services. For further information about how RNS and the London Stock Exchange use the personal data you provide us, please see our Privacy Policy.


Latest directors dealings
- 4 minutes ago Coca-Cola HBC AG (CDI)
- 4 minutes ago HGCapital Trust
- 1 hour ago Nexteq
- 2 hours ago 3i Group
- 2 hours ago Jardine Matheson Holdings Ltd (Singapore Reg)