Quarterly NAV & Operating Update
Summary by AI BETAClose X
LEI: 213800ZPHCBDDSQH5447
18 February 2026
NextEnergy Solar Fund Limited
("NESF" or "the Company")
Unaudited Quarterly Net Asset Value & Operational Update
NextEnergy Solar Fund, a leading specialist investor in solar energy and energy storage, announces it has today published its unaudited Q3 Net Asset Value and Operational Update for the period ended 31 December 2025.
Tony Quinlan, Chairman of NextEnergy Solar Fund Limited, commented:
"NESF's portfolio continues to demonstrate its underlying resilience during what has traditionally been a seasonally softer period for solar generation. Despite lower winter irradiation and the impact of revised power price forecasts on our NAV, the Company remains on track to deliver its full year dividend target of 8.43p per ordinary share. The Government's recent confirmation to shift ROC and FiT inflation indexation from RPI to CPI has introduced an additional headwind; however, with clarity now emerging, we are confident that NESF is well positioned to navigate this transition through the strength of its diversified portfolio and disciplined capital management approach.
Looking ahead, the Board remains focused on ensuring NESF continues to deliver long‑term value for shareholders. Our strategic review is progressing well, and we look forward to sharing a comprehensive update with investors in March."
Key Highlights: 1 October 2025 - 31 December 2025
Financial:
· Net Asset Value ("NAV") per Ordinary Share of 84.9p (30 September 2025: 88.8p), primarily driven by a reduction in power price forecasts from third-party consultants.
· Including the post period impact of the UK Government's retrospective change to ROC and FiT inflation indexation from RPI to CPI, NAV per Ordinary Share as at 31 December 2025 would be 82.9p. This adjustment will be reflected in the 31 March 2026 year end NAV update.
· Ordinary Shareholders' NAV of £488.4m (30 September 2025: £510.9m).
· Gross Asset Value of £997m (30 September 2025: £1,029m).
· Financial debt gearing (excluding Preference Shares) of 29.5% 1 (30 September 2025: 29.4% 1).
· Total gearing (including Preference Shares) of 49.9% 2 (30 September 2025: 49.2% 2).
· Weighted average cost of debt (including Preference Shares) of 4.9% (30 September 2025: 4.9%).
· Weighted average cost of capital of 6.6% (30 September 2025: 6.6%).
· Weighted average discount rate across the portfolio of 8.0% (30 September 2025: 8.0%).
Dividend:
· Total dividends declared of 2.11p per Ordinary Share for the quarter (31 December 2024: 2.11p).
· The Board reconfirms the Company's full-year dividend target guidance for the year ending 31 March 2026 remains unchanged at 8.43p per Ordinary Share (31 December 2024: 8.43p).
· Dividend cover for the full-year is forecast to be covered in a range of 1.1x - 1.3x by earnings post-debt amortisation.
· Since inception the Company has declared total Ordinary Share dividends of £431m, the equivalent to 82.6p per Ordinary Share.
Portfolio:
· 101 3 operating assets (30 September 2025: 101 3).
· Total installed capacity of 939MW 4 (30 September 2025: 939MW 4).
· Remaining weighted asset life of 24.0 years (30 September 2025: 24.3 years).
· Irradiation in the UK was 9.3% below budget, resulting in electricity generation being 12.9% below budget excluding DNO outages. As a reminder, this period is typically a low‑impact quarter for the Company's revenues due to the seasonality of solar generation, with the darker winter months normally resulting in reduced irradiation and lower operational performance.
Strategic Options Review & Presentation:
· The strategic review is progressing well. The Board will provide an update to the market on the 11 March 2026.
· As part of this update, the Company will hold a strategy seminar presentation for both investors and sell-side analysts at the London Stock Exchange, that will also be livestreamed online:
o Start time: 10:30 GMT
o Date: Wednesday 11 March 2026
o Duration: 2 hours
o Location: The London Stock Exchange, 10 Paternoster Square, London, EC4M 7LS
o Registration & Webcast link: [Register here]
· If you wish to attend in-person, please email ir@nextenergysolarfund.com to confirm your registration due to security requirements and limited capacity at the venue.
· A recording of the presentation will be made available shortly after the event on the Company's website as well as the London Stock Exchange website.
Capital Recycling Programme:
· The remaining phase of the Capital Recycling Programme for the sale of two solar assets totalling 100MW continues to progress and the Company will publish further updates in due course.
· To date, the Capital Recycling Programme has:
o Sold three asset sales totalling c.145MW of capacity from the 245MW Programme.
o Raised £72.5m total capital.
o Added a total NAV uplift of 2.76p per Ordinary Share.
Capital Structure:
· As at 31 December 2025:
|
Debt facilities |
Original size (£m) |
Amount outstanding (£m) |
|
Long-term amortising debt |
£212.5m |
£135.8m |
|
Short-term RCF |
£205.0m |
£151.9m |
|
Total financial debt |
|
£287.7m |
|
Preference shares |
£200.0m |
£198.6m |
|
Total debt |
|
£486.3m 5 |
· Short-term RCF drawn of £151.9m (30 September 2025: £151.9m).
· Long-term amortising debt paid down by £8.0m in the period (30 September 2025 YTD: £3.5m).
· The remaining outstanding long-term debt of £135.8m is on track to fully amortise in line with the remaining subsidy life of the portfolio's inflation linked government subsidies.
· Of the Company's total debt of £486.3m 5:
o 69% remains at a fixed rate of interest (including the Preference Shares).
o 31% remains at a floating rate of interest via the short-term RCF.
· Total look-through debt of £22.8m (30 September 2025: £23.4m). This represents the total combined short and long-term debt in the Company's investment into NextEnergy III LP, and its two co-investments (Agenor and Santarém) on a look-through equivalent basis.
Preference Share Ratio:
· As announced at the interim results, as part of the preference share issue, the Company is required to assess the three-month average Market Capitalisation against debt in order to determine gearing based on enterprise value (the "EV gearing ratio").
· Given the continued challenges in the equity market and current ordinary share price discount, the EV gearing ratio as at 31 December 2025 was above the 50% limit at 60.1% (54.8% at 30 September 2025). However, as explained in the interim results, it does not impact on the Company's current operations or strategy.
· The current debt-to-GAV ratio stands at 49.9% 2, versus the investment policy limit of 50%.
· The Company remains confident that it will reduce the ratio below the 50% threshold through planned asset disposals and use of the proceeds from sales to pay down the short-term RCF.
ESG & Sustainability:
· The Company continued to maintain its Article 9 Fund classification under the EU Sustainable Finance Disclosure Regulation and EU Taxonomy Regulation.
· The Company and its Investment Adviser continue to implement activities in support of its Approach to Nature strategy benefiting biodiversity across NESF sites and continue to support industry action on supply chain sustainability, including the Solar Stewardship Initiative.
· NextEnergy Capital, the Investment Adviser, published its 2024 Sustainability and ESG report late last year, including NEC's first combined disclosure under the International Sustainability Standards Board ("ISSB") and Taskforce for Nature related Financial Disclosures ("TNFD"). Link to full report here.
ROC/FiT Indexation Consultation Outcome:
· As announced 28 January 2026, the Government has confirmed it intends to pursue Option 1 - an immediate switch to CPI indexation from RPI.
· As such, if the CPI measure as at 31 December 2025 were to be applied to ROC and FiT prices, the impact to NESF as at its 31 December 2025 NAV would be as follows:
|
Impact on NAV per Ordinary Share |
% impact on NAV |
|
-2p |
-2% |
· The UK Government intends to change the inflation measure for ROC buy-out prices and FiT prices from RPI to CPI, effective from April 2026. This change will be reflected in the 31 March 2026 year end NAV update.
Ross Grier, Chief Investment Officer of NextEnergy Capital said:
"NESF's portfolio continues to perform in line with expectations and demonstrate resilience. Although the sector faces near‑term pressure from power price adjustments and shifting inflation expectations, long‑term fundamentals remain robust, supported by growing demand for secure clean energy and the critical role solar plays in the UK's energy transition. Against this backdrop, NESF's diversified and well‑managed portfolio continues to deliver stable underlying performance and long‑term value for shareholders."
Q3 Quarterly NAV Bridge Breakdown:
|
|
NAV per ordinary share |
NAV |
|
At 30 September 2025 |
88.8p |
£510.9m |
|
Time value |
2.0p |
£11.3m |
|
Project actuals |
0.6p |
£3.5m |
|
Solar power price forecasts |
(2.0p) |
(£11.4m) |
|
BESS revenue forecasts |
(0.1p) |
(£0.6m) |
|
Changes in short-term inflation |
(0.6p) |
(£3.2m) |
|
Revaluation of NextEnergy III LP investment + co-investments |
(0.1p) |
(£0.4m) |
|
Cash dividends paid |
(2.5p) |
(£14.5m) |
|
Fund OPEX |
(0.3p) |
(£1.5m) |
|
Capital movements (no net NAV impact) |
|
|
|
- New assets at cost |
0.3p |
£1.8m |
|
- Cash on hand to fund investment & RCF repayment |
(0.3p) |
(£1.8m) |
|
- Proceeds from RCF net of cash used |
0.0p |
£0.0m |
|
Other movements in residual value |
(0.9p) |
(£5.7m) |
|
At 31 December 2025 |
84.9p |
£488.4m |
The movement in the NAV over the period was driven primarily by the following factors.
NAV accretive movements:
· Time Value: The time value reflects the change in the valuation as a result of changing the valuation date, prior to adjusting for any outflows of the Company. The increase in value is attributable to the unwinding of the discount applied to cash flows for the period when calculating the discounted cash flow.
· Project Actuals: Although generation for the quarter was below budget, Q3 is typically a low‑impact period for revenues due to the seasonal reduction in solar irradiation during the darker winter months. The overall project actuals remained positive, primarily driven by the timing of ROC recycle receipts received within the period, which offset the lower generation performance.
NAV deductive movements:
· Cash Dividends Paid: The dividends paid during the period, including both Ordinary and Preference Share dividend payments.
· Solar Power Price Forecasts: A decrease in UK power price forecasts provided by third-party consultants, driven by a downwards revision of forecast demand by one consultant across the forecast period and a downwards revision of gas price forecasts in the short-term (2025-2030). See power curve assumptions graph below.
· BESS Revenue Forecasts: A decrease in BESS revenue forecasts provided by a third-party consultant.
· Inflation Forecasts: A slight decrease in short-term inflation assumptions up to 2029. The Company continues to take a consistent approach to its inflation assumptions, using external third-party, independent inflation data from HM Treasury Forecasts and long-term implied rates from the Bank of England for its UK assets. For international assets, IMF forecasts are used. Long-term assumptions are aligned with market consensus including transition to CPI from 2030. See breakdown of UK inflation assumptions below.
· Revaluation of NextEnergy III LP & Co-investments: Movements in the fair value of the holding in NextEnergy III LP and the two co-investments reflecting updates to power price and curtailment forecasts provided by third-party consultants.
· Other Residual Value Movements: Includes changes in OPEX assumptions, FX rates, incremental capex forecasts, planned outages, and capital expenditure provisions for asset health, such as repowering inverters and module replacements, and other non-material movements.
Inflation Rate (UK RPI) Assumptions
|
Calendar Year |
31 December 2025 |
30 September 2025 |
|
2025/26 |
4.10% (published) |
4.50% |
|
2026/27 |
3.10% |
3.30% |
|
2027/28 |
Unchanged |
3.20% |
|
2028/29 |
3.20% |
3.30% |
|
2029/30 |
Unchanged |
3.10% |
|
2030/31 onwards |
Unchanged |
2.25% |
Discount Rate Assumptions
|
|
|
31 December 2025 |
30 September 2025 |
|
Solar |
UK unlevered |
Unchanged |
7.50% |
|
UK levered |
Unchanged |
8.20% - 8.50% |
|
|
Italy unlevered 6 |
Unchanged |
9.00% |
|
|
Subsidy-free (uncontracted) 7 |
Unchanged |
8.50% |
|
|
Life extensions 8 |
Unchanged |
8.50% - 9.50% |
|
|
Energy Storage |
Uncontracted |
Unchanged |
10.00% |
|
Contracted |
Unchanged |
7.00% |
Power Curve Assumptions
31 December 2025: Blended Power Curves (Capture Price)
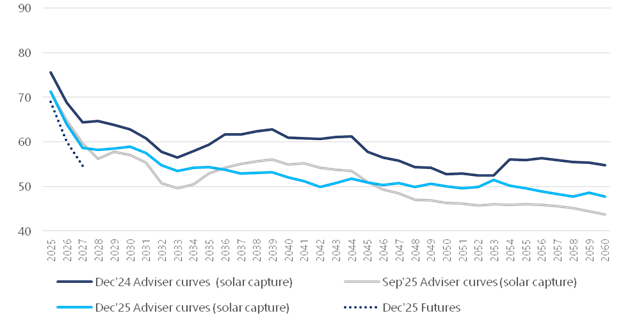
Methodology: For the UK portfolio, the Company uses multiple sources for UK power price forecasts. Where power has been sold at a fixed price under a Power Purchase Agreement ("PPA") (a hedge), these known prices are used. For periods where no PPA hedge is in place, short-term market forward prices are used. After two years, the Company integrates a rolling blended average of leading independent energy market consultants' long-term central case projections. The blend of forecasts reduces volatility, presenting a fair and balanced outlook consistent with pricing methodologies used for successfully divested assets and power price assumptions across the broader peer group.
For the Italian portfolio, PPAs are used in the forecast where these have been secured. In the absence of hedges, a leading independent energy market consultant's long-term projections are used to derive the power curve adopted in the valuation.
Drivers of power price movement: A decrease in UK power price forecasts provided by third-party consultants, driven by a downwards revision of forecast demand by one consultant across the forecast period and a downwards revision of gas price forecasts in the short-term (2025-2030).
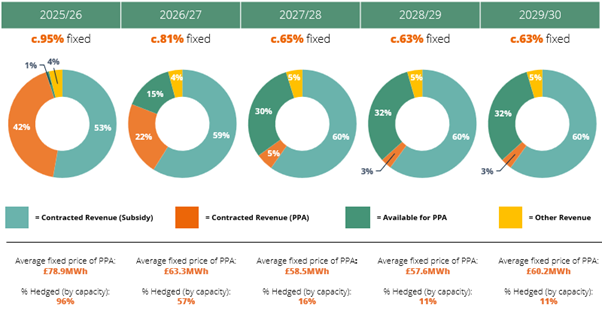
Power Purchase Agreement Strategy
Approximately c.50% of NextEnergy Solar Fund's revenues come from RPI-linked government-backed subsidies. The remaining c.50% of revenues are secured through NextEnergy Solar Fund's PPA strategy where the Company secures PPAs over a rolling 36-month period. This proactive risk mitigation helps secure and underpin both dividend commitments and dividend cover whilst reducing volatility and increasing the visibility of cash flows.
Forecasted Total Revenue Breakdown 9:
Future Pipeline
The Company owns the project rights for, or has exclusivity over, a carefully selected immediate pipeline of development projects in utility-scale solar and UK energy storage assets.
NESF owned pipeline:
· Camilla battery augmentation from 1hr to 2hr duration (site pre-engineered);
· 250MW 2hr duration battery called Project Lion at ready to build ("RTB") stage with connection projected for 2029;
· 60MW solar PV in development in Wales (possible RTB horizon 2026); and
· 350MW solar PV in development in Wales (possible RTB horizon 2028).
NESF also benefits from additional pipeline opportunities via Starlight, NextEnergy Group's in-house development platform. NESF has a right of first offer on certain qualifying assets within Starlight's pipeline which currently stands at c.12GW. This gives NESF flexibility in potential capital allocation to add value for shareholders.
Footnotes:
1. Financial debt gearing excludes the £200m preference shares. The metric also excludes look-through debt since the Company does not have control over this debt for NAV based investments.
2. Total gearing is the aggregate of financial debt, and £200m of preference shares. The preference shares are equivalent to non-amortising debt with repayment in shares. Excludes total look-through debt since the Company does not have control over this debt for NAV based investments.
3. Excluding the $50m commitment into private vehicle NEIII.
4. Including share in private equity vehicle (NextEnergy III LP ("NEIII", formerly "NextPower III LP" or "NPIII")) and co-investments (Agenor and Santarém). Inclusion of NESF's 6.21% share of NEIII on a look-through equivalent basis increases total capacity by 48MW (30 September 2025: 48MW). Inclusion of NESF's 24.5% share of Agenor increases total capacity by 12MW (30 September 2025: 12MW). Inclusion of NESF's 13.6% share of Santarém on a look-through equivalent basis increases total capacity by 29MW (30 September 2025: 29MW).
5. Excludes total look-through debt of £22.8m.
6. Unlevered discount rate for Italian operating assets implying 1.50% country risk premium to 7.50%.
7. Unlevered discount rate for subsidy-free uncontracted operating assets implying 1.0% risk premium to 7.50%.
8. 1.0% risk premium added to UK unlevered (7.50%) and UK levered assets (8.20% - 8.50%) for cash flows after 30 years where leases have been extended.
9. As at 31 December 2025, fixed revenues include subsidy income. Figures are stated to the nearest 0.1% which may lead to rounding differences. NextEnergy Solar Fund minimises its merchant exposure through its active rolling PPA Programme. The Programme locks in PPAs in the liquid market to ensure maximum contracted revenues are achieved. Fixed prices (£/MWh) covers 83% (776MW) of the total portfolio as at 31 December 2025. Excludes Solis portfolio.
|
For further information:
NextEnergy Capital
|
020 3746 0700
|
|
Michael Bonte-Friedheim |
|
|
Ross Grier |
|
|
Stephen Rosser |
|
|
Peter Hamid (Investor Relations) |
|
|
RBC Capital Markets |
020 7653 4000 |
|
Matthew Coakes |
|
|
Kathryn Deegan |
|
|
Cavendish |
020 7908 6000 |
|
Robert Peel |
|
|
H/Advisors Maitland |
020 7379 5151 |
|
Neil Bennett |
|
|
Finlay Donaldson |
|
|
|
|
|
Ocorian Administration (Guernsey) Limited |
01481 742642 |
|
Kevin Smith |
|
Notes to Editors 1:
About NextEnergy Solar Fund
NextEnergy Solar Fund is a specialist solar energy and energy storage investment company that is listed on the Main Market of the London Stock Exchange.
NextEnergy Solar Fund's investment objective is to provide Ordinary Shareholders with attractive risk-adjusted returns, principally in the form of regular dividends, by investing in a diversified portfolio of utility-scale solar energy and energy storage infrastructure assets. The majority of NESF's long-term cash flows are inflation-linked via UK government subsidies.
As at 31 December 2025, the Company had an unaudited gross asset value of £997m. For further information please visit www.nextenergysolarfund.com
Article 9 Fund
NextEnergy Solar Fund is classified under Article 9 of the EU Sustainable Finance Disclosure Regulation and EU Taxonomy Regulation. NextEnergy Solar Fund's sustainability-related disclosures in the financial services sector are in accordance with Regulation (EU) 2019/2088 and can be accessed on the ESG section of both the NextEnergy Solar Fund and NextEnergy Capital websites.
About NextEnergy Group
NextEnergy Solar Fund is managed by NextEnergy Capital, part of the NextEnergy Group. NextEnergy Group was founded in 2007 to become a leading market participant in the international solar sector which now employs over 400 professionals. Since its inception, NextEnergy Group has been active in the development, construction, and ownership of solar assets across multiple jurisdictions. NextEnergy Group operates via its three business units: NextEnergy Capital (Investment Management), WiseEnergy (Operating Asset Management), and Starlight (Asset Development).
· NextEnergy Capital: has over 18 years of specialist solar expertise having invested in over 530 individual solar plants across the world. NextEnergy Capital currently manages four institutional funds with a total capacity in excess of 4GW and has funds under management of $4.8bn. More information is available at www.nextenergycapital.com
· WiseEnergy®: is a leading specialist operating asset manager in the solar sector. Since its founding, WiseEnergy has provided solar asset management, monitoring and technical due diligence services to over 1,600 utility-scale solar power plants with an installed capacity in excess of 3.5GW. More information is available at www.wise-energy.com
· Starlight: has developed over 100 utility-scale projects internationally and continues to progress a large pipeline of c.12GW of both green and brownfield project developments across global geographies. More information is available at www.starlight-energy.com
Notes:
1: All financial data is unaudited at 31 December 2025, being the latest date in respect of which NextEnergy Solar Fund has published financial information.
RNS may use your IP address to confirm compliance with the terms and conditions, to analyse how you engage with the information contained in this communication, and to share such analysis on an anonymised basis with others as part of our commercial services. For further information about how RNS and the London Stock Exchange use the personal data you provide us, please see our Privacy Policy.


Latest directors dealings
- 1 day ago Workspace Group
- 1 day ago Talon Resources Plc
- 1 day ago Vodafone Group
- 1 day ago Synthomer
- 1 day ago Ondo Insurtech