Interim Results & Interim Report
Summary by AI BETAClose X
LEI: 213800ZPHCBDDSQH5447
03 December 2025
NextEnergy Solar Fund Limited
("NESF" or "the Company")
Interim Results & Interim Report
|
NextEnergy Solar Fund, a leading specialist investor in solar energy and energy storage, announces it has today published its Interim results and Interim report for the period ended 30 September 2025.
|
Paul Le Page, Interim Chair of NextEnergy Solar Fund Limited, commented:
|
"I would like to begin by expressing sincere thanks to our shareholders for their continued support of NESF. During the half year under review, we delivered a strong operational performance from the Company's high performing portfolio and focused capital allocation. While both market and regulatory conditions are challenging, the outperformance of our high-quality portfolio gives us confidence for the future.
The Board continues to monitor the Company's ordinary share price and strongly believes that the current discount to net assets is wholly unjustified, given our operating performance, the success of asset disposals above NAV, our well-structured balance sheet, and a cash covered dividend. The Board is continuing to take steps to address this discount, and earlier this year launched a strategic review to examine all the options to maximise shareholder value. Details of our findings will be announced in the new year.
Finally, I am pleased to announce the appointment of Tony Quinlan as our new Chairman, effective today. Tony has enormous experience of the energy sector, most recently as CFO of Drax Group, and I am looking forward to working with him as we chart NESF's future and I return to my previous role as an independent non-executive director." |
Key Highlights: 1 April 2025 - 30 September 2025
Financial:
| · |
Net Asset Value ("NAV") per Ordinary Share of 88.8p (31 March 2025: 95.1p), primarily driven by a reduction in power price forecasts from third-party consultants. |
|
· |
Ordinary Shareholders' NAV of £510.9m (31 March 2025: £547.4m). |
|
· |
Gross Asset Value of £1,029m (31 March 2025: £1,061m). |
|
· |
Cash Income generated of £48m over the six-month period (30 September 2024: £45m) |
|
· |
Financial debt gearing (excluding Preference Shares) of 29.4% 1 (31 March 2025: 28.1% 1). |
|
· |
Total gearing (including Preference Shares) of 49.2% 2 (31 March 2025: 47.3% 2). |
|
· |
Weighted average cost of debt (including Preference Shares) of 4.9% (31 March 2025: 4.9%). |
|
· |
Weighted average cost of capital of 6.6% (31 March 2025: 6.6%). |
|
· |
Weighted average discount rate across the portfolio of 8.0% (31 March 2025: 8.0%). |
Dividend:
| · |
Total dividends declared in the period of 4.21p per Ordinary Share (30 September 2024: 4.21p). |
|
· |
Dividend cover for the period was 1.7x (30 September 2024: 1.5x). |
|
· |
The Board reconfirms the Company's full-year dividend target guidance for the year ending 31 March 2026 remains unchanged at 8.43p per Ordinary Share (31 March 2025: 8.43p). |
|
· |
Dividend cover for the full-year is forecast to be covered in a range of 1.1x - 1.3x by earnings post-debt amortisation. |
|
· |
As at 02 December 2025, the Company offers an attractive dividend yield of c.16% and since inception has declared total Ordinary Share dividends of £419m, the equivalent to 80.5p per Ordinary Share. |
Portfolio:
| · |
101 3 operating assets (31 March 2025: 101 3). |
|
· |
Total installed capacity of 939MW 4 (31 March 2025: 937MW 4). |
|
· |
Total electricity generation for the period ended 30 September 2025 of 627GWh 4 (30 September 2025: 595GWh 4). |
|
· |
Irradiation against budget for the period ended 30 September 2025 of +13.0% (30 September 2025: 0.3%). |
|
· |
Generation against budget for the period ended 30 September 2025 of +7.6% 5 (30 September 2024: -4.5% 5), generating an additional c.£2.5m in cash, despite being slightly impacted by the impact of weather variability, and grid DNO outages. |
|
· |
Remaining weighted asset life of 24.3 years (31 March 2025: 24.8 years). |
|
· |
Since inception the Company has generated 7.2TWh 4 of electricity (31 March 2025: 6.6TWh). |
Strategic Options Review:
| · |
The Board launched a formal strategic review exploring all options to close the current discount against the Company's Net Asset Value by unlocking capital, maximising NAV growth, delivering attractive dividends and optimising operational performance. |
|
· |
The Board firmly believes the Company is in a strong position to capitalise on future opportunities and in September, the Board hosted its annual strategy day to discuss its proposed future plan in detail. This included, but was not limited to, assessing strategic market opportunities to enhance shareholder returns, and evaluating the potential for expansion of the Company's Capital Recycling Programme. |
|
· |
The Board will release the findings from its strategic review in the new year. |
Fee Reduction:
| · |
During the period, the Board and NextEnergy Capital held discussions to align and reduce the Company's investment management fee, to reflect a 50:50 blend of the Company's market capitalisation and NAV effective from 1 April 2025. |
|
· |
The Board in conjunction with the Investment Adviser successfully negotiated a reduction in the Operating Asset Management Fee in the period. The new arrangement provides a 23% fee reduction by securing future cost reductions on renewal of contracts. This resulted in an uplift in NAV of 1.3p per ordinary share and £7.4m in total. |
Capital Recycling Programme:
| · |
The remaining phase of the Capital Recycling Programme for the sale of two solar assets totalling 100MW continues to progress and the Company will publish further updates in due course. |
|
· |
To date, the Capital Recycling Programme has: o Sold three asset sales totalling c.145MW of capacity from the 245MW Programme. o Raised £72.5m total capital. o Added a total estimated Net Asset Value uplift of 2.76p per Ordinary Share. |
|
· |
As part of the strategic options review, the board is evaluating the potential for expansion of the Company's capital recycling programme. |
Capital Structure:
| · |
As at 30 September 2025:
|
||||||||||||||||||
|
· |
Short-term RCF drawn of £151.9m (31 March 2025: £144.9m). |
||||||||||||||||||
|
· |
Long-term amortising debt paid down by £3.5m in the period (30 September 2024: £3.9m). |
||||||||||||||||||
|
· |
The remaining outstanding long-term debt of £143.7m is on track to fully amortise in line with the remaining subsidy life of the portfolio's inflation linked government subsidies. |
||||||||||||||||||
|
· |
Of the Company's total debt of £494.1m 6: o 69% remains at a fixed rate of interest (including the Preference Shares). o 31% remains at a floating rate of interest via the short-term RCF. |
||||||||||||||||||
|
· |
Total look-through debt of £23.4m (31 March 2025: £23.5m). This represents the total combined short and long-term debt in the Company's investment into NextEnergy III LP, and its two co-investments (Agenor and Santarém) on a look-through equivalent basis. |
USS Preference Share Ratio:
| · |
From 1 April 2025, in accordance with the USS preference share subscription agreement, the Company is required to assess a further gearing ratio using the three-month average Market Capitalisation in order to determine gearing based on enterprise value (the "EV gearing ratio"). This additional measure was triggered as the Company's shares traded at an average discount exceeding 10% for three consecutive months immediately prior to 1 April. |
|
· |
As a result of this additional methodology and the prevailing macroeconomic environment, the EV gearing ratio has exceeded the 50% limit specified in the agreement. This has triggered certain restrictions, meaning the Company must seek USS's approval or waiver before undertaking any share buybacks, distributing special dividends, or incurring additional debt that would further increase gearing. |
|
· |
The restrictions do not impact on the Company's current operations or strategy. The current debt-to-GAV ratio stands at 49.2%, close to the investment policy limit of 50%, which prevents the Company incurring further borrowing that would increase the investment policy gearing ratio above 50%. In addition, the share buyback programme, the continuation of which would also have caused gearing to exceed the limit in the investment policy, was paused in May 2025. |
|
· |
The EV gearing ratio was 54.8% at 30 September 2025 and 58.5% at 27 November 2025 and the preference shares represented 22.0% and 23.5% of EV at those dates respectively. |
|
· |
The Company remains confident that it will reduce the ratio below the 50% threshold through planned asset disposals and use of the proceeds from sales to pay down the short-term RCF. |
ESG & Sustainability:
|
· |
The Company continued to maintain its Article 9 Fund classification under the EU Sustainable Finance Disclosure Regulation and EU Taxonomy Regulation. |
|
· |
The Company and its Investment Adviser continue to implement activities in support of its Approach to Nature strategy benefiting biodiversity across NESF sites and continue to support industry action on supply chain sustainability, including the Solar Stewardship Initiative. |
|
· |
NextEnergy Capital, the Investment Adviser, recently published its 2024 Sustainability and ESG report, NEC's first combined disclosure under the International Financial Reporting Standards ("ISSB") and Taskforce for Nature related Financial Disclosures ("TNFD"). Link to full report here. |
Interim Report:
|
· |
The Company's Interim Report for the period ended 30 September 2025 is now available on the Reports & Publications section of the Company's website here. |
|
· |
A copy of the Interim Report has also been submitted to the FCA's National Storage Mechanism. |
Interim Results Presentation:
|
· |
The Company will livestream its full year results presentation via webcast for both investors and analysts and will be followed by a Q&A session. o Time: 10:00am (GMT) o Date: Wednesday 03 December 2025 o Webcast link: NextEnergy Solar Fund Interim Results Presentation |
|
· |
The presentation will be hosted by: o Paul Le Page (Interim Chair, NextEnergy Solar Fund) o Ross Grier (Chief Investment Officer, NextEnergy Capital, Investment Adviser) o Stephen Rosser (Investment Director, NextEnergy Capital, Investment Adviser) |
|
· |
A recording of the presentation will be made available on the Company's website shortly after the event. |
Post Period Key Highlights: 1 November 2025 - 3 December 2025
Appointment of New Chair:
| · |
On 26 November 2025, the Company announced the appointment of Tony Quinlan as Chair and Non-Executive Director effective 3 December 2025. |
|
· |
Tony brings extensive leadership and governance experience to his new role as Chair with deep expertise in corporate finance, M&A and business transformation. |
|
· |
He was CFO of Drax Group plc, during the transformation of the Group from coal to sustainable biomass, bringing a significant knowledge of the UK electricity market and renewables and strong credentials managing investor relations. Following a successful period as CEO of Laird plc, a major global technology engineering business, he now serves as Senior Independent Director on the boards of Costain Group PLC and Hill & Smith PLC, both with substantial operations serving infrastructure markets. |
|
· |
On Tony's appointment, Paul Le Page, who has served as Interim Chair since May 2025, will resume his role as an independent Non-Executive Director of the Company. |
|
· |
The Board would like to take this opportunity to thank Paul for stepping up into this interim role whilst the Board ran a formal process to appoint a permanent Chair and is grateful for his careful stewardship over this period. |
ROC/FiT Consultation:
|
· |
On 31 October 2025, the UK's Department for Energy Security and Net Zero ("DESNZ") published a consultation regarding potential changes to the indexation of Renewable Obligation Certificates ("ROC") and Feed-in Tariffs ("FiT"). The consultation presented two options that could potentially affect NESF's Net Asset Value. |
|
· |
NESF released an initial response to the potential impact of the UK Government's ROC and FiTs consultation on 11 November 2025, please see link to announcement here based on NAV as of 30 June 2025. |
|
· |
See below the updated potential NAV impact of the UK ROC & FiT consultation as at 30 September 2025: |
Option 1 - An immediate switch to CPI indexation from RPI:
|
|
Estimated impact on NAV per Ordinary Share |
Estimated % impact on NAV |
|
Option 1 |
c. -2p |
c. -2% |
Option 2 - An immediate, temporary freeze to the ROC and FiT prices:
|
|
Estimated impact on NAV per Ordinary Share |
Estimated % impact on NAV |
|
Option 2 |
c. -9p |
c. -10% |
Tax Structure:
|
· |
The Company confirms it is not currently in discussions with HMRC in regard to any tax issues. |
|
· |
The Company changed its tax adviser c.2 years ago which involved a fresh review of the previous adviser's tax work and set up, and nothing of concern was highlighted. |
|
· |
The Company anticipates no material impact from the measures announced in the UK budget on 26 November 2025. |
Ross Grier, Chief Investment Officer of NextEnergy Capital said:
|
"The renewable energy investment company sector has faced considerable pressure, with macroeconomic uncertainty, persistent, elevated interest rates, wealth manager consolidations and redemptions, rising long-term Gilt yields, political instability, and declining power prices contributing to significant discounts across listed funds. NESF has not been immune to those pressures, though remains strategically positioned to benefit from the accelerating transition to a low-carbon energy environment, where momentum has been steadily building since the announcement of UK Government's Clean Power 2030 action plan.
NESF's carefully curated portfolio of 101 operational assets, and a $50 million investment into NEIII, provides a robust platform for future growth, both through optimising existing holdings and selectively expanding into new opportunities. Disciplined capital allocation remains essential at this time and the NESF team constantly evaluates the Company's capital allocation priorities to maximise shareholder value. This includes recycling capital from certain existing investments to pay-down the short-term RCF, invest in the health of existing assets and progress value accretive opportunities to grow the Company into the future.
I am proud of the quality and resilience of the NESF portfolio and the team supporting it, consistently demonstrating their ability to navigate short-term volatility while focusing on long-term value. Investments in the Company's long-term value strategy have focused on technical improvements across the portfolio to reduce operating costs and maintain asset health. The benefits of the team's active, hands-on management are evident in the Company's ability to adapt, respond, and deliver valuable performance, creating a strong foundation for growth.
The Company continues to deliver reliable returns to shareholders through well-covered quarterly dividends derived from cash flows. There is a lot to be positive about looking forward, with multiple political and macroeconomic tailwinds ahead that we expect to benefit NESF, its shareholders, and the sector as a whole. We continue to work hard alongside the Board of NESF to ensure the Company is in the best position possible to seize on compelling opportunities ahead." |
6-Month NAV Bridge Breakdown:
|
|
NAV p/share |
NAV |
|
At 31 March 2025 |
95.1p |
£547.4m |
|
Time value |
4.5p |
£26.0m |
|
Project actuals |
0.7p |
£4.2m |
|
Solar power price forecasts |
(4.4p) |
(£25.1m) |
|
BESS Revenue forecasts |
(0.9p) |
(£5.3m) |
|
Changes in short-term inflation |
0.7p |
£4.2m |
|
Revaluation of NextEnergy III LP & Co-investments |
(0.6p) |
(£3.2m) |
|
Asset manager fee reduction |
1.3p |
£7.4m |
|
Fund OPEX |
(0.6p) |
(£3.4m) |
|
Cash dividends paid |
(5.0p) |
(£29.0m) |
|
Share buyback |
0.0p |
(£0.3m) |
|
Capital movements (no net NAV impact) |
|
|
|
- New assets at cost |
1.0p |
£5.6m |
|
- Repayment of RCF using cash on hand |
(1.2p) |
(£7.0m) |
|
- Proceeds from RCF net of cash used |
0.2p |
£1.4m |
|
Other movements in residual value |
(2.0p) |
(£12.0m) |
|
At 30 September 2025 |
88.8p |
£510.9m |
The movement in the NAV over the period was driven primarily by the following factors.
NAV accretive movements:
|
· |
Time Value: The time value reflects the change in the valuation as a result of changing the valuation date, prior to adjusting for any outflows of the Company. The increase in value is attributable to the unwinding of the discount applied to cash flows for the period when calculating the discounted cash flow. |
|
· |
Project Actuals: The project actuals figure was driven by generation out-performance vs. budget, which was impacted by higher-than-expected irradiance levels in the period. NESF reports individual generation figures twice a year in its interim and full-year results. |
|
· |
Asset Management Fee Reduction: The NESF Board in conjunction with the Investment Adviser successfully negotiated a reduction in future operating asset management cost forecasts resulting in an uplift in NAV of 1.3p per ordinary share and £7.4m in total. |
|
· |
Inflation Forecasts: An increase in short-term inflation assumptions from 2025 to 2026 - now assuming 4.5% UK RPI for calendar year 2025-26. The Company continues to take a consistent approach to its inflation assumptions, using external third-party, independent inflation data from HM Treasury Forecasts and long-term implied rates from the Bank of England for its UK assets. For international assets, IMF forecasts are used. Long-term assumptions are aligned with market consensus including transition to CPI from 2030. See breakdown of UK inflation assumptions below. |
NAV deductive movements:
|
· |
Cash Dividends Paid: The dividends paid during the period, including both Ordinary and Preference Share dividend payments. |
|
· |
Solar Power Price Forecasts: A decrease in UK power price forecasts provided by third-party consultants, driven by a downwards revision of forecast demand by one consultant across the forecast period and a downwards revision of gas price forecasts in the short-term (2025-2030). See power curve assumptions graph below. |
|
· |
BESS Revenue Forecasts: A decrease in BESS revenue forecasts provided by a third-party consultant. |
|
· |
Revaluation of NextEnergy III LP & Co-investments: Movements in the fair value of the holding in NextEnergy III LP and the two co-investments reflecting updates to power price and curtailment forecasts provided by third-party consultants. |
|
· |
Other Residual Value Movements: Includes changes in OPEX assumptions, FX rates, incremental capex forecasts, planned outages, and capital expenditure provisions for asset health, such as repowering inverters and module replacements, and other non-material movements. |
3-Month NAV Bridge Breakdown:
|
|
NAV p/share |
NAV |
|
At 30 June 2025 |
91.7p |
£527.2 |
|
Time value |
2.3p |
£13.4m |
|
Project actuals |
(0.1p) |
(£0.7m) |
|
Solar power price forecasts |
(2.2p) |
(£12.7m) |
|
BESS Revenue forecasts |
0.0p |
(£0.2m) |
|
Changes in short-term inflation |
0.2p |
£1.0m |
|
Revaluation of NextEnergy III LP & Co-investments |
(0.6p) |
(£3.3m) |
|
Asset manager fee reduction |
1.3p |
£7.4m |
|
Fund OPEX |
(0.3p) |
(£1.7m) |
|
Cash dividends paid |
(2.5p) |
(£14.5m) |
|
Capital movements (no net NAV impact) |
|
|
|
- New assets at cost |
0.5p |
£2.9m |
|
- Repayment of RCF using cash on hand |
0.2p |
£1.0m |
|
- Proceeds from RCF net of cash used |
(0.7p) |
(£3.9m) |
|
Other movements in residual value |
(1.0p) |
(£5m) |
|
At 30 September 2025 |
88.8p |
£510.9m |
Inflation Rate (UK RPI) Assumptions
|
Calendar Year |
30 September 2025 |
31 March 2025 |
|
2025/26 |
4.50% |
3.80% |
|
2026/27 |
3.30% |
3.10% |
|
2027/28 |
3.20% |
3.30% |
|
2028/29 |
3.30% |
3.40% |
|
2029/30 |
3.10% |
3.00% |
|
2030/31 onwards |
Unchanged |
2.25% |
Discount Rate Assumptions
|
|
|
30 September 2025 |
31 March 2025 |
|
Solar |
UK unlevered |
Unchanged |
7.50% |
|
UK levered |
Unchanged |
8.20% - 8.50% |
|
|
Italy unlevered 7 |
Unchanged |
9.00% |
|
|
Subsidy-free (uncontracted) 8 |
Unchanged |
8.50% |
|
|
Life extensions 9 |
Unchanged |
8.50% - 9.50% |
|
|
Energy Storage |
Uncontracted |
Unchanged |
10.00% |
|
Contracted |
Unchanged |
7.00% |
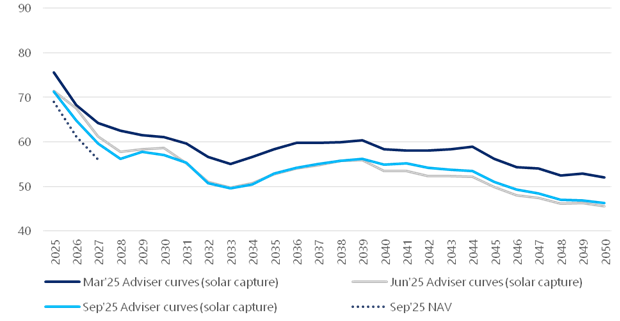
Power Curve Assumptions
30 September 2025: Blended Power Curves (Capture Price)
|
Methodology: For the UK portfolio, the Company uses multiple sources for UK power price forecasts. Where power has been sold at a fixed price under a Power Purchase Agreement ("PPA") (a hedge), these known prices are used. For periods where no PPA hedge is in place, short-term market forward prices are used. After two years, the Company integrates a rolling blended average of leading independent energy market consultants' long-term central case projections. The blend of forecasts reduces volatility, presenting a fair and balanced outlook consistent with pricing methodologies used for successfully divested assets and power price assumptions across broader peer group.
For the Italian portfolio, PPAs are used in the forecast where these have been secured. In the absence of hedges, a leading independent energy market consultant's long-term projections are used to derive the power curve adopted in the valuation.
Drivers of power price movement: In the near term, lower commodities price forecasts and increased forecast solar capacity build out have slightly reduced prices compared to the previous quarter. Medium term prices are consistent with the previous forecast. In the long term, prices have increased since the previous quarter due to an increase in forecast demand from datacentres, and reduced forecast renewables deployment. Solar captures rates remain consistent with the previous quarter across the forecast.
Portfolio Performance During the period NESF generated an additional £2.5m in cash due to above forecast performance. The Company provides its monthly generation against budget graphs on p31 of the interim report. |
|
Six-month period 10 |
Total Generation (GWh) |
Irradiation vs forecast 5 |
Generation vs forecast 5 |
|
UK portfolio 11 |
555.1 |
13.5% |
7.8% |
|
Italy portfolio |
30.6 |
6.0% |
2.4% |
|
NEIII & Co-investments |
40.9 |
n/a |
n/a |
|
Total |
626.6 |
+13.0% 12 |
+7.6% 12 |
|
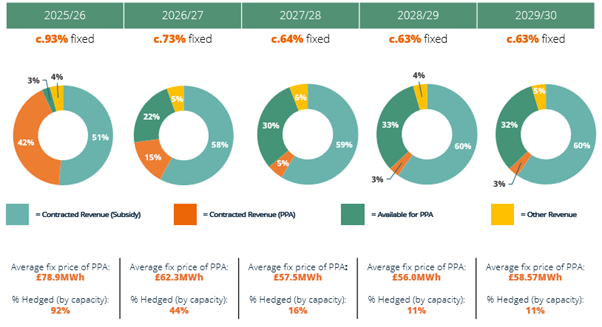
Power Purchase Agreement Strategy Approximately c.50% of NextEnergy Solar Fund's revenues come from RPI-linked government-backed subsidies. The remaining c.50% of revenues are secured through NextEnergy Solar Fund's PPA strategy where the Company secures PPAs over a rolling 36-month period. This proactive risk mitigation helps secure and underpin both dividend commitments and dividend cover whilst reducing volatility and increasing the visibility of cash flows. |
Forecasted Total Revenue Breakdown 13:
|
|
The Company owns the project rights for, or has exclusivity over, a carefully selected immediate pipeline of development projects in utility-scale solar and UK energy storage assets.
NESF owned pipeline:
| · |
Camilla battery augmentation from 1hr to 2hr duration (site pre-engineered); |
|
· |
250MW 2hr duration battery called Project Lion at ready to build ("RTB") stage with connection projected for 2029; |
|
· |
60MW solar PV in development in Wales (possible RTB horizon 2026); and |
|
· |
350MW solar PV in development in Wales (possible RTB horizon 2028). |
|
NESF also benefits from additional pipeline opportunities via Starlight, NextEnergy Groups in-house development platform. NESF has a right of first offer on certain qualifying assets with Starlight's pipeline which currently stands at c.12GW. This gives NESF flexibility in potential capital allocation to add value for shareholders. |
Footnotes:
|
1. |
Financial debt gearing excludes the £200m preference shares. The metric also excludes look-through debt since the Company does not have control over this debt for NAV based investments. |
|
2. |
Total gearing is the aggregate of financial debt, and £200m of preference shares. The preference shares are equivalent to non-amortising debt with repayment in shares. Excludes total look-through debt since the Company does not have control over this debt for NAV based investments. |
|
3. |
Excluding the $50m commitment into private vehicle NEIII. |
|
4. |
Including share in private equity vehicle (NextEnergy III LP ("NEIII", formerly "NextPower III LP" or "NPIII")) and co-investments (Agenor and Santarém). Inclusion of NESF's 6.21% share of NEIII on a look through equivalent basis increases total capacity by 48MW (31 March 2025: 46MW) and increases generation by 30GWh (31 March 2025: 51GWh). Inclusion of NESF's 24.5% share of Agenor increases total capacity by 12MW (31 March 2025: 12MW) and increases generation by 11GWh (31 March 2025: 14GWh). Inclusion of NESF's 13.6% share of Santarém on a look-through equivalent basis increases total capacity by 29MW (31 March 2025: 29MW) and increases generation by nil GWh (31 March 2025: nil GWh). |
|
5. |
Excludes performance of private equity vehicle (NEIII) and co-investments. Actual figures versus budget at point of acquisition. Figures have been adjusted, where relevant, for events outside of the Company's control, such as distribution network operator outages, and for events in which compensation has been or will be received, such as warranty claims. |
|
6. |
Excludes total look through debt of £23.4m. |
|
7. |
Unlevered discount rate for Italian operating assets implying 1.50% country risk premium to 7.50%. |
|
8. |
Unlevered discount rate for subsidy-free uncontracted operating assets implying 1.0% risk premium to 7.50%. |
|
9. |
1.0% risk premium added to UK unlevered (7.50%) and UK levered assets (8.20% - 8.50%) for cash flows after 30 years where leases have been extended. |
|
10. |
Figures are stated to the nearest 0.1 decimal place which may lead to rounding differences. |
|
11. |
UK portfolio includes both ground mount and rooftop assets, and excludes standalone energy storage asset, co-investments and investment in NPIII. |
|
12. |
Figure represents delta across the NESF Portfolio |
|
13. |
As at 30 September 2025, fixed revenues include subsidy income. Figures are stated to the nearest 0.1% which may lead to rounding differences. NextEnergy Solar Fund minimises its merchant exposure through its active rolling PPA Programme. The Programme locks in PPAs in the liquid market to ensure maximum contracted revenues are achieved. Fixed prices (£/MWh) covers 83% (776MW) of the total portfolio as at 30 September 2025. Excludes Solis portfolio. |
|
For further information:
NextEnergy Capital
|
020 3746 0700
|
|
Michael Bonte-Friedheim |
|
|
Ross Grier |
|
|
Stephen Rosser |
|
|
Peter Hamid (Investor Relations) |
|
|
RBC Capital Markets |
020 7653 4000 |
|
Matthew Coakes |
|
|
Kathryn Deegan |
|
|
Cavendish |
020 7908 6000 |
|
Robert Peel |
|
|
H/Advisors Maitland |
020 7379 5151 |
|
Neil Bennett |
|
|
Finlay Donaldson |
|
|
Ocorian Administration (Guernsey) Limited |
01481 742642 |
|
Kevin Smith |
|
Notes to Editors 1:
|
About NextEnergy Solar Fund NextEnergy Solar Fund is a specialist solar energy and energy storage investment company that is listed on the Main Market of the London Stock Exchange.
NextEnergy Solar Fund's investment objective is to provide Ordinary Shareholders with attractive risk-adjusted returns, principally in the form of regular dividends, by investing in a diversified portfolio of utility-scale solar energy and energy storage infrastructure assets. The majority of NESF's long-term cash flows are inflation-linked via UK government subsidies.
As at 30 September 2025, the Company had an unaudited gross asset value of £1,029m. For further information please visit www.nextenergysolarfund.com
Article 9 Fund NextEnergy Solar Fund is classified under Article 9 of the EU Sustainable Finance Disclosure Regulation and EU Taxonomy Regulation. NextEnergy Solar Fund's sustainability-related disclosures in the financial services sector are in accordance with Regulation (EU) 2019/2088 and can be accessed on the ESG section of both the NextEnergy Solar Fund and NextEnergy Capital websites.
About NextEnergy Group NextEnergy Solar Fund is managed by NextEnergy Capital, part of the NextEnergy Group. NextEnergy Group was founded in 2007 to become a leading market participant in the international solar sector which now employs over 400 professionals. Since its inception, NextEnergy Group has been active in the development, construction, and ownership of solar assets across multiple jurisdictions. NextEnergy Group operates via its three business units: NextEnergy Capital (Investment Management), WiseEnergy (Operating Asset Management), and Starlight (Asset Development).
|
· NextEnergy Capital: has over 18 years of specialist solar expertise having invested in over 530 individual
solar plants across the world. NextEnergy Capital currently manages four institutional funds with a total
capacity in excess of 4GW and has funds under management of c.$4.8bn. More information is
available at www.nextenergycapital.com
· WiseEnergy®: is a leading specialist operating asset manager in the solar sector. Since its founding,
WiseEnergy has provided solar asset management, monitoring and technical due diligence services to over
1,600 utility-scale solar power plants with an installed capacity in excess of 3.5GW. More information is
available at www.wise-energy.com
· Starlight: has developed over 100 utility-scale projects internationally and continues to progress a large
pipeline of c.12GW of both green and brownfield project developments across global geographies. More
information is available at www.starlight-energy.com
Notes:
1: All financial data is unaudited at 30 September 2025, being the latest date in respect of which NextEnergy Solar Fund has
published financial information.
RNS may use your IP address to confirm compliance with the terms and conditions, to analyse how you engage with the information contained in this communication, and to share such analysis on an anonymised basis with others as part of our commercial services. For further information about how RNS and the London Stock Exchange use the personal data you provide us, please see our Privacy Policy.


Latest directors dealings
- 1 day ago Workspace Group
- 1 day ago Talon Resources Plc
- 1 day ago Vodafone Group
- 1 day ago Synthomer
- 1 day ago Ondo Insurtech