Interim Results
Summary by AI BETAClose X
Mineral & Financial Investments Limited
Unaudited Results for the six months ended 31 December 2025
HIGHLIGHTS:
· H1-2026 NAV1 was £16,423,000 up from £12,692,000 a 29.5% year on year increase
· Net Asset Value1 p/s ("NAVPS") on 31 Dec. 2025 was 39.3p, up 22.1%, from 32.2p (yr/yr)
· Investable Capital was £16,903,000 (Dec 31, 2025) vs £13,114,000 (Dec 31. 2024) up 28.9% yr/yr
· Net Earnings[1] for H1-2026 were £2,597,000 vs. H1-2025 Net Earnings £1,247,000, up 108.2%
· EPS1 for the 6 months ending Dec 31, 2025, were 6.1p vs 3.1p, an increase of 96.8% (Yr/Yr)
· The 10-year Compound Annual Growth Rate for NAV1 was +33.6% and for NAVPS +19.8%
George Town, Grand Cayman Islands, 18 March 2026 - Mineral and Financial Investments Limited (LSE-AIM: MAFL) ("M&F" or the "Company") is very pleased to announce its unaudited interim results for the six months ended 31 December 2025 ("H1-2026"). The Company generated a H1-2026 Gross Profit of £2,980,000, an operating profit of £2,641,000 resulting in an after-tax profit of £2,597,000 (unaudited). This compares with H1-2025 Gross Profits of £1,551,000 an operating profit of £1,262,000 resulting in an after-tax profit of £1,247,000. Fully diluted earnings per share ("EPS-FD") were 6.1p per share, this compares with H1-2025 EPS-FD of 3.1p, an increase of 96.8%
The NAVPS as at 31 December 2025 was 39.3p an increase of 22.1% from the previous year's NAVPS for the same period of 32.2p. Working capital as of 31 December 2024 was £16,648,000[2]. The Net Asset Value (basic) has grown at an average of rate of 33.6% per year on a compounded basis since 31 December 2015 (10 years).
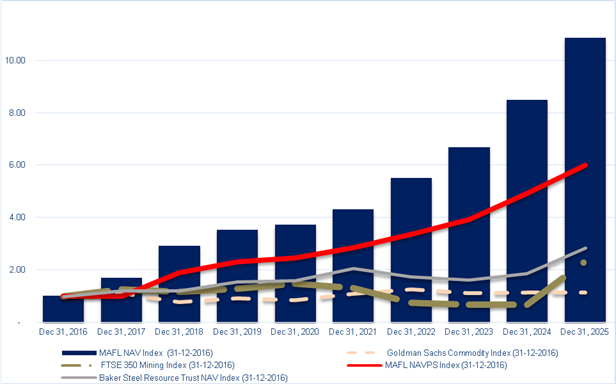
M&F NAVPS vs. Comparable Benchmarks
Indexed Performance (Dec 31, 2016 = 1.00)
(Fig. 1)
CHIEF EXECUTIVE'S STATEMENT:
Our NAV growth Year on Year was 29.4% for the H1-2026 period. In the past we would state our performance was "in spite" of a volatile economic backdrop. Our performance is currently, in part, due to the current global political and economic instability. We ended the period with Investable Capital ("IC") of £16,903,000, an increase of 28.9% for the IC of as of December 31, 2025. The Company ended the first half of the year with a cash position of £1,007,000 as profits were taken by the Tactical Portfolio in precious metal investments. The NAV per share results did not keep pace with the NAV growth due to the increase in the number of fully diluted shares due to the granting of long-term equity incentives to members of the board and management.
As of 31 December 2025, US 10 Yr. Treasury yields[3] had declined slightly to 4.17% (-8.7% Yr./Yr.), during the same period, 10 yr. government yields in Canada, most of Europe, Australia, South Korea and India rose. In the face of generally rising yields, most major equity markets performed positively. The S&P 5003 rose 16.4%, the CSI 300 Equity Index3 (Shanghai) was up 17.7%, the Euro-Stoxx3 index was up 18.3%, and the FTSE 1003 was up an impressive 21.4% in the period. The leading equity index performer in the period was the Nikkei 225 rising 26.2%, a spectacular anomaly as its 10-year government bond yields were up 91.6%, to 2.05%. The Japanese rate rise has constricted the Yen-US Treasury carry-trade (i.e. borrow in Japan and buy US treasuries). The probable result has been more Japanese capital available for equity investments despite a rising interest rate environment.
M&F - Financial Performance Summary vs Comparable Yardsticks
(Fig.2)
|
|
H1 31/12/20 |
H1 31/12/21 |
H1 31/12/22 |
H1 31/12/23 |
H1 31/12/24 |
H1 31/12/25 |
H1'26/ H1'25 % Ch. |
5 Yr. CAGR |
|
Net Asset Value ("NAV") (,000) |
£5,681 |
£6,580 |
£8,214 |
£10,020 |
£12,692 |
£16,423 |
29.5% |
23.7% |
|
Net Asset Value Per Share (FD) |
16.11p |
18.62p |
22.03p |
25.8p |
32.2p |
39.3p |
22.1% |
19.6% |
|
FTSE 350 Mining Index |
21,699 |
16,679 |
11,154 |
9,904 |
10,161 |
34,525 |
239.8% |
9.7% |
|
Goldman Sachs Commodity Index |
409.46 |
561.18 |
610.07 |
535.64 |
549.64 |
548.5 |
-0.2% |
6.0% |
The US Dollar as measured by the DXY Index3 (Trade weighted measure of the USD) was down 9.4% during the 12-month period ending December 31, 2025. A rising USD will, all things being equal, result in lower US dollar denominated commodity prices, and conversely a declining USD will generally result in higher USD commodity prices. During the 12-month period, Uranium3 was up 7.0%; Gold3 was up 42.6%; Silver3 was up 147.5%; Copper3 was up +2.2%; Platinum3 was up 147.5%; Palladium3 was up 7.2%; Rhodium3 was up96.7%; Nickel3 was up 9.85.4%; Aluminium3 was up17.9%; Zinc3 was up 3.9%; and Lead3 was up 2.1%. Oil prices were down Yr./Yr., WTI3 declined 19.9% while Henry Hub natural gas3 prices were flat, declining 0.8% to $3.60/mcf. The USA is, exceptionally, experiencing declining rates despite sticky inflation, unclear economic growth, and the imposition of trade tariffs that are frequently subsequently changed by the US President. Equity markets are being aided by the benign interest environment. It should be noted that, adjusting for the decline in in the USD, US Equity markets' performance was amongst the lowest (+7.0%) amongst major global equity markets.
The following is a summary of the Company's Commodity Allocation H1-2026 vs. H1-2025:
Portfolio Allocation by Commodity Grouping
(Fig. 3)
|
(£'000) |
H1-2026 |
H1-2025 |
Yr/Yr Ch. (%) |
H1-'26 As % of Total |
|
Cash |
£1,007.1 |
£500.6 |
101.2% |
6.0% |
|
Precious Minerals |
£8,870.4 |
£7,554.0 |
17.4% |
52.5% |
|
Base Metals |
£5,319.0 |
£3,908.6 |
36.1% |
31.5% |
|
Tech., Energy & Services |
£905.9 |
£1,150.6 |
-21.3% |
5.4% |
|
Royalties |
£800.5 |
- |
- |
4.7% |
|
Total Investable Capital |
£16,902.9 |
£13,113.8 |
28.9% |
100.0% |
M&F's investable funds of £16,903,000 as at the end of H1-2026, showed an increase of 28.9% Yr./Yr. Our cash levels are at 6.0% of "Investable Capital[4]". This cash holding is approaching our target level of 10% of investable capital. We believe that liquidity provides us with a more flexibility when considering investment opportunities. Therefore, as a necessary offset to this level of liquidity, M&F must generate above average returns from our Tactical Portfolio. It should be noted that our cash position is somewhat understated, as we hold 1,210 oz of gold, via Deferred Gold Delivery Contracts ("DGDC"). If we include DGDC as part of our cash position, we are well within our targeted liquidity levels. These contracts represent 18.1% of our Investable Capital. If the DGDC's are included as part of our cash position, our cash holdings, marked to market values, would be £4.1M, or 24.1% of our Investable Capital.
Our increased exposure to physical metals (Silver, Rhodium, and after the period end Copper) reflects our belief that continued inflationary pressures, permitting and construction delays, increased cost of capital (i.e. interest rates), declining mined grades for most metal commodities, diminished frequency of large-scale discoveries and an uncertain economic framework could result in equity valuation pressure in 2026, especially those with projects exposed to development risks. We believe that physical commodities should provide better risk adjusted returns than the underlying equities. We understand that the production cost break-even levels have risen for virtually all mineral commodities. We consider that the decline of the USD during the period in part due to the decline in US rates. The second half of calendar 2025 was defined by economic and trade policy uncertainty. Since the 2025 calendar year end, there has been some rise to the DXY (US dollar index) due to "safe harbour" investors seeking safety in US dollar denominated investments.
We provided the Deferred Gold Delivery Contracts as a bridge financing vehicle for Golden Sun Resources ("GSR"). The DGDC were made on attractive business terms for M&F shareholders. The purpose was to fund some capital shortfalls in the ramp-up of the 450/500tpd processing facility at the Bellavista Mine. The operations have been generating positive cash flow. The purchase price for the gold via these deferred gold contracts is US$1,750 /oz., with a minimum floor price of US$2,050/ oz price (e.g. if the gold price declined to $1,700/oz, we would receive US$2,050/oz). The contracts have 6-month terms. These bridge loans can be satisfied by either physical delivery of the gold at the mine gate, or the financial equivalent. After 6 months they lock in at the prevailing spot price and thereafter accrue at 20%, calculated quarterly, per annum. The first deferred gold loans are secured by 66% of the shares of Compańia Agro Parque S.A. ("Agro Parque"). Agro Parque's principal asset is 220 Hectares (544 Acres) of land in Costa Rica, overlooking the Pacific Ocean, with various possible commercial applications. Additionally, in later rounds we received 1,449,441 warrants with a 5-year term to acquire Golden Sun Shares at US $0.75.
Portfolio Allocation by Portfolio Category
(Fig. 4)
|
(£'000) |
H1-2026 |
H1-2025 |
% Change |
H1-2025 as % of Total IC[5] |
|
Cash |
£1,007.1 |
£500.6 |
101.2% |
6.0% |
|
Tactical Portfolio |
£6,700.8 |
£4,224.9 |
58.6% |
39.6% |
|
Strategic Portfolio |
£9,195.0 |
£8,388.3 |
9.6% |
54.4% |
|
Total Investable Capital |
£16,902.9 |
£13,113.8 |
28.9% |
100.0% |
Tactical Portfolio:
The purpose of the Tactical Portfolio ("TP") is to protect our performance by generating "excess returns" to offset our cash holdings and by positioning itself to hedge, if deemed appropriate, against market circumstance that would negatively affect our Strategic Portfolio. Additionally, the TP must allow M&F the financial flexibility to take advantage of short-term opportunities across asset classes, when attractive and appropriate. During the H1-2026 period the TP increased by 58.6% to £6.7M and now represents nearly 40% of the total Investable Capital The weighting of the TP should be considered in conjunction with our cash holdings. The collective holding of cash and the TP is 45.6% of Investable Capital.
The TP increased by 58.6% Yr./Yr. compared to H1-2025. This TP performance fulfils its purpose of generating "excess returns" to compensate for our increased cash holdings. We are also beginning to increase our exposure to the non-precious metal investments, notably copper producers: AIC Mines Ltd, a small, but high grade producer in Queensland Australia, Capstone Copper, a copper producer with assets in the USA, Mexico and Chile, producing 184,460 tonnes of copper in 2024; ERO Copper Corp, a Brazil focused copper and gold producer; Azimut Exploration a gold, antimony and lithium exploration development company located in Canada; Farraday Copper Corp, a Canadian developing multiple copper deposits in the USA; HudBay Minerals, a copper producer with assets located in Peru and Canada; McEwen Mining a north American gold producer with a large and highly prospective copper development project in Argentina (Los Azules); NGEx Minerals also with a large copper deposit (Vicuña) Argentina which it is developing with its partner BHP and two other world-class projects (Lunahuasi in Argentina and Los Helados in Chile) which are also of world class standard.
As at 31 December 2025 the Company held tactical holdings in 17 investments: AIC Mines; Azimut Exploration; Agnico Eagle Mines; Capstone Copper; ERO Copper; Farraday Copper; Hudbay Minerals; McEwen Mining; Newmont Corporation; NexMetals Mining; NGEx Minerals; Orla Mining; Rio Tinto, db Physical Rhodium; SantaCruz Silver; Sprott Physical Silver Trust, and Vior Gold.
Strategic Portfolio:
The Strategic Portfolio holds investments which are longer term in nature and which we believe had unique investment characteristics at the time we invested. These longer-term investments require M&F to assess the four keystone foundations to a successful investment in the natural resource sectors: 1. Geological Assets, 2. Jurisdiction, 3. Governance and Management; and 4. Financial capability. Geology and jurisdiction are fixed or at least very slow to change, however, we can assist in the improvement of items 3 and 4 on our list of investment keystones. As such, we are constantly reviewing potential investments filtering through the many underfunded projects left struggling, we believe, by 10 years of sector neglect, underfunding. There are also systemic funding flaws (ETF's and large specialized mutual funds that grow and shrink with performance history) which magnify and elongate cycles. We believe that we are exiting a period of prolonged underperformance.
Historically, our Strategic Portfolio has been our best performing portfolio. However, lately its performance has moderated to +9.6% yr/yr., mostly due to FX moves. We noted in our latest Annual Report, 54% of our Investable Capital, or 60% if you include our cash holdings are included, have been nearly static. This modest performance is due to the technical reality that these investee companies are often valued based on the most recent financing price and given the absence of financings the valuations have remained relatively stable. Therefore, the Strategic Portfolio has not materially contributed to our performance, despite relatively strong share price performance from similar listed companies. This is consistent with our conservative valuation policy.
Redcorp and Cerrado had been impacted by a period of political uncertainty in Portugal. The project has been granted the status of Project of National Interest ("PIN"), which gives us confidence that this will ultimately be resolved. M&F values our investment on the lower value of the Put on the 5% carried interest in the project, not the 20% carried interest we currently hold, subject to EDM's decision to exercise its option on 15% working interest of the Project.
Ideon Technologies is continuing to expand its business and revenue base. Its acceptance as a useful exploration and development technology for the mining industry has been very good. Ideon has been expanding its client list, expanding its order book backlog and generating. Additionally, Ideon has also benefited from some government sponsored research grants. To date it has broadly been self-sufficient. Gemdale Gold has listed on the TSX-V, after accessing recent tranche of funding at our entry point of C$1.00 per share. Gemdale announced that Eldorado Gold Gold (Mkt Cap: C$10.2B) acquired 9.9% stake in Gemdale. Gemdale recently reached a high of C$2.24/shar, and is currently trading at C$1.90/sh.
Golden Sun Resources (GSR) is currently generating positive monthly cash flow of US$2.0M to US$3.0M and has about US$4.0M in cash. This has been achieved from the 450tpd milling facilities. Thickeners have been ordered and should be available by mid 2026. This will reduce the moisture in the leached pulp and result in improved performance from the filter presses (which remove the moisture). Additionally, the filter press capacity will be increased with additional filter plates being added. The ball mill had an unusual bearing failure in December 2025 that took it out of service for nearly 4 weeks. The Mine has taken out business interruption insurance. The mill has been operating above budget since it has come back on-line. Tunnelling work has begun to reach the underground San Lorenzo ore body. It should be reached by mid-2026. Already some underground ore is being blended into the ore fed to the mill. The current plan expects production to exit the year at a rate of c. 25,000 oz per year, although this cannot be guaranteed. GSR Strategic Review is ongoing, it has received several investment proposals that are being considered. The objective is to maximize the value for GSR investors over the next 12 to 18 months.
The directors look forward to providing shareholders with an update on investments in due course.
On behalf of the Board
Mark T. Brown, CA CPA Jacques Vaillancourt, CFA
Chairman President, CEO
FOR MORE INFORMATION:
Jacques Vaillancourt, Mineral & Financial Investments Ltd. +44 780 724 6247
Katy Mitchell, Zeus Capital +44 203 829 5000
Jon Belliss, Novum Securities Limited +44 207 399 9400
Statement of Comprehensive Income
for the 6 months ended 31 December 2025
|
|
|
UNAUDITED |
UNAUDITED |
AUDITED |
|
|
|
6 months to 31 December 2025 |
6 months to 31 December 2024 |
12 months to 30 June 2025 |
|
|
Note |
£'000 |
£'000 |
£'000 |
|
Continuing operations: |
|
|
|
|
|
Investment income |
|
10 |
4 |
54 |
|
Net gains on investments |
|
2,970 |
1,551 |
2,845 |
|
|
|
|
|
|
|
Total income |
|
2,980 |
1,555 |
2,899 |
|
Operating expenses |
|
(280) |
(256) |
(578) |
|
Share based payment expense |
|
(100) |
- |
- |
|
Other gains and losses |
|
41 |
(37) |
(110) |
|
Profit before taxation |
|
2,641 |
1,262 |
2,211 |
|
Taxation expense |
|
(44) |
(15) |
(38) |
|
Profit for the period attributable to owners of the Company |
|
2,597 |
1,247 |
2,173 |
|
|
|
|
|
|
|
|
|
|
|
|
|
Earnings per share attributable to owners of the Company during the period |
3 |
pence |
pence |
pence |
|
Basic: |
|
6.9 |
3.4 |
5.8 |
|
Diluted: |
|
6.1 |
3.1 |
5.4 |
Statement of Financial Position
as at 31 December 2025
|
|
|
UNAUDITED |
UNAUDITED |
AUDITED |
|
|
|
31 December 2025 |
31 December 2024 |
30 June 2025 |
|
|
|
£'000 |
£'000 |
£'000 |
|
|
|
|
|
|
|
FIXED ASSETS |
|
|
|
|
|
Financial assets |
|
4,358 |
3,551 |
3,887 |
|
|
|
|
|
|
|
CURRENT ASSETS |
|
|
|
|
|
Financial assets |
|
11,537 |
9,062 |
9,995 |
|
Trade and other receivables |
|
39 |
11 |
57 |
|
Cash and cash equivalents |
|
1,007 |
501 |
209 |
|
|
|
12,583 |
9,574 |
10,261 |
|
|
|
|
|
|
|
CURRENT LIABILITIES |
|
|
|
|
|
Trade and other payables |
|
283 |
255 |
272 |
|
Convertible unsecured loan notes |
|
10 |
10 |
10 |
|
|
|
293 |
265 |
282 |
|
NET CURRENT ASSETS |
|
12,290 |
12,870 |
9,979 |
|
NON-CURRENT LIABILITIES |
|
|
|
|
|
Deferred tax provision |
|
(225) |
(168) |
(187) |
|
|
|
|
|
|
|
|
|
|
|
|
|
NET ASSETS |
|
16,423 |
12,692 |
13,679 |
|
|
|
|
|
|
|
EQUITY |
|
|
|
|
|
Share capital |
|
3,124 |
3,116 |
3,121 |
|
Share premium |
|
6,303 |
6,203 |
6,259 |
|
Loan note equity reserve |
|
6 |
6 |
6 |
|
Reserve for employee share option schemes |
|
301 |
222 |
201 |
|
Other reserves |
|
15,736 |
15,736 |
15,736 |
|
Retained earnings |
|
(9,047) |
(12,591) |
(11,644) |
|
SHAREHOLDERS' EQUITY |
|
16,423 |
12,692 |
13,679 |
Statement of Changes in equity
for the 6 months ended 31 December 2025
|
|
Share capital |
Share premium |
Loan note reserve |
Reserve for Employee Share schemes |
Other reserves |
Accumulated losses |
Total equity |
|
|
£'000 |
£'000 |
£'000 |
£'000 |
£'000 |
£'000 |
£'000 |
|
|
|
|
|
|
|
|
|
|
At 30 June 2024 |
3,116 |
6,203 |
6 |
222 |
15,736 |
(13,838) |
11,445 |
|
Profit for the 6 months to 31 December 2024 |
- |
- |
- |
- |
- |
1,247 |
1,247 |
|
At 31 December 2024 |
3,116 |
6,203 |
6 |
222 |
15,736 |
(12,591) |
12,692 |
|
Profit for the 6 months to 30 June 2025 |
- |
- |
- |
- |
- |
926 |
926 |
|
Exercise of share options |
5 |
56 |
- |
(21) |
- |
21 |
61 |
|
At 30 June 2025 |
3,121 |
6,259 |
6 |
201 |
15,736 |
(11,644) |
13,679 |
|
Profit for the 6 months to 31 December 2025 |
- |
- |
- |
- |
- |
2,597 |
2,597 |
|
Share based payment expense |
- |
- |
- |
100 |
- |
- |
100 |
|
Exercise of share options |
3 |
44 |
- |
- |
- |
- |
47 |
|
At 31 December 2025 |
3,124 |
6,303 |
6 |
301 |
15,736 |
(9,047) |
16,423 |
Statement of Cash flows
for the 6 months ended 31 December 2025
|
|
|
UNAUDITED |
UNAUDITED |
AUDITED |
|
|
|
6 months to 31 December 2025 |
6 months to 31 December 2024 |
12 months to 30 June 2025 |
|
|
|
£'000 |
£'000 |
£'000 |
|
|
|
|
|
|
|
OPERATING ACTIVITIES |
|
|
|
|
|
Profit before taxation |
|
2,641 |
1,262 |
2,211 |
|
Adjustments for: |
|
|
|
|
|
Net gains on investments |
|
(2,970) |
(1,551) |
(2,845) |
|
Investment income |
|
(10) |
(4) |
(54) |
|
Share based payment expense |
|
100 |
- |
- |
|
Tax paid |
|
(6) |
- |
(4) |
|
Operating cashflow before working capital changes |
|
(245) |
(293) |
(692) |
|
Decrease in trade and other receivables |
|
18 |
8 |
(38) |
|
Increase in trade and other payables |
|
421 |
61 |
77 |
|
Net cash inflow/(outflow) from operating activities |
|
194 |
(224) |
(653) |
|
INVESTING ACTIVITIES |
|
|
|
|
|
Purchase of financial assets |
|
(1,628) |
(1,738) |
(4,622) |
|
Disposal of financial assets |
|
2,175 |
2,318 |
5,228 |
|
Investment income |
|
10 |
4 |
54 |
|
Net cash inflow from investing activities |
|
557 |
584 |
660 |
|
FINANCING ACTIVITIES |
|
|
|
|
|
Proceeds of share issues |
|
47 |
- |
61 |
|
Net cash inflow from financing activities |
|
47 |
- |
61 |
|
|
|
|
|
|
|
Net increase in cash and cash equivalents |
|
798 |
360 |
68 |
|
Cash and cash equivalents at start of period |
|
209 |
141 |
141 |
|
|
|
|
|
|
|
Cash and cash equivalents at end of period |
|
1,007 |
501 |
209 |
Notes to the unaudited interim statement
for the 6 months ended 31 December 2025
1. General information
The Company is a limited company quoted on AIM, a market of the London Stock Exchange, and is registered in the Cayman Islands.
The address of its registered office is 190 Elgin Avenue, Georgetown, Grand Cayman, KY1-9001, Cayman Islands. The financial statements are presented in Pounds Sterling which is the Company's functional and presentational currency.
2. Basis of preparation
The interim financial statements of Mineral & Financial Investments Limited have been prepared in accordance with International Financial Reporting Standards (IFRS) as adopted by the European Union (EU) and on the historical cost basis using the accounting policies which are consistent with those set out in the Company's Annual Report and Accounts for the year ended 30 June 2025.
This interim financial information for the 6 months to 31 December 2025 was approved by the board on 17 March 2026.
The unaudited interim financial information for the 6 months to 31 December 2025 does not constitute statutory accounts. The comparative figures for the year ended 30 June 2025 are extracted from the statutory financial statements which contain an unqualified audit report.
3. Earnings per share
|
|
The basic and diluted earnings per share is calculated by dividing the profit/(loss) attributable to owners of the Company by the weighted average number of ordinary shares in issue during the year. |
|||
|
|
|
6 months to 31 December 2025 |
6 months to 31 December 2024 |
12 months to 30 June 2025 |
|
|
|
£'000 |
£'000 |
£'000 |
|
|
Weighted average number of shares for calculating basic earnings per share |
37,806,958 |
37,105,871 |
37,183,679 |
|
|
Weighted average number of shares for calculating fully diluted earnings per share |
42,355,871 |
40,405,871 |
40,405,871 |
4. The interim report is available to view and download from the Company's website: www.mineralandfinancial.com
RNS may use your IP address to confirm compliance with the terms and conditions, to analyse how you engage with the information contained in this communication, and to share such analysis on an anonymised basis with others as part of our commercial services. For further information about how RNS and the London Stock Exchange use the personal data you provide us, please see our Privacy Policy.


Latest directors dealings
- 59 minutes ago HSBC Holdings
- 1 hour ago Record
- 1 hour ago Crism Therapeutics Corporation Ord Npv
- 1 hour ago CQS New City High Yield Fund Limited
- 1 hour ago Caledonia Investments