Final results for the year ended 31 March 2026
Summary by AI BETAClose X
25 June 2026
Mind Gym plc
('MindGym', the 'Group' or the 'Company')
Final results for the year ended 31 March 2026
Returned to profitability in H2 and grew recurring revenue base
MindGym (AIM: MIND), the global provider of human capital and business improvement solutions, announces its audited results for the year ended 31 March 2026.
Results summary
|
|
12 months to 31 Mar 2026 (FY26) |
12 months to 31 Mar 2025 (FY25) |
Change |
|
Revenue |
£29.9m |
£38.6m |
-23% |
|
Revenue (like for like) |
£29.9m |
£32.3m |
-7% |
|
Gross profit margin |
87.2% |
86.6% |
|
|
Adjusted administrative expenses1 |
£25.5m |
£31.7m |
|
|
Adjusted EBITDA profit/(loss)2 |
£0.6m |
£1.9m |
|
|
Statutory (loss) before tax |
(£5.2m) |
(£6.2m) |
|
|
Diluted EPS (adjusted) 2 |
(2.15p) |
(4.16p) |
|
|
Diluted EPS (unadjusted) |
(5.24p) |
(8.16p) |
|
|
Cash (used in)/generated from operations |
£0.6m |
£1.5m |
|
|
Cash at bank |
(£0.3m) |
£0.6m |
|
|
Capital expenditure |
£0.8m |
£1.6m |
|
1 Adjusted administrative expenses exclude the impact of £5.6m (FY24: £7.9m) of exceptional costs, depreciation and amortisation incurred in the period
2 Adjusted results exclude the impact of £4.2m (FY24: £5.4m) of exceptional costs incurred in the period
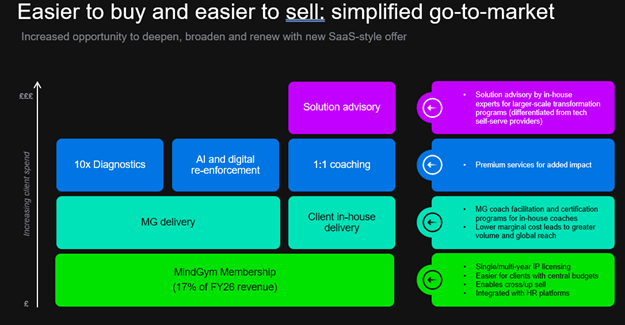
The year to 31 March 2026 was the second year of our three-year transformation from an episodic training provider to a strategic behavioural-change partner, with products that are easier to buy, sell and renew:
· Returned to profitability in H2, grew recurring revenue base and improved margins
· Strengthened sequentially through the year: H2 revenue around 20% higher than H1
· Licensing and membership revenue grew from 9% to 17% of total revenue year on year (26% in Q4)
· Adjusted administrative expenses fell 19% reflecting the benefit of cost reductions
· Net debt reduced in H2 and overdraft facility renewed
Operational summary
· Progress on new go-to-market strategy
o Further progress in transitioning revenue away from episodic engagements to a meaningful and growing proportion of recurring licensing revenue
o MindGym Memberships increased to 62 customers from 11 in FY25
· Maturing our product and delivery platform infrastructure
o Further progress away from internally built technology platforms towards best-in-class partner solutions
o Two new partnerships signed, for our diagnostic offering and digital learning platform respectively
· Increased commercial effectiveness
o Reshaped sales organisation and incentivisation
o Primary emphasis on targeting new client wins and membership renewals
Current trading and outlook
· We are pleased with the progress the Group has made to date and continue to see positive commercial momentum, particularly in our membership and licensing solutions
· However, our market is expected to remain challenging in FY27, driven by ongoing pressure on HR spend as organisations manage geopolitical and macroeconomic uncertainty
· Pipeline growth has improved as Q1 has progressed, although trading remains challenging despite a number of significant contract opportunities that have carried over from FY26
· In response to the challenging trading environment, further action is being taken to reduce the cost base by another £2m on an annualised basis
· Overall, in FY27 we anticipate a return to modest revenue growth alongside positive EBITDA and a strengthened cash position
Review of strategic options
As announced on 27 January 2026, the Board confirmed that it is in discussions with selected third parties as part of a private strategic review (the 'Strategic Review') that may, among other outcomes, result in an offer for the Company. The Strategic Review remains ongoing, and we will update shareholders through further announcements as appropriate.
Christoffer Ellehuus, CEO of MindGym commented:
'FY26 marked the second year of our transformation programme, during which we made strong progress in reshaping MindGym into a more efficient, scalable and digitally enabled organisation. We made further progress in transitioning our revenue base away from episodic engagements towards a model with a meaningful and growing proportion of recurring licensing revenue.
While HR budgets continue to be under pressure, we expect continued commercial momentum, particularly in our membership and licensing solutions. We anticipate a return to modest revenue growth alongside positive EBITDA and a strengthened cash position.'
Enquiries
Mind Gym plc +44 (0)20 7376 0626
Christoffer Ellehuus, Chief Executive Officer
Nicholas Stone, Interim Chief Financial Officer
Panmure Liberum (Nominated Adviser and Broker) +44 (0)20 3100 2000
Nick How
Will King
MHP (Public Relations Advisor) +44 (0)7831 406117
Reg Hoare mindgym@mhpgroup.com
Jake Terry
About MindGym
MindGym is a Group that delivers business improvement solutions using scalable, proprietary products based on behavioural science. The Group operates in three global markets: business transformation, human capital management and learning & development.
MindGym is listed on the London Stock Exchange Alternative Investment Market (ticker: MIND) and headquartered in London. The business has offices in London, New York and Singapore.
Further information is available at www.themindgym.com
Note: Like-for-like profit measures exclude revenue generated in FY25 from the long-term framework contract that concluded in that year.
Statement of the Executive Chair
For 25 years, MindGym has helped the world's most ambitious organisations use the science of human behaviour to realise improved business performance. While our purpose is unchanged, we are building a new delivery model to meet the needs of a rapidly evolving market.
FY26 represented the second year of our three-year transformation from an episodic training provider to a strategic behavioural-change partner, with products that are easier to buy, sell and renew.
Although it was a demanding year in a difficult market which saw full-year revenue decline, MindGym made real progress against its transformation plan. We returned to profitability in the second half of the year, grew our recurring revenue base, improved gross margins and strengthened sequentially through the year.
Results
For the year as a whole, revenue was £29.9m, 7% below the prior year on a like-for-like basis (excluding the £6.3m multi-year framework contract which benefited FY25). Breaking this down, trading improved materially through the year and second-half revenue was around 20% higher than the first half, growing in each quarter.
Tighter financial discipline maintained profitability for the full year. The Group entered the year with a cost base around £5m lower than FY25, and adjusted EBITDA returned to a profit of £0.6m for the year (FY25: £1.9m), having been a loss of around £1m at the half-year. Gross margin improved by 0.6% to 87.2% (FY25:86.6%). Net debt as at 31 March 2026 was £0.3m (31 March 2025: net cash of £0.6m), an improvement on the £1m of net debt at the half-year.
Market conditions
The market for human capital services remains challenging with learning and development spending continuing to see reductions.
However, MindGym is well placed to meet these challenges because the market is moving from activity to evidence. Clients want to know which behaviours drive performance, which interventions work and where limited budgets should be focused - and our strength is using behavioural science, data and practical application to answer exactly those questions. Our High Performance Behaviour Model now provides the single, evidence-based architecture underpinning our products and data.
Our progress
During the year we rebuilt our commercial engine, sharpened our go-to-market strategy and improved the digital delivery of our membership and licence products. We launched our new leadership offering, which addresses an estimated 66% of the development needs our clients bring to us, based on our pipeline demarcation. Client advocacy remains strong, with Net Promoter Scores well above industry norms and strong returning customer statistics with 55%% of current opportunities coming from existing customers.
Our diagnostics gained traction too, turning behavioural data into clear evidence of what drives performance and pulling through demand for our wider offer. Licensing and membership revenue grew from 9% of the total in FY25 to 17% in FY26.
The clearest evidence of the transformation is the growth in recurring membership revenue, which rose to around 17% of revenue for the year - and 21% in the second half - up from 9% a year earlier, some £3.5m in total. Recurring revenue of this kind improves the quality of our earnings and reduces our exposure to discrete buying decisions - the foundation of a more durable and more valuable business.
Taken together - proprietary intellectual property in our High Performance Behaviour Model, a growing body of behavioural data, recurring membership revenue, and a materially leaner cost base - these are the durable assets that give the Board confidence in the future performance of the business.
Our people
None of this would have been possible without our people. FY26 asked a great deal of them, and they responded with the resilience, rigour and commitment that have always defined MindGym. On behalf of the Board, I thank them. I also thank our clients, whose continued loyalty remains the clearest evidence of the value we create, and our shareholders for their continued support.
Dividend
No dividend has been paid or proposed during the year, nor in the prior period. The Board will keep the appropriateness of dividend payments under periodic review.
Board changes
Emily Fyffe, the Group's Chief Financial Officer, began maternity leave on 1 October 2025. Nick Stone joined in August 2025 to cover this period as Interim Chief Financial Officer, in a non-board-director capacity. Emily is expected to return from her leave in October 2026.
Review of strategic options
As announced on 27 January 2026, the Board confirmed that it is in discussions with selected third parties as part of a private strategic review (the 'Strategic Review') that may, among other outcomes, result in an offer for the Company. The Strategic Review remains ongoing, and we will update shareholders through further announcements as appropriate.
Outlook
The Board is encouraged by the stronger trading performance in the second half of FY26 and transition to a higher share of license and membership revenues as part of our transformation.
However, the market remains challenging. Geopolitical and economic uncertainty, and shifting priorities within HR, have slowed client decision-making, and the year has begun more slowly than we would have liked. The Board has responded decisively, taking further action to align the cost base and protect the Group's cash, devising plans to remove a further c.£2m of annualised costs. Overall, we anticipate a return to modest revenue growth for the year alongside positive EBITDA and a strengthened cash position.
As we so often tell clients, transformations are never easy but, two years into our three-year transformation, the foundations of a higher-quality business are in place. We approach the rest of the year ahead with confidence in the actions we have taken, what we have built and in the opportunity ahead.
Octavius Black
Executive Chair
24 June 2026
CEO Review
Progress on new go-to-market strategy
FY26 marked the second year of our transformation programme, during which we made strong progress in reshaping MindGym into a more efficient, scalable and digitally enabled organisation. We made further progress in transitioning our revenue base away from episodic engagements towards a model with a meaningful and growing proportion of recurring licensing revenue.
Total revenue for the year was £29.9m (FY25: £38.6m) and can be broken down across our reshaped revenue categories as follows:
|
|
EMEA |
America |
Group |
|
Facilitation |
63.0% |
56.0% |
60.5% |
|
Solutions Advisory |
20.1% |
20.0% |
20.0% |
|
Licensing |
14.3% |
20.9% |
16.7% |
|
Premium Add On |
2.6% |
3.1% |
2.8% |
We are pleased to report that licensing revenue grew to 17% of total revenue in FY26 compared to 9% in FY25. On a quarterly basis, approximately 26% of revenue in the final quarter of FY26 came from licensing. Central to the growth in licensing revenue is our new MindGym Membership, which provides clients with unlimited access to MindGym content during the membership period, delivered through a digital learning-management platform.
Three of our larger membership sales were multi-year licences, with one extending through to 2029. In total, we now have 62 customer memberships, 34 in the US market and 28 in EMEA. This compares with 11 at 31 March 2025, 9 in the US and 2 in EMEA, representing a 463% increase.
We are encouraged to see customers adopting this more flexible and accessible way of engaging with MindGym solutions. The model enables us to embed more deeply into our clients' strategic priorities and workflows. It is also notable that the membership model is gaining traction more quickly in the US market, which has faced challenges over the past three years.
While membership sales are the primary focus of our go-to-market strategy, contributing approximately £5.0m in revenue, the licensing category also includes certification revenues for clients who deliver their own workshops and access to the Lio AI coaching tool.
Maturing our product and delivery platform infrastructure
At the outset of our transformation strategy, we set out our intention to move away from internally built technology platforms towards best-in-class partner solutions. This shift enables faster delivery, improved client experience and lower operating costs.
Last fiscal year, we announced the implementation of the Administrate talent-management platform to streamline the administration and reduce the cost of delivering programmes.
During FY26, we partnered with EvolveAssess to scale delivery and provide enhanced digital reporting and analytics for our new 10x diagnostic offering. The first phase of this capability was launched in Q4, and we expect full implementation by Q2 FY27. The roll-out of this new diagnostic platform will replace our legacy systems.
We also entered into a partnership with Thought Industries, a leading digital learning experience platform provider, at the end of Q4 FY26. Once fully launched in Q2 FY27, this platform will serve as the central digital access point for all MindGym Membership clients, enabling them to explore content as well as design behaviour change journeys and deploy them within their organisations.
Increased commercial effectiveness
With a new Chief Commercial Officer appointed at the beginning of FY26, we have made solid progress in transforming our sales organisation and improving commercial effectiveness.
During FY26, we introduced a new sales incentive plan that rewards sellers more heavily for acquiring new clients ('new logos'), rather than focusing predominantly on existing accounts. As a result, new logo revenue increased from 4% in Q1 FY26 to 19% in Q4 FY26.
We have also reshaped the sales organisation to prioritise outbound sales and consistent achievement of quarterly targets, rather than focusing primarily on service delivery for existing clients. A clear indicator of this improved commercial discipline is that the strongest sales months in FY26 were consistently the final month of each quarter.
In FY27, we are further strengthening this approach by shifting sales incentives to be based on new business bookings rather than recognised revenue. To support this transition, we are evolving our Client Delivery Team into a more commercially focused Client Success function, with a primary emphasis on membership renewals and commercial delivery. This change will enable our sales teams to focus more fully on outbound growth.
Focus for FY27
We continue to be focused on our transformation strategy. As the Executive Chair notes, trading in the first quarter of FY27 has been challenging, but we are encouraged by an improving pipeline and continued commercial momentum in our membership and licensing solutions. We continue to maintain a strong focus on efficiency and cost reduction to protect profitability and cash flow, and to make our products easier to buy, sell and renew.
Christoffer Ellehuus
Chief Executive
24 June 2026
Financial review
On a like-for-like basis, revenue for the year of £29.9m represented a year-on-year reduction of 7% (FY25: £32.3m) when compared to revenue excluding the multi-year framework agreement with a major UK client. It was a reduction of 23% if the £6.3m from that agreement was included in the total for FY25 of £38.6m. The year was a tale of two halves, with the first half generating revenue of £13.5m (H1 FY25: £20.2m) and the second half £16.4m (H2 FY25: £18.4m).
As a result of the weaker revenues, we continued to focus on realigning the cost base and implementing operational efficiencies to maintain adjusted EBITDA profitability. This involved reducing administrative expenses in the period compared to FY25 by £8.5m (22%), following the £11.1m (22%) reduction in FY25 compared to FY24.
These changes resulted in one-off exceptional charges in the period of £4.2m comprising of:
· £3.0m digital asset impairment
· £1.2m staff restructuring
The majority of the cost saving measures were delivered during the second half of the year meaning that an adjusted EBITDA loss in H1 FY26 of £1.0m was converted into an overall adjusted EBITDA profit for the year of £0.6m. An overall loss for the year of £5.2m was reported compared to £6.2m for FY25.
This loss resulted in an adjusted diluted EPS of (2.15p) (FY25: 4.16p loss) and an unadjusted diluted EPS of (5.24p) (FY25: £8.16p loss).
As at 31 March 2026, the group had net debt of £0.3m (FY25: net cash £0.6m).
Gross profit remained at similar levels to FY25 at 87.2% or £26.1m (FY25: £33.4m). Administrative expenses reduced materially to £31.0m, down from £39.6m in FY25, demonstrating the impact of the cost reduction measures implemented over the past 18 months. As a result, the operating loss narrowed to £5.3m, compared with £8.2m in the prior year.
The Group generated £0.6m from operating activities despite the operating loss for the period as a result of strong cash management measures and the increase in upfront payments within new client contracts, particularly in respect of the new membership licences.
To illustrate this, deferred income at 31 March 2026 was up 31% to £2.8m (31 March 25: £2.2m), trade debtors were down 22% to £4.1m (31 March 25: £5.2m) and client cash receipts for the period were £37.5m (FY25: £43.8m), down 15% compared to revenue recognised of £29.9m, down 22% from £38.6m in FY25.
Revenue
Revenue for the US region fell 25% YoY to £11.0m (FY25: £14.7m).
Revenue performance in EMEA fell 21% YoY to £18.9m (FY25: £23.9m).
|
|
Year to 31 March 2026 |
Year to 31 March 2025 |
Change |
|
|
£'000 |
£'000 |
% |
|
Group Statutory View |
29,902 |
38,606 |
-23% |
|
EMEA |
18,870 |
23,892 |
-21% |
|
US |
11,032 |
14,714 |
-25% |
Revenue mix by type compared to previous year
|
|
FY26 |
FY25 |
% change |
|
Facilitation |
60.5% |
68.6% |
-11.8% |
|
Solutions Advisory |
20.0% |
20.0% |
- |
|
Licensing |
16.7% |
9.2% |
81.5% |
|
Premium Add On |
2.8% |
2.2% |
27.3% |
|
Total |
100% |
100% |
|
|
Year ended 31 March 2026 |
||||
|
Revenue type |
EMEA |
US |
Global |
|
|
Facilitation |
63.0% |
56.0% |
60.5% |
|
|
Solutions Advisory |
20.1% |
20.0% |
20.0% |
|
|
Licensing |
14.3% |
20.9% |
16.7% |
|
|
Premium add on |
2.6% |
3.1% |
2.8% |
|
|
Total |
100% |
100% |
100% |
|
|
Year ended 31 March 2025 |
|||
|
Revenue type |
EMEA |
US |
Global |
|
Facilitation |
71.6% |
63.2% |
68.6% |
|
Solutions Advisory |
20.3% |
19.9% |
20.0% |
|
Licensing |
6.0% |
14.4% |
9.2% |
|
Premium add on |
2.1% |
2.5% |
2.2% |
|
Total |
100% |
100% |
100% |
Gross profit
Gross margin increased to 87.2% (FY25: 86.6%), up 0.6%, primarily reflecting a lower mix of delivery revenue and an increase in licensing.
Both regions saw an improvement in gross margin; EMEA gross margin of 86.6% represented an increase of 0.7% on FY25 (85.9%), and US gross margin of 88.3% represented an increase of 0.6% on FY25 (87.8%).
Operating expenditure and profitability
Adjusted administrative expenses, excluding depreciation, amortisation and exceptional costs, of £25.5m represented a year-on-year reduction of 19% (FY25: £31.7m), reflecting the impact of the cost reduction exercise undertaken in the period.
This resulted in an adjusted EBITDA profit for the period of £0.6m (FY25: £1.9m), at a margin of 2.1% (FY25: 4.8%).
The loss before tax for the year was £5.2m (FY25: loss of £6.2m). This figure was impacted by £4.2m of exceptional costs, which included £1.2m in restructuring costs and £3.0m non-cash impairment of digital assets.
Capital expenditure
In FY25, a review of digital product expenditure was undertaken, which resulted in a decision to focus investment on digital assets that were already revenue generating, principally diagnostics. This contributed to a 56% year-on-year reduction in capital expenditure to £0.8m (FY25: £1.6m), with investment activities focused on building out diagnostics during the year.
In March 2026, in line with the Group's strategy to leverage digital partnerships to drive operational efficiencies and deliver scalable programmes, the Group signed a vendor agreement which replaced internally developed intangible assets that were in use pertaining to the diagnostics platform. This resulted in a one-off non-cash £3.0m impairment charge. MindGym diagnostic assessment tools will continue to be delivered through the new vendor platform in a more scalable and cost-effective way.
Taxation
A net full year tax charge of £0.1m was booked in FY26 (FY25: £2m).
The tax credit generated from the loss before tax was offset by a reduction in the deferred tax asset recognised.
The Group policy is to recognise deferred tax assets for carried forward losses expected to be used in a 3-4-year period following year end. As a result of continued market uncertainty, and in line with FY25, it was determined that, at the year-end date, there was not sufficient evidence to support the forecast profits materialising in the previously used 4-year recognition period.
This resulted in a reduction to the deferred tax asset with £0.3m being recognised for carried forward losses. This is offset by a deferred tax liability related to the timing difference of capitalised development costs.
The Board has full confidence in the strategy and in generating future profits and will reassess the recognition of deferred tax assets in future reporting periods. The Group carries £19.4m of unrecognised tax losses (FY25: £14.2m) resulting in an unrecognised deferred tax asset of £4.9m.
Earnings per share
There was an adjusted diluted loss per share in the period of 2.15p (FY25: 4.16p loss). The unadjusted diluted loss per share was 5.24p (FY25: 8.16p loss).
On an undiluted basis the adjusted loss per share was 2.15p (FY25: 4.16p loss) and the unadjusted loss per share was 5.24p (FY25: 1.16p loss).
Dividends
No dividend has been paid or proposed for the year ended 31 March 2026. The Board will continue to keep the appropriateness of dividend payments under periodic review and will next provide an update at the time of the H1 FY27 interim announcement.
Balance sheet
Cash and cash equivalents decreased from £0.6m in FY25 to net debt of £0.3m in FY26. This included the impact of £0.8m of capital expenditure in the period, reduced from £1.6m in FY25.
During the period, the Group negotiated to renew the £4m overdraft facility which replaced the existing RCF facility in FY25 and remained in place until April 2026. In April 2026, the facility was renewed at £2m until 31 March 2027.
Net trade receivables reduced by £1.1m from FY25, with the proportion of overdue receivables at 31 March 2026 increasing to 7%, up from 5% in FY25 and 6% in FY24.
|
Cash conversion |
31 March 2026 |
31 March 2025 |
|
|
£'000 |
£'000 |
|
Cash generated from operations |
617 |
1,471 |
|
Cash conversion |
31 March 2026 |
31 March 2025 |
|
|
£'000 |
£'000 |
|
Overdue debtors % |
7% |
5% |
Going concern
The Board has conducted its routine scenario modelling of our cash position, taking into consideration the challenging Q1 trading. The Board has also directed a further round of cost saving measures to be implemented which are designed to remove an additional annualised £2m from operating costs for FY27.
The Group has access to a £2m bank overdraft facility which expires on 31 March 2027 and continues to apply strong cash management within its operations. During FY26 the Group used its overdraft facility to manage working capital and expects to do so again in FY27. However, current expectations are that by 31 March 2027, the Group will be in a net cash position.
The Board recognises that in other downside scenarios the facility may be required after 31 March 2027. While it isn't guaranteed, the Board is confident that it will be renewed or an alternate source of funding found to replace it.
When the bank facility and the reduced operating costs are taken into account, the directors are confident that the Group has adequate resources to continue in operational existence for the 12 months following this date. In reaching this view, the Board has reviewed scenarios including a range of revenues and further cost-reduction actions that can be taken to mitigate against the financial impact of a downturn
The scenarios reviewed are described in more detail in Note 2 to this financial information.
Financial risk management
The Group has a diverse portfolio in excess of 350 clients across many industrial sectors and countries. This year, no single client accounted for more than 10% of Group revenue.
The Group has translational foreign currency exposure arising on the consolidation of overseas company results into Sterling. Where possible, the exposure is naturally hedged; for example, by matching US Dollar revenues with US Dollar costs in the US subsidiary. The Group does not currently use forward exchange contracts or currency options to hedge currency risk.
Nicholas Stone
Interim Chief Financial Officer
24 June 2026
MIND GYM PLC CONSOLIDATED STATEMENT OF COMPREHENSIVE INCOME
|
|
|
Year to 31 March 2026 |
Year to 31 March 2025 |
|
|
Note |
£'000 |
£'000 |
|
Continuing operations |
|
|
|
|
Revenue |
3 |
29,902 |
38,606 |
|
Cost of sales |
|
(3,825) |
(5,163) |
|
Gross profit |
|
26,077 |
33,443 |
|
Administrative expenses |
|
(31,088) |
(39,598) |
|
Other income |
3 |
- |
107 |
|
Operating (loss) |
4 |
(5,011) |
(6,048) |
|
Finance income |
8 |
- |
1 |
|
Finance costs |
8 |
(157) |
(142) |
|
(Loss) before tax |
|
(5,168) |
(6,189) |
|
|
|
|
|
|
Adjusted (loss) before tax |
|
(1,004) |
(803) |
|
Total adjusting items |
5 |
(4,164) |
(5,386) |
|
|
|
|
|
|
(Loss) before tax |
|
(5,168) |
(6,189) |
|
Tax on (loss) |
9 |
(98) |
(2,000) |
|
(Loss) for the financial period from continuing operations attributable to owners of the parent |
|
(5,266) |
(8,189) |
|
|
|
|
|
|
Items that may be reclassified subsequently to profit or loss |
|
|
|
|
Exchange translation differences on consolidation |
|
(33) |
(100) |
|
Other comprehensive (loss) for the period attributable to the owners of the parent |
|
(33) |
(100) |
|
Total comprehensive (loss) for the period attributable to the owners of the parent |
|
(5,299) |
(8,289) |
|
|
|
|
|
|
(Loss) per share (pence) |
|
|
|
|
Basic |
10 |
(5.24) |
(8.16) |
|
Diluted |
|
(5.24) |
(8.16) |
|
Adjusted (loss) per share (pence) |
|
|
|
|
Basic |
10 |
(2.15) |
(4.16) |
|
Diluted |
|
(2.15) |
(4.16) |
MIND GYM PLC CONSOLIDATED STATEMENT OF FINANCIAL POSITION
|
|
|
31 March 2026 |
31 March 2025 |
|
|
Note |
£'000 |
£'000 |
|
Non-current assets |
|
|
|
|
Intangible assets |
12 |
596 |
3,749 |
|
Property, plant and equipment |
13 |
751 |
1,199 |
|
Deferred tax assets |
9 |
201 |
303 |
|
|
|
1,548 |
5,251 |
|
Current assets |
|
|
|
|
Inventories |
14 |
12 |
25 |
|
Trade and other receivables |
15 |
6,094 |
6,469 |
|
Current tax receivable |
|
105 |
95 |
|
Cash and cash equivalents |
|
494 |
570 |
|
|
|
6,705 |
7,159 |
|
Total assets |
|
8,253 |
12,410 |
|
|
|
|
|
|
Current liabilities |
|
|
|
|
Trade and other payables |
16 |
8,302 |
7,647 |
|
Borrowings |
19 |
798 |
- |
|
Lease liability |
17 |
526 |
518 |
|
Redeemable preference shares |
18 |
50 |
50 |
|
|
|
9,676 |
8,215 |
|
Non-current liabilities |
|
|
|
|
Lease liability |
17 |
181 |
646 |
|
|
|
|
|
|
Total liabilities |
|
9,857 |
8,861 |
|
Net (Liabilities)/assets |
|
(1,604) |
3,549 |
|
Equity |
|
|
|
|
Share capital |
21 |
1 |
1 |
|
Share premium |
|
275 |
274 |
|
Share option reserve |
|
499 |
441 |
|
Retained earnings |
|
(2,379) |
2,833 |
|
Equity attributable to owners of the parent company |
|
(1,604) |
3,549 |
The financial information was approved and authorised for issue by the Board of Directors on 24 June 2026 and were signed on its behalf by:
Christoffer Ellehuus
Chief Executive Officer
MIND GYM PLC CONSOLIDATED STATEMENT OF CHANGES IN EQUITY
|
|
|
Share capital |
Share premium |
Share option reserve |
Retained earnings |
Total equity |
|
|
Note |
£'000 |
£'000 |
£'000 |
£'000 |
£'000 |
|
At 1 April 2024 |
|
1 |
258 |
481 |
11,097 |
11,837 |
|
|
|
|
|
|
|
|
|
(Loss) for the period |
|
- |
- |
- |
(8,189) |
(8,189) |
|
Other comprehensive income: |
|
|
|
|
|
|
|
Exchange translation differences on consolidation |
|
- |
- |
- |
(100) |
(100) |
|
Total comprehensive (loss) for the period |
|
- |
- |
- |
(8,289) |
(8,289) |
|
Exercise of options |
|
- |
16 |
(22) |
22 |
16 |
|
Credit to equity for share-based payments |
22 |
- |
- |
(18) |
- |
(18) |
|
Tax related to share-based payments |
9 |
- |
- |
- |
3 |
3 |
|
At 31 March 2025 |
|
1 |
274 |
441 |
2,833 |
3,549 |
|
Loss for the period |
|
- |
- |
- |
(5,265) |
(5,265) |
|
Other comprehensive loss: |
|
|
|
|
|
|
|
Exchange translation differences on consolidation |
|
- |
- |
- |
(32) |
(32) |
|
Total comprehensive (loss) for the period |
|
- |
- |
- |
(5,297) |
(5,297) |
|
Exercise of options |
|
- |
1 |
(80) |
80 |
1 |
|
Credit to equity for share-based payments |
22 |
- |
- |
138 |
- |
138
|
|
Tax related to share-based payments |
9 |
- |
- |
- |
5 |
5 |
|
At 31 March 2026 |
|
1 |
275 |
499 |
(2,379) |
(1,604) |
MIND GYM PLC CONSOLIDATED STATEMENT OF CASH FLOWS
|
|
|
Year to 31 March 2026 |
Year to 31 March 2025 |
|
|
Note |
£'000 |
£'000 |
|
Cash flows from operating activities |
|
|
|
|
(Loss)/Profit for the financial period |
|
(5,266) |
(8,189) |
|
Adjustments for: |
|
|
|
|
Amortisation of intangible assets |
12 |
923 |
1,531 |
|
Impairment of intangible asset |
12 |
2,981 |
4,404 |
|
Depreciation of property, plant and equipment |
13 |
543 |
987 |
|
Loss on disposal of intangible assets |
12 |
- |
26 |
|
Loss on disposal of property, plant and equipment |
13 |
- |
83 |
|
Net finance costs |
8 |
157 |
141 |
|
Taxation charge |
9 |
98 |
2,000 |
|
Decrease in inventories |
|
13 |
15 |
|
Decrease in trade and other receivables |
|
374 |
1,318 |
|
Increase/(Decrease) in trade and other payables |
|
655 |
(827) |
|
Share-based payment credit |
22 |
138 |
(18) |
|
Cash generated from operations |
|
617 |
1,471 |
|
Net tax received |
|
- |
165 |
|
R&D refund on account |
|
- |
295 |
|
Net cash generated from operating activities |
|
617 |
1,931 |
|
Cash flows from investing activities |
|
|
|
|
Purchase of intangible assets |
12 |
(751) |
(1,458) |
|
Purchase of property, plant and equipment |
13 |
(36) |
(42) |
|
Interest received |
8 |
- |
1 |
|
Net cash used in investing activities |
|
(787) |
(1,499) |
|
Cash flows from financing activities |
|
|
|
|
Cash repayment of lease liabilities |
|
(591) |
(1,047) |
|
Issuance of ordinary shares |
|
1 |
16 |
|
Interest paid |
8 |
(117) |
(74) |
|
Net cash used in financing activities |
|
(707) |
(1,105) |
|
Net decrease in cash and cash equivalents |
|
(877) |
(673) |
|
Cash and cash equivalents at beginning of period |
|
570 |
1,369 |
|
Effect of foreign exchange rate changes |
|
3 |
(126) |
|
Cash and cash equivalents at the end of period |
|
(304) |
570 |
|
Cash and cash equivalents at the end of period comprise: |
|
|
|
|
Cash at bank and in hand |
|
(304) |
570 |
MIND GYM PLC NOTES TO THE GROUP FINANCIAL INFORMATION
1. General information
Mind Gym plc ('the Company') is a public limited company incorporated in England and Wales, and its ordinary shares are traded on the Alternative Investment Market of the London Stock Exchange ('AIM'). The address of the registered office is 160 Kensington High Street, London W8 7RG. The group consists of Mind Gym plc and its subsidiaries, Mind Gym (USA) Inc., Mind Gym Performance (Asia) Pte. Ltd, and Mind Gym (Canada) Inc. (together 'the Group').
The principal activity of the Group is to apply behavioural science to transform the performance of companies and the lives of the people who work in them. The Group does this primarily through research, strategic advice, management and employee development, employee communication, digital products, diagnostics and related services.
2. Summary of material accounting policies
Basis of preparation
The financial information set out in this document does not constitute the Company's statutory accounts for the years ended 31 March 2026 or 2025. Statutory accounts for the years ended 31 March 2025 and 31 March 2026, which were approved by the Directors on 24 June 2026, have been reported on by the Independent Auditors. The Independent Auditor's Reports on the Annual Report and Financial Statements for each of 2025 and 2026 were unqualified and did not contain a statement under 498(2) or 498(3) of the Companies Act 2006. In relation to The Independent Auditor's Report on the Annual Report and Financial Statements for 2026 attention was drawn to a material uncertainty in relation to going concern as detailed in note 2 of the financial information.
Statutory accounts for the year ended 31 March 2025 have been filed with the Registrar of Companies. The statutory accounts for the year ended 31 March 2026 will be delivered to the Registrar in due course, and will be available from the Company's registered office at 160 Kensington High Street, London, W8 7RG and from the Company's website: www.themindgym.com
The financial information set out in these results has been prepared using the recognition and measurement principles of UK adopted international accounting standards and with those parts of the Companies Act 2006 applicable to companies reporting under IFRS (except as otherwise stated). The accounting policies adopted in these results have been consistently applied to all the years presented and are consistent with the policies used in the preparation of the financial statements for the year ended 31 March 2025. There are deemed to be no new standards, amendments and interpretations to existing standards, which have been adopted by the Group that have had a material impact on the financial statements.
The financial information is presented in pounds sterling. All values rounded to the nearest thousand except where otherwise indicated.
The principal accounting policies in the preparation of this financial information is set out below. These policies have been consistently applied to all the years presented unless otherwise stated.
Going concern
The Group prepares cash flow forecasts and re-forecasts regularly as part of the business planning process. The forecasts include scenarios with a range of revenues and cost-reduction actions that could be taken to mitigate a downturn while operating within the overdraft facility available. These forecasts have been analysed in light of global geopolitical and macroeconomic factors and the £2m bank overdraft facility available which is expected to be utilised in the ordinary course of the business. The cash flow forecasts have been subject to stress testing, scenario modelling and sensitivity analysis, which the directors consider sufficiently robust.
The scenario modelling has assessed the impact of various degrees of downturn in medium-term revenues generated. The directors note that in a downturn scenario the Group also has the option to rationalise its cost base, including cuts to discretionary capital and overhead expenditure. The directors consider that the required level of change to the Group's forecasted cash flows to give rise to a material risk over going concern is sufficiently remote in the light of the historic and ongoing cost management measures.
The directors are confident that the overdraft facility will be renewed on 31 March 2027 but this is subject to agreement with our bank and is not guaranteed. As a result, this indicates that a material uncertainty exists that may cast doubt on the Company and Group's ability to continue as a going concern and as a result it may be unable to realise its assets and discharge its liabilities in the normal course of business.
As a result of these assessments performed, the Group's forecast liquidity position and clients predominantly comprising blue-chip corporates, the directors have a reasonable expectation that the Company and Group has adequate resources to continue in operational existence for the 12 months following the date of this report. Accordingly, they continue to adopt the going-concern basis in preparing the Annual Report and Accounts.
The financial information does not include any adjustments that would be necessary if the Group were unable to continue as a going concern.
3. Segmental analysis
Operating segments are reported in a manner consistent with the internal reporting provided to the chief operating decision-maker, who is responsible for allocating resources and assessing the performance of the business. The chief operating decision-maker has been identified as the Board. The Group has two operating segments: EMEA (comprising the United Kingdom and Singapore) and America (comprising the United States and Canada).
Both segments derive their revenue from a single business activity, the provision of human capital and business improvement solutions.
During the year ended 31 March 2026, the Group refined its internal management reporting to better reflect the way performance is assessed. This resulted in a revision to the categorisation of revenue. Accordingly, the Group has re-presented its segmental disclosures to align with this updated product mix. This change represents a reclassification of revenue between product categories only and does not constitute a change in operating segments.
Comparative information has been re-presented on a consistent basis. There is no impact on total revenue, operating profit, profit before tax or net assets for any period presented.
The Group's business is not highly seasonal, and the Group's customer base is diversified. In FY25, the Group generated £6.4m of revenue from a single customer which accounted for 16.5% of total revenue. During the year ended 31 March 2026, no customer individually accounted for 10% or more of the Group's revenue.
Segment results for the year ended 31 March 2026
Segment result
|
|
EMEA |
America |
Total |
|
|
£'000 |
£'000 |
£'000 |
|
Revenue |
18,870 |
11,032 |
29,902 |
|
Cost of sales |
(2,529) |
(1,296) |
(3,825) |
|
Administrative expenses |
(23,744) |
(7,344) |
(31,088) |
|
(Loss)/profit before inter-segment charges |
(7,403) |
2,392 |
(5,011) |
|
Inter-segment charges |
2,388 |
(2,388) |
- |
|
Operating (loss)/profit - segment result |
(5,015) |
4 |
(5,011) |
|
Finance costs |
|
|
(157) |
|
Loss before taxation |
|
|
(5,168) |
|
|
|
|
|
|
Adjusted (loss)/profit before tax |
EMEA |
America |
Total |
|
|
£'000 |
£'000 |
£'000 |
|
Operating (loss)/profit - segment result |
(5,014) |
4 |
(5,011) |
|
Adjusting items |
806 |
377 |
1,183 |
|
Impairment - Digital Asset |
2,981 |
- |
2,981 |
|
Adjusted LBIT/EBIT |
(1,229) |
385 |
(847) |
|
Finance costs |
|
|
(157) |
|
Loss before taxation |
|
|
(1,004) |
Management does not report segmental assets and liabilities internally and as such an analysis is not reported.
The mix of revenue for the year ended 31 March 2026 is represented below.
|
|
EMEA |
America |
Group |
|
Facilitation |
63.0% |
56.0% |
60.5% |
|
Solutions advisory |
20.1% |
20.0% |
20.0% |
|
Licensing |
14.3% |
20.9% |
16.7% |
|
Premium add on |
2.6% |
3.1% |
2.8% |
Table below for comparative purposes only.
|
|
EMEA |
America |
Group |
|
Delivery |
61.7% |
54.0% |
59.0% |
|
Design |
18.3% |
17.7% |
18.0% |
|
Digital |
5.7% |
7.1% |
6.2% |
|
Licensing and certification |
12.1% |
20.1% |
15.0% |
|
Other |
1.7% |
0.7% |
1.3% |
|
Advisory |
0.5% |
0.4% |
0.5% |
The vast majority of the Group's contracts are for the delivery of services within the next 12 months. The Group has therefore taken advantage of the practical expedient in paragraph 121(a) of IFRS 15 not to disclose information about remaining performance obligations.
Segment results for the year ended 31 March 2025
Segment result
|
|
EMEA |
America |
Total |
|
|
£'000 |
£'000 |
£'000 |
|
Revenue |
23,892 |
14,714 |
38,606 |
|
Cost of sales |
(3,365) |
(1,798) |
(5,163) |
|
Administrative expenses |
(27,275) |
(12,323) |
(39,598) |
|
(Loss)/profit before inter-segment charges |
(6,748) |
593 |
(6,155) |
|
Inter-segment charges |
532 |
(532) |
- |
|
Other income |
107 |
- |
107 |
|
Operating (loss)/profit - segment result |
(6,109) |
61 |
(6,048) |
|
Finance income |
|
|
1 |
|
Finance costs |
|
|
(142) |
|
Loss before taxation |
|
|
(6,189) |
|
Adjusted (loss)/profit before tax |
EMEA |
America |
Total |
|
|
£'000 |
£'000 |
£'000 |
|
Operating (loss)/profit - segment result |
(6,109) |
61 |
(6,048) |
|
Adjusting items |
4,681 |
705 |
5,386 |
|
Adjusted LBIT/EBIT |
(1,428) |
766 |
(662) |
|
Finance income |
|
|
1 |
|
Finance costs |
|
|
(142) |
|
Loss before taxation |
|
|
(803) |
Management does not report segmental assets and liabilities internally and as such an analysis is not reported.
The mix of revenue for the year ended 31 March 2025 is re-presented below.
|
|
EMEA |
America |
Group |
|
Facilitation |
71.6% |
63.2% |
68.6% |
|
Solutions advisory |
20.3% |
19.9% |
20.0% |
|
Licensing |
6.0% |
14.4% |
9.2% |
|
Premium add on |
2.1% |
2.5% |
2.2% |
Table below for comparative purposes only.
|
|
EMEA |
America |
Group |
|
Delivery |
69.7% |
61.0% |
66.3% |
|
Design |
16.3% |
16.5% |
16.4% |
|
Digital |
6.5% |
8.8% |
7.3% |
|
Licensing and certification |
3.7% |
12.0% |
6.9% |
|
Other |
2.7% |
1.2% |
2.2% |
|
Advisory |
1.1% |
0.5% |
0.9% |
The vast majority of the Group's contracts are for the delivery of services within the next 12 months. The Group has therefore taken advantage of the practical expedient in paragraph 121(a) of IFRS 15 not to disclose information about remaining performance obligations
4. Operating (loss)/profit
Operating (loss)/profit is stated after charging/(crediting):
|
|
31 March 2026 |
31 March 2025 |
|
|
£'000 |
£'000 |
|
External facilitator costs |
2,946 |
3,778 |
|
Staff costs (Note 7) |
19,924 |
25,919 |
|
Payroll restructuring costs included in adjusted items |
1,032 |
654 |
|
Other restructuring costs included in adjusted items |
151 |
328 |
|
Amortisation of intangible assets |
923 |
1,531 |
|
Impairment - Digital Asset |
2,981 |
4,404 |
|
Depreciation of property, plant and equipment |
543 |
987 |
|
Short-term and low-value lease expense |
1 |
7 |
|
Impairment/(Write-back) of trade receivables |
(5) |
(20) |
|
Other income - Research and Development |
- |
107 |
|
|
|
|
5. Adjusting items
|
|
31 March 2026 |
31 March 2025 |
|
|
£'000 |
£'000 |
|
Restructuring costs |
1,183 |
982 |
|
Impairment of intangibles |
2,981 |
4,404 |
|
|
4,164 |
5,386 |
Restructuring costs in the year ended 31 March 2026 include redundancy costs and associated legal costs related to the headcount reduction exercise undertaken to reduce the cost base.
Impairment of intangible assets are excluded from the adjusted results of the Group since the costs are one-off charges. These relate to digital assets not in use that are no longer being developed.
6. Auditor remuneration
|
|
31 March 2026 |
31 March 2025 |
|
|
£'000 |
£'000 |
|
Fees for audit of the Company and consolidated financial statements |
160 |
165 |
|
Fees for audit of the Company's subsidiaries pursuant to legislation |
29 |
27 |
|
Total audit fees |
189 |
192 |
|
Other services |
19 |
18 |
|
Total fees payable to the auditor |
208 |
210 |
7. Employees
Staff costs were as follows:
|
|
31 March 2026 |
31 March 2025 |
|
|
£'000 |
£'000 |
|
Wages and salaries |
17,141 |
22,779 |
|
Social security costs |
1,982 |
2,307 |
|
Pension costs - defined contribution plans |
663 |
851 |
|
Share-based payments |
138 |
(18) |
|
|
19,924 |
25,919 |
|
Restructuring payroll costs included in adjusted items |
1,032 |
654 |
|
|
20,956 |
26,573 |
The average number of the Group's employees by function was:
|
|
31 March 2026 |
31 March 2025 |
|
Delivery |
130 |
151 |
|
Support |
53 |
86 |
|
Digital |
5 |
10 |
|
|
188 |
247 |
The year-end number of the Group's employees by function was:
|
|
31 March 2026 |
31 March 2025 |
|
Delivery |
121 |
135 |
|
Support |
47 |
80 |
|
Digital |
4 |
8 |
|
|
172 |
223 |
Key management personnel include all directors and a number of senior managers across the Group who together have responsibility and authority for planning, directing and controlling the activities of the Group. The compensation paid to key management personnel for services provided to the Group was:
|
|
31 March 2026 |
31 March 2025 |
|
|
£'000 |
£'000 |
|
Salaries, bonuses and other short-term employee benefits |
2,191 |
2,319 |
|
Post-employment benefits |
72 |
72 |
|
Termination benefits |
- |
- |
|
Share-based payments |
29 |
(57) |
|
Total compensation |
2,292 |
2,334 |
8. Net finance costs
|
|
31 March 2026 |
31 March 2025 |
|
|
£'000 |
£'000 |
|
Finance income |
|
|
|
Bank interest receivable |
- |
1 |
|
|
- |
1 |
|
Finance costs |
|
|
|
Bank interest payable |
(77) |
(44) |
|
Other borrowing costs |
(40) |
(30) |
|
Lease interest |
(40) |
(68) |
|
|
(157) |
(142) |
|
|
(157) |
(141) |
9. Tax
The tax (credit)/charge for the year comprises:
|
|
31 March 2026 |
31 March 2025 |
|
|
£'000 |
£'000 |
|
UK current tax |
- |
27 |
|
UK adjustment in respect of prior periods |
- |
(61) |
|
Withholding tax |
(9) |
27 |
|
Foreign current tax |
1 |
24 |
|
Foreign adjustment in respect of prior periods |
5 |
6 |
|
Total current tax (credit)/charge |
(3) |
23 |
|
Deferred tax - current year |
18 |
2,035 |
|
Deferred tax - adjustment in respect of prior periods |
83 |
(131) |
|
Effect of changes in tax rates |
- |
73 |
|
Total deferred tax charge/(credit) |
101 |
1,977 |
|
Total tax charge |
98 |
2,000 |
Deferred tax totalling £5k in relation to share based payments has been recognised in Equity in the year ended 31 March 2026 (2025: £3k).
The tax charge for the year can be reconciled to accounting (loss)/profit as follows:
|
|
31 March 2026 |
31 March 2025 |
|
|
£'000 |
£'000 |
|
(Loss)/profit before tax |
(5,168) |
(6,189) |
|
Expected tax (credit)/charge based on the standard rate of tax in the UK of 25% (2025: 25%) |
(1,292) |
(1,547) |
|
Differences in overseas tax rates |
6 |
5 |
|
Expenses not deductible for tax purposes |
30 |
(11) |
|
Adjustments to tax in respect of prior periods |
88 |
(186) |
|
Tax rate changes |
- |
73 |
|
Tax losses for which no deferred income tax asset was recognised |
1,264 |
3,544 |
|
Other tax adjustments |
2 |
122 |
|
Total tax charge |
98 |
2,000 |
|
|
|
|
The main categories of deferred tax assets and liabilities recognised by the Group are:
|
|
Tax losses |
Intangible assets |
Other |
Total |
|
|
£'000 |
£'000 |
£'000 |
£'000 |
|
At 1 April 2024 |
3,550 |
(1,450) |
181 |
2,281 |
|
Credited to income |
(2,939) |
933 |
29 |
(1,977) |
|
Charged to equity |
- |
- |
3 |
3 |
|
Exchange differences |
(2) |
- |
(2) |
(4) |
|
At 31 March 2025 |
609 |
(517) |
211 |
303 |
|
Credited to income |
(473) |
457 |
(85) |
(101) |
|
Charged to equity |
- |
- |
5 |
5 |
|
Exchange differences |
(3) |
- |
(3) |
(6) |
|
At 31 March 2026 |
134 |
(60) |
128 |
201 |
The Group has recognised £0.2m of deferred tax assets relating to carried forward tax losses. In the UK, the deferred tax asset on carried forward losses of £0.1m has been recognised up to the value of the existing deferred tax liability of £0.1m.
Losses for which no deferred tax asset has been recognised amount to £5.1m (2025: £14.2), resulting in an unrecognised deferred tax asset of £1.3m. There is no time limit for utilising trade losses in the UK. The entity continues to perform an evaluation of its deferred tax asset valuation on an annual basis to estimate whether sufficient future taxable income will be generated to permit use of the existing deferred tax assets. The Board remains confident of full utilisation of tax losses in the future.
Other deferred tax assets include deferred tax on shared based payments in the UK and other temporary timing differences.
10. Earnings per share
Basic earnings per share (EPS) is calculated by dividing the earnings attributable to shareholders of the Company by the weighted average number of ordinary shares in issue during the year. The Company has potentially dilutive shares in respect of the share-based payment plans (see Note 22); however, as the Company is loss making in the current period, these have not been included in the calculation of earnings per share on the basis that a loss cannot be diluted.
|
|
31 March 2026 |
31 March 2025 |
|
Weighted average number of shares in issue |
100,374,782 |
100,273,688 |
|
Potentially dilutive shares (weighted average) |
9,121,647 |
6,965,965 |
|
Diluted number of shares (weighted average) |
109,496,429 |
107,239,653 |
|
|
|
|
|
|
31 March 2026 |
31 March 2025 |
||||
|
|
|
Basic EPS |
Diluted EPS |
|
Basic EPS |
Diluted EPS |
|
|
£'000 |
Pence |
Pence |
£'000 |
pence |
pence |
|
Net (loss)/profit attributable to shareholders |
(5,266) |
(5.24) |
(5.24) |
(8,189) |
(8.16) |
(8.16) |
|
Adjusted (loss)/profit attributable to shareholders |
(2,155) |
(2.15) |
(2.15) |
(4,171) |
(4.16) |
(4.16) |
11. Dividends
No dividends have been paid or proposed for the year ended 31 March 2026 (FY25: nil).
12. Intangible assets
|
|
Patents |
Development costs |
Total |
|
|
£'000 |
£'000 |
£'000 |
|
Cost |
|
|
|
|
At 1 April 2024 |
144 |
17,641 |
17,785 |
|
Additions |
28 |
1,430 |
1,458 |
|
Disposals |
- |
(185) |
(185) |
|
At 31 March 2025 |
172 |
18,886 |
19,058 |
|
Additions |
15 |
736 |
751 |
|
Disposals |
- |
- |
- |
|
At 31 March 2026 |
187 |
19,622 |
19,809 |
|
Amortisation |
|
|
|
|
At 1 April 2024 |
73 |
9,460 |
9,533 |
|
Amortisation charge |
10 |
1,521 |
1,531 |
|
Impairment |
- |
4,404 |
4,404 |
|
Disposals |
- |
(159) |
(159) |
|
At 31 March 2025 |
83 |
15,226 |
15,309 |
|
Amortisation charge |
11 |
912 |
923 |
|
Impairment |
- |
2,981 |
2,981 |
|
Disposals |
- |
- |
- |
|
At 31 March 2026 |
94 |
19,119 |
19,213 |
|
Net book value |
|
|
|
|
At 31 March 2025 |
89 |
3,660 |
3,749 |
|
At 31 March 2026 |
93 |
503 |
596 |
|
|
|
|
|
Development cost additions in the year to 31 March 2026 include software development costs directly incurred in the creation of new digital assets.
In March 2026, the Group decided to move the internally developed diagnostic tools to a new platform as a continuation of the strategy to leverage strategic digital partnerships. This decision led to a potential indicator of impairment and triggered an impairment review of the intangible digital assets. As a result of this review an impairment charge of £3.0million was recognised in the Consolidated Statement of Comprehensive Income.
13. Property, plant and equipment
|
|
Right-of-use asset |
Leasehold improvements |
Fixtures, fittings and equipment |
Total |
|
|
£'000 |
£'000 |
£'000 |
£'000 |
|
Cost |
|
|
|
|
|
At 1 April 2024 |
6,168 |
532 |
1,341 |
8,041 |
|
Additions |
136 |
- |
42 |
178 |
|
Disposals |
(3,045) |
(300) |
(716) |
(4,061) |
|
Exchange differences |
(45) |
(3) |
(13) |
(61) |
|
At 31 March 2025 |
3,214 |
229 |
654 |
4,097 |
|
Additions |
61 |
- |
36 |
97 |
|
Disposals |
(80) |
- |
- |
(80) |
|
Exchange differences |
(1) |
- |
(2) |
(3) |
|
At 31 March 2026 |
3,194 |
229 |
688 |
4,111 |
|
Depreciation |
|
|
|
|
|
At 1 April 2024 |
4,477 |
456 |
1,008 |
5,941 |
|
Depreciation charge |
730 |
69 |
188 |
987 |
|
Disposals |
(3,045) |
(294) |
(639) |
(3,978) |
|
Exchange differences |
(43) |
(2) |
(7) |
(52) |
|
At 31 March 2025 |
2,119 |
229 |
550 |
2,898 |
|
Depreciation charge |
469 |
- |
74 |
543 |
|
Disposals |
(80) |
- |
- |
(80) |
|
Exchange differences |
(2) |
- |
1 |
(1) |
|
At 31 March 2026 |
2,506 |
229 |
625 |
3,360 |
|
Net book value |
|
|
|
|
|
At 31 March 2025 |
1,095 |
- |
104 |
1,199 |
|
At 31 March 2026 |
688 |
- |
63 |
751 |
14. Inventories
|
|
31 March 2026 |
31 March 2025 |
|
|
£'000 |
£'000 |
|
Finished goods |
12 |
25 |
Write-down of inventory amounted to £8,000 (2025: £Nil).
The cost of inventories recognised as an expense and included in cost of sales amounted to £278,000 (FY25: £540,000).
15. Trade and other receivables
|
|
31 March 2026 |
31 March 2025 |
|
|
£'000 |
£'000 |
|
Current |
|
|
|
Trade receivables |
4,188 |
5,331 |
|
Less provision for impairment |
(84) |
(91) |
|
Net trade receivables |
4,104 |
5,240 |
|
Other receivables |
89 |
43 |
|
Prepayments in respect of property deposits |
11 |
11 |
|
Prepayments |
532 |
583 |
|
Accrued income |
1,358 |
592 |
|
|
6,094 |
6,469 |
Trade receivables have been aged with respect to the payment terms as follows:
|
|
31 March 2026 |
31 March 2025 |
|
|
£'000 |
£'000 |
|
Not past due |
3,883 |
5,045 |
|
Past due 0-30 days |
164 |
227 |
|
Past due 31-60 days |
90 |
46 |
|
Past due 61-90 days |
17 |
5 |
|
Past due more than 90 days |
34 |
8 |
|
|
4,188 |
5,331 |
The movement in the allowance for impairment losses was:
|
|
31 March 2026 |
31 March 2025 |
|
|
£'000 |
£'000 |
|
At the beginning of the period |
91 |
113 |
|
Addition/(Write-back) |
(5) |
(20) |
|
Utilisation of provision |
- |
- |
|
Foreign exchange adjustment |
(2) |
(2) |
|
At the end of the period |
84 |
91 |
The Group has applied the simplified approach to measuring expected credit losses, as permitted by IFRS 9, and recognises a loss allowance based on the lifetime expected credit loss.
16. Trade and other payables
|
|
31 March 2026 |
31 March 2025 |
|
|
£'000 |
£'000 |
|
Trade payables |
865 |
1,016 |
|
Other taxation and social security |
731 |
668 |
|
Other payables |
449 |
356 |
|
Accruals |
3,428 |
3,448 |
|
Deferred income |
2,829 |
2,159 |
|
|
8,302 |
7,647 |
17. Lease liability
The lease liabilities included in the statement of financial position are:
|
|
31 March 2026 |
31 March 2025 |
|
|
£'000 |
£'000 |
|
Current |
526 |
518 |
|
Non-current |
181 |
646 |
|
|
707 |
1,164 |
The related right-of-use asset is disclosed in Note 13.
The movements in the lease liability were as follows:
|
|
31 March 2026 |
31 March 2025 |
|
|
£'000 |
£'000 |
|
At the beginning of the year |
1,164 |
2,018 |
|
Additions |
92 |
138 |
|
Finance cost |
40 |
69 |
|
Lease payments |
(591) |
(1,047) |
|
Exchange differences |
2 |
(14) |
|
At the end of the year |
707 |
1,164 |
The maturity analysis of the contractual undiscounted cash flows is:
|
|
31 March 2026 |
31 March 2025 |
|
|
£'000 |
£'000 |
|
Less than one year |
546 |
558 |
|
Between one and five years |
184 |
669 |
|
Total future lease payments |
730 |
1,227 |
|
Total future interest payments |
(23) |
(63) |
|
Total lease liability |
707 |
1,164 |
18. Redeemable preference shares
The Company allotted and issued 50,000 redeemable preference shares of £1.00 each to Octavius Black in June 2018. The shares are fully paid up. Under the Articles of Association, the Company may redeem the preference shares at their nominal amount at any time specified by either the directors or the preference share holder. The preference share capital, however, counts towards the £50,000 minimum share capital required under the Companies Act 2006 and cannot therefore be redeemed unless the Company increases its other share capital. The preference shares are non-voting, give no rights to dividends or interest, and entitle the holder to the return of the nominal value on a winding up.
19. Borrowings
The Group entered a £10m debt facility (£6m RCF, £4m accordion) on 30 September 2021. This was replaced by a £4m overdraft facility in the period ending 31 March 2025. The Group's £4m overdraft facility expired in April 2026 and was renewed in April 2026 for a further 12 months to March 2027 with a reduced limit of £2m.
The facility has been utilised in the ordinary course of business. At period ending 31 March 2026, overdraft utilisation was £0.8m (FY25: nil).
The facility agreement includes a key performance indicator (KPI) stating that the amount drawn on the facility should not be greater than 120% of trade debtors. The Group has met this key KPI at all times when drawing down on the facility.
|
|
31 March 2026 |
31 March 2025 |
|
|
£'000 |
£'000 |
|
Cash at bank and in hand |
494 |
570 |
|
Overdraft Facility utilised |
(798) |
- |
|
Net (debt)/cash position |
(304) |
570 |
20. Financial instruments and financial risk management
Financial instruments by category
Trade and other receivables (excluding prepayments), cash and cash equivalents and trade and other payables are initially measured at fair value and subsequently held at amortised cost.
|
|
31 March 2026 |
31 March 2025 |
|
|
£'000 |
£'000 |
|
Net trade receivables |
4,104 |
5,240 |
|
Other receivables |
89 |
43 |
|
Cash and cash equivalents |
494 |
570 |
|
Financial assets at amortised cost |
4,687 |
5,853 |
|
Trade payables |
865 |
1,016 |
|
Other payables |
449 |
356 |
|
Accruals |
3,428* |
3,448* |
|
Lease liabilities |
707 |
1,164 |
|
Borrowings |
798 |
- |
|
Financial liabilities at amortised cost |
6,247 |
5,984 |
*Comparative number has been included on inclusion of accruals as financial instrument in current financial information. This is an adjustment to disclosure only and no impact on consolidated statement of comprehensive income and consolidated statement of financial position.
The Group holds no assets or liabilities that are held at fair value through income statement or OCI.
As the trade and other receivables and trade and other payables have a maturity of less than one year, the notional amount is deemed to reflect the fair value.
Capital risk management
The Group's objectives when managing capital are to safeguard the Group's ability to continue as a going concern, to provide returns for shareholders and benefits for other stakeholders and to maintain an optimal capital structure.
The Group's sources of funding currently comprise cash flows generated from operations, available cash resources and equity contributed by shareholders. In the period, the Group borrowed against the £4m overdraft facility during the ordinary course of business. The Group maintains sufficient capital to meet the day-to-day working capital requirements.
To maintain or adjust the capital structure, the Group may adjust the number of dividends paid to shareholders, return capital to shareholders to the extent allowed by the Company's articles or issue new shares.
Financial risk management
The Group's risk management is overseen by the Audit and Risk Committee. The Group is exposed to a variety of financial risks that result from its operations, including credit risk, liquidity risk and foreign currency risk. Since the Group has no long-term debt it is not significantly exposed to interest rate risk. The Group has not entered into any derivative transactions, such as interest rate swaps or forward foreign exchange contracts.
There have been no substantive changes in the Group's exposure to financial instrument risks, its objectives, policies and processes for managing those risks, or the methods used to measure them from previous periods unless otherwise stated in this note.
Credit risk
Credit risk arises principally from the Group's trade receivables from customers and monies on deposit with financial institutions.
Credit risk on trade receivables is considered to be relatively low as the Group's customers mainly consist of large credit-worthy organisations. Credit exposure is spread over a large number of customers and so there is no significant concentration of credit risk. Outstanding and overdue balances are regularly reviewed and resulting actions are put in place on a timely basis. The Group establishes an allowance for impairment. This is based on a review of individual balances taking into account the results of credit control communications and our knowledge about the customer relationship. See Note 15, Trade and other receivables, for further information on ageing and impairment of trade receivables.
Credit risk also arises from cash and cash equivalents and deposits with banks and financial institutions. For banks and financial institutions, only independently rated parties are accepted, and management maintain a close relationship with the Group's banks.
The carrying amount of financial assets represents the maximum credit exposure. The maximum exposure to credit risk at the reporting date was:
|
|
31 March 2026 |
31 March 2025 |
|
|
£'000 |
£'000 |
|
Trade receivables |
4,104 |
5,240 |
|
Other receivables |
89 |
43 |
|
Cash and cash equivalents |
494 |
570 |
|
At the end of the period |
4,687 |
5,853 |
Liquidity risk
The Group ensures, as far as possible, that it has sufficient funds to meet foreseeable operational expenses. Cash flow forecasting is performed by Group Finance who monitor rolling forecasts of the Group's liquidity requirements. Such forecasting takes into consideration expected cash receipts, regular spending and payment of taxes such as VAT, payroll and corporate income tax.
Currently, the Group's liquidity risk has increased given the use of overdraft facilities in the year and the reduction in the available facility from £4m to £2m following its renewal. The Board has considered the adequacy of this facility as part of the review of going concern in Note 2. The details of the available facility are set out in Note 19. All Group liabilities in the current and prior year are due within three months of the reporting date, apart from lease liabilities. The maturity of the lease liability is set out in Note 17.
Foreign currency risk
The Group operates internationally and is exposed to foreign currency risk on sales and purchases that are denominated in a currency other than Sterling. The currencies giving rise to this risk are primarily the US Dollar and the Euro. Where possible the exposure is mitigated by a natural hedge. For example, US Dollar revenues are partially matched by US Dollar costs in the US subsidiary.
The Group holds cash in the UK in Sterling, Euro and US Dollar bank accounts and in the USA in US Dollar and Canadian Dollar bank accounts.
Trade receivables and cash and cash equivalents are analysed by currency as follows:
|
|
GBP |
USD |
EUR |
Other |
Total |
|
|
£'000 |
£'000 |
£'000 |
£'000 |
£'000 |
|
At 31 March 2026 |
|
|
|
|
|
|
Net trade receivables |
2,919 |
950 |
170 |
65 |
4,104 |
|
Cash and cash equivalents |
63 |
318 |
24 |
90 |
494 |
|
|
|
|
|
|
|
|
At 31 March 2025 |
|
|
|
|
|
|
Net trade receivables |
3,222 |
1,563 |
381 |
74 |
5,240 |
|
Cash and cash equivalents |
35 |
413 |
72 |
50 |
570 |
The Group does not currently use forward foreign exchange contracts or currency options to hedge currency risk.
21. Share capital
|
|
31 March 2026 |
31 March 2026 |
31 March 2025 |
31 March 2025 |
|
|
|
Cost |
|
Cost |
|
|
Number |
£'000 |
Number |
£'000 |
|
Ordinary shares of £0.00001 at 1 April |
100,338,882 |
1 |
100,198,464 |
1 |
|
Issue of shares to satisfy options |
70,654 |
- |
140,418 |
- |
|
Ordinary shares of £0.00001 at 31 March |
100,409,536 |
1 |
100,338,882 |
1 |
An Employee Benefit Trust ('EBT') has been established in connection with the Group's Share Incentive Plan. The movements in own shares held by the Employee Benefit Trust and the market value of the shares held at the year-end are shown below.
|
|
31 March 2026 |
31 March 2026 |
31 March 2025 |
31 March 2025 |
|
|
|
Cost |
|
Cost |
|
|
Number |
£'000 |
Number |
£'000 |
|
As at 1 April |
47,265 |
- |
90,351 |
- |
|
Issue of new shares to EBT |
- |
- |
- |
- |
|
Removed from the Trust |
(1,370) |
- |
(43,086) |
- |
|
Ordinary shares of £0.00001 at 31 March |
45,895 |
- |
47,265 |
- |
|
Market value at 31 March |
|
6 |
|
10 |
22. Share-based payments
The Group awards options to selected employees under a Long-Term Incentive Share Option Plan ('LTIP'). The options granted to date vest subject only to remaining employed up to the vesting date. Unexercised options do not entitle the holder to dividends or to voting rights.
The Group operates the Mind Gym plc Share Incentive Plan (SIP). An initial award of £1,000 of free shares was granted in October 2018 to all employees at the IPO price of 146 pence. The shares are held in an employee benefit trust and vested after three years subject only to remaining employed up to the vesting date. The holder was entitled to dividends over the vesting period. Many employees elected to leave their shares in the trust for a further two years for tax purposes. A number of shares continue to be held in trust after this date on behalf of employees.
On 30 September 2019, the Group launched a Save As You Earn scheme ('SAYE') and an Employee Share Purchase Plan ('ESPP') for all eligible employees in the UK and US respectively. New schemes have been launched annually since 2019.
The total share-based payments expense was:
|
|
31 March 2026 |
31 March 2025 |
|
|
£'000 |
£'000 |
|
Equity settled share-based payments |
138 |
(18) |
The movements in the number of share awards and share options and the weighted average exercise price of awards are:
|
|
|
31 March 2026 |
|
31 March 2025 |
|
|
Number |
Weighted average exercise price £ |
Number |
Weighted average exercise price £ |
|
|
|
|
|
|
|
Outstanding at the beginning of the period |
6,856,866 |
0.17 |
6,169,557 |
0.17 |
|
Granted during the period |
6,323,051 |
0.02 |
6,545,056 |
0.05 |
|
Forfeited during the period |
(2,392,342) |
0.40 |
(5,717,329) |
0.04 |
|
Exercised during the period |
(70,654) |
0.01 |
(140,418) |
0.34 |
|
Outstanding at the end of the period |
10,716,921 |
0.03 |
6,856,866 |
0.17 |
|
Exercisable at the end of the period |
172,706 |
|
- |
|
|
Weighted average fair value of awards granted (£) |
0.16 |
|
0.21 |
|
The range of exercise prices and weighted average remaining contractual life of share awards and share options outstanding at 31 March was:
|
|
31 March 2026 |
31 March 2025 |
|
|
£'000 |
£'000 |
|
£ nil |
172,706 |
690,413 |
|
£0.00001 |
9,173,780 |
4,387,984 |
|
£0.14450 |
779,707 |
- |
|
£0.14880 |
2,971 |
- |
|
£0.25500 |
- |
44,246 |
|
£0.26070 |
415,537 |
942,786 |
|
£0.52130 |
172,220 |
294,627 |
|
£1.46000 |
- |
496,810 |
|
|
10,716,921 |
6,856,866 |
|
Weighted average remaining contractual life (years) |
1.8 |
1.9 |
Simple share options awarded under the LTIP, SAYE and ESPP are valued using the Black-Scholes model. Complex share options awarded under the LTIP are valued using the Monte Carlo model. Shares awarded under the SIP are valued directly by reference to the share price at date of grant. The principal assumptions used in these valuations were:
|
|
Date of grant |
Share price at grant |
Exercise price |
Expected life |
Expected volatility |
Dividend yield |
Risk-free rate |
Fair value |
|||||||||||||||||||||
|
|
|
£ |
£ |
years |
% |
% |
% |
£ |
|
||||||||||||||||||||
|
LTIP (4-year vesting) |
14 Jul 21* |
1.90 |
Nil |
4 |
36% |
0% |
0.23% |
1.70 |
|
||||||||||||||||||||
|
LTIP (5-year vesting) |
14 Jul 21* |
1.90 |
Nil |
5 |
36% |
0% |
0.31% |
1.90 |
|
||||||||||||||||||||
|
LTIP (5-year vesting) |
14 Jul 21* |
1.90 |
Nil |
5 |
36% |
0% |
0.31% |
1.73 |
|
||||||||||||||||||||
|
LTIP (4-year vesting) |
3 Dec 21 |
1.675 |
Nil |
4 |
36% |
0% |
0.23% |
1.675 |
|
||||||||||||||||||||
|
LTIP (5-year vesting) |
3 Dec 21 |
1.675 |
Nil |
5 |
36% |
0% |
0.31% |
1.675 |
|
||||||||||||||||||||
|
LTIP (4-year vesting) |
21 July 22 |
1.20 |
Nil |
4 |
36% |
0% |
0.23% |
1.20 |
|
||||||||||||||||||||
|
LTIP (5-year vesting) |
21 July 22 |
1.20 |
Nil |
5 |
36% |
0% |
0.31% |
1.20 |
|
||||||||||||||||||||
|
LTIP (3-year vesting) |
26 July 23 |
0.54 |
Nil |
3 |
36% |
0% |
0.15% |
0.54 |
|
||||||||||||||||||||
|
SAYE |
1 Oct 23 |
0.57 |
0.48 |
3 |
36% |
0% |
0.31% |
0.13 |
|
||||||||||||||||||||
|
LTIP |
28 Aug 24 |
0.24 |
Nil |
3 |
36% |
0% |
0.15% |
0.24 |
|
||||||||||||||||||||
|
SAYE |
1 Aug 24 |
0.30 |
0.2607 |
3 |
36% |
0% |
0.31% |
0.09 |
|
||||||||||||||||||||
|
LTIP |
31 Jul 25 |
0.175 |
Nil |
3 |
36% |
0% |
0.15% |
0.175 |
|
||||||||||||||||||||
|
ESPP |
1 Aug 25 |
0.175 |
0.1488 |
1 |
34% |
0% |
0.15% |
0.04 |
|
||||||||||||||||||||
|
SAYE |
1 Aug 25 |
0.175 |
0.1445 |
3 |
36% |
0% |
0.31% |
0.05 |
|
||||||||||||||||||||
* includes further options granted on 3 Dec 2021 on the same terms and with the same valuation assumptions.
23. Controlling party
The Group was controlled by O. Black and J. Cash by virtue of their joint shareholding in the Company throughout the period.
There were the following related party transactions during the year and balances at the end of the year:
· Key management compensation as disclosed in Note 7.
24. Events after the reporting period
Subsequent to the reporting date, the Group renewed its overdraft facility at £2m until 31 March 2027. The previous facility provided borrowing capacity up to £4m. The directors have considered the impact of the reduction in borrowing capacity in the going concern assessment and is confident the facility remains sufficient.
RNS may use your IP address to confirm compliance with the terms and conditions, to analyse how you engage with the information contained in this communication, and to share such analysis on an anonymised basis with others as part of our commercial services. For further information about how RNS and the London Stock Exchange use the personal data you provide us, please see our Privacy Policy.


Latest directors dealings
- 14 minutes ago Safestore Holdings
- 29 minutes ago Land Securities Group
- 43 minutes ago Prospex Energy
- 1 hour ago Character Group
- 1 hour ago accesso Technology Group