
Melrose Half-year Financial Results
Summary by AI BETAClose X

31 July 2026
MELROSE INDUSTRIES PLC
UNAUDITED RESULTS
FOR THE SIX MONTHS ENDED 30 JUNE 2026
Continued momentum in the first half
Melrose Industries PLC ("Melrose", the "Company" or the "Group"), a world-leading global aerospace and defence business, today announces its interim results for the six months ended 30 June 2026 (the "Period").
Group highlights1
|
● |
Good first half performance with growth in revenue of 10%, adjusted operating profit2 up 16% and adjusted operating margin2 up 50bps at 18.5% (2025: 18.0%) |
|
● |
Strong revenue growth of 19% in Engines driven by both OE and aftermarket, with Airframes revenue up 4% driven by Defence |
|
● |
Free cash inflow2 of £13 million, an improvement of £67 million; factoring balance £9 million lower at £387 million (31 December 2025: £396 million) |
|
● |
Group leverage2 at 1.8x, in line with the position at 31 December 2025 |
|
● |
Our lean operating model, Brilliant Basics, is driving improvements in inventory management and manufacturing productivity |
|
● |
Garden Grove facility in the US back to partial production following chemical tank incident at the end of May; working closely with relevant authorities and customers to safely resume full production |
|
● |
Current £175 million share buyback programme paused pending clarification of financial impact of the Garden Grove incident, including from ongoing regulatory and legal processes |
|
● |
Increase in interim dividend per share to 2.7 pence (2025: 2.4 pence), growth of 13% |
|
● |
Excluding the impact of Garden Grove, our guidance for the full year remains unchanged |
|
|
Adjusted2 results |
Growth1 |
Statutory results |
||
|
|
2026 |
2025 |
|
2026 |
2025 |
|
|
£m |
£m |
|
£m |
£m |
|
Revenue |
1,873 |
1,720 |
10% |
1,873 |
1,720 |
|
Operating profit |
347 |
310 |
16% |
154 |
441 |
|
Operating margin % |
18.5% |
18.0% |
50bps |
|
|
|
Profit before tax |
282 |
248 |
18% |
89 |
379 |
|
Diluted earnings per share (p) |
17.7p |
15.1p |
22% |
6.0p |
22.2p |
|
Dividend per share (p) |
2.7p |
2.4p |
13% |
2.7p |
2.4p |
|
Free cash flow2 |
13 |
(54) |
+£67m |
n/a |
n/a |
|
Net debt2 |
1,530 |
1,407 |
|
n/a |
n/a |
|
Leverage2 |
1.8x |
1.8x |
|
n/a |
n/a |
Net debt and leverage comparative information as at 31 December 2025.
Peter Dilnot, Chief Executive Officer of Melrose Industries PLC, today said:
"We delivered a good performance in the first half, building on the momentum from last year, with operating profit up 16% and a strong improvement in free cash flow. This was underpinned by good commercial and technology progress, combined with operational improvements through our Brilliant Basics lean operating model.
We are managing the situation at our Garden Grove transparencies site following the incident in May. Partial production has since resumed, and we will continue to work closely with customers, regulators and other authorities to safely restore the site to full production in the second half.
Our clear growth strategy is underpinned by attractive end markets, differentiated technology and established positions on the world's leading civil and defence aircraft. We have positive momentum and are confident about delivering sustained increases in profit and cash flow in the years ahead."
Financial highlights1
|
● |
Revenue of £1,873 million, 10% growth on the prior year |
|
● |
Adjusted operating profit2 up 16% to £347 million (2025: £310 million) with adjusted operating margin2 up 50bps to 18.5% |
|
● |
Statutory operating profit of £154 million (2025: £441 million) impacted by unrealised losses on foreign exchange derivative contracts |
|
● |
Incident at Garden Grove facility in May reduced revenue by £16 million and adjusted operating profit2 by £9 million |
|
● |
Free cash flow2 improved by £67 million with an inflow of £13 million (2025: outflow of £54 million); factoring balance £9 million lower than at the end of December 2025 |
|
● |
Adjusted diluted EPS2 of 17.7p compared to 15.1p in 2025 representing growth of 22%. Statutory diluted EPS of 6.0p (2025: 22.2p) |
|
● |
Net debt2 of £1,530 million, representing leverage2 of 1.8x |
|
● |
Interim dividend of 2.7 pence per share, an increase of 13% on prior year |
Divisional highlights1
Engines
|
● |
Revenue up 19% to £896 million with adjusted operating profit2 up 21% to £303 million, with strong growth in OE and aftermarket of 23% and 15% respectively |
|
● |
Adjusted operating margin2 up 40bps at 33.8% |
|
● |
Continued strong OEM order intake for new aircraft supporting our multi-year order backlog for engine components |
|
● |
Adjusted operating profit2 included £206 million (2025: £182 million) of variable consideration from RRSP contracts |
|
● |
Multi-year contracts signed for fan blade repairs with Rolls-Royce and Pratt & Whitney |
|
● |
Ongoing investment in capacity and capability at our Trollhättan site in Sweden to support the ramp in new engines |
|
● |
Expansion of North Charlestown facility to strengthen engine component manufacturing capabilities |
|
● |
Encouraging progress on additive fabrication with a number of development agreements including: Pratt & Whitney to explore the manufacture of F135 components; an order for GE Industrial Gas Turbine technology insertion; and Pratt & Whitney to perform engine component repairs |
Airframes
|
Garden Grove
|
● |
Financial impact in the first half was to reduce revenue and adjusted operating profit2 by £16 million and £9 million respectively |
|
● |
Excluding this impact, Group revenue and adjusted operating profit2 grew by 11% and 19%, with margins 80 bps higher |
|
● |
In addition, £13 million of exceptional costs were incurred in the first half relating to the initial incident response, recovery and associated advisory costs |
|
● |
The incident resulted in free cash flow2 being £7 million higher than expected, with exceptional cash costs more than offset by the unwind of working capital at the site |
|
● |
We are working closely with our customers and the relevant authorities to confirm the timing of resumption of full production, with the site expected to produce at around 50% of its normal capacity until then, reducing monthly revenue, operating profit and cash by c.£6 million |
|
● |
As well as the financial impact from operating at reduced capacity, we currently anticipate incurring additional exceptional costs of between £25 million and £30 million in the second half |
|
● |
The Group is cooperating with regulators and lawyers across a number of enquiries, investigations and legal cases. These cases are complex and at this point the outcomes are uncertain. The Group is also assessing a potential compensation programme to reimburse local residents and businesses. Our associated insurance position is under review |
|
● |
Consequently, we have taken the decision to pause the current £175 million share buyback programme pending clarification of the impact |
|
● |
A further update will be provided on the total expected financial impacts for the full year, and potentially beyond, in due course |
Guidance for 2026 full year
Excluding the impact of the Garden Grove incident, our guidance for the full year, which assumes an average exchange rate of 1 GBP = US$1.37, is unchanged:
|
● |
Revenue between £3,750 million and £3,950 million |
|
● |
Adjusted operating profit2 of between £700 million and £750 million, reflecting an adjusted operating margin2 of c.19% at the mid-point |
|
● |
Variable consideration of between £340 million and £380 million |
|
● |
Free cash flow2 after interest and tax of £150 million to £200 million |
|
● |
Factoring utilisation expected to increase in line with Group revenue growth, generating a net cash inflow of between £30 million and £50 million which is included within the free cash flow2 guidance for the year |
Enquiries:
Investor Relations:
Mat Wootton: +44 (0) 7483 961 233, mat.wootton@melroseplc.net
Media:
Simon Sporborg, Tom Pigott
Brunswick: +44 (0) 207 404 5959, melrose@brunswickgroup.com
Audience Webcast link
https://connectstudio-portal.world-television.com/en/6a3a3ddbbb3ff965938ba972
Conference Call Details - 9.30am, Friday 31 July
United Kingdom (Local): +44 20 3936 2999
United Kingdom (Toll-Free): +44 808 189 0158
Global Dial-In Numbers
Access Code: 874550
Melrose Industries PLC
Melrose is an industry-leading global aerospace and defence technology business, listed in the UK, with more than 30 manufacturing sites across 12 countries. We are a 'Super-Tier 1' partner to all airframe and engine OEMs, with design-led solutions on-board 100,000 flights a day, across all of today's high-volume aircraft. We operate through two market-leading divisions, Engines and Airframes, across both original equipment and the aftermarket, covering the civil and defence markets. Every day we deliver flight-critical components including full engine systems and structures; major airframe components such as wings and empennages; and full aircraft electrical wiring systems. We have an excellent track record of delivering value for both customers and shareholders and have set out an exciting growth plan ahead.
Notes
1. Growth is calculated at constant currency against 2025 results
2. Described in the glossary to the 2026 Interim Financial Statements and considered by the Board to be a key measure of performance
CHIEF EXECUTIVE OFFICER'S REVIEW
INTRODUCTION
In the first half, we continued to execute our strategy resulting in further profitable growth and increased cash generation. We operate in attractive civil and defence end markets underpinned by record order backlogs for new commercial aircraft and increases in defence spending. Having repositioned Melrose as a design-led, Super-Tier 1 business with embedded technology in the world's leading aircraft, we are well placed to benefit from this structural demand.
Adjusted operating profit grew by 16% driven by 10% top line growth and another strong performance in our Engines business. We also delivered a significant improvement in free cash flow, £67 million higher than the comparative period, generating positive first half free cash flow of £13 million. These results were delivered against the backdrop of ongoing challenges within the supply chain constraining OEM build rates. We remain focused on supporting rate increases and strengthening supply chain resilience.
Our teams secured new business, further developed our differentiated technology and drove operational improvements through Brilliant Basics, our lean operating model. The strength and resilience of our people has also played a critical role in managing the incident at our Garden Grove facility with focus, operational rigour and our safety-first culture.
Looking ahead, the most significant contributor to future value is profitably capturing industry growth through our established positions in OE production and the aftermarket. We also continue to make good progress in attractive target opportunities including our proprietary additive fabrication technology and the development of uncrewed defence air vehicles. In addition, we are well positioned for the longer term with partnerships working on the next generation of single aisle engines and airframes, sixth generation fighters and electric flight.
FIRST HALF 2026 RESULTS
Group revenue rose 10% in the first half to £1,873 million. This was driven by strong Engines growth of 19%, from across all areas of its business. Airframes revenue was 4% higher, reflecting strong Defence growth partially offset by Civil. The impact of foreign currency translation, including a weakening of the US Dollar against Sterling, reduced revenue and adjusted operating profit by £28 million and £11 million respectively versus the comparative period. There was a 16% increase in adjusted operating profit to £347 million, with margins 50bps higher at 18.5%. Positive free cash flow of £13 million represented an increase of £67 million. Our net debt position was in line with our expectations at £1,530 million, representing a leverage ratio of 1.8x which is in line with the position at 31 December 2025.
We made further operational gains across the Group. On safety our Total Incident Rate ('TIR') for the 12-month period ended 30 June 2026, was 25% lower than the prior corresponding period. We also made progress on inventory which remains a key focus area with Days Inventory Outstanding ('DIO') reducing by 5% compared to June 2025. These gains reflect the traction we are seeing with our lean operating model, Brilliant Basics, and a strong culture of continuous improvement across the Group.
GARDEN GROVE
At the end of May, we had a thermal incident involving one of three chemical tanks at our GKN Aerospace Garden Grove facility in the US, which resulted in the temporary closure of the site and evacuation of the local area.
Garden Grove is one of two main GKN transparency facilities. The site is responsible for a significant proportion of the global supply of aerospace-grade acrylic used to manufacture transparencies for major defence and civil platforms, including the F-35 and passenger cabin windows on commercial aircraft. Revenue generated by the site was £136 million in 2025.
The processing of acrylic into finished product, which employs c.95% of employees at the site, has resumed. Work continues with customers and relevant regulatory authorities to safely resume full production at the site. Until then, the site is expected to produce at around 50% of its normal monthly run rate, resulting in a £6 million reduction in revenue, operating profit and cash flow per month. In addition to the financial impact from processing lower volumes, we expect to incur additional exceptional costs of c.£25 million to £30 million in the second half.
We will provide an update on the total expected impact for the full year and potentially beyond in due course, including from ongoing regulatory and legal processes. The Group is also assessing a potential compensation programme to reimburse local residents and businesses. Our associated insurance position is under review.
WELL-POSITIONED IN ATTRACTIVE GROWTH MARKETS
Melrose's revenue streams are broad-based, generating income from: Engines and Airframes; original equipment and aftermarket; and across both civil aerospace and defence markets.
Within Civil, we have content on large, regional and business jets and hold embedded positions on all leading commercial narrowbody and widebody aircraft, with a stronger weighting towards Airbus versus Boeing. In Engines, we lead the industry in the fabrication of advanced engine structures, cases and frames. We are RRSP partners on 19 different engine families, six of which will generate 90% of the value of the RRSP portfolio. In Airframes, we have strong embedded positions with over 70% of our content provided on a sole-sourced basis. Within defence, we have positions on all the major global platforms, both fixed wing and rotorcraft, including the F-35, Gripen, C-130 and Eurofighter. In the first half of 2026, civil aerospace and defence represented 71% and 29% of Group revenue respectively.
Civil
Demand for civil aircraft remained strong, with Airbus and Boeing reporting gross order intake of 886 and 445 respectively in the first half. This represents an 80% increase for Airbus versus the first half of 2025. Backlogs across narrowbody and widebody are now up to 9 years. Given our embedded content on the leading narrowbody and widebody platforms, these backlogs will read through to our Airframes and Engines businesses. The dynamic of constrained build rates and record order backlogs continues to drive fleet utilisation, resulting in a growing Engines aftermarket through engine shop visits for mature engines.
The outbreak of a broader conflict between the US and Iran was a notable development for the civil aerospace market. The conflict caused disruption to flight activity, particularly in the Middle East, and a material increase in the price of jet fuel as well as constraining its availability. Global flight hours in the second quarter were 3% lower than the equivalent period and in June 2026, IATA reduced their Revenue Passenger Kilometres growth forecast for 2026 from 4.9% to 2.1%. Jet fuel prices recovered following the ceasefire, but uncertainty remains.
The impact of the conflict on Melrose and the sector has been limited to date, reflecting the favourable end market dynamics including the tight supply of new aircraft and constrained engine maintenance capacity. Any medium-term impact will depend on the duration and scope of the conflict.
Defence
The defence market continues to be shaped by geopolitics, in particular the conflicts in Ukraine and the Middle East, and the need for Europe to bolster sovereign capability. The associated opportunities for Melrose provide a potential source of upside to our medium-term financial targets and we are well placed in our core markets.
As an established UK defence manufacturer, we welcomed the UK Defence Investment Plan published in June. Our UK capability not only supports the production of existing platforms such as the Typhoon, but also future platforms such as GCAP. We are also investing to build uncrewed vehicles, with over £20 million already committed to increase advanced composites manufacturing at our facility in Cowes on the Isle of Wight.
In the US, we are well placed to benefit from rising defence budgets and demand for our capabilities across both Airframes and Engines including: F-35 sustainment and readiness where we have substantial content; missiles and air defence systems which use our casings and canisters; and sixth generation combat aircraft and uncrewed/autonomous systems.
We also have established positions across other NATO countries including Sweden, the Netherlands, Germany and Norway where spending is increasing and uncrewed defence aerial vehicle developments are moving at pace.
EXECUTING OUR GROWTH STRATEGY
Melrose is a 'Super-Tier 1' partner with design-led solutions deeply embedded in our customers' aircraft and engines, often for the life of the programme.
Our growth strategy is based on three elements. First is profitably capturing the growth from our established positions across civil and defence platforms, as production ramps up and the aftermarket reads through. The second is expansion in attractive target opportunities such as commercialising our breakthrough proprietary additive fabrication technology and developing uncrewed defence air vehicles. And third, we continue to invest and position for the longer-term with partnerships working on the next generation of aircraft and engines. Good progress was made in all three areas during the first half.
Engines
In Engines, revenue generated from our diversified RRSP portfolio grew strongly, particularly on the OE side. This reflects increased deliveries of our components on the newer engines where our RRSP shares are higher, notably: GTF, GEnx and XWB. As well as securing decades of future aftermarket returns and cash through these newer engines, we continue to generate healthy returns and cash flow from our other RRSPs including the CFM56 and V2500.
In our Engines parts repair business we also saw significant growth in the first half. We secured a number of multi-year contracts including with Rolls-Royce and a follow-on contract to support the repair of fan blades on a dual-use engine, building further share of this high growth market. We also secured multi-year agreements with Pratt & Whitney covering repair solutions for GTF engine components.
We continued to advance our breakthrough proprietary additive fabrication technology, with a number of development orders signed and multiple requests from customers. This builds on our long-term partnerships with both Pratt & Whitney and GE Aerospace. We signed a development contract with Pratt & Whitney to explore the use of our additive technology to manufacture components on the F135 engine. We are also leveraging our knowledge and position in space and Industrial Gas Turbines to accelerate additive fabrication adoption.
Airframes
In Civil (63% of Airframes revenue), we continued to support our OEM customers as they look to increase production and delivery rates of new aircraft, where the backlog remains high. Linked to this, we continued our investment programme in the UK enhancing our machining and inspection capabilities to deliver increased build rates and productivity improvements in Filton.
Our JV in China achieved important milestones including the first deliveries of new components on the C909 regional jet, part of the COMAC family alongside the C919 narrowbody and the C929 widebody. We also started shipping glass windows from our China facility for the Asian aftermarket.
In Defence (37% of Airframes revenue), we have made good progress developing a clean sheet uncrewed aerial vehicle demonstrator for the FMV, combining our leading structures and propulsion technologies from Sweden, the Netherlands and the UK. In May, we announced that we will play a central role in Anduril's team following the UK Ministry of Defence's decision to shortlist the company for the next phase of Project NYX for the British Army. The strength of our technology is positioning us favourably on next generation programmes, including uncrewed and 6th generation fighters particularly in Europe.
Operational excellence
Our lean operating model, Brilliant Basics, is central to how we are driving operational performance and delivering profitable growth. It is based on continuous improvement principles with three core elements: daily management systems; problem solving techniques and the delivery of breakthrough projects. Brilliant Basics is gaining traction throughout GKN Aerospace and is having tangible impacts in areas such as: supplier management and supply chain resilience; productivity and yields; and inventory and working capital management.
We are also deploying Brilliant Basics in conjunction with our customers and suppliers. An excellent example of this is the work we have done with GE at our composite site in Tallassee where we make GEnx fan cases. Here, we ran a joint kaizen week with three events delivering improved visual work instructions and 3D inspection technology leading to a 90% improvement in inspection time and a roadmap for increased autoclave capacity. This event will support increasing production from 5 to 10 fan cases per week.
As well as driving tangible financial benefits, Brilliant Basics is also fostering greater collaboration and teamwork across the Group as learnings are shared across our global sites.
CAPITAL ALLOCATION
We have a clear capital allocation framework. Our first priority is to invest in the business to drive organic growth through the civil and defence ramp and targeted expansion opportunities. In Engines, the primary focus is investing in rate capability for OE products, repair growth and our unique additive fabrication technology. In Airframes, we are investing in automation and capacity to support higher production rates, with much of our new opportunity funding coming from customers, particularly in defence.
Our second priority is our commitment to maintaining a sustained increase in the ordinary dividend and finally, we will look to return excess capital to shareholders through share buybacks. Alongside these priorities, we will maintain a strong balance sheet with a target leverage ratio of between 1.5x to 2.0x, with investment grade metrics being targeted over time.
The Board has declared an interim dividend for 2026 of 2.7 pence per share, up 13%, which will be paid on 25 September 2026 to shareholders on the register at the close of business on 14 August 2026. We have taken the decision to pause the current £175 million share buyback programme pending clarification of the impact of the Garden Grove incident, including from regulatory and legal processes. By the end of June 2026, we had completed a total of £70 million of share buybacks in 2026 including £12 million of the current programme.
GUIDANCE
Guidance for full year 2026
Excluding the impact of the Garden Grove incident, our guidance for the full year, which assumes an average exchange rate of 1 GBP = US$1.37, is unchanged.
|
|
Excluding Garden Grove impact |
|
|
(million) |
|
Revenue: |
|
|
Engines |
£1,700 - £1,800 |
|
Airframes |
£2,050 - £2,150
|
|
Group |
£3,750 - £3,950 |
|
|
|
|
Adjusted operating profit: |
|
|
Engines |
£565 - £595 |
|
Airframes |
£170 - £190 |
|
PLC costs |
(c.£35)
|
|
Group |
£700 - £750 |
|
|
|
|
Free cash flow |
£150 - £200 |
|
|
|
Factoring utilisation is expected to increase in line with Group revenue growth, generating a net cash inflow of between £30 million and £50 million which is included within the free cash flow guidance for the year.
Garden Grove is expected to produce at around 50% of its normal capacity until full production is resumed, reducing monthly revenue, operating profit and cash by c.£6 million. In addition, we currently anticipate incurring additional exceptional costs of between £25 million and £30 million in the second half.
Medium-term guidance
We have set out medium-term targets to deliver significant growth in revenue, profit and cash flow underpinned by our clear growth strategy; this includes the delivery of £600 million of free cash flow (after interest and tax) in 2029, driven by:
|
● |
Growth in operating profit reflecting the production ramp up, growing aftermarket and operational improvements |
|
● |
Increase in cash generation from our extensive Engine RRSP portfolio |
|
● |
GTF programmes turning cash positive in 2028 |
The Group's factoring balance (£396 million as at 31 December 2025) is expected to grow in line with the annual growth rate in Group revenue, before any translational foreign exchange impacts.
DIVISIONAL REVIEW
ENGINES
|
Adjusted results |
H1 2026 £m |
H1 2025 £m |
Growth |
|
Revenue |
896 |
781 |
19% |
|
Operating profit |
303 |
261 |
21% |
|
Operating profit margin |
33.8% |
33.4% |
40bps |
Our industry-leading Engines division is a trusted partner to all global engine manufacturers, with differentiated products helping power around 90% of the world's major aircraft. It has significant diversification, within civil, defence and adjacent (space and Industrial Gas Turbines) markets as well as across both original equipment (OE) and aftermarket. Its technology leadership, especially in additive fabrication, has earned it a unique position on key next-generation engine development programmes. Engines revenue is well balanced across four core business models: risk and revenue sharing partnerships ("RRSPs"); long-term commercial agreements; engine repairs; and governmental partnerships.
Engines made strong progress in the first half with growth across all four business areas. This was against the backdrop of ongoing supply chain challenges, with a continuation of the constraints within forgings and castings, as well as shortages of rare earth metal powders which are predominantly used in our engine repair business.
As a full lifecycle partner to the engine OEMs, we are at the heart of delivering the increased rate required to meet the demand for new aircraft where backlogs remain at record levels. An example of how this demand feeds through to Engines is AirAsia's record order in May for 150 Airbus A220s, which is powered by the Pratt & Whitney PW1500G engine where we have a 4-7% RRSP share.
In the first half, we saw significant OE volume increases for new engines where we have significant RRSP shares, reflecting the demand from our OEM partners as they ramp production. This included the Pratt & Whitney GTF engines which power the A320neo, A220 and E2, and the GE GEnx which powers the Boeing 787. Engines aftermarket also performed well, with growth in our RRSP portfolio and strong development in our repairs and governmental businesses.
First half performance
In the first half, Engines revenue grew by 19%, with OE up 23% and aftermarket up 15%, underpinned by engine OEM based demand on key programmes such as the GTF and GEnx.
In the aftermarket, we saw growth across all areas of the division. Building on the momentum from the second half of 2025, legacy narrowbody (V2500 and CFM56) continued to perform well with a revenue increase of 27%. Our engines repair business grew 27%, despite ongoing powder shortages, reflecting higher fan blade volumes, with growth across all our sites. Revenue was up 29% in Governmental, driven by aftermarket support on the RM12 engine that powers the Gripen C/D. Variable consideration of £206 million (2025: £182 million) was in line with our expectations, reflecting the ramp in OE deliveries for the GTF, XWB and GEnx engines. The growth of the Engines portfolio translated into a 21% increase in operating profit, with margins 40bps ahead of the comparative period.
Commercial
We recently announced an expansion of our long-standing relationship with Pratt & Whitney with an agreement to include low-pressure compressor vanes for the PW1500G and PW1900G GTF engines, within the existing RRSP programme. Demand for our additive capabilities continued to grow: we signed a development contract with Pratt & Whitney to manufacture F135 Fan Case Components using additive fabrication; a multi-year contract to perform repairs on GTF components where the process enables restoration of components that cannot be completed using conventional methods; and first serial production for GE Industrial Gas Turbines using powder bed technology.
We also continued to invest in our foundry business acquired in 2025 which has strengthened our ability to produce superalloy castings in-house, thereby allowing us to combine traditional casting with additive manufacturing to improve supply-chain resilience.
Our high-quality repair solutions business secured further contracts from existing OEMs, including a new five-year contract with Rolls-Royce covering fan blade repairs for the RB211-535, Trent 700 and Trent 800 engine programmes at our expanded San Diego facility. The site also expanded its capabilities, completing its first repair of a blisk, a highly engineered component where the disk and blades are manufactured as a single piece.
In defence, we delivered our first upgraded RM12 engine to the Swedish Armed Forces as part of the RM12 Enhanced Performance programme. The upgrades increase engine thrust, endurance and operating efficiency for the Gripen C/D, with the programme building on our long-standing role as type certificate holder and strategic partner to the Swedish Air Force. Looking ahead, we are on track to take on the same role on the RM16 engine that powers the Gripen E at the end of the year and remain committed to support all Gripen systems in the Ukraine based on the recent government-to-government announcement.
Operations
The deployment of our lean operating model, Brilliant Basics, continues to deliver benefits and efficiency savings. Inventory management is a key focus area and in the first half, the division achieved a 9% reduction in DIO through improvements in product flow. A key breakthrough initiative is the work we are doing to manage the performance of our suppliers including implementing tailored strategies for low volume suppliers and initiatives covering dual-sourcing and insourcing.
Technology
During the first half, we continued to advance a broad portfolio of differentiated technologies, focusing on small air vehicles, next-generation propulsion systems, advanced manufacturing and digital engineering. Advanced manufacturing remains an important area of differentiation, with progress across composite structures, additive fabrication, repair technologies and industrial digitalisation.
We continued to partner with all major engine OEMs, using our engine level design capability to enhance the performance of the next generation of commercial and defence engines. Our increased focus on engine composites saw us successfully manufacture the first composite front frame demonstrator hardware, validating a novel lightweight structural concept for future engine applications.
We also continued to deliver against our additive fabrication technology roadmap. We demonstrated the feasibility of additive repair solutions for high-pressure compressor components, supporting both future product development and more sustainable aircraft lifecycle management. The first large-scale additive nozzle extension demonstrator was also manufactured for launcher applications, and we achieved important milestones for Laser Powder Bed Fusion manufacture of ArianeGroup Prometheus launcher engine turbine rotors and manifolds.
Digital technologies continue to enhance our competitive advantage. We are focused on tangible value creation from AI, for example implementing an AI-assisted non-conformance tool, enabling more efficient reuse of legacy quality and manufacturing data to accelerate problem resolution and organisational learning. This supports continued improvements in productivity and engineering effectiveness.
Through these activities, we continue to strengthen our differentiated technology portfolio, maturing critical capabilities that support improved productivity, sustainability and performance across both current and future aerospace platforms.
OUTLOOK
Our Engines division is well placed for continued growth, margin expansion and increasing cash flow. The division has an enviable combination of OEM‑level capability, proprietary technology positions, strategic partnerships with all major engine OEMs, and the most diverse RRSP portfolio in the industry. This provides the foundation for significant value creation in the years ahead.
In 2026, we expect the division to deliver revenue of £1,700 to £1,800 million and adjusted operating profit of £565 to £595 million (using an exchange rate of 1 GBP = US$1.37).
DIVISIONAL REVIEW
AIRFRAMES
|
Adjusted results |
H1 2026 £m |
H1 2025 £m |
Growth |
|
Revenue |
977 |
939 |
4% |
|
Operating profit |
62 |
63 |
-1% |
|
Operating profit margin |
6.3% |
6.7% |
-40bps |
Our Airframes division is a Super-Tier 1 design-to-build partner on the world's highest volume civil and defence aircraft. Through differentiated technology we are well positioned as partner of choice for next-generation and emerging platforms. With strong underlying dynamics in both the civil and defence markets, our focus is on delivering production ramp-ups, driving margin expansion, improving quality of earnings and generating strong cash flow.
The end market outlook remains positive, underpinned by strong demand for new aircraft driving record backlogs and the increase in global defence spending. Divisional revenue derived from Civil and Defence platforms in the first half was 63% and 37% respectively.
Gross orders for new commercial aircraft remained buoyant in the first half with a doubling of new orders on the A320neo family and a fourfold increase for the A220 compared with the first half in 2025. Deliveries also grew in the Period, with Airbus up 15% and Boeing up 12% as the OEMs continue to try to meet required build rates against a backdrop of continued supply chain challenges. In business jets, demand remains robust driving orderbook growth albeit deliveries were lower in the first half with supply issues impacting final assembly and completions.
In defence, spending by NATO continued to rise in in the first half with existing defence budgets underpinning demand for core military programmes. The medium to long-term outlook is positive with NATO members having moved beyond their spending target of 2% of GDP to a pathway towards 3.5% by 2035, shifting defence spending from a short-term response to geopolitical events into a long-duration policy commitment. Not only have commitments increased but there has also been a shift in priorities with a greater emphasis being placed on air power, missiles and autonomous and uncrewed systems.
First half performance
Airframes revenue grew by 4% to £977 million, with strong growth in Defence of 14% driven by the F-35, C-130 and NH90 offset by Civil where revenue was slightly lower, down 1%. Within Civil, higher revenue in widebody (A350) was offset by narrowbody aircraft (A320) where revenue was lower, reflecting the utilisation of customer inventory. Revenue from business jets was up 2%. The impact of the incident at our Garden Grove facility was to reduce revenue and operating profit by £16 million and £9 million respectively versus our expectations in the first half. Operating profit margin was 40bps lower at 6.3%, reflecting the impact of reduced throughput at Garden Grove, with operating profit of £62 million down 1% on the comparative period.
In Defence, work has continued alongside the Engines division, to develop an uncrewed aerial demonstrator for the FMV in Sweden, with builds expected later this year and first flight tests in 2027. This initiative brings together our leadership across both structures and propulsions technologies and paves the way for future similar opportunities. We continue to support Anduril, with the UK Ministry of Defence announcing that the company has been shortlisted for the next phase of Project NYX, a programme to develop an Autonomous Collaborative Platform for the British Army. We also recently announced our participation in BAE Systems' Brontanax programme, where we are responsible for the engineering, manufacture, and full prototype integration of flight-ready wings, fins, and control surfaces for the UK's first Collaborative Combat Aircraft.
In Civil, our Chinese business reached some important milestones in the first half. The Langfang site recorded the significant achievement of 4,000 days without a lost time accident. Our JV in Jingjiang made its first shipments of the Horizontal Tail Plane for the C909 regional jet. We have also had success diversifying our sales beyond OE, increasing aftermarket revenue across EWIS, transparencies and wing structures.
Operations
Brilliant Basics, our lean operating model, continued to drive operational improvements and greater efficiency across the division. We have no higher priority than safety and in the first half the TIR for the 12-month period ended 30 June 2026, was 48% lower than the corresponding period ended 30 June 2025. We also delivered an improvement in the cost of poor quality which reduced by 12% versus the prior year, with productivity also up by three percentage points.
Following the production transfers we outlined at the full year results, output and productivity have improved significantly at our site in the Netherlands, with further progress expected in the second half. In the UK, execution of our investment programme to support the OEM ramp continued with a focus on enhancing our machining and inspection capabilities. We also progressed key infrastructure improvements and introduced a pilot to support accelerated learning in robotics and AI.
The industrialisation of our Mexico facility advanced during the first half with the newly established EWIS capability successfully progressing through Airbus first article approvals, with the majority of harnesses now approved for manufacture in Mexico.
The work we have done on targeted supplier development activities, enhanced forecasting and dual-source initiatives is helping to strengthen resilience across critical supply chains. We remain focused on improving supply chain stability, supporting rate increases and mitigating risks associated with global trade developments.
Technology
Through differentiated technology and advanced manufacturing capabilities, we strengthened our position as a partner of choice for emerging urban air mobility and next-generation civil aerospace platforms.
We have advanced our proprietary additive fabrication technologies, expanding our industrial applications towards airframe structural components. In the first half, we completed our largest full scale prototype with component demonstrators being developed for defence customers in the UK and US. In Defence, work on next generation transparencies continued including delivering a flight-standard canopy and windscreen systems for a 6th generation fighter, providing a transparency solution for flight test.
OUTLOOK
Airframes is a design-to-build partner on the world's highest volume platforms today and is a partner of choice for emerging and next generation aircraft. It is well-positioned to take advantage of the ongoing civil ramp up and defence market growth, as well as the shift to more sustainable aviation over time. With strong underlying dynamics in both markets, and our business improvement actions now substantially complete, we expect to deliver further profitable growth as production rates increase.
In 2026, excluding the impact from the Garden Grove incident, we expect the division to deliver revenue of £2,050 to £2,150 million and adjusted operating profit of £170 to £190 million (using an exchange rate of 1 GBP = US$1.37).
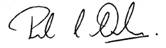
Peter Dilnot
Chief Executive Officer
31 July 2026
CHIEF FINANCIAL OFFICER'S REVIEW
MELROSE GROUP RESULTS
Statutory results:
The statutory IFRS results are shown on the face of the Income Statement and show revenue of £1,873 million (2025: £1,720 million), an operating profit of £154 million (2025: £441 million) and a profit before tax of £89 million (2025: £379 million). The diluted earnings per share ("EPS"), calculated using the diluted weighted average number of shares during the Period of 1,252 million (2025: 1,283 million), were 6.0 pence (2025: 22.2 pence).
Adjusted results:
The adjusted results exclude certain items which are significant in size or volatility or by nature are non-trading or non-recurring, or any net change in fair value items booked on an acquisition. It is the Group's accounting policy to exclude these items from the adjusted results, which are used as an Alternative Performance Measure ("APM") as described by the European Securities and Markets Authority ("ESMA"). APMs used by the Group are defined in the glossary to the Condensed Consolidated Interim Financial Statements.
The Melrose Board considers the adjusted results to be an important measure used to monitor how the Group is performing as they achieve consistency and comparability between reporting periods when all subsidiaries are held for the complete reporting period.
The adjusted results for the Period show revenue of £1,873 million (2025: £1,720 million), an operating profit of £347 million (2025: £310 million) and a profit before tax of £282 million (2025: £248 million). Adjusted diluted EPS, calculated using the diluted weighted average number of shares in the Period of 1,252 million (2025: 1,283 million), were 17.7 pence (2025: 15.1 pence).
The following table shows the adjusted results for the Period split by reporting segment:
|
|
Engines £m |
Airframes £m |
Corporate £m |
Total £m |
|
Revenue |
896 |
977 |
- |
1,873 |
|
Operating profit/(loss) |
303 |
62 |
(18) |
347 |
|
Operating margin |
33.8% |
6.3% |
n/a |
18.5% |
Revenue for Engines of £896 million (2025: £781 million) shows constant currency growth of 19% over 2025, with adjusted operating profit of £303 million (2025: £261 million) giving an operating margin of 33.8% (2025: 33.4%), an increase of 40 basis points.
Revenue for Airframes of £977 million (2025: £939 million) shows constant currency growth of 4% over 2025, with adjusted operating profit of £62 million (2025: £63 million) giving an operating margin of 6.3% (2025: 6.7%), a decrease of 40 basis points.
The adjusted results for the Period were impacted by an incident that took place in May 2026 at our Garden Grove facility. Excluding this impact, Group revenues would have been £16 million higher at £1,889 million (11% growth at constant currency) and adjusted operating profit would have been higher by £9 million at £356 million (19% growth at constant currency). A further £13 million of costs incurred associated with the Garden Grove incident were recognised as adjusting items.
The facility is included within the Airframes segment and, excluding the impact of the incident, Airframes revenue growth would have been 6% on a constant currency basis and operating margin would have been 7.2% (2025: 6.7%), an increase of 50 basis points.
Corporate costs of £18 million (2025: £14 million) included £13 million (2025: £13 million) of operating costs, £3 million (2025: £nil) of compensation for an executive Director connected to forfeited awards and £2 million (2025: £1 million) of costs in respect of the Performance Share Plan for certain senior managers in the Group.
Tables summarising the reconciliation of statutory results to adjusted results by reportable segment are shown in note 3 of the Condensed Consolidated Interim Financial Statements, with a Group table shown below.
RECONCILIATION OF STATUTORY RESULTS TO ADJUSTED RESULTS
The following table reconciles the Group statutory operating profit to adjusted operating profit:
|
|
2026 £m |
2025 £m |
|
Statutory operating profit |
154 |
441 |
|
Adjusting items: |
|
|
|
Amortisation of intangible assets acquired in business combinations |
124 |
127 |
|
Losses/(gains) in derivatives and associated financial assets and liabilities |
56 |
(267) |
|
Garden Grove incident costs |
13 |
- |
|
Restructuring costs |
- |
12 |
|
Net changes in fair value items |
- |
(3) |
|
Adjustments to statutory operating profit |
193 |
(131) |
|
|
|
|
|
Adjusted operating profit |
347 |
310 |
Adjusting items to statutory operating profit include:
· The amortisation charge on intangible assets acquired in business combinations of £124 million (2025: £127 million), which is excluded from adjusted results due to its non-trading nature and to enable comparison with companies that grow organically. However, where intangible assets are trading in nature, such as computer software and development costs, the amortisation is not excluded from adjusted results.
· Movements in the fair value of derivative financial instruments (primarily forward foreign currency exchange contracts), where hedge accounting is not applied, along with foreign exchange movements on the associated financial assets and liabilities, entered into within the businesses to mitigate the potential volatility of future cash flows on long-term foreign currency customer and supplier contracts. This totalled a charge of £56 million (2025: credit of £267 million) in the Period, and is shown as an adjusting item because of its volatility and size.
· Costs incurred associated with the Garden Grove incident totalling £13 million (2025: £nil) during the Period, relating to initial response, recovery and advisory costs. These are shown as adjusting items due to their size and non-trading nature.
· Costs in the prior period associated with significant restructuring projects of £12 million. These were shown as adjusting items due to their size and non-trading nature and included a charge of £10 million relating to the finalisation of significant restructuring projects across sites in the Engines and Airframes divisions in Europe and North America. As at 30 June 2026, £8 million remains included in restructuring provisions from projects commenced in prior periods.
TAX
The statutory results for the Period show a tax charge of £14 million (2025: £94 million), which arises on a statutory profit before tax of £89 million (2025: £379 million). The effective tax rate on adjusted profit before tax for the Period was 21.3% (2025: 21.8%).
SHARE BUYBACK PROGRAMMES AND NUMBER OF SHARES IN ISSUE
The Group completed its 18-month £250 million share buyback programme on 31 March 2026. During the Period, 9,416,570 ordinary shares were purchased at an average price per share of 595 pence and transferred to treasury.
The Group also commenced its 12-month £175 million share buyback programme on 1 April 2026. During the Period, 2,375,743 ordinary shares were purchased at an average price per share of 500 pence and transferred to treasury, costing £12 million. This programme has been paused pending clarification of the financial impact associated with the incident at Garden Grove.
The number of ordinary shares in issue, excluding treasury shares, has reduced by 1% from 1,258 million at 31 December 2025 to 1,246 million at 30 June 2026.
The weighted average number of shares used for basic earnings per share calculations in the Period was 1,250 million (2025: 1,279 million), and when including the number of shares expected to be issued from the Melrose equity-settled share plans, the weighted average number of shares used for diluted earnings per share was 1,252 million (2025: 1,283 million).
CASH GENERATION AND MANAGEMENT
Free cash flow for the Period was an inflow of £13 million (2025: outflow of £54 million). Excluding the impact of factoring, free cash flow was an inflow of £28 million (2025: outflow of £85 million), an increase of £113 million compared to the prior period. An analysis of free cash flow is shown in the table below:
|
|
2026 £m |
2025 £m |
|
Adjusted operating profit |
347 |
310 |
|
Depreciation and amortisation |
70 |
67 |
|
Variable consideration |
(206) |
(182) |
|
Positive non-cash impact from loss-making contracts |
(4) |
(5) |
|
Lease obligation payments |
(18) |
(17) |
|
Working capital movements: |
|
|
|
Inventory |
(89) |
(85) |
|
Receivables and payables (excluding factoring) |
89 |
(1) |
|
Capital expenditure |
(52) |
(50) |
|
Restructuring |
(6) |
(17) |
|
Garden Grove incident |
(5) |
- |
|
GTF PMI payments |
(27) |
(37) |
|
Net interest and net tax paid |
(71) |
(64) |
|
Net other |
- |
(4) |
|
Free cash flow pre-factoring |
28 |
(85) |
|
Net cash flow from factoring arrangements |
(15) |
31 |
|
Free cash flow |
13 |
(54) |
Variable consideration, excluding exchange adjustments, has increased in the Period to £206 million (2025: £182 million) in accordance with the development anticipated in our Risk and Revenue Sharing Partnership booklet. Payments for obligations in connection with powder metal issues on certain Pratt & Whitney engines have reduced as expected to £27 million (2025: £37 million).
Working capital movements excluding variable consideration and the impact of factoring were neutral in the Period (2025: outflow of £86 million), being an outflow of £89 million (2025: £85 million) in inventory offset by an £89 million inflow (2025: outflow of £1 million) from receivables and payables. Inventory increased during the year due to a combination of supporting customer build rates, supply chain issues and normal seasonal factors. Receivables and payables included a strong performance on customer receipts, which were meaningfully higher than anticipated at the end of June.
Capital expenditure in the Period was £52 million (2025: £50 million) and represented 1.0x (2025: 1.0x) depreciation of owned assets.
Restructuring spend in the Period reduced to £6 million (2025: £17 million) reflecting legacy cash costs incurred on projects announced in prior years.
Cash spend connected to the Garden Grove incident totalled £5 million during the Period (2025: £nil), relating to initial response, recovery and advisory costs. The full cash flow impact of the Garden Grove incident in the Period was a £7 million inflow due to a temporary unwind in site working capital offsetting both the cash spend noted above and the loss of site profit in the Period.
Net interest paid in the Period was £62 million (2025: £53 million), net tax payments were £9 million (2025: £11 million) and ongoing contributions to defined benefit pension schemes were £2 million (2025: £2 million).
The movement in net debt is summarised as follows:
|
|
£m |
|
Opening net debt |
(1,407) |
|
Free cash flow |
13 |
|
Amounts paid to shareholders including associated costs |
(130) |
|
Capital return from investments |
13 |
|
FX and other non-cash movements |
(19) |
|
Net debt at 30 June 2026 at closing exchange rates |
(1,530) |
Group net debt at 30 June 2026, translated at closing exchange rates (being US $1.33 and €1.16), was £1,530 million (31 December 2025: £1,407 million), after a free cash inflow of £13 million, described above. Movements in Group net debt also included dividends paid to shareholders of £60 million, £70 million spent buying back shares in the market, £13 million of capital returns from investments and net adverse foreign exchange and other non-cash movements of £19 million.
Group leverage at 30 June 2026 was 1.8x EBITDA (31 December 2025: 1.8x EBITDA) and interest cover was 7.2x (31 December 2025: 6.9x).
PROVISIONS
Total provisions at 30 June 2026 were £130 million (31 December 2025: £147 million).
The following table details the movement in provisions in the Period:
|
|
Total £m |
|
Provisions at 1 January 2026 |
147 |
|
Net charge in the Period |
3 |
|
Spend against provisions |
(17) |
|
Utilisation of loss-making contract provision |
(4) |
|
Exchange adjustments |
1 |
|
Provisions at 30 June 2026 |
130 |
The net charge to the Income Statement in the Period was £3 million (2025: £21 million). During the Period, £4 million (2025: £5 million) was utilised against loss-making contract provisions and £17 million (2025: £26 million) of cash was spent against provisions with £6 million (2025: £17 million) relating to restructuring activities.
CONTINGENT LIABILITIES - GARDEN GROVE INCIDENT
The Group is cooperating with regulators (local, state and federal) and lawyers across multiple regulatory inquiries and investigations including more than thirty civil litigation actions. These cases are complex and at this point the outcomes are uncertain. As a consequence the Group is unable to reliably assess the likely outcome or quantify the financial impact as at the date of these financial statements, and as such no provision has been made.
PENSIONS AND POST-EMPLOYMENT OBLIGATIONS
Melrose operates a number of defined benefit pension schemes and retiree medical plans across the Group, accounted for using IAS 19 Revised: "Employee Benefits". The values of the Group plans were updated at 30 June 2026 by independent actuaries to reflect the latest key assumptions and are summarised as follows:
|
|
Assets £m |
Liabilities £m |
Accounting surplus/(deficit) £m |
|
GKN UK Group Pension Scheme - Number 1 |
564 |
(546) |
18 |
|
Other Group pension schemes |
- |
(29) |
(29) |
|
Total Group pension schemes |
564 |
(575) |
(11) |
At 30 June 2026, the total plan assets of Melrose Group's defined benefit pension plans were £564 million (31 December 2025: £579 million) and total plan liabilities were £575 million (31 December 2025: £606 million), a net deficit of £11 million (31 December 2025: £27 million).
The GKN UK Group Pension Scheme (Number 1) is the most significant pension plan in the Group, and is closed to new members and to the accrual of future benefits for current members.
At 30 June 2026, the GKN UK Group Pension Scheme (Number 1) had gross assets of £564 million (31 December 2025: £579 million), gross liabilities of £546 million (31 December 2025: £577 million), resulting in a net surplus of £18 million (31 December 2025: £2 million).
A summary of the assumptions used are shown in note 10 to the Condensed Consolidated Interim Financial Statements.
FINANCIAL RISK MANAGEMENT
The principal financial risks and uncertainties faced by the Group include liquidity risk, finance cost risk, exchange rate risk, contract and warranty risk and commodity cost risk. The nature of these risks in relation to the Group are explained in detail on pages 29 to 30 of the 2025 Annual Report, a copy of which is available on the Company's website, www.melroseplc.net.
Further explanations and details of the strategic risk profile of the Group, which includes non-financial risk, are set out on pages 32 to 39 of the 2025 Annual Report.
Exchange rates used in the Period
Exchange rates for currencies most relevant to the Group in the Period were:
|
|
|
Average rate |
Closing rate |
|
US Dollar |
|
|
|
|
Six months to 30 June 2026 |
|
1.34 |
1.33 |
|
Twelve months to 31 December 2025 |
|
1.32 |
1.35 |
|
Six months to 30 June 2025 |
|
1.30 |
1.37 |
|
Euro |
|
|
|
|
Six months to 30 June 2026 |
|
1.15 |
1.16 |
|
Twelve months to 31 December 2025 |
|
1.17 |
1.15 |
|
Six months to 30 June 2025 |
|
1.19 |
1.17 |
The Group policy on exchange rate risk is explained on page 30 of the 2025 Annual Report.
A 1 cent strengthening of the major currencies within the Group, if this were to happen in isolation against all other currencies, would have the following full year impact on the re-translation of adjusted operating profit into Sterling:
|
|
USD |
EUR |
|
Increase in adjusted operating profit - £ million |
5 |
1 |
|
% impact on adjusted operating profit |
0.7% |
0.1% |
In the Period, the Group incurred a 3% translational foreign exchange loss on adjusted operating profit compared to the prior period.
The impact from transactional foreign exchange exposures is not material in the short term due to hedge coverage being approximately 90%.
The Group utilises its multi-currency banking facility to maintain an appropriate mix of debt in US Dollars, Euros and Sterling. The hedge of having debt drawn in US Dollars and Euros protects against some of the Balance Sheet and banking covenant foreign exchange translation risk. A 1 cent strengthening in either the US Dollar or Euro would have the following impact on gross debt as at 30 June 2026:
|
|
USD |
EUR |
|
Increase in gross debt - £ million |
11 |
2 |
|
Increase in gross debt - % |
0.6% |
0.1% |
Liquidity risk management
The Group's net debt position at 30 June 2026 was £1,530 million (31 December 2025: £1,407 million).
As at 31 December 2025, the Group's bank facilities totalled US$1,680 million, €755 million and £350 million. Within these amounts, US$1,610 million, €400 million and £300 million were extended in the Period to April 2027 with the potential to be further extended to April 2028 at the Group's option. In addition, and during the Period, the £50 million facility maturing in January 2026 was extended to January 2027 and, for the €355 million facilities maturing in January 2027, the Group has arranged for the potential to extend the facilities for a further year at the Group's option. The US$70 million facility matured during the Period.
Therefore, the Group's bank facilities as at 30 June 2026 totalled US$1,610 million, €755 million and £350 million.
Details of the facilities and amounts borrowed as at 30 June 2026 are shown below.
|
|
Local currency |
£m |
||
|
|
Size |
Drawn |
Headroom |
Headroom |
|
Term loan: |
|
|
|
|
|
USD |
549 |
549 |
- |
- |
|
EUR |
415 |
280 |
135 |
116 |
|
Revolving credit facility: |
|
|
||
|
USD |
1,061 |
982 |
79 |
60 |
|
GBP |
350 |
311 |
39 |
39 |
|
EUR |
340 |
28 |
312 |
269 |
|
Total (GBP) |
2,216 |
1,732 |
|
484 |
In addition to the headroom of £484 million on committed facilities, there are a number of uncommitted overdraft, guarantee and borrowing facilities made available to the Group. As at 30 June 2026, there were cash and cash equivalents, net of overdrafts, totalling £199 million (31 December 2025: £154 million).
The committed bank funding has two financial covenants, being a net debt to adjusted EBITDA covenant ("banking covenant leverage") and an interest cover covenant, both of which are tested half-yearly at 30 June and 31 December.
Both covenants have comfortable headroom with the banking covenant leverage test level set at 3.5x, and as at 30 June 2026 it was 1.9x. The interest cover test is set at 4.0x, and as at 30 June 2026 the Group interest cover was 7.2x.
A limited number of Group trade receivables are subject to non-recourse factoring and customer supply chain finance arrangement. The majority of these schemes are denominated in US Dollar and are translated into Sterling at the closing rate. As at 30 June 2026, these amounted to £387 million (31 December 2025: £396 million). No new schemes were added during the Period.
|
|
2026 £m |
2025 £m |
|
Opening factoring utilisation |
396 |
338 |
|
FX movements |
6 |
(29) |
|
Net cash (outflow)/inflow |
(15) |
31 |
|
Factoring utilisation at 30 June |
387 |
340 |
Finance cost risk management
The Group uses financial derivatives to fix a portion of the interest cost on its committed bank facilities. The maximum weighted average rates, excluding the bank margin, the Group will pay on the fixed portions of its US Dollar, Euro and Sterling bank debt are 3.7%, 2.5% and 3.9% respectively.
The margins on the bank facilities depend on the banking covenant leverage and were as follows:
|
|
30 June 2026 |
31 Dec 2025 |
||
|
Facility: |
Margin |
Range |
Margin |
Range |
|
Term Loan |
1.40%-1.75% |
0.90%-2.40% |
1.40%-1.75% |
0.90%-2.40% |
|
Revolving Credit Facilities |
1.40%-1.75% |
1.00%-2.40% |
1.40%-1.75% |
1.00%-2.40% |
The Group's cost of drawn debt for the next 12 months is currently expected to be approximately 5.3%.
GOING CONCERN
As part of their consideration of going concern, the Directors have reviewed the Group's future cash forecasts and projections, which are based on both market and internal data and recent past experience.
The Directors recognise the challenges in the current economic environment, including challenges in supply chains and geopolitical risks. The Group is actively managing the associated impacts on trading through a sharp focus on pricing, productivity and costs.
The Group has modelled a severe but plausible downside case against these future cash forecasts and throughout this scenario the Group would not breach any financial covenants and would not require any additional sources of financing.
The Directors have also given consideration to: (i) the potential impact of the Garden Grove incident and have incorporated its latest legal advice into the going concern assessment; and (ii) the impact of a pause in the current share buyback programme.
The macroeconomic environment remains uncertain and volatile and the impacts of factors such as geopolitical conflict and challenges in supply chains could be more prolonged or severe than that which the Directors have considered in the Group's severe but plausible downside case.
Considering the Group's current committed bank facility headroom, its access to liquidity and the level of bank covenants in place with lending banks, the Directors consider it appropriate that the Group can manage its business risks successfully and adopt a going concern basis in preparing these Condensed Consolidated Interim Financial Statements.
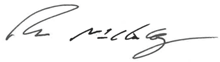
Ross McCluskey
Chief Financial Officer
31 July 2026
CAUTIONARY STATEMENT
This announcement contains forward-looking statements. These statements are made in good faith based on the information available up to the time of the approval of this announcement, and should be treated with caution due to the inherent uncertainties, including both economic and business risk factors, underlying any such forward-looking information. Accordingly, readers are cautioned not to place undue reliance on any such forward-looking statements. Subject to compliance with applicable laws and regulations, the Company does not undertake any obligation to update any forward-looking statement to reflect events or circumstances after the date of this announcement. This announcement has been prepared solely to provide information to shareholders to assess the Company's strategies and the potential for those strategies to succeed, and neither the Company nor its directors accept any liability to any other person save as would arise under English law.
NO OFFER OF SECURITIES
Nothing in this announcement constitutes an offer of securities for sale in the U.S. Securities may not be sold in the U.S. absent registration or an exemption from registration.
DIRECTORS' RESPONSIBILITY STATEMENT
We, the directors of the Company, confirm to the best of our knowledge:
1. the condensed financial statements have been prepared in accordance with IAS 34 "Interim Financial Reporting" as adopted by the UK;
2. the interim management report includes a fair review of the information required by DTR 4.2.7R (indication of important events and their impact during the first six months, and description of principal risks and uncertainties for the remaining six months of the financial year); and
3. the interim management report includes a fair review of the information required by DTR 4.2.8R (disclosure of related parties' transactions and changes therein).
Details of the directors of the Company are available on our website at https://www.melroseplc.net/governance/board-leadership/.
By order of the Board
|
|
|
|
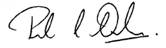
Peter Dilnot Chief Executive Officer 31 July 2026 |
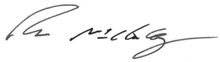
Ross McCluskey Chief Financial Officer 31 July 2026 |
Independent review report to Melrose Industries PLC
Report on the condensed consolidated interim financial statements
Our conclusion
We have reviewed Melrose Industries PLC's condensed consolidated interim financial statements (the "interim financial statements") in the Unaudited Results of Melrose Industries PLC for the 6 month period ended 30 June 2026 (the "period").
Based on our review, nothing has come to our attention that causes us to believe that the interim financial statements are not prepared, in all material respects, in accordance with UK adopted International Accounting Standard 34, 'Interim Financial Reporting' and the Disclosure Guidance and Transparency Rules sourcebook of the United Kingdom's Financial Conduct Authority.
The interim financial statements comprise:
● the condensed consolidated balance sheet as at 30 June 2026;
● the condensed consolidated income statement and the condensed consolidated statement of comprehensive income for the period then ended;
● the condensed consolidated statement of cash flows for the period then ended;
● the condensed consolidated statement of changes in equity for the period then ended; and
● the explanatory notes to the interim financial statements.
The interim financial statements included in the Unaudited Results of Melrose Industries PLC have been prepared in accordance with UK adopted International Accounting Standard 34, 'Interim Financial Reporting' and the Disclosure Guidance and Transparency Rules sourcebook of the United Kingdom's Financial Conduct Authority.
Basis for conclusion
We conducted our review in accordance with International Standard on Review Engagements (UK) 2410, 'Review of Interim Financial Information Performed by the Independent Auditor of the Entity' issued by the Financial Reporting Council for use in the United Kingdom ("ISRE (UK) 2410"). A review of interim financial information consists of making enquiries, primarily of persons responsible for financial and accounting matters, and applying analytical and other review procedures.
A review is substantially less in scope than an audit conducted in accordance with International Standards on Auditing (UK) and, consequently, does not enable us to obtain assurance that we would become aware of all significant matters that might be identified in an audit. Accordingly, we do not express an audit opinion.
We have read the other information contained in the Unaudited Results and considered whether it contains any apparent misstatements or material inconsistencies with the information in the interim financial statements.
Conclusions relating to going concern
Based on our review procedures, which are less extensive than those performed in an audit as described in the Basis for conclusion section of this report, nothing has come to our attention to suggest that the directors have inappropriately adopted the going concern basis of accounting or that the directors have identified material uncertainties relating to going concern that are not appropriately disclosed. This conclusion is based on the review procedures performed in accordance with ISRE (UK) 2410. However, future events or conditions may cause the group to cease to continue as a going concern.
Responsibilities for the interim financial statements and the review
Our responsibilities and those of the directors
The Unaudited Results, including the interim financial statements, is the responsibility of, and has been approved by the directors. The directors are responsible for preparing the Unaudited Results in accordance with the Disclosure Guidance and Transparency Rules sourcebook of the United Kingdom's Financial Conduct Authority. In preparing the Unaudited Results, including the interim financial statements, the directors are responsible for assessing the group's ability to continue as a going concern, disclosing, as applicable, matters related to going concern and using the going concern basis of accounting unless the directors either intend to liquidate the group or to cease operations, or have no realistic alternative but to do so.
Our responsibility is to express a conclusion on the interim financial statements in the Unaudited Results based on our review. Our conclusion, including our Conclusions relating to going concern, is based on procedures that are less extensive than audit procedures, as described in the Basis for conclusion paragraph of this report.
Use of this report
This report, including the conclusion, has been prepared for and only for the company for the purpose of complying with the Disclosure Guidance and Transparency Rules sourcebook of the United Kingdom's Financial Conduct Authority and for no other purpose. We do not, in giving this conclusion, accept or assume responsibility for any other purpose or to any other person to whom this report is shown or into whose hands it may come save where expressly agreed by our prior consent in writing.
PricewaterhouseCoopers LLP
Chartered Accountants
London
31 July 2026
Melrose Industries PLC
Condensed Consolidated Income Statement
|
|
Notes |
6 months ended 30 June 2026 Unaudited £m |
6 months ended 30 June 2025 Unaudited £m |
Year ended 31 December 2025 Audited £m |
|
|
|
|
|
|
|
Revenue |
3 |
1,873 |
1,720 |
3,589 |
|
Cost of sales |
|
(1,355) |
(1,266) |
(2,635) |
|
|
|
|
|
|
|
Gross profit |
|
518 |
454 |
954 |
|
|
|
|
|
|
|
Operating expenses |
|
(364) |
(13) |
(354) |
|
|
|
|
|
|
|
Operating profit |
3,4 |
154 |
441 |
600 |
|
|
|
|
|
|
|
|
|
|
|
|
|
Finance costs |
|
(65) |
(62) |
(132) |
|
Finance income |
|
- |
- |
- |
|
|
|
|
|
|
|
Profit before tax |
|
89 |
379 |
468 |
|
Tax |
5 |
(14) |
(94) |
(98) |
|
|
|
|
|
|
|
Profit after tax for the period attributable to owners of the parent |
75 |
285 |
370 |
|
|
|
|
|
|
|
|
|
|
|
|
|
|
|
|
|
|
|
|
Earnings per share |
|
|
|
|
|
- Basic |
6 |
6.0p |
22.3p |
29.1p |
|
- Diluted |
6 |
6.0p |
22.2p |
29.0p |
|
|
|
|
|
|
|
Adjusted(1) results |
|
|
|
|
|
|
|
|
|
|
|
Adjusted operating profit |
3,4 |
347 |
310 |
647 |
|
Adjusted profit before tax |
4 |
282 |
248 |
515 |
|
Adjusted profit after tax |
4 |
222 |
194 |
410 |
|
Adjusted basic earnings per share |
6 |
17.8p |
15.2p |
32.2p |
|
Adjusted diluted earnings per share |
6 |
17.7p |
15.1p |
32.1p |
(1) Defined in the summary of material accounting policies (see note 2).
All results arise from continuing operations.
Melrose Industries PLC
Condensed Consolidated Statement of Comprehensive Income
|
|
Notes |
6 months ended Unaudited £m |
6 months ended Unaudited £m |
Year ended 31 December 2025 Audited £m |
|
|
|
|
|
|
|
Profit after tax for the period |
|
75 |
285 |
370 |
|
|
|
|
|
|
|
|
|
|
|
|
|
Items that will not be reclassified subsequently to the Income Statement: |
|
|
|
|
|
Net remeasurement gain on retirement benefit obligations |
|
16 |
6 |
16 |
|
Fair value gain on investments in equity instruments |
|
- |
4 |
- |
|
Income tax (charge)/credit relating to items that will not be reclassified |
5 |
(4) |
(1) |
3 |
|
|
|
|
|
|
|
|
|
12 |
9 |
19 |
|
|
|
|
|
|
|
Items that may be reclassified subsequently to the Income Statement: |
|
|
|
|
|
Currency translation on investments, net of investment hedging |
|
25 |
(164) |
(125) |
|
Derivative gain/(loss) on hedge relationships |
|
15 |
(14) |
(12) |
|
Income tax (charge)/credit relating to items that may be reclassified |
5 |
(4) |
6 |
6 |
|
|
|
|
|
|
|
|
|
36 |
(172) |
(131) |
|
|
|
|
|
|
|
|
|
|
|
|
|
Other comprehensive income/(expense) for the period |
|
48 |
(163) |
(112) |
|
|
|
|
|
|
|
|
|
|
|
|
|
Total comprehensive income for the period attributable to owners of the parent |
|
123 |
122 |
258 |
|
|
|
|
|
|
Melrose Industries PLC
Condensed Consolidated Statement of Cash Flows
|
|
Notes |
6 months ended Unaudited £m |
6 months ended 30 June Unaudited £m |
Year ended 31 December 2025 Audited £m |
|
|
|
|
|
|
|
|
|
Net cash from operating activities |
11 |
83 |
8 |
214 |
|
|
|
|
|
|
|
|
|
|
|
|
|
|
|
|
Investing activities |
|
|
|
|
|
|
Purchase of property, plant and equipment |
|
(47) |
(46) |
(86) |
|
|
Proceeds from disposal of property, plant and equipment |
|
- |
- |
29 |
|
|
Purchase of computer software and capitalised development costs |
|
(5) |
(4) |
(9) |
|
|
Acquisition of subsidiaries, net of cash acquired |
|
- |
(5) |
(5) |
|
|
Disposal of businesses, net of cash disposed |
|
- |
- |
(20) |
|
|
Disposal of investments |
|
- |
9 |
9 |
|
|
Capital return from investments |
|
13 |
- |
- |
|
|
|
|
|
|
|
|
|
Net cash used in investing activities |
(39) |
(46) |
(82) |
||
|
|
|
|
|
||
|
|
|
|
|
|
|
|
Financing activities |
|
|
|
|
|
|
Drawings on borrowing facilities |
|
150 |
220 |
229 |
|
|
Costs of raising debt finance |
|
(3) |
(1) |
(1) |
|
|
Payment of principal under lease obligations |
|
(18) |
(17) |
(31) |
|
|
Purchase of own shares, including associated costs |
7 |
(70) |
(71) |
(173) |
|
|
Dividends paid to owners of the parent |
7 |
(60) |
(51) |
(82) |
|
|
|
|
|
|
|
|
|
Net cash (used in)/from financing activities |
(1) |
80 |
(58) |
||
|
|
|
|
|
|
|
|
|
|
|
|
|
|
|
Net increase in cash and cash equivalents, net of bank overdrafts |
|
43 |
42 |
74 |
|
|
Cash and cash equivalents, net of bank overdrafts at the beginning of the period |
|
154 |
80 |
80 |
|
|
Effect of foreign exchange rate changes |
|
2 |
(1) |
- |
|
|
|
|
|
|
|
|
|
Cash and cash equivalents, net of bank overdrafts at the end of the period |
11 |
199 |
121 |
154 |
|
|
|
|
|
|
|
|
As at 30 June 2026, the Group had net debt of £1,530 million (31 December 2025: £1,407 million). A definition and reconciliation of the movement in net debt is shown in note 11.
Melrose Industries PLC
Condensed Consolidated Balance Sheet
|
|
Notes |
30 June Unaudited £m |
30 June Unaudited £m |
31 December 2025 Audited £m |
|
|
Non-current assets |
|
|
|
|
|
|
Goodwill and other intangible assets |
|
2,578 |
2,782 |
2,690 |
|
|
Property, plant and equipment |
|
867 |
825 |
864 |
|
|
Investments |
|
44 |
59 |
56 |
|
|
Interests in equity accounted investments |
|
5 |
7 |
6 |
|
|
Deferred tax assets |
|
682 |
612 |
659 |
|
|
Derivative financial assets |
|
53 |
105 |
84 |
|
|
Other receivables |
|
1,742 |
1,141 |
1,526 |
|
|
Retirement benefit surplus |
10 |
18 |
- |
2 |
|
|
|
|
|
|
|
|
|
|
|
5,989 |
5,531 |
5,887 |
|
|
Current assets |
|
|
|
|
|
|
Inventories |
|
638 |
585 |
542 |
|
|
Trade and other receivables |
|
1,061 |
1,047 |
971 |
|
|
Derivative financial assets |
|
19 |
42 |
29 |
|
|
Current tax assets |
|
- |
1 |
1 |
|
|
Cash and cash equivalents |
|
200 |
124 |
166 |
|
|
|
|
|
|
|
|
|
|
|
1,918 |
1,799 |
1,709 |
|
|
|
|
|
|
|
|
|
|
|
|
|
|
|
|
Total assets |
3 |
7,907 |
7,330 |
7,596 |
|
|
|
|
|
|
|
|
|
|
|
|
|
|
|
|
Current liabilities |
|
|
|
|
|
|
Trade and other payables |
|
1,622 |
1,505 |
1,544 |
|
|
Interest-bearing loans and borrowings |
|
51 |
53 |
60 |
|
|
Lease obligations |
12 |
29 |
33 |
31 |
|
|
Derivative financial liabilities |
|
22 |
19 |
23 |
|
|
Current tax liabilities |
|
19 |
11 |
15 |
|
|
Provisions |
8 |
46 |
90 |
64 |
|
|
|
|
|
|
|
|
|
|
|
1,789 |
1,711 |
1,737 |
|
|
|
|
|
|
|
|
|
|
|
|
|
|
|
|
Net current assets/(liabilities) |
|
129 |
88 |
(28) |
|
|
|
|
|
|
|
|
|
|
|
|
|
|
|
|
Non-current liabilities |
|
|
|
|
|
|
Other payables |
|
551 |
381 |
533 |
|
|
Interest-bearing loans and borrowings |
|
1,679 |
1,475 |
1,513 |
|
|
Lease obligations |
12 |
294 |
236 |
299 |
|
|
Derivative financial liabilities |
|
18 |
20 |
11 |
|
|
Deferred tax liabilities |
|
604 |
528 |
564 |
|
|
Retirement benefit obligations |
10 |
29 |
52 |
29 |
|
|
Provisions |
8 |
84 |
75 |
83 |
|
|
|
|
|
|
|
|
|
|
|
3,259 |
2,767 |
3,032 |
|
|
|
|
|
|
|
|
|
|
|
|
|
|
|
|
Total liabilities |
3 |
5,048 |
4,478 |
4,769 |
|
|
|
|
|
|
|
|
|
|
|
|
|
|
|
|
Net assets |
|
2,859 |
2,852 |
2,827 |
|
|
|
|
|
|
|
|
|
|
|
|
|
|
|
|
Equity |
|
|
|
|
|
|
Issued share capital |
|
1 |
1 |
1 |
|
|
Share premium account |
|
1,000 |
1,000 |
1,000 |
|
|
Merger reserve |
|
109 |
109 |
109 |
|
|
Other reserves |
|
(2,330) |
(2,330) |
(2,330) |
|
|
Translation and hedging reserve |
|
191 |
114 |
155 |
|
|
Retained earnings |
|
3,888 |
3,958 |
3,892 |
|
|
|
|
|
|
|
|
|
Total equity attributable to owners of the parent |
|
2,859 |
2,852 |
2,827 |
|
|
|
|
|
|
|
|
Melrose Industries PLC
Condensed Consolidated Statement of Changes in Equity
|
|
Issued share capital £m |
Share premium account £m |
Merger reserve £m |
Other reserves £m |
Translation and hedging reserve £m |
Retained earnings £m |
Total equity attributable to owners of the parent £m |
|
|
|
|
|
|
|
|
|
|
At 1 January 2025 (audited) |
1 |
1,000 |
109 |
(2,330) |
286 |
3,778 |
2,844 |
|
|
|
|
|
|
|
|
|
|
Profit for the period |
- |
- |
- |
- |
- |
285 |
285 |
|
Other comprehensive (expense)/income |
- |
- |
- |
- |
(172) |
9 |
(163) |
|
|
|
|
|
|
|
|
|
|
Total comprehensive (expense)/income |
- |
- |
- |
- |
(172) |
294 |
122 |
|
Dividends paid (note 7) |
- |
- |
- |
- |
- |
(51) |
(51) |
|
Purchase of own shares (note 2) |
- |
- |
- |
- |
- |
(61) |
(61) |
|
Equity-settled share-based payments |
- |
- |
- |
- |
- |
1 |
1 |
|
Deferred tax on equity-settled share-based payments (note 5) |
- |
- |
- |
- |
- |
(3) |
(3) |
|
|
|
|
|
|
|
|
|
|
At 30 June 2025 (unaudited) |
1 |
1,000 |
109 |
(2,330) |
114 |
3,958 |
2,852 |
|
|
|
|
|
|
|
|
|
|
Profit for the period |
- |
- |
- |
- |
- |
85 |
85 |
|
Other comprehensive income |
- |
- |
- |
- |
41 |
10 |
51 |
|
|
|
|
|
|
|
|
|
|
Total comprehensive income |
- |
- |
- |
- |
41 |
95 |
136 |
|
Dividends paid (note 7) |
- |
- |
- |
- |
- |
(31) |
(31) |
|
Purchase of own shares |
- |
- |
- |
- |
- |
(132) |
(132) |
|
Equity-settled share-based payments |
- |
- |
- |
- |
- |
1 |
1 |
|
Deferred tax on equity-settled share-based payments |
- |
- |
- |
- |
- |
1 |
1 |
|
|
|
|
|
|
|
|
|
|
At 31 December 2025 (audited) |
1 |
1,000 |
109 |
(2,330) |
155 |
3,892 |
2,827 |
|
|
|
|
|
|
|
|
|
|
Profit for the period |
- |
- |
- |
- |
- |
75 |
75 |
|
Other comprehensive income |
- |
- |
- |
- |
36 |
12 |
48 |
|
|
|
|
|
|
|
|
|
|
Total comprehensive income |
- |
- |
- |
- |
36 |
87 |
123 |
|
Dividends paid (note 7) |
- |
- |
- |
- |
- |
(60) |
(60) |
|
Purchase of own shares (note 2) |
- |
- |
- |
- |
- |
(33) |
(33) |
|
Equity-settled share-based payments |
- |
- |
- |
- |
- |
2 |
2 |
|
Deferred tax on equity-settled share-based payments (note 5) |
- |
- |
- |
- |
- |
- |
- |
|
|
|
|
|
|
|
|
|
|
At 30 June 2026 (unaudited) |
1 |
1,000 |
109 |
(2,330) |
191 |
3,888 |
2,859 |
|
|
|
|
|
|
|
|
|
Notes to the Condensed Consolidated Interim Financial Statements
1. Corporate information
Melrose Industries PLC ("the Company") is a public company limited by shares. The Company is incorporated in the United Kingdom under the Companies Act 2006 and registered in England and Wales. The address of the registered office is 11th Floor, The Colmore Building, 20 Colmore Circus Queensway, Birmingham, West Midlands, B4 6AT.
The interim financial information for the six months ended 30 June 2026 has been reviewed by the auditor, but not audited. The information for the year ended 31 December 2025 shown in this report does not constitute statutory financial statements for that year as defined in section 434 of the Companies Act 2006. A copy of the statutory financial statements for that year has been delivered to the Registrar of Companies. The auditor has reported on those financial statements. Their report was unqualified, did not draw attention to any matters by way of emphasis and did not contain a statement under section 498 (2) or (3) of the Companies Act 2006.
2. Summary of material accounting policies
The interim financial information for the six months ended 30 June 2026, which has been approved by the Board of Directors, has been prepared on the basis of the accounting policies set out in the Group's 2025 Annual Report on pages 148 to 158.
The Group's 2025 Annual Report can be found on the Group's website www.melroseplc.net. These Condensed Consolidated Interim Financial Statements should be read in conjunction with the 2025 information and have been prepared in accordance with UK adopted International Accounting Standards ("IAS") and International Financial Reporting Standards ("IFRS") as issued by the International Accounting Standards Board. These Condensed Consolidated Interim Financial Statements do not comprise statutory accounts within the meaning of section 435 of the Companies Act 2006 and have been prepared in accordance with IAS 34: Interim Financial Reporting.
Capital structure
On 1 October 2024, the Group commenced a £250 million share buyback programme which completed at the end of March 2026. During the six month period ended 30 June 2026, 9,416,570 shares (2025: 14,180,323 shares) were purchased at an average price of 595 pence (2025: 504 pence) per share. These are held as treasury shares and the total costs of the purchase have been recognised in retained earnings.
On 1 April 2026, the Group commenced a subsequent share buyback programme. During the six month period ended 30 June 2026, 2,375,743 shares were purchased at an average price of 500 pence per share. These are held as treasury shares and the total costs of the purchase have been recognised in retained earnings.
Cash payments in the period totalled £70 million (2025: £71 million) and a liability of £1 million (31 December 2025: £38 million relating to the previous share buyback programme) has been recognised in respect of the shares expected to be purchased under the share buyback programme during the close period, as there was an irrevocable instruction to contracted financial institutions to complete purchases at 30 June 2026. Accordingly, a total amount of £33 million (2025: £61 million) has been recognised in retained earnings.
Alternative performance measures
The Group presents Alternative Performance Measures ("APMs") in addition to the statutory results. These are presented in accordance with the Guidelines on APMs issued by the European Securities and Markets Authority ("ESMA"). APMs used by the Group are set out in the glossary to these Condensed Consolidated Interim Financial Statements and the reconciling items between statutory and adjusted results are listed below and described in more detail in note 4.
Adjusted profit measures exclude items which are significant in size or volatility or by nature are non-trading or non-recurring or any net change in fair value items booked on an acquisition.
On this basis, the following are the principal items included within adjusting items impacting operating profit:
· Amortisation of intangible assets that are acquired in a business combination, excluding computer software and development costs;
· Significant restructuring project costs and other associated costs, including losses incurred following the announcement of closure for identified businesses, arising from significant strategy changes that are not considered by the Group to be part of the normal operating costs of the business;
· Acquisition and disposal related gains and losses;
· Charges relating to significant incidents at operational facilities, including costs that are directly attributable to the disruption and the related response and recovery activities;
· Impairment charges that are considered to be significant to the trading performance of the business;
· Movement in derivative financial instruments not designated in hedging relationships, including revaluation of associated financial assets and liabilities;
· The charge for the previous Melrose equity-settled compensation scheme, including its associated employer's tax charge; and
· The net change in fair value items booked on acquisitions.
Further to the adjusting items above, adjusting items impacting profit before tax include:
· Acceleration of unamortised debt issue costs written off as a consequence of Group refinancing; and
· Significant settlement gains and losses associated with debt instruments including interest rate swaps following acquisition or disposal related activity or non-trading transactions, which are not considered by the Group to be part of normal financing costs.
2. Summary of material accounting policies (continued)
In addition to the items above, adjusting items impacting profit after tax include:
· The net effect on tax of significant restructuring from strategy changes that are not considered by the Group to be part of the normal operating costs of the business;
· The net effect of significant new tax legislation; and
· The tax effects of adjustments to profit before tax, described above.
The Board considers the adjusted results to be an important measure used to monitor how the Group is performing, as this provides a meaningful reflection of how the Group is managed and measured on a day-to-day basis and achieves consistency and comparability between reporting periods, when all subsidiaries are held for a complete reporting period.
The adjusted measures are used to partly determine the variable element of remuneration of senior management throughout the Group and are also in alignment with performance measures used by certain external stakeholders.
Adjusted profit is not a defined term under IFRS and may not be comparable with similarly titled profit measures reported by other companies. It is not intended to be a substitute for, or superior to, GAAP measures. All APMs relate to the current period results and comparative periods where provided.
Going concern
The Condensed Consolidated Interim Financial Statements have been prepared on a going concern basis as the Directors consider that adequate resources exist for the Company to continue in operational existence for the foreseeable future, being 12 months from the date of this report (the relevant period). The Group's liquidity and funding arrangements are described in the Chief Financial Officer's Review. There is significant liquidity headroom at 30 June 2026 (£0.5 billion) and throughout the going concern forecast period. The Directors have considered a severe but plausible downside case. Additionally, consideration has been given to the potential impact of the Garden Grove incident and the Directors have incorporated the latest legal advice into the going concern assessment. Forecast covenant compliance is considered further below.
Covenants
The Group's banking facility has two financial covenants being a net debt to adjusted EBITDA covenant and an interest cover covenant, both of which are tested half-yearly at 30 June and 31 December. Covenant calculations are detailed in the glossary to these Condensed Consolidated Interim Financial Statements.
The financial covenants for the going concern period are as follows:
|
|
30 June 2026 |
31 December 2026 |
30 June 2027 |
|
Net debt to adjusted EBITDA (banking covenant leverage) |
3.5x |
3.5x |
3.5x |
|
Interest cover |
4.0x |
4.0x |
4.0x |
Testing
The Group modelled two scenarios in its assessment of going concern; a base case and a severe but plausible downside case.
The base case takes into account end markets and operational factors, including supply chain challenges, throughout the going concern period and has been monitored against the actual results and cash generation in the period since 1 July 2026.
The severe but plausible downside case models more conservative revenue and working capital assumptions in the remaining period of 2026 and the relevant period in 2027. However, given there is liquidity headroom of £0.5 billion, cash and cash equivalents of £0.2 billion and the Group's banking covenant leverage is 1.9x at 30 June 2026, comfortably below future testing levels, no further sensitivity detail is provided.
Under the severe but plausible downside case no covenant is breached at 31 December 2026 nor, based on the continuation of existing financing arrangements with the Group having the option to extend the majority of its facilities through to April 2028, at 30 June 2027 or 31 December 2027.
3. Segment information
Segment information is presented in accordance with IFRS 8: Operating Segments which requires operating segments to be identified on the basis of internal reports about components of the Group that are regularly reported to the Group's Chief Operating Decision Maker ("CODM"), which has been deemed to be the Group's Board, in order to allocate resources to the segments and assess their performance. The operating segments are as follows:
Engines - An industry leading global tier one supplier to the aerospace engines market, including structural engineered components; parts repair; commercial and aftermarket contracts.
Airframes - A multi-technology global tier one supplier of both civil and defence airframes, including lightweight composite and metallic structures; electrical distribution systems and components.
In addition, there is a corporate cost centre which is also reported to the Board containing the Group's head office costs.
Reportable segment results include items directly attributable to a segment as well as those which can be allocated on a reasonable basis. Inter-segment pricing is determined on an arm's length basis, in a manner similar to transactions with third parties.
The Group's geographical segments are determined by the location of the Group's non-current assets and, for revenue, the location of external customers. Inter-segment sales are not material and have not been disclosed.
3. Segment information (continued)
The following tables present the results and certain asset and liability information regarding the Group's operating segments and corporate cost centre for the six month period ended 30 June 2026 and comparative periods.
a) Segment revenues
|
|
6 months ended 30 June £m |
6 months ended 30 June £m |
Year ended 31 December 2025 £m |
|
|
|
|
|
|
Engines |
896 |
781 |
1,632 |
|
Airframes |
977 |
939 |
1,957 |
|
|
|
|
|
|
Revenue |
1,873 |
1,720 |
3,589 |
|
|
|
|
|
b) Segment operating profit
|
6 months ended 30 June 2026 |
Engines £m |
Airframes £m |
Corporate £m |
Total £m |
|
|
|
|
|
|
|
Adjusted operating profit/(loss)
|
303 |
62 |
(18) |
347 |
|
Items not included in adjusted operating profit(1): |
|
|
|
|
|
Amortisation of intangible assets acquired in business combinations |
(62) |
(62) |
- |
(124) |
|
Gains/(losses) in derivatives and associated financial assets and liabilities |
5 |
- |
(61) |
(56) |
|
Garden Grove incident costs |
- |
(13) |
- |
(13) |
|
|
|
|
|
|
|
|
|
|
|
|
|
Operating profit/(loss) |
246 |
(13) |
(79) |
154 |
|
|
|
|
|
|
|
|
|
|
|
|
|
Finance costs |
|
|
|
(65) |
|
Finance income |
|
|
|
- |
|
|
|
|
|
|
|
|
|
|
|
|
|
Profit before tax |
|
|
|
89 |
|
Tax |
|
|
|
(14) |
|
|
|
|
|
|
|
|
|
|
|
|
|
Profit after tax for the period attributable to owners of the parent |
|
|
|
75 |
|
|
|
|
|
|
(1) Further details on adjusting items are shown in note 4.
|
6 months ended 30 June 2025 |
Engines £m |
Airframes £m |
Corporate £m |
Total £m |
|
|
|
|
|
|
|
Adjusted operating profit/(loss) |
261 |
63 |
(14) |
310 |
|
|
|
|
|
|
|
Items not included in adjusted operating profit(1): |
|
|
|
|
|
Amortisation of intangible assets acquired in business combinations |
(66) |
(61) |
- |
(127) |
|
Restructuring costs |
(2) |
(10) |
- |
(12) |
|
(Losses)/gains in derivatives and associated financial assets and liabilities |
(16) |
(4) |
287 |
267 |
|
Net changes in fair value items |
(1) |
4 |
- |
3 |
|
|
|
|
|
|
|
|
|
|
|
|
|
Operating profit/(loss) |
176 |
(8) |
273 |
441 |
|
|
|
|
|
|
|
|
|
|
|
|
|
Finance costs |
|
|
|
(62) |
|
Finance income |
|
|
|
- |
|
|
|
|
|
|
|
|
|
|
|
|
|
Profit before tax |
|
|
|
379 |
|
Tax |
|
|
|
(94) |
|
|
|
|
|
|
|
|
|
|
|
|
|
Profit after tax for the period attributable to owners of the parent |
|
|
|
285 |
|
|
|
|
|
|
(1) Further details on adjusting items are shown in note 4.
3. Segment information (continued)
b) Segment operating profit (continued)
|
Year ended 31 December 2025 |
Engines £m |
Airframes £m |
Corporate £m |
Total £m |
|
|
|
|
|
|
|
Adjusted operating profit/(loss) |
520 |
156 |
(29) |
647 |
|
|
|
|
|
|
|
Items not included in adjusted operating profit(1): |
|
|
|
|
|
Amortisation of intangible assets acquired in business combinations |
(128) |
(124) |
- |
(252) |
|
Restructuring costs |
(5) |
(29) |
- |
(34) |
|
Impairment of assets |
- |
(6) |
- |
(6) |
|
Melrose equity-settled compensation scheme charges |
- |
- |
(1) |
(1) |
|
(Losses)/gains in derivatives and associated financial assets and liabilities |
(20) |
(6) |
258 |
232 |
|
Acquisition and disposal related gains and losses |
- |
- |
11 |
11 |
|
Net changes in fair value items |
- |
3 |
- |
3 |
|
|
|
|
|
|
|
|
|
|
|
|
|
Operating profit/(loss) |
367 |
(6) |
239 |
600 |
|
|
|
|
|
|
|
|
|
|
|
|
|
Finance costs |
|
|
|
(132) |
|
Finance income |
|
|
|
- |
|
|
|
|
|
|
|
|
|
|
|
|
|
Profit before tax |
|
|
|
468 |
|
Tax |
|
|
|
(98) |
|
|
|
|
|
|
|
|
|
|
|
|
|
Profit after tax for the year attributable to owners of the parent |
|
|
|
370 |
|
|
|
|
|
|
(1) Further details on adjusting items are shown in note 4.
c) Segment total assets and liabilities
|
|
Total assets |
Total liabilities |
||||
|
|
30 June 2026 £m |
30 June 2025 £m |
31 December 2025 £m |
30 June 2026 £m |
30 June 2025 £m |
31 December 2025 £m |
|
Engines |
4,969 |
4,357 |
4,689 |
2,004 |
1,645 |
1,903 |
|
Airframes |
2,214 |
2,277 |
2,189 |
1,245 |
1,197 |
1,156 |
|
Corporate |
724 |
696 |
718 |
1,799 |
1,636 |
1,710 |
|
|
|
|
|
|
|
|
|
Total |
7,907 |
7,330 |
7,596 |
5,048 |
4,478 |
4,769 |
|
|
|
|
|
|
|
|
d) Segment capital expenditure and depreciation
|
|
Capital expenditure(1) |
Depreciation of owned assets(1) |
Depreciation of leased assets |
||||||
|
|
6 months ended 30 June 2026 £m |
6 months ended 30 June 2025 £m |
Year ended 31 December 2025 £m |
6 months ended 30 June 2026 £m |
6 months ended 30 June 2025 £m |
Year ended 31 December 2025 £m |
6 months ended 30 June 2026 £m |
6 months ended 30 June 2025 £m |
Year ended 31 December 2025 £m |
|
Engines |
29 |
28 |
56 |
20 |
21 |
41 |
5 |
5 |
11 |
|
Airframes |
19 |
17 |
39 |
33 |
31 |
66 |
11 |
9 |
19 |
|
Corporate |
- |
- |
- |
- |
- |
- |
1 |
1 |
1 |
|
|
|
|
|
|
|
|
|
|
|
|
Total |
48 |
45 |
95 |
53 |
52 |
107 |
17 |
15 |
31 |
|
|
|
|
|
|
|
|
|
|
|
(1) Includes computer software and development costs. Capital expenditure excludes lease additions.
3. Segment information (continued)
e) Geographical information
The Group operates in various geographical areas around the world. The parent company's country of domicile is the UK and the Group's revenues and non-current assets in the rest of Europe and North America are also considered to be material.
The Group's revenue from external customers and information about specific segment assets (non-current assets excluding deferred tax assets, non-current derivative financial assets, non-current other receivables and non-current retirement benefit surplus), by geographical location are detailed below:
|
|
Revenue(1) from external customers |
Segment assets |
||||
|
|
6 months ended £m |
6 months ended £m |
Year ended 31 December 2025 £m |
£m |
£m |
31 December 2025 £m |
|
UK |
259 |
275 |
574 |
625 |
724 |
676 |
|
Rest of Europe |
291 |
249 |
564 |
1,820 |
1,884 |
1,884 |
|
North America |
1,280 |
1,144 |
2,349 |
1,005 |
1,023 |
1,017 |
|
Other |
43 |
52 |
102 |
44 |
42 |
39 |
|
|
|
|
|
|
|
|
|
Total |
1,873 |
1,720 |
3,589 |
3,494 |
3,673 |
3,616 |
|
|
|
|
|
|
|
|
(1) Revenue is presented by destination.
4. Reconciliation of adjusted profit measures
As described in note 2, adjusted profit measures are an alternative performance measure used by the Board to monitor the performance of the Group.
a) Operating profit
|
|
Notes |
6 months ended 30 June 2026 £m |
6 months ended 30 June 2025 £m |
Year ended 31 December 2025 £m |
|
|
|
|
|
|
|
Operating profit |
|
154 |
441 |
600 |
|
|
|
|
|
|
|
Amortisation of intangible assets acquired in business combinations |
a |
124 |
127 |
252 |
|
Losses/(gains) in derivatives and associated financial assets and liabilities |
b |
56 |
(267) |
(232) |
|
Garden Grove incident costs |
c |
13 |
- |
- |
|
Restructuring costs |
d |
- |
12 |
34 |
|
Net changes in fair value items |
|
- |
(3) |
(3) |
|
Acquisition and disposal related gains and losses |
|
- |
- |
(11) |
|
Impairment of assets |
|
- |
- |
6 |
|
Melrose equity-settled compensation scheme charges |
|
- |
- |
1 |
|
|
|
|
|
|
|
Total adjustments to operating profit |
|
193 |
(131) |
47 |
|
|
|
|
|
|
|
|
|
|
|
|
|
Adjusted operating profit |
|
347 |
310 |
647 |
|
|
|
|
|
|
a. The amortisation charge on intangible assets acquired in business combinations totalled £124 million (2025: £127 million) which is excluded from adjusted results due to its non-trading nature and to enable comparison with companies that grow organically. However, where intangible assets are trading in nature, such as computer software and development costs, the amortisation is not excluded from adjusted results.
b. Movements in the fair value of derivative financial instruments (primarily forward foreign currency exchange contracts where hedge accounting is not applied) entered into to mitigate the potential volatility of future cash flows on long-term foreign currency customer and supplier contracts, including foreign exchange movements on the associated financial assets and liabilities, are shown as an adjusting item because of volatility and size. This totalled a charge of £56 million (2025: credit of £267 million) in the period.
c. Costs incurred associated with the Garden Grove incident totalled £13 million (2025: £nil) during the period, relating to initial response, recovery and advisory costs incurred. These are shown as adjusting items due to their size and non-trading nature. See note 13 for further details.
d. In the prior period, costs associated with significant restructuring projects totalled £12 million. These were shown as adjusting items due to their size and non-trading nature and included a charge of £10 million relating to the finalisation of significant restructuring projects across sites in the Engines and Airframes divisions in Europe and North America.
As at 30 June 2026, £8 million is included in restructuring provisions from projects commenced in prior periods.
Adjustments to operating profit identified above resulted in a net cash spend of £11 million (2025: £22 million) in the period, being cash costs associated with the Garden Grove incident of £5 million (2025: £nil), cash costs associated with restructuring programmes of £6 million (2025: £17 million) and £nil (2025: £5 million) of cash costs associated with legacy Melrose operations.
4. Reconciliation of adjusted profit measures (continued)
b) Profit before tax
|
|
|
6 months ended 30 June 2026 £m |
6 months ended 30 June 2025 £m |
Year ended |
|
|
|
|
|
|
|
Profit before tax |
|
89 |
379 |
468 |
|
|
|
|
|
|
|
|
|
|
|
|
|
Adjustments to operating profit as above |
|
193 |
(131) |
47 |
|
|
|
|
|
|
|
|
|
|
|
|
|
Adjusted profit before tax |
|
282 |
248 |
515 |
|
|
|
|
|
|
c) Profit after tax
|
|
|
6 months ended 30 June 2026 £m
|
6 months ended 30 June 2025 £m |
Year ended 31 December 2025 £m |
|
|
|
|
|
|
|
Profit after tax |
|
75 |
285 |
370 |
|
|
|
|
|
|
|
|
|
|
|
|
|
Adjustments to profit before tax as above |
|
193 |
(131) |
47 |
|
|
|
|
|
|
|
Tax effect of adjustments to profit before tax: |
|
|
|
|
|
Amortisation of intangible assets acquired in business combinations |
|
(29) |
(29) |
(59) |
|
Losses/gains in derivatives and associated financial assets and liabilities |
|
(15) |
71 |
62 |
|
Garden Grove incident costs |
|
(2) |
- |
- |
|
Restructuring costs |
|
- |
(3) |
(9) |
|
Net changes in fair value items |
|
- |
1 |
1 |
|
Impairment of assets |
|
- |
- |
(2) |
|
|
|
|
|
|
|
Tax effect of significant restructuring |
|
- |
- |
- |
|
|
|
|
|
|
|
Total adjustments to profit after tax |
|
147 |
(91) |
40 |
|
|
|
|
|
|
|
|
|
|
|
|
|
Adjusted profit after tax |
|
222 |
194 |
410 |
|
|
|
|
|
|
5. Tax
|
Analysis of the charge in the period: |
6 months ended 30 June 2026 £m |
6 months ended 30 June 2025 £m |
Year ended 2025 £m |
|
|
|
|
|
|
|
|
Current tax |
13 |
7 |
19 |
|
|
Deferred tax |
1 |
87 |
79 |
|
|
|
|
|
|
|
|
Total tax charge |
14 |
94 |
98 |
|
|
|
|
|
|
|
The effective tax rate in respect of adjusted profit before tax for the period is 21.3% (2025: 21.8%). Adjusted tax has been calculated by applying the expected tax rate to adjusted profit before tax of £282 million (2025: £248 million), giving an adjusted tax charge of £60 million (2025: £54 million).
The adjusted tax charge of £60 million (2025: £54 million) excludes a tax credit on adjusting items of £46 million (2025: charge of £40 million), details of which are shown in note 4.
Other comprehensive income and changes in equity
In addition to the amount included in the Income Statement, a charge of £8 million (2025: credit of £5 million) has been recognised directly in the Statement of Comprehensive Income. This represents a tax charge of £4 million (2025: £1 million) in respect of the remeasurement of retirement benefit obligations and a tax charge of £4 million (2025: credit of £6 million) in respect of movements on hedge relationships and translation differences. There is also a tax charge of £nil (2025: £3 million) recognised directly in the Statement of Changes in Equity in respect of deferred tax on equity-settled share-based payments.
6. Earnings per share
|
Earnings attributable to owners of the parent |
6 months ended 30 June 2026 £m |
6 months ended 30 June 2025 £m |
Year ended 2025 £m |
|
|
|
|
|
|
Profit after tax attributable to owners of the parent |
75 |
285 |
370 |
|
|
|
|
|
|
|
6 months ended 30 June 2026 |
6 months ended 30 June 2025 |
Year ended 2025 |
|
|
Number |
Number |
Number |
|
Weighted average number of ordinary shares for the purposes of basic earnings per share (million) |
1,250 |
1,279 |
1,272 |
|
Further shares for the purposes of diluted earnings per share (million) |
2 |
4 |
4 |
|
|
|
|
|
|
Weighted average number of ordinary shares for the purposes of diluted earnings per share (million) |
1,252 |
1,283 |
1,276 |
|
|
|
|
|
|
Earnings per share |
6 months ended 30 June 2026 pence |
6 months ended 30 June 2025 pence |
Year ended 2025 pence |
|
|
|
|
|
|
Basic earnings per share |
6.0 |
22.3 |
29.1 |
|
Diluted earnings per share |
6.0 |
22.2 |
29.0 |
|
|
|
|
|
|
Adjusted earnings |
6 months ended 30 June 2026 £m |
6 months ended 30 June 2025 £m |
Year ended 31 December 2025 £m |
|
|
|
|
|
|
Adjusted profit after tax |
222 |
194 |
410 |
|
|
|
|
|
|
|
|
|
|
|
Adjusted earnings per share |
6 months ended 30 June 2026 pence |
6 months ended 30 June 2025 pence |
Year ended 31 December 2025 pence |
|
|
|
|
|
|
Adjusted basic earnings per share |
17.8 |
15.2 |
32.2 |
|
Adjusted diluted earnings per share |
17.7 |
15.1 |
32.1 |
|
|
|
|
|
7. Dividends
|
|
6 months ended 30 June 2026 £m |
6 months ended 30 June 2025 £m |
Year ended 31 December 2025 £m |
|
Final dividend for the year ended 31 December 2024 of 4.0p |
- |
51 |
51 |
|
Interim dividend for the year ended 31 December 2025 of 2.4p |
- |
- |
31 |
|
Final dividend for the year ended 31 December 2025 of 4.8p |
60 |
- |
- |
|
Total dividends paid |
60 |
51 |
82 |
An interim dividend of 2.7 pence per ordinary share is declared by the Board, totalling £34 million.
On 1 April 2026, the Group commenced a share buyback programme. During the six month period ended 30 June 2026, 2,375,743 shares were purchased at an average price of 500 pence per share for a total cash consideration of £12 million, inclusive of costs of £nil. This follows on from the £250 million share buyback programme which commenced in October 2024 and completed in March 2026. Under that programme, 9,416,570 shares (2025: 14,180,323 shares) were purchased in the period at an average price of 595 pence (2025: 504 pence) per share for a total cash consideration of £56 million (2025: £71 million), inclusive of costs of £nil (2025: £nil). Cash payments of £2 million (2025: £nil) were also made in the period relating to share purchases that occurred in the prior year, resulting in total cash spend in the period of £70 million (2025: £71 million).
8. Provisions
|
|
Loss-making contracts £m |
Property related costs £m |
Environmental and litigation £m |
Warranty related costs £m |
Restructuring £m |
Other £m |
Total £m |
|||
|
|
|
|
|
|
|
|
|
|||
|
At 1 January 2026 |
31 |
30 |
43 |
19 |
14 |
10 |
147 |
|||
|
Utilised |
(4) |
- |
(10) |
- |
(6) |
(1) |
(21) |
|||
|
Charge to operating profit(1) |
- |
- |
7 |
1 |
- |
1 |
9 |
|||
|
Release to operating profit(1) |
- |
- |
(3) |
(2) |
- |
(1) |
(6) |
|||
|
Exchange adjustments |
- |
1 |
- |
- |
- |
- |
1 |
|||
|
|
|
|
|
|
|
|
|
|||
|
At 30 June 2026 |
27 |
31 |
37 |
18 |
8 |
9 |
130 |
|||
|
|
|
|
|
|
|
|
|
|||
|
|
|
|
|
|
|
|
|
|||
|
Current |
8 |
5 |
16 |
5 |
8 |
4 |
46 |
|||
|
Non-current |
19 |
26 |
21 |
13 |
- |
5 |
84 |
|||
|
|
|
|
|
|
|
|
|
|||
|
|
27 |
31 |
37 |
18 |
8 |
9 |
130 |
|||
|
|
|
|
|
|
|
|
|
|||
(1) All charges and releases are recognised in adjusted operating profit.
Provisions for loss-making contracts are considered to exist where the Group has a contract under which the unavoidable costs of meeting the obligations exceed the economic benefits expected to be received under it. This obligation has been discounted and will be utilised over the period of the respective contracts, which is up to 15 years.
The provision for property related costs represents dilapidation costs for ongoing leases and is expected to result in cash expenditure over the next 15 years.
Environmental provisions relate to the estimated remediation costs of pollution and groundwater contamination at certain sites and at 30 June 2026 amounted to £11 million (31 December 2025: £11 million). At 30 June 2026, litigation provisions amounting to £26 million (31 December 2025: £32 million) relate to estimated future costs and settlements in relation to legal claims and associated insurance obligations. Due to their nature, it is not possible to predict precisely when these provisions will be utilised.
Provisions for the expected cost of warranty obligations under local sale of goods legislation are recognised at the date of sale of the relevant products and are subsequently updated for changes in estimates as necessary. Warranty terms are, on average, between one and five years.
Restructuring provisions relate to committed costs in respect of restructuring programmes which are expected to result in cash spend within the next 12 months.
Other provisions include indemnities and the employer tax on equity-settled compensation schemes which are expected to result in cash expenditure over the next two years.
9. Financial instruments
The table below sets out the Group's accounting classification of each category of financial assets and liabilities and their carrying values as at 30 June 2026, 30 June 2025 and 31 December 2025:
|
|
Current £m |
Non-current £m |
Total £m |
|
30 June 2026 |
|
|
|
|
Financial assets |
|
|
|
|
Classified as amortised cost: |
|
|
|
|
Cash and cash equivalents |
200 |
- |
200 |
|
Net trade receivables |
471 |
- |
471 |
|
Classified as fair value: |
|
|
|
|
Investments |
- |
44 |
44 |
|
Derivative financial assets: |
|
|
|
|
Foreign currency forward contracts |
18 |
45 |
63 |
|
Interest rate derivatives |
- |
8 |
8 |
|
Commodity derivatives |
1 |
- |
1 |
|
Financial liabilities |
|
|
|
|
Classified as amortised cost: |
|
|
|
|
Interest-bearing loans and borrowings |
(51) |
(1,679) |
(1,730) |
|
Government refundable advances |
(6) |
(38) |
(44) |
|
Lease obligations |
(29) |
(294) |
(323) |
|
Other financial liabilities |
(1,014) |
(62) |
(1,076) |
|
Classified as fair value: |
|
|
|
|
Derivative financial liabilities: |
|
|
|
|
Foreign currency forward contracts |
(21) |
(18) |
(39) |
|
Embedded derivatives |
(1) |
- |
(1) |
|
30 June 2025 |
|
|
|
|
Financial assets |
|
|
|
|
Classified as amortised cost: |
|
|
|
|
Cash and cash equivalents |
124 |
- |
124 |
|
Net trade receivables |
393 |
- |
393 |
|
Classified as fair value: |
|
|
|
|
Investments |
- |
59 |
59 |
|
Derivative financial assets: |
|
|
|
|
Foreign currency forward contracts |
39 |
104 |
143 |
|
Interest rate derivatives |
1 |
- |
1 |
|
Embedded derivatives |
2 |
1 |
3 |
|
Financial liabilities |
|
|
|
|
Classified as amortised cost: |
|
|
|
|
Interest-bearing loans and borrowings |
(53) |
(1,475) |
(1,528) |
|
Government refundable advances |
(4) |
(42) |
(46) |
|
Lease obligations |
(33) |
(236) |
(269) |
|
Other financial liabilities |
(897) |
(50) |
(947) |
|
Classified as fair value: |
|
|
|
|
Derivative financial liabilities: |
|
|
|
|
Foreign currency forward contracts |
(17) |
(11) |
(28) |
|
Interest rate derivatives |
(1) |
(8) |
(9) |
|
Embedded derivatives |
(1) |
(1) |
(2) |
|
31 December 2025 |
|
|
|
|
Financial assets |
|
|
|
|
Classified as amortised cost: |
|
|
|
|
Cash and cash equivalents |
166 |
- |
166 |
|
Net trade receivables |
478 |
- |
478 |
|
Classified as fair value: |
|
|
|
|
Investments |
- |
56 |
56 |
|
Derivative financial assets: |
|
|
|
|
Foreign currency forward contracts |
27 |
84 |
111 |
|
Embedded derivatives |
2 |
- |
2 |
|
Financial liabilities |
|
|
|
|
Classified as amortised cost: |
|
|
|
|
Interest-bearing loans and borrowings |
(60) |
(1,513) |
(1,573) |
|
Government refundable advances |
(6) |
(40) |
(46) |
|
Lease obligations |
(31) |
(299) |
(330) |
|
Other financial liabilities |
(941) |
(55) |
(996) |
|
Classified as fair value: |
|
|
|
|
Derivative financial liabilities: |
|
|
|
|
Foreign currency forward contracts |
(22) |
(4) |
(26) |
|
Interest rate derivatives |
- |
(7) |
(7) |
|
Embedded derivatives |
(1) |
- |
(1) |
The fair value of the derivative financial instruments, other than embedded derivatives, is derived from inputs other than quoted prices that are observable for the asset or liability, either directly (i.e. as prices) or indirectly (i.e. derived from prices) and they are therefore categorised within level 2 of the fair value hierarchy set out in IFRS 13: Fair Value Measurement. The embedded derivatives are classified as level 3 fair value under the IFRS 13 fair value hierarchy. Certain of the investments are also measured as a level 3 fair value under the IFRS 13 fair value hierarchy. The Group's policy is to recognise transfers into and out of the different fair value hierarchy levels at the date of the event or change in circumstances that caused the transfer to occur. There have been no transfers between levels in the period.
10. Retirement benefit obligations
The Group sponsors defined benefit plans for qualifying employees of certain subsidiaries. The funded defined benefit plans are administered by separate funds that are legally separated from the Group. The Trustees of the funds are required by law to act in the interest of the fund and of all relevant stakeholders in the plans. The Trustees of the plans are responsible for the investment policy with regard to the assets of the fund.
The most significant defined benefit plan in the Group at 30 June 2026 was the GKN Group Pension Scheme (Number 1). The GKN Group Pension Scheme (Number 1) is a UK funded plan, closed to new members and closed to future accrual. The valuation of the plan is based on a full actuarial valuation as of 5 April 2025, updated to 30 June 2026 by independent actuaries.
Two other significant plans, the GKN Group Pension Scheme (Number 4) and the GKN US Consolidated Pension Plan, left the Group during 2025 following the completion of buy-out processes.
The cost of the Group's defined benefit plans is determined in accordance with IAS 19 (revised): Employee Benefits using the advice of independent professionally qualified actuaries on the basis of formal actuarial valuations and using the projected unit credit method. In line with normal practice, these valuations are undertaken triennially in the UK.
The amount recognised in the Balance Sheet in respect of defined benefit plans was as follows:
|
30 June 2026 |
|
|
UK plans(1) £m |
Other plans £m |
Total £m |
|
Plan assets |
|
|
564 |
- |
564 |
|
Plan liabilities |
|
|
(552) |
(23) |
(575) |
|
|
|
|
|
|
|
|
Net assets/(liabilities) |
|
|
12 |
(23) |
(11) |
|
|
|
|
|
|
|
|
|
|
|
|
|
|
|
Analysed as: |
|
|
|
|
|
|
Retirement benefit surplus |
|
|
|
|
18 |
|
Retirement benefit obligations |
|
|
|
|
(29) |
|
|
|
|
|
|
|
|
|
|
|
|
|
|
|
Net liabilities |
|
|
|
|
(11) |
|
|
|
|
|
|
|
|
|
|
|
|
|
|
|
30 June 2025 |
|
UK plans(1) £m |
Other plans £m |
Total £m |
|
Plan assets |
|
936 |
28 |
964 |
|
Plan liabilities |
|
(959) |
(57) |
(1,016) |
|
|
|
|
|
|
|
Net liabilities |
|
(23) |
(29) |
(52) |
|
|
|
|
|
|
|
|
|
|
|
|
|
Analysed as: |
|
|
|
|
|
Retirement benefit surplus |
|
|
|
- |
|
Retirement benefit obligations |
|
|
|
(52) |
|
|
|
|
|
|
|
|
|
|
|
|
|
Net liabilities |
|
|
|
(52) |
|
|
|
|
|
|
|
31 December 2025 |
|
|
UK plans(1) £m |
Other plans £m |
Total £m |
|
Plan assets |
|
|
579 |
- |
579 |
|
Plan liabilities |
|
|
(583) |
(23) |
(606) |
|
|
|
|
|
|
|
|
Net liabilities |
|
|
(4) |
(23) |
(27) |
|
|
|
|
|
|
|
|
|
|
|
|
|
|
|
Analysed as: |
|
|
|
|
|
|
Retirement benefit surplus |
|
|
|
|
2 |
|
Retirement benefit obligations |
|
|
|
|
(29) |
|
|
|
|
|
|
|
|
|
|
|
|
|
|
|
Net liabilities |
|
|
|
|
(27) |
|
|
|
|
|
|
|
|
|
|
|
|
|
|
(1) Includes a liability in respect of post-employment medical plans of £6 million at 30 June 2026 (30 June 2025: £6 million, 31 December 2025: £6 million).
10. Retirement benefit obligations (continued)
Valuations of material plans have been updated at 30 June 2026 by independent actuaries to reflect updated assumptions regarding discount rates, inflation rates and asset values. The major assumptions were as follows:
|
|
Rate of increase of pensions in payment % p.a. |
Discount rate % |
Price inflation (RPI/CPI) % |
|
|
|||
|
30 June 2026 |
|
|
|
|
GKN Group Pension Scheme (Number 1) |
2.6 |
6.1 |
2.9/2.5 |
|
|
|
|
|
|
30 June 2025 |
|
|
|
|
GKN Group Pension Schemes (Numbers 1 and 4) |
2.5 |
5.6 |
2.8/2.4 |
|
GKN US plans |
n/a |
5.3 |
n/a |
|
|
|
|
|
|
31 December 2025 |
|
|
|
|
GKN Group Pension Scheme (Number 1) |
2.5 |
5.6 |
2.8/2.4 |
In addition, the defined benefit plan assets and liabilities have been updated to reflect the contributions made to the defined benefit plans and the benefits earned during the period to 30 June 2026.
11. Notes to the Cash Flow Statement
|
|
6 months ended 30 June £m |
6 months ended 30 June £m |
Year ended 31 December £m |
|
|
|
|
|
|
Reconciliation of operating profit to net cash from operating activities |
|
|
|
|
Operating profit |
154 |
441 |
600 |
|
Adjusting items (note 4)(1) |
193 |
(131) |
47 |
|
Adjusted operating profit |
347 |
310 |
647 |
|
|
|
|
|
|
Adjustments for: |
|
|
|
|
Depreciation of property, plant and equipment |
53 |
51 |
104 |
|
Amortisation of computer software and development costs |
17 |
16 |
34 |
|
Restructuring costs paid and movements in provisions |
(13) |
(22) |
(53) |
|
Defined benefit pension contributions paid |
(2) |
(2) |
(22) |
|
Change in inventories |
(89) |
(85) |
(32) |
|
Change in receivables(2) |
(272) |
(200) |
(347) |
|
Change in payables |
113 |
11 |
20 |
|
Tax paid |
(9) |
(11) |
(12) |
|
Interest paid on loans and borrowings |
(55) |
(48) |
(103) |
|
Interest paid on lease obligations |
(7) |
(5) |
(12) |
|
Divisional management incentive scheme related payments |
- |
(7) |
(7) |
|
Melrose equity-settled compensation scheme related payments |
- |
- |
(3) |
|
|
|
|
|
|
Net cash from operating activities |
83 |
8 |
214 |
|
|
|
|
|
(1) The cash impact of adjusting items is detailed in note 4.
(2) The change in receivables includes increases to unbilled work done contract assets of £206 million (2025: £182 million).
|
Reconciliation of cash and cash equivalents, net of bank overdrafts |
30 June £m |
30 June £m |
31 December £m |
|
Cash and cash equivalents per Balance Sheet |
200 |
124 |
166 |
|
Bank overdrafts included within current interest-bearing loans and borrowings |
(1) |
(3) |
(12) |
|
|
|
|
|
|
Cash and cash equivalents, net of bank overdrafts per Statement of Cash Flows |
199 |
121 |
154 |
|
|
|
|
|
11. Notes to the Cash Flow Statement (continued)
Net debt reconciliation
Net debt consists of interest-bearing loans and borrowings and cash and cash equivalents.
Net debt is considered to be an alternative performance measure as it is not defined in IFRS. The most directly comparable IFRS measure is the aggregate of interest-bearing loans and borrowings (current and non-current) and cash and cash equivalents.
A reconciliation from the most directly comparable IFRS measure to net debt, used as a basis for banking covenant calculations, is given below:
|
|
30 June £m |
30 June £m |
31 December £m |
|
|
|
|
|
|
Interest-bearing loans and borrowings - due within one year |
(51) |
(53) |
(60) |
|
Interest-bearing loans and borrowings - due after one year |
(1,679) |
(1,475) |
(1,513) |
|
External debt |
(1,730) |
(1,528) |
(1,573) |
|
Less: |
|
|
|
|
Cash and cash equivalents |
200 |
124 |
166 |
|
|
|
|
|
|
Net debt |
(1,530) |
(1,404) |
(1,407) |
|
|
|
|
|
The table below shows the key components of the movement in net debt:
|
|
At 1 January 2026 |
Cash flow |
Acquisitions and disposals(1) |
Other non-cash movements |
Effect of foreign exchange |
At 30 June 2026 |
|
|
£m |
£m |
£m |
£m |
£m |
£m |
|
|
|
|
|
|
|
|
|
External debt (excluding bank overdrafts and unamortised finance costs) |
(1,563) |
(150) |
- |
- |
(19) |
(1,732) |
|
Unamortised finance costs |
2 |
3 |
- |
(2) |
- |
3 |
|
External debt (excluding bank overdrafts) |
(1,561) |
(147) |
- |
(2) |
(19) |
(1,729) |
|
Cash and cash equivalents, net of bank overdrafts |
154 |
30 |
13 |
- |
2 |
199 |
|
|
|
|
|
|
|
|
|
Net debt |
(1,407) |
(117) |
13 |
(2) |
(17) |
(1,530) |
|
|
|
|
|
|
|
|
(1) Relates to a capital return from investments of £13 million.
12. Lease obligations
Amounts payable under lease obligations:
|
Minimum lease payments |
30 June £m |
30 June £m |
31 December £m |
|
|
|
|
|
|
Amounts payable: |
|
|
|
|
Within one year |
43 |
39 |
43 |
|
After one year but within five years |
142 |
128 |
142 |
|
Over five years |
255 |
183 |
265 |
|
Less: future finance charges |
(117) |
(81) |
(120) |
|
|
|
|
|
|
Present value of lease obligations |
323 |
269 |
330 |
|
|
|
|
|
|
Analysed as: |
|
|
|
|
Amounts due for settlement within one year |
29 |
33 |
31 |
|
Amounts due for settlement after one year |
294 |
236 |
299 |
|
|
|
|
|
|
Present value of lease obligations |
323 |
269 |
330 |
|
|
|
|
|
It is the Group's policy to lease certain of its property, plant and equipment. The average lease term is 13 years. Interest rates are fixed at the contract date.
13. Contingent liabilities
On 21 May 2026, at an Airframes site in Garden Grove, California, site personnel detected an unexpected increase in temperature of a chemical storage tank used to house methyl methacrylate ("MMA"), a critical component in the production of high-strength aerospace acrylic. The Group immediately engaged with emergency response personnel including the Orange County Fire Authority and evacuation orders were issued by the relevant authorities, which were lifted four days later with the authorities reporting that there was no risk to the public.
The Group is cooperating with regulators (local, state and federal) and lawyers across multiple regulatory inquiries and investigations including more than thirty civil litigation actions. These cases are complex and at this point the outcomes are uncertain. As a consequence the Group is unable to reliably assess the likely outcome or quantify the financial impact as at the date of these financial statements, and as such no provision has been made.
|
Glossary |
Alternative Performance Measures ("APMs")
In accordance with the Guidelines on APMs issued by the European Securities and Markets Authority ("ESMA"), additional information is provided on the APMs used by the Group below.
In the reporting of financial information, the Group uses certain measures that are not required under IFRS. These additional measures (commonly referred to as APMs) provide additional information on the performance of the Group and trends to stakeholders. These measures are consistent with those used internally, and are considered important to understanding the financial performance and financial health of the Group. APMs are considered to be an important measure to monitor how the Group is performing because this provides a meaningful comparison of how the Group is managed and measured on a day-to-day basis and achieves consistency and comparability between reporting periods.
These APMs may not be directly comparable with similarly titled measures reported by other companies and they are not intended to be a substitute for, or superior to, IFRS measures. All results arise from continuing operations.
|
APM |
Closest equivalent statutory measure |
Reconciling items to statutory measure |
Definition and purpose |
|||||
|
Income Statement Measures |
||||||||
|
Adjusting items |
None |
Adjusting items (note 4) |
Those items which the Group excludes from its adjusted profit metrics in order to present a further measure of the Group's performance.
These include items which are significant in size or volatility, or by nature are non-trading or non-recurring or the net change in fair value items booked on an acquisition.
This provides a meaningful comparison of how the business is managed and measured on a day-to-day basis and provides consistency and comparability between reporting periods. |
|
||||
|
Adjusted operating profit |
Operating profit(1) |
Adjusting items (note 4) |
The Group uses adjusted profit measures to provide a useful and more comparable measure of the ongoing performance of the Group. Adjusted measures are reconciled to statutory measures by removing adjusting items, the nature of which are disclosed above and further detailed in note 4. |
|
||||
|
Adjusted operating profit |
6 months ended 30 June 2026 £m |
6 months ended 30 June 2025 £m |
Year ended 31 December 2025 £m |
|
||||
|
|
|
|
|
|
||||
|
Operating profit |
154 |
441 |
600 |
|
||||
|
Adjusting items to operating profit (note 4) |
193 |
(131) |
47 |
|
||||
|
|
|
|
|
|
||||
|
Adjusted operating profit |
347 |
310 |
647 |
|
||||
|
|
|
|
|
|
||||
|
|
|
|
|
|
||||
|
Adjusted operating margin |
Operating margin(2) |
Adjusting items (note 4) |
Adjusted operating margin represents Adjusted operating profit as a percentage of revenue. The Group uses adjusted profit measures to provide a useful and more comparable measure of the ongoing performance of the Group. |
|
||||
|
APM |
Closest equivalent statutory measure |
Reconciling items to statutory measure |
Definition and purpose |
|||
|
Adjusted profit before tax |
Profit before tax |
Adjusting items (note 4) |
Profit before the impact of adjusting items and tax. As discussed above, adjusted profit measures are used to provide a useful and more comparable measure of the ongoing performance of the Group. Adjusted measures are reconciled to statutory measures by removing adjusting items, the nature of which are disclosed above and further detailed in note 4. |
|||
|
Adjusted profit before tax |
6 months ended 30 June 2026 £m |
6 months ended 30 June 2025 £m |
Year ended 31 December 2025 £m |
|
||
|
|
|
|
|
|
||
|
Profit before tax |
89 |
379 |
468 |
|
||
|
Adjusting items to profit before tax (note 4) |
193 |
(131) |
47 |
|
||
|
|
|
|
|
|
||
|
Adjusted profit before tax |
282 |
248 |
515 |
|
||
|
|
|
|
|
|
||
|
Adjusted profit after tax |
Profit after tax |
Adjusting items (note 4) |
Profit after tax but before the impact of adjusting items. As discussed above, adjusted profit measures are used to provide a useful and more comparable measure of the ongoing performance of the Group. Adjusted measures are reconciled to statutory measures by removing adjusting items, the nature of which are disclosed above and further detailed in note 4. |
|||
|
Adjusted profit after tax |
6 months ended 30 June 2026 £m |
6 months ended 30 June 2025 £m |
Year ended 31 December 2025 £m |
|
||
|
|
|
|
|
|
||
|
Profit after tax |
75 |
285 |
370 |
|
||
|
Adjusting items to profit after tax (note 4) |
147 |
(91) |
40 |
|
||
|
|
|
|
|
|
||
|
Adjusted profit after tax |
222 |
194 |
410 |
|
||
|
|
|
|
|
|
||
|
Constant currency |
Income Statement, which is reported using actual average foreign exchange rates |
Constant currency foreign exchange rates |
The Group uses Sterling based constant currency models to measure performance. These are calculated by applying 2026 six month average exchange rates to local currency reported results for the current and prior periods. This gives a Sterling denominated Income Statement which excludes any variances attributable to foreign exchange rate movements. |
||||||||||||||||||||||||||||||||||||||||
|
Adjusted EBITDA and Adjusted EBITDA for banking covenant leverage purposes
|
Operating profit(1) |
Adjusting items (note 4), depreciation of property, plant and equipment and amortisation of computer software and development costs. Adjusted EBITDA for banking covenant leverage purposes also includes an imputed lease charge and other adjustments required for banking covenant leverage purposes(3) |
Adjusted operating profit for 12 months prior to the reporting date, before depreciation of property, plant and equipment and before the amortisation of computer software and development costs.
Adjusted EBITDA and Adjusted EBITDA for banking covenant leverage purposes are measures used by external stakeholders to measure performance.
|
|
APM |
Closest equivalent statutory measure |
Reconciling items to statutory measure |
Definition and purpose |
||||||||||||||||||||||||||||||||||||||||||||||||||||
|
Adjusted tax rate |
Effective tax rate |
Adjusting items, adjusting tax items and the tax impact of adjusting items (note 4 and note 5) |
The income tax charge for the Group excluding adjusting tax items, and the tax impact of adjusting items, divided by Adjusted profit before tax.
This measure is a useful indicator of the ongoing tax rate for the Group.
|
|
Adjusted basic earnings per share |
Basic earnings per share |
Adjusting items (note 4 and note 6) |
Profit after tax attributable to owners of the parent before the impact of adjusting items, divided by the weighted average number of ordinary shares in issue during the financial period.
The Board considers this to be a key measure of performance when all businesses are held for the complete reporting period. |
||||||||||||||||||||||||||||||||||||||||||||||||||||||||||||
|
Adjusted diluted earnings per share |
Diluted earnings per share |
Adjusting items (note 4 and note 6) |
Profit after tax attributable to owners of the parent before the impact of adjusting items, divided by the weighted average number of ordinary shares in issue during the financial period adjusted for the effects of any potentially dilutive options.
The Board considers this to be a key measure of performance when all businesses are held for the complete reporting period. |
||||||||||||||||||||||||||||||||||||||||||||||||||||||||||||
|
Interest cover |
None |
Not applicable |
Adjusted EBITDA calculated for banking covenant leverage purposes (including Adjusted EBITDA from businesses disposed) as a multiple of net interest payable on bank loans and overdrafts and factoring facilities.
This measure is used for bank covenant testing.
|
|
APM |
Closest equivalent statutory measure |
Reconciling items to statutory measure |
Definition and purpose |
||||||||||||||||||||||||||||||||||||||||
|
Balance Sheet Measures |
|||||||||||||||||||||||||||||||||||||||||||
|
Working capital |
Inventories, trade and other receivables less trade and other payables |
Not applicable |
Working capital comprises inventories, current trade and other receivables, non-current other receivables, current trade and other payables and non-current other payables.
This measure provides additional information in respect of working capital management. |
||||||||||||||||||||||||||||||||||||||||
|
Net debt |
Cash and cash equivalents less interest-bearing loans and borrowings |
Reconciliation of net debt (note 11) |
Net debt comprises cash and cash equivalents and interest-bearing loans and borrowings.
Net debt is one measure that could be used to indicate the strength of the Group's Balance Sheet position and is a useful measure of the indebtedness of the Group. |
||||||||||||||||||||||||||||||||||||||||
|
Bank covenant definition of net debt at average rates and banking covenant leverage |
Cash and cash equivalents less interest-bearing loans and borrowings |
Impact of foreign exchange |
Net debt (as above) is presented in the Balance Sheet translated at period end exchange rates.
For bank covenant testing purposes net debt is converted using average exchange rates for the previous 12 months.
Banking covenant leverage is calculated as the bank covenant definition of net debt divided by Adjusted EBITDA for banking covenant leverage purposes. This measure is used for bank covenant testing.
|
||||||||||||||||||||||||||||||||||||||||
|
Leverage |
None |
None |
Leverage is calculated as the bank covenant definition of net debt at average rates (as above) divided by Adjusted EBITDA.
This measure is used by external stakeholders to assess the financial stability of the Group.
|
|
APM |
Closest equivalent statutory measure |
Reconciling items to statutory measure |
Definition and purpose |
||||||||||||||||||||||||||||||||||||||||||||||||||||||||||||||||||||||||||||||||||||||||||||||||||||
|
Cash Flow Measures |
|||||||||||||||||||||||||||||||||||||||||||||||||||||||||||||||||||||||||||||||||||||||||||||||||||||||
|
Free cash flow |
Net increase in cash and cash equivalents (net of bank overdrafts) |
Acquisition and disposal related cash flows, dividends paid to owners of the parent, transactions in own shares, payments made in respect of equity-settled compensation schemes and movements on borrowing facilities |
Free cash flow represents cash generated after all trading costs including restructuring, pension contributions, tax and interest payments.
This measure provides additional useful information in respect of cash generation and is consistent with how business performance is measured internally.
|
||||||||||||||||||||||||||||||||||||||||||||||||||||||||||||||||||||||||||||||||||||||||||||||||||||
|
APM |
Closest equivalent statutory measure |
Reconciling items to statutory measure |
Definition and purpose |
||||||||||||||||||||||||||||||||
|
Free cash flow pre-factoring
|
Net increase in cash and cash equivalents (net of bank overdrafts) |
Free cash flow, as defined above, adjusted for the net cash flow from factoring facilities |
Free cash flow pre-factoring represents free cash flow adjusted for the net cash flows from factoring facilities in the period.
This measure provides additional useful information in respect of cash generation and is consistent with how business performance is measured internally.
|
||||||||||||||||||||||||||||||||
|
Capital expenditure (capex) |
None |
Not applicable |
Calculated as the purchase of owned property, plant and equipment and computer software and expenditure on capitalised development costs during the period, excluding any assets acquired as part of a business combination. |
||||||||||||||||||||||||||||||||
|
Capital expenditure to depreciation ratio |
None |
Not applicable |
Capital expenditure divided by depreciation of owned property, plant and equipment and amortisation of computer software and development costs. |
||||||||||||||||||||||||||||||||
|
Dividend per share |
Dividend per share |
Not applicable |
Amounts payable by way of dividends in terms of pence per share. |
(1) Operating profit is not defined within IFRS but is a widely accepted profit measure being profit before finance costs, finance income and tax.
(2) Operating margin is not defined within IFRS but is a widely accepted profit measure being derived from operating profit(1) divided by revenue.
(3) Included within other adjustments required for banking covenant leverage purposes in all periods presented are the add-back of non-cash IFRS 2 share-based payment charges of £3 million (2025: £nil) and unrealised savings from spend incurred in the period on restructuring projects of £nil (2025: £1 million).
(4) Net cash flows from factoring facilities represent the cash outflow/(inflow) recorded within net cash from operating activities relating to factored trade receivables in the period.
RNS may use your IP address to confirm compliance with the terms and conditions, to analyse how you engage with the information contained in this communication, and to share such analysis on an anonymised basis with others as part of our commercial services. For further information about how RNS and the London Stock Exchange use the personal data you provide us, please see our Privacy Policy.

Latest directors dealings
- 1 hour ago SSP Group
- 1 hour ago Schroder Real Estate Investment Trust Ltd
- 1 hour ago Metlen Energy & Metals PLC
- 2 hours ago Hays
- 2 hours ago Vistry Group