
Molly Gold Project: Geophysics Programme Completed
Summary by AI BETAClose X

Jangada Mines plc / EPIC: JAN.L / Market: AIM / Sector: Mining
11 November 2026
Jangada Mines plc ('Jangada' or 'the Company')
Molly Gold Project: Geophysics Programme Completed
'Multiple extensive structures identified and nine priority geophysical targets defined'
Jangada Mines plc (AIM: JAN), a Brazil-focused natural resources company, is pleased to announce the completion and interpretation of the geophysical survey programme at its Molly Gold Project ("Molly" or the "Project") in the Tapajós Province, northern Brazil. The results have identified 15 geophysical targets, nine of which are ranked as high priority, and demonstrated a strong correlation between newly identified structures and known gold mineralisation, thus reinforcing the Company’s geological model.
HIGHLIGHTS
• Geophysics programme completed: 368.2 line-km MagDrone survey across 3,320 ha, and an 11.8 line-km ground IP survey across Vivi and Molly 2 targets.
• 15 Geophysical targets generated, nine ranked as priority: priority targets at South Boomerang (4), Vivi (1), Esmeril (1), Eastpot (1) and West Boomerang (2) a new target area. Gold-bearing veins, historical artisanal workings or recorded gold occurrences are in each of these five areas.
• Extensive structural framework mapped: a network of E--W and NE-SW structures across the tenement, with secondary NW-SE trends, consistent with the regional controls on gold mineralisation in the Tapajós Province identified, as well as a prominent ENE-WSW structural corridor running along the southern part of the Project.
• Geophysics matches known gold mineralisation: the drill-confirmed Molly 1 deposit (JORC (2012) Inferred Resource of 130,000 oz Au at 2 g/t) and the Molly 2 target where surface samples previously returned up to 370.41 g/t Au, sit on this southern corridor, while the newly identified Vivi vein swarm, where surface samples returned up to 306.23 g/t Au, coincides with a geophysical target. The same geophysical signature can be used to identify additional mineralisation on the wider Project.
• IP survey identifies the high grade Vivi veins below surface: coincident chargeability and resistivity anomalies, consistent with sulphide-bearing quartz veins, follow the projected trace of the mapped veins at depth and indicate that the system continues beyond the exposed outcrops.
• Drilling on-going: A fully funded 11-hole diamond drilling programme, totalling approximately 1,400 m, comprising seven holes (900 m) at Vivi, three (300 m) at Molly 2 and one (200 m) at South Boomerang is on-going. Three drill holes have been completed to date, all intersecting visible mineralisation, with samples currently undergoing assay testing.
Jangada Chief Executive, Paulo Misk, said: “These are excellent results that reinforce our geological model and highlight the significant exploration potential of the 6,656-hectare Molly Gold Project. We have identified 15 geophysical targets, nine of which are high priority, providing a clear framework for exploration.
“The surveys confirm structural links to known gold mineralisation across the seven existing exploration target areas in the south of the Project, while identifying new prospective areas, including West Boomerang. Importantly, the geophysical signatures correlate with known mineralisation at Molly 1, Molly 2 and Vivi, where previous surface samples returned grades of up to 370.41 g/t Au and 306.23 g/t Au, respectively, giving us confidence in applying this approach across the wider Project, that is the majority of the licence area.
“These results mark an important step towards unlocking Molly’s wider potential, and we look forward to reporting assay results from the ongoing drilling programme.”
FULL DETAILS AND RESULTS
THE GEOPHYSICS PROGRAMME
The geophysics programme has been successfully completed and interpreted, comprising a 368.2 line-km MagDrone survey covering 3,320 hectares at 100 m line spacing and an 11.8 line-km ground IP survey across 14 lines at Vivi and Molly 2.
The below Table 1 summarises the surveys and Figure 1 shows the location of the exploration targets referred to in this announcement.
|
|
MagDrone magnetic survey |
Ground Induced Polarisation survey |
|
Area covered |
3,320 ha across the southern and western Project area, including Boomerang, Molly 1, Molly 2 and Vivi |
Vivi and Molly 2 targets |
|
Survey lines |
97 north-south lines at 100 m spacing; east-west tie lines at 1,000 m spacing |
14 north-south lines at 100 m spacing |
|
Total survey length |
368.2 line-km |
11.8 line-km |
|
Survey period |
1 July - 10 August 2026 |
14 July - 7 November 2026 |
|
Configuration |
Sensor GEM GSMP-25U; nominal flight height 50 m above ground |
Array dipole-dipole; dipole spacing 10 m; depth of investigation approx. 100 - 120 m |
|
Measures |
Magnetic field intensity and derived products (vertical derivative, analytic signal, tilt derivative) |
Chargeability (milliseconds) and resistivity (ohm-metres) |
|
Purpose |
Map faults, shear zones and alteration; generate and rank targets across the Project |
Image the sulphide and alteration envelope of the veins below surface; position drill holes |
Table 1 - Summary of the Molly geophysics programme
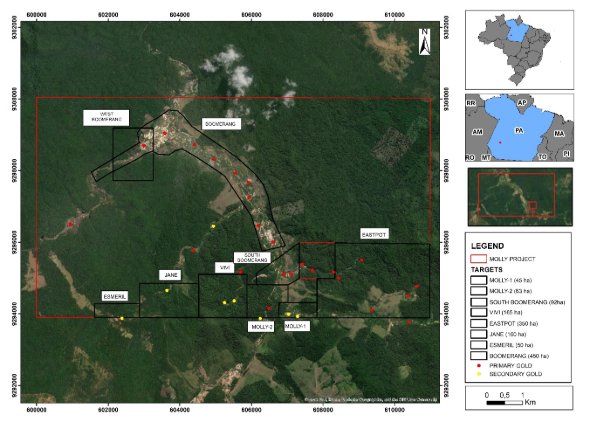
Figure 1 - Molly Gold Project licence area (red outline) showing the exploration target areas referred to in this announcement, and historical primary (yellow) and secondary (red) gold occurrences.
|
Reading the geophysical images in this announcement • Colours show the strength of the measured property. Warm colours (red, magenta, purple) indicate high values and cool colours (blue) indicate low values. Each image carries its own colour scale. • Plan maps (Figures 1, 2, 4 and 5) show the Project from above, with north at the top. Grid numbers along the edges are map coordinates in metres. • IP sections (Figures 3, 6, 7 and 8) are vertical slices through the ground along each survey line, as if cut with a knife. The top edge is the ground surface and depth increases downward. • What to look for: places where high chargeability (possible sulphides) and high resistivity (possible quartz veins) coincide with a mapped vein or a magnetic structure are the strongest geophysical targets. |
MAGDRONE SURVEY: MAPPING THE STRUCTURAL FRAMEWORK
The interpretation of the MagDrone survey successfully identified multiple structures including:
• a network of predominantly E-W and NE-SW faults and shear zones, with secondary NW-SE trends, consistent with the regional structural controls on gold deposits across the Tapajós Province;
• a prominent ENE-WSW structural corridor along the southern part of the Project, marked by strong, linear magnetic contrasts within the Creporizão Intrusive Suite;
• within this corridor, a sigmoidal (S-shaped) magnetic feature that is interpreted as a shear zone, a type of structure that commonly focuses the flow of gold-bearing fluids; and
• magnetic sources that 3D modelling ("inversion") of the data indicates extend to depth, with their upper surfaces mostly between 50 m and 200 m below surface.
Using these results, 15 geophysical targets were generated where favourable magnetic patterns coincide with structures that could have acted as pathways for hydrothermal fluids. Nine of these were ranked as priority targets (yellow ellipses in Figure 2) on the strength of the combined geological, structural and magnetic evidence.
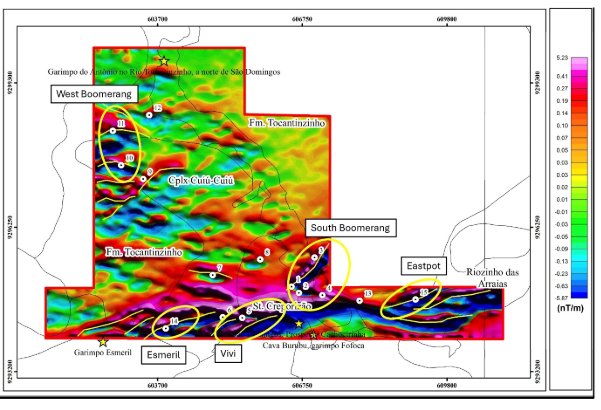
Figure 2 - MagDrone survey: processed magnetic image with the 15 geophysical targets (numbered white points), the nine priority targets (yellow ellipses) and interpreted structures (yellow lines). Fm. = Formation; Cplx = Complex; St. = Suite.
TESTING THE GEOPHYSICS AGAINST KNOWN MINERALISATION
Before using the geophysics to generate new exploration targets, the Company compared the results with areas where gold mineralisation has already been confirmed by drilling or surface sampling. If the known mineralisation lies on structures that the geophysics detects, the same signature can be used with greater confidence to find mineralisation elsewhere.
The strong correlation between geophysical data and known gold mineralisation validates the Company’s exploration model and increases confidence in using magnetic and IP surveys to identify and prioritise new targets for further exploration and drilling.
The results are as follows:
• Molly 1 and Molly 2 (drill-confirmed). Both lie on the southern ENE-WSW corridor. Phase 1 drilling, announced on 17 August 2026, confirmed a structurally controlled system at both targets, and existing drilling indicates that the higher gold grades occur near intersections and branches of structures. The magnetic data show such intersections along the corridor. At Molly 2, the IP survey shows elevated chargeability coinciding with the interpreted structures and magnetic contrasts around the mineralised zone.
• Vivi (surface-confirmed). Priority target 5 coincides with the Vivi vein swarm, where geological mapping identified a cluster of at least seven mineralised quartz veins over approximately 1 km², and grab samples returned up to 306.23 g/t Au, as announced on 17 August and 3 November 2026. Field mapping at Vivi measured the orientation of the veins and confirmed that they follow the structures interpreted from the magnetic data, in a pattern consistent with a Riedel shear system.
• Esmeril. Priority target 14 coincides with the Esmeril area, where grab samples from quartz veins returned up to 26.56 g/t Au, as announced on 3 November 2026.
This agreement between the IP and magnetic data, and the known mineralisation supports the use of the geophysics to direct the next stages of exploration. Grab samples are selective by nature; the grades quoted are not representative of the average grade of the veins and confirm only that gold is present.
IP SURVEY: LOOKING BELOW SURFACE AT VIVI AND MOLLY 2
The IP survey was run on north-south lines across the Vivi target and eastward towards Molly 2, across the WNW-ESE (N290) trend of the Vivi veins.
The main results are:
• zones of high chargeability, consistent with sulphide mineralisation, that line up from section to section along the projected trace of the mapped Vivi veins;
• high-resistivity zones, consistent with quartz veining and silicification, that coincide with several of the chargeability anomalies; and
• anomalies that continue below the depth of the exposed veins and along strike beyond the mapped outcrops, indicating that the vein system extends further than can be seen at surface.
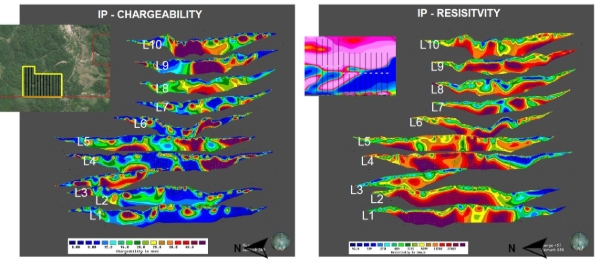
Figure 3 - IP survey at Vivi: chargeability (left, milliseconds) and resistivity (right, ohm-metres) sections for survey lines L1 to L10. Inset (left) shows the survey grid location. The Figure shows the chargeability and resistivity sections for lines L1 to L10 across Vivi, stacked from south to north so that anomalies can be followed from one line to the next.
In essence, the IP survey results support the presence of a potentially extensive mineralised vein system at Vivi, with coincident chargeability and resistivity anomalies suggesting that mineralisation may extend both at depth and along strike beyond the mapped surface exposures.
FROM GEOPHYSICS TO DRILL HOLES
The Company combined the MagDrone, IP, geological mapping and sampling data in a single geographic information system ("GIS") model. Each dataset answers a different question:
• MagDrone + mapping: do the mineralised veins follow the magnetic structures? At Vivi, they do.
• Mapping + IP: do the IP anomalies coincide with the mapped veins? Where they do, the anomaly is more likely to reflect mineralisation than a barren rock unit.
• MagDrone + IP: how far, and at what angle, do the structures continue below surface?
The resulting model sets the location, direction, angle and depth of each drill hole. Holes were drilled on sections perpendicular to the vein trend, angled to cross the veins as close to perpendicular as possible, and positioned where a mapped vein, a magnetic structure and an IP anomaly coincide. Selected holes will also calibrate the geophysics by comparing the rocks intersected with the IP and magnetic responses, which sharpen the interpretation of the targets elsewhere on the Project.
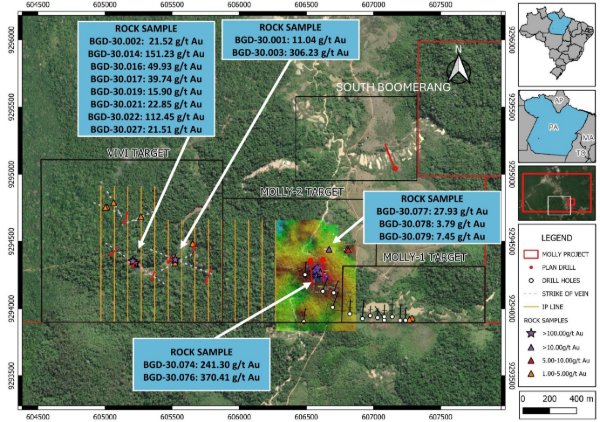
The drill programme comprises 11 diamond drill holes for approximately 1,400 m: seven holes (900 m) at Vivi, three holes (300 m) at Molly 2 and one hole (200 m) at South Boomerang. Figure 4 shows the Vivi, Molly 2 and South Boomerang drill plan in relation to the IP survey lines and the surface sample results, and Figure 5 shows the Vivi holes in detail.
Figure 4 - Phase 3 drill plan at Vivi, Molly 2 and South Boomerang, showing IP survey lines (orange), mapped vein trends (white dashed), planned holes (red), existing Molly 1 and Molly 2 drill holes (white circles) and previously announced high grade grab sample results.
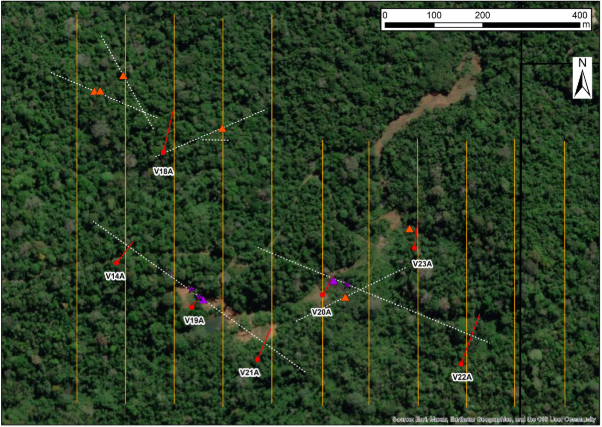
Figure 5 - Vivi target: drill holes V01A to V07A (red), IP survey lines (orange), mapped vein trends (white dashed) and grab sample locations (stars >100 g/t Au; purple triangles 10-100 g/t Au; orange triangles 1-5 g/t Au).
Table 2 sets out the basis for each Vivi hole. Three examples, shown in Figures 6 to 8, illustrate how the IP sections guided the positioning. In each figure the plan view on the left shows the hole location, and the sections on the right show the resistivity (top) and chargeability (bottom) along the IP line, with the planned hole trace in red.
|
Hole |
Hole ID |
Basis for position |
Status |
|
V01A |
DDPM26-14A |
Resistivity and chargeability anomaly on the projected trace of the Vivi 1 vein, approximately 175 m west of high-grade surface samples; tests the western extension of the structure. |
Completed |
|
V02A |
DDPM26-18A |
Strong coincident resistivity and chargeability anomalies at the junction of three mapped vein structures (surface samples 1.08-3.62 g/t Au). |
Completed |
|
V03A |
DDPM26-19A |
Beneath the exposed Vivi 1 vein, where surface grab samples returned 151.23 g/t Au and 112.45 g/t Au. |
Completed |
|
V04A |
DDPM26-20A |
Resistivity and chargeability anomaly on the projected trace of the Vivi 2 vein, where a grab sample returned 306.23 g/t Au. |
In progress |
|
V05A |
DDPM26-21A |
Resistivity and chargeability anomaly on the Vivi 1 trend approximately 165 m east of V03A; tests the eastern extension. |
Planned |
|
V06A |
DDPM26-22A |
Strong resistivity and chargeability anomalies associated with several structures; tests the eastern extension of the vein system. |
Planned |
|
V07A |
DDPM26-23A |
Coincident resistivity and chargeability anomaly beneath a surface sample of 4.97 g/t Au. |
Planned |
Table 2 - Vivi drill holes and the geophysical and geological basis for their position
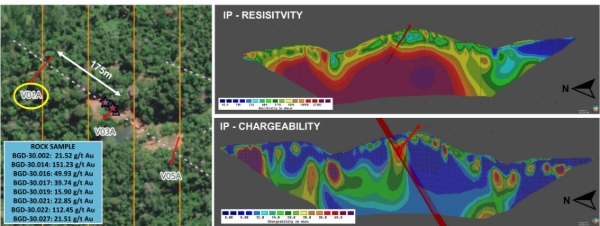
Figure 6 - V01A (DDPM26-14A): the hole tests a chargeability anomaly on the projected trace of the Vivi 1 vein (shaded red band), approximately 175 m along strike from surface samples of up to 151.23 g/t Au.
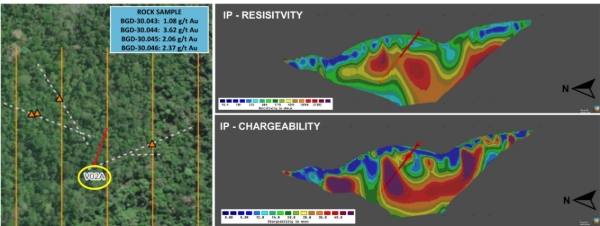
Figure 7 - V02A (DDPM26-18A): coincident high resistivity and high chargeability below the junction of three mapped vein structures.
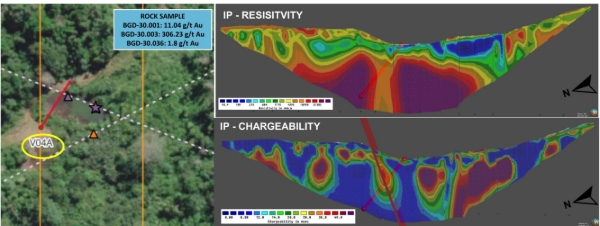
Figure 8 - V04A (DDPM26-20A): the hole tests resistivity and chargeability anomalies on the projected trace of the Vivi 2 vein, which returned 306.23 g/t Au at surface.
Holes V01A and V02A have been completed and the core is being logged and sampled before submission to an accredited laboratory. Results will be reported once received and validated.
PRIORITY TARGETS AND NEXT STEPS
Nine priority targets have now been identified for follow up. The southern geophysical targets lie on or near the same corridor as the known mineralisation at Molly 1, Molly 2 and Vivi. West Boomerang is a new area in the north-west of the licence, on the north-western extension of the Boomerang trend, where extensive historical artisanal workings are recorded.
|
Geophysical Target no. (as shown in Figure 2) |
Area |
Supporting evidence |
Next step |
|
1, 2, 3, 4 |
Boomerang South |
Magnetic structures at the junction of NE-SW structures with the southern corridor; historical artisanal workings |
Sampling under way; one drill hole planned (200 m) |
|
5 |
Vivi |
Mapped vein swarm (at least seven veins); grab samples up to 306.23 g/t Au; coincident IP anomalies |
Drilling under way (seven holes, 900 m) |
|
10, 11 |
West Boomerang (new) |
Magnetic structures on the north-western extension of the Boomerang trend; historical artisanal workings |
Mapping and sampling in 2027 |
|
14 |
Esmeril |
Gold-bearing quartz veins; grab samples up to 26.56 g/t Au |
Detailed mapping and sampling being planned |
|
15 |
Eastpot |
Eastern extension of the southern magnetic corridor; historical gold occurrences (Figure 1) |
Sampling under way |
Table 3 - Priority geophysical targets at the Molly Gold Project
Next steps at the Project are:
• complete the 11 hole drill programme at Vivi, Molly 2 and South Boomerang, and report assay results;
• use the drill core to calibrate the IP and magnetic responses against the rocks and mineralisation intersected;
• extend geological mapping and sampling to the remaining priority targets, starting with South Boomerang and Eastpot, where sampling is under way; and
• rank the targets for the next phase of drilling on the combined geophysical, geological and geochemical results.
APPENDIX:
Glossary of technical terms:
|
Term |
Meaning |
|
Artisanal workings (garimpos) |
Small-scale historical gold workings, which indicate gold at or near surface |
|
Chargeability |
The ability of rock to hold an electrical charge, measured in milliseconds (msec); high values commonly indicate disseminated sulphide minerals |
|
Grab sample |
A rock sample taken selectively from an outcrop or vein; useful to confirm gold is present but not representative of average grade |
|
Induced Polarisation (IP) |
A ground geophysical method that measures chargeability and resistivity below surface |
|
Inversion |
A computer model that converts surface geophysical measurements into an estimate of the shape and depth of the sources below ground |
|
Line-km |
The total length of survey lines measured |
|
MagDrone survey |
A magnetic survey flown by drone on closely spaced lines at low height, giving high-resolution data |
|
Resistivity |
How strongly rock resists an electrical current, measured in ohm-metres; quartz veins are typically highly resistive |
|
Riedel shear system |
A pattern of related fractures that forms along a shear zone and commonly hosts sets of veins at characteristic angles |
|
Shear zone |
A zone in which rocks have been deformed by movement, which can channel gold-bearing fluids |
|
Sulphides |
Minerals such as pyrite, arsenopyrite and galena that commonly accompany gold in Tapajós veins |
|
Vein swarm |
A cluster of closely spaced related veins |
THE IMPORTANCE OF GEOPHYSICS AT MOLLY
Gold at Molly occurs in quartz veins and the shear zones and fractures that host them. These veins are typically between a half a meter and a few metres thick. Across most of the Project they are beneath a weathered soil profile and vegetation. Outcrop is rare and surface mapping alone cannot show where the veins run or how far they extend.
Geophysics measures physical properties of the rocks from the surface or from the air and allows geological interpretation through this cover. The two methods used at Molly measure different properties and answer different questions:
• Magnetic survey (MagDrone). A drone flies a sensitive magnetometer on closely spaced lines a few tens of metres above the ground and records small variations in the Earth's magnetic field caused by magnetic minerals in the rocks below. Faults and shear zones offset or cut magnetic rock units and hot hydrothermal fluids that deposit gold commonly destroy magnetic minerals along their path. The survey therefore maps the structural "plumbing" of the Project, including the faults and shear zones that can act as pathways for gold-bearing fluids.
• Induced Polarisation survey (IP). Electrodes placed along lines on the ground pass a small electrical current into the rocks and measure two properties down to 120 m depth for line with 1,000 m long and 100 m for lines with 750 m long. Chargeability measures how strongly the rock holds an electrical charge; high chargeability is commonly caused by disseminated sulphide minerals such as pyrite and arsenopyrite, which accompany gold at Molly. Resistivity measures how strongly the rock resists the current; quartz veins and silicified rock are typically highly resistive, while clay-altered and fractured zones are less resistive.
Quartz veins rarely produce a magnetic response on their own, and an IP survey cannot resolve each individual narrow vein. The value lies in combining the methods: the magnetic survey identifies the favourable structures across the whole Project, and the IP survey then tests those structures below surface for the sulphide and alteration envelope that surrounds mineralised veins. Neither method detects gold directly, and all targets require confirmation by drilling.
Qualified Person
The technical information in this announcement has been reviewed by Mr. Emerson Ricardo Re who is a senior professional geologist with 25 years of experience in the mining industry, which is relevant to the style of mineralisation and type of deposit under consideration and to the activity which he has undertaken to qualify as a Competent Person as defined in the 2012 edition of the JORC Code. Mr. Re also meets the requirements of a competent person under the AIM Note for Mining, Oil and Gas Companies. Mr. Re has no economic, financial or pecuniary interest in the Company, and he consents to the inclusion in this document of the matters based on his technical information in the form and context in which it appears.
ENDS
For further information, please visit www.jangadamines.com, follow us on social media, LinkedIn and X: @Jangada Mines Plc, or contact:
|
Hugo de Salis |
Jangada Mines plc |
info@jangadamines.com |
|
Ritchie Balmer James Spinney Harry Hiley |
Strand Hanson Limited Nominated & Financial Adviser |
Tel: +44 (0)20 7409 3494 |
|
Jonathan Evans |
Tavira Financial Ltd Broker |
Tel: +44 (0)20 7100 5100 |
About Jangada Mines Plc
Jangada Mines Plc (AIM: JAN) is a natural resource development company with assets in Brazil. It is led by a team with deep industry, financial and in-country experience, and has a dual growth strategy to advance its portfolio projects including the high-grade Molly Gold Project, the Paranaíta Gold Project and the 100%-owned Pitombeiras vanadium titanomagnetite Project; and utilise its proven in-country and geological expertise to identify/acquire additional projects that it can rapidly advance to build value for shareholders.
The Company has a 7.8% interest in Fodere Critical Minerals, a transformative mineral processing business centred around a patented hydrometallurgical and pyrometallurgical extraction platform. Further information is available at www.foderegroup.com. Additionally, the Company has a 4.4% stake in Axies Ventures Ltd which is advancing a portfolio of copper and gold exploration targets in recognized geological proven regions within Cyprus and Canada. www.axiesventures.com.
The information contained within this announcement is deemed by the Company to constitute inside information as stipulated under the Market Abuse Regulation (EU) No. 596/2014 as it forms part of United Kingdom domestic law by virtue of the European Union (Withdrawal) Act 2018, as amended by virtue of the Market Abuse (Amendment) (EU Exit) Regulations 2019.
RNS may use your IP address to confirm compliance with the terms and conditions, to analyse how you engage with the information contained in this communication, and to share such analysis on an anonymised basis with others as part of our commercial services. For further information about how RNS and the London Stock Exchange use the personal data you provide us, please see our Privacy Policy.

Latest directors dealings
- 1 hour ago Tertiary Minerals
- 1 hour ago Hargreaves Services
- 14 hours ago ASOS
- 15 hours ago MJ Gleeson
- 15 hours ago Rolls-Royce Holdings