
Annual Financial Report
Summary by AI BETAClose X

24 September 2026
Hansard Global plc
Results for the year ended 30 June 2026
Strong Growth, Improved Profits, Significant Litigation Progress and Sustained Dividend
Hansard Global plc (“Hansard” or “the Group”), the specialist long-term savings provider, issues its full-year results for the year ended 30 June 2026 (“FY26”).
PERFORMANCE HIGHLIGHTS
|
Metric (full year) |
FY26 |
FY25 |
Change |
|
New business sales (PVNBP)1 |
£108.3m |
£82.4m |
+31.4% |
|
New business sales (APE)2 |
£14.6m |
£12.2m |
+19.7% |
|
Net Issued Commission Credit (NICC)3 |
£7.7m |
£5.8m |
+32.8% |
|
Weighted Net Issued Commission Credit (WNICC)4 |
£5.2m |
£4.2m |
+23.8% |
|
IFRS Profit before tax5 |
£6.5m |
£1.0m |
+£5.5m |
|
Underlying operating profit6 |
£5.2m |
£4.3m |
+£0.9m |
|
Administrative expenses7 |
£28.4m |
£28.3m |
+£0.1m |
|
Net cash flow before dividends |
£0.3m |
(£3.7m) |
+£4.0m |
|
Recommended final dividend per share8 |
2.65p |
2.65p |
Unchanged |
|
Full Dividend for the year8 |
4.45p |
4.45p |
Unchanged |
|
Metric (as at) |
30 June 2026 |
30 June 2025 |
Change |
|
Cash and deposits |
£78.5m |
£66.2m |
+£12.3m |
|
Net assets |
£16.6m |
£16.5m |
+£0.1m |
|
Assets under Administration |
£1.26bn |
£1.13bn |
+11.6% |
|
Own Funds |
£111.9m |
£111.4m |
+0.4% |
|
Value of In-Force |
£102.7m |
£103.1m |
-0.4% |
|
Solvency coverage ratio |
170% |
169% |
+1pp |
1 Present Value of New Business Premiums
2 Annual Premium Equivalent
3 NICC measures new business commission paid after deducting commission clawbacks, reflecting both sales volumes and policy quality/persistency. See Key Performance Indicators.
4 WNICC applies profitability weightings to NICC to account for differences between products. The aim is to normalise commission across products with different underlying profitability profiles. See Key Performance Indicators.
5 The FY25 comparative has been restated to correct prior-period errors. Further details are provided in the Financial Review and Note 1.2 to the Consolidated Financial Statements.
6 Underlying operating profit excludes litigation and other non-recurring items.
7 Expenses excluding litigation and other non-recurring items.
8 Subject to approval at the AGM.
Thomas Morfett, Group Chief Executive Officer, commented:
“FY26 was a year of strong execution and meaningful progress. We delivered our strongest new business growth in recent years, with PVNBP increasing by 31.4% to £108.3m, while profit before tax increased to £6.5m and assets under administration grew to £1.26bn.
Growth was broad based across products, markets and distribution relationships. We launched locally licensed products in Japan, received in-principle approval for a DIFC licence in the UAE, strengthened our position in Latin America and made significant progress in resolving legacy litigation matters. These developments have materially reduced uncertainty and allow increasing management focus to be directed towards growth and strategic execution. The Group remains strongly capitalised, debt-free and highly liquid, supporting the Board’s recommendation to maintain the total dividend at 4.45p per share.
We enter FY27 with a strengthened operating platform and a clear strategy focused on expanding distribution, deepening adviser engagement and improving service. Our priority is disciplined execution as we seek to build a larger, more profitable and resilient Hansard over the longer term.”
NEW BUSINESS
New business for FY26 totalled £108.3m on a PVNBP basis, up 31.4% from £82.4m in FY25. APE increased by 19.7% to £14.6m from £12.2m. Growth was broad based across products, markets and distribution relationships, supported by stronger adviser engagement and increased commercial activity across the Group’s priority regions.
NICC increased by 32.8% to £7.7m, while WNICC, which adjusts for differences in product profitability, increased by 23.8% to £5.2m, reflecting strong growth in the profitability-weighted value of new business.
Single-premium PVNBP increased by 34.5% to £73.3m, led by continued strong performance from Global Select. Regular-premium PVNBP increased by 25.4% to £35.0m as Ascend gained further traction. Locally licensed products, Global Access and Upstream, were launched in Japan through the Group’s partnership with Guardian and sales commenced during the year. Growth was geographically diversified, with positive PVNBP growth across all four reported regions and particularly strong progress in Asia, including Japan.
TRADING RESULTS
IFRS profit before tax increased to £6.5m (FY25 restated: £1.0m). Underlying operating profit increased to £5.2m (FY25 restated: £4.3m), principally reflecting higher fee income, supported by favourable market conditions and growth in assets under administration. IFRS profit before tax also benefited from a net credit within litigation and other non-recurring items, arising primarily from legal cost recoveries from insurers recognised during the year.
Fees and commissions attributable to the Group increased by 4.5% to £44.3m (FY25 restated: £42.4m). Administrative expenses excluding litigation and other non-recurring items were broadly flat at £28.4m (FY25: £28.3m).
Net cash flow before dividends improved to an inflow of £0.3m from an outflow of £3.7m in FY25. Group cash and deposits increased to £78.5m at 30 June 2026 (30 June 2025: £66.2m), further strengthening the Group’s liquidity position.
Overall shareholder value and capital strength have improved, with Own Funds increasing to £111.9m and the solvency surplus increasing to £46.0m. The Group's Value of In-Force remained strong at £102.7m, continuing to demonstrate the long-term value embedded within the existing contract portfolio.
Assets under administration increased by 11.6% to £1.26bn, driven by strong premium inflows and favourable market performance, partly offset by withdrawals.
POLICYHOLDER LITIGATION
The Group made significant progress in addressing legacy litigation associated principally with Hansard Europe. During the year, the Board approved a settlement-led strategy for certain insured litigation matters and agreed a settlement approach for Italy with the Group’s insurers, reducing uncertainty and securing substantially improved legal cost recoveries.
At 30 June 2026, estimated contingent litigation exposure was £9.7m (30 June 2025: £20.4m). A provision of £5.6m (30 June 2025: £0.7m) was recognised for matters where negotiated settlement had become the most likely method of resolution. These costs are expected to be substantially recovered under the Group's insurance arrangements, with related insurance recovery assets and receivables totalling £7.9m (30 June 2025: £0.6m), comprising a £5.6m settlement recovery asset and £2.3m of receivables relating to historic defence costs. The Group also received £2.1m of cash insurance recoveries during the year (30 June 2025: £0.4m). Collectively, these developments materially reduced litigation uncertainty, improved visibility over the Group's remaining exposure and provided a clearer pathway towards resolution of this long-standing matter.
CAPITAL AND SOLVENCY
The Group remains strongly capitalised, debt-free and highly liquid. The Group solvency coverage ratio at 30 June 2026 was 170% (30 June 2025: 169%), with a risk-based solvency surplus of £46.0m before allowing for payment of the proposed final dividend.
As part of its broader capital-management programme, the Board intends to seek shareholder approval at the forthcoming AGM to re-register Hansard Global plc under the Isle of Man Companies Act 2006. The proposal is intended to modernise the Company’s corporate structure and provide greater flexibility over future capital management and distributions, while preserving shareholders’ fundamental rights. Further details will be included in the Notice of AGM and accompanying shareholder circular.
DIVIDENDS
The Board has proposed a final dividend of 2.65p per share, maintaining the total dividend for the year at 4.45p (FY25: 4.45p). Subject to shareholder approval at the AGM on 4 November 2026, the dividend will be paid on 12 November 2026 to shareholders on the register at 2 October 2026. The ex-dividend date is 1 October 2026.
STRATEGIC PROGRESS AND OUTLOOK
During FY26, the Group established a clear multi-year Growth Strategy to support sustainable profitable growth by expanding distribution capacity, strengthening adviser engagement, increasing market presence and enhancing brand visibility across the Middle East and Africa, Latin America and Asia, including Japan.
The Group also strengthened its commercial leadership through the appointment of Philip Story as Chief Distribution Officer to lead the next phase of commercial development and execution of the Growth Strategy.
Hansard enters FY27 with a scalable operating platform, a strengthened financial position and a clear programme of strategic priorities. The Group’s focus is on disciplined execution of the Growth Strategy, continued enhancement of service and digital capability, progression of capital-management initiatives and further resolution of legacy litigation. While macroeconomic, geopolitical and market uncertainties remain, the Board believes the Group is well positioned to pursue its strategic objectives from a position of financial strength.
HALF-YEARLY RESULTS
The results for the half-year ending 31 December 2026 are expected to be published on 4 March 2027.
FOR FURTHER INFORMATION
Hansard Global plc
Thomas Morfett, Group Chief Executive Officer
Ollie Byrne, Group Chief Financial Officer
Tel: +44 (0) 1624 688 000
Email: investor-relations@hansard.com
NOTES TO EDITORS
- Hansard Global plc is the holding company of the Hansard Group of companies. The Company was listed on the London Stock Exchange in December 2006. The Group is a specialist long-term savings provider, based in the Isle of Man.
- The Group offers a range of flexible and tax-efficient investment products within a life assurance policy wrapper, designed to appeal to affluent international investors. The Group administers assets in excess of £1.2bn across nearly 40,000 client accounts.
- The Group utilises a controlled-cost distribution model through a network of independent financial advisers and the retail operations of certain financial institutions. Its distribution model is supported by Hansard OnLine, a multi-language internet platform, and is scalable.
- The Group’s priority regions are the Middle East and Africa, Latin America and Asia, including Japan. Hansard Europe dac manages legacy business and has been closed to new business since 30 June 2013.
- The Group's objective is to help clients achieve their long-term financial goals through flexible savings and investment solutions, delivered through trusted adviser relationships, while generating sustainable growth and long-term value for shareholders.
FORWARD-LOOKING STATEMENTS
This announcement may contain certain forward-looking statements with respect to certain of Hansard Global plc’s plans and its current goals and expectations relating to future financial condition, performance and results. By their nature, forward-looking statements involve risk and uncertainties because they relate to future events and circumstances which are beyond Hansard Global plc’s control. As a result, Hansard Global plc’s actual future condition, performance and results may differ materially from the plans, goals and expectations set out in Hansard Global plc’s forward-looking statements. Hansard Global plc does not undertake to update forward-looking statements contained in this announcement or any other forward-looking statement it may make. No statement in this announcement is intended to be a profit forecast or be relied upon as a guide for future performance.
This announcement contains inside information which is disclosed in accordance with the Market Abuse Regulation.
Legal Entity Identifier: 213800ZJ9F2EA3Q24K05
Hansard Global plc
Report and Accounts for the year ended 30 June 2026
CHAIRMAN’S STATEMENT
Philip Kay, Chairman
I am pleased to present Hansard Global plc's Annual Report for the year ended 30 June 2026 ("FY26"). During the year the Group delivered strong commercial and financial progress, established a clear strategy for future growth and took important steps to strengthen its long-term position. As a Board, we believe FY26 represents an important milestone in the evolution of Hansard and provides a firm foundation for future value creation.
Performance
FY26 was a year of significant progress for the Group. We delivered our strongest new business growth in recent years, improved profitability, increased assets under administration and strengthened our liquidity position whilst maintaining disciplined control of costs. New business increased by 31.4% on a Present Value of New Business Premiums basis to £108.3m, profit before tax increased to £6.5m and assets under administration grew to £1.26bn. These results reflect both the quality of our underlying business and the early benefits of actions taken to accelerate growth.
Importantly, this growth was achieved while preserving the financial characteristics that have long underpinned the resilience of the Group. Hansard remains strongly capitalised, debt-free, highly liquid and cash generative, providing the flexibility to invest in future growth while continuing to deliver attractive returns to shareholders.
We also made substantial progress in addressing the legacy litigation associated principally with Hansard Europe. This has been a significant source of cost and uncertainty for the Group over many years. A settlement strategy agreed with our insurers, together with substantially improved recovery of legal costs, represents an important step towards drawing this long-standing matter to a conclusion. While further work remains, the Board believes the Group is now in a materially stronger position, with greater clarity over the remaining exposure and a clear route towards its resolution.
The Board views FY26 as more than a year of improved performance. It marks the beginning of a renewed phase for Hansard, in which we have established a clear strategy to increase market penetration, expand our distribution reach and unlock the significant opportunity available across our priority international markets. The progress achieved during the year provides encouraging evidence that this strategy can deliver sustainable long-term value for shareholders.
A renewed focus on growth
Growth is the Board's foremost strategic priority. Hansard operates in large international markets where it has established positions, trusted distribution relationships and a competitive proposition, yet we continue to occupy only a modest share of the opportunity available to us. The Board therefore believes that the greatest opportunity to create long-term shareholder value lies not in changing the nature of the business, but in increasing its scale.
Over recent years, the Group has invested significantly in its operating platform, digital capabilities, regulatory infrastructure, products and service model. These investments have strengthened operational resilience, improved adviser and client experience and created capacity within the business to support materially higher levels of activity. Much of the infrastructure required to support future growth is therefore already in place.
The importance of growth extends well beyond increasing new business volumes. As assets under administration grow, the Group benefits from increasing recurring revenues, enhanced operating leverage and improved earnings resilience. Sustained growth strengthens profitability, improves the quality and predictability of cash flows and enhances the Group's ability to support sustainable shareholder distributions over time.
The Board's strategic review concluded that the principal constraints on growth are not product capability or operational capacity, but distribution reach, market presence and brand visibility. The strategy developed by management is therefore focused on addressing these opportunities across our priority regions of the Middle East and Africa, Latin America and Asia, including Japan. We believe disciplined execution of this strategy will create a larger, more profitable and more resilient business capable of generating increasing value for shareholders over the long term.
Capital allocation
The Board remains committed to disciplined capital allocation, balancing investment in future growth with the delivery of sustainable shareholder returns. Hansard enters its next phase of development from a position of financial strength, supported by a robust solvency position, substantial liquidity and a capital-light business model that continues to generate recurring cash flows. The Board's confidence in the Group's financial resilience is reflected in its recommendation to maintain the total dividend at 4.45p per share for FY26.
Together, our capital position, improving litigation outlook and increasing scale provide a strong foundation from which to invest selectively in growth opportunities whilst maintaining our focus on sustainable dividends and long-term shareholder value creation. At the forthcoming AGM, the Board will seek shareholder approval for a Long-Term Incentive Plan ("LTIP") for Executive Directors, supporting the delivery of the Group's long-term growth strategy and aligning executive remuneration with shareholder outcomes.
Simplified corporate structure
As part of its broader capital management programme, at the forthcoming AGM the Board is proposing the re-registration of Hansard Global plc under the Isle of Man Companies Act 2006. The proposal is intended to modernise the Company's corporate structure and remove an existing structural constraint on future distributions, providing greater flexibility over capital management while preserving appropriate governance standards and shareholder protections. External legal advice has confirmed that the proposal would not alter shareholders' fundamental rights, including voting, dividend and winding-up rights.
The proposal forms part of a wider programme designed to strengthen financial flexibility and support the Board's objective of maintaining sustainable shareholder distributions over the long term.
Governance and our people
Strong governance and effective leadership are essential to the successful execution of the Group's strategy. The Board remains focused on maintaining high standards of governance, risk management and capital discipline as Hansard enters its next phase of growth. We recognise that sustainable value creation can only be achieved within a robust control environment and a clearly defined risk appetite.
The Board is supported by an experienced executive team with a clear mandate to deliver the Group's growth ambitions while maintaining the financial strength, operational resilience and client focus that have long characterised Hansard. During the year we continued to strengthen organisational capability and invest in the leadership and talent required to support future growth across our international markets.
On behalf of the Board, I would like to thank all colleagues across the Group for their professionalism, commitment and contribution throughout the year. The progress achieved during FY26 reflects the dedication of our people and provides a strong foundation for the opportunities that lie ahead.
Philip Kay
Chairman
23 September 2026
CEO OVERVIEW
Thomas Morfett, Group Chief Executive Officer
A strong year of execution
FY26 was a year of strong execution and meaningful progress across the Group. We delivered our strongest new business growth in recent years, increased profitability, improved cash generation and strengthened our position across several key markets. We also launched locally licensed products in Japan and expanded our international footprint, while taking decisive steps to address the legacy litigation that has affected the Group for many years.
New business increased by 31.4% on a PVNBP basis to £108.3m, profit before tax increased to £6.5m and assets under administration grew to £1.26bn. These outcomes demonstrate the strength of our proposition, the effectiveness of our commercial teams and the benefits of investments made across the business in recent years.
A particularly important achievement during the year was the progress made in resolving the legacy litigation associated principally with Hansard Europe. This has absorbed significant cost and management attention over many years. We have now agreed a settlement-led approach for certain insured matters, established a clear strategy for Italy with our insurers and secured substantially improved recovery of legal costs. These developments have materially reduced uncertainty, improved visibility over the Group’s remaining exposure and provide a credible pathway towards bringing this long-standing matter substantially to a close.
What's driving growth?
Growth during FY26 was broad based across products, markets and distribution relationships. Single-premium business continued to perform strongly, led by Global Select, while regular-premium sales increased as Ascend gained further traction with advisers and clients. Growth was supported by stronger adviser engagement, increasing commercial activity across our priority regions and continued enhancements to our proposition and service offering.
Importantly, growth was geographically diversified. We delivered positive momentum across our major regions, with particularly strong performances across our emerging markets. This provides confidence that the improvement achieved during the year reflects a broadening of opportunity rather than reliance on any single market or distribution source.
The year also provided early evidence that the strategic initiatives introduced during FY26 are gaining traction. Increased market engagement, stronger relationships with advisers and distributors and improved visibility of the Hansard brand contributed positively to sales activity and reinforce our confidence in the opportunity available across our existing markets.
Industry recognition
Our commitment to product, service and digital excellence continues to be recognised by independent industry bodies. During FY26, Global Select was awarded Best International Portfolio Bond, while Ascend was recognised as Best International Savings Plan in 2025 and Highly Commended in 2026. We also received the Excellence in Client Services – Asia award, reflecting the dedication of our Malaysia and Isle of Man teams, and were named Best Digital Platform at the Global Financial Services Awards 2026. Together, these awards provide independent validation of our adviser-led product development, customer service excellence and continued investment in digital capability.
Expanding our international presence
A key element of our strategy is strengthening our presence within attractive international markets where we believe there is significant potential for long-term growth.
During the year we launched our locally licensed products, Global Access and Upstream, in Japan through our partnership with Guardian and commenced sales in that market. While still at an early stage, the launch establishes an important platform from which to grow our presence across Asia. We also continued to strengthen our commercial position in Latin America and received in-principle approval for a Dubai International Financial Centre (“DIFC”) licence in the UAE, supporting our objective of demonstrating long-term commitment within key markets and enhancing our regional credibility.
Operational delivery
Delivering sustainable growth requires a scalable operating platform and a consistent service experience. Our policy administration platform, implemented in FY24, is performing well. Together with continued investment in automation, digital capability and service delivery, it provides a strong foundation for future growth. We continued to enhance our adviser and client platforms during the year, improving functionality, responsiveness and reliability. Service remains a key differentiator in our market, and improving adviser and client experience remains an important strategic priority.
Financial performance
The commercial progress achieved during the year translated into improved financial performance. Underlying operating profit increased from £4.3m to £5.2m, IFRS profit before tax rose from £1.0m to £6.5m and net cash inflows before dividends improved from an outflow of £3.7m to an inflow of £0.3m. The improvement reflected both stronger underlying business performance together with the positive financial effect of increased litigation-related insurance recoveries. Assets under administration increased by 11.6% to £1.26bn, benefiting from strong premium inflows and favourable market performance.
Looking ahead
We enter FY27 with increasing momentum, a strengthened operating platform and a clear strategic agenda. Our focus is on disciplined execution: expanding distribution capacity, deepening adviser engagement, strengthening market presence and further improving service delivery. We believe the opportunity available across our existing markets remains substantial and that successful execution of our strategy can deliver sustained growth in assets under administration, recurring revenues and profitability over the medium term.
The foundations of the business are strong, the opportunity is significant and the strategy is clear. Our objective is to build a larger, more profitable and more resilient Hansard capable of delivering increasing value to clients, advisers and shareholders over the long term.
Thomas Morfett
Group Chief Executive Officer
23 September 2026
FY26 PERFORMANCE HIGHLIGHTS
FY26 was a year of strong commercial and financial progress. We delivered our strongest new business growth in recent years, improved profitability, increased assets under administration and strengthened our cash position, while establishing a clear strategy to accelerate future growth.
|
Metric (full year) |
FY26 |
FY25 |
Change |
|
New business sales (PVNBP)1 |
£108.3m |
£82.4m |
+31.4% |
|
New business sales (APE)2 |
£14.6m |
£12.2m |
+19.7% |
|
Net Issued Commission Credit (NICC)3 |
£7.7m |
£5.8m |
+32.8% |
|
Weighted Net Issued Commission Credit (WNICC)4 |
£5.2m |
£4.2m |
+23.8% |
|
IFRS Profit before tax5 |
£6.5m |
£1.0m |
+£5.5m |
|
Underlying operating profit5 |
£5.2m |
£4.3m |
+£0.9m |
|
Administrative expenses6 |
£28.4m |
£28.3m |
+£0.1m |
|
Net cash flow before dividends |
£0.3m |
(£3.7m) |
+£4.0m |
|
Recommended final dividend per share7 |
2.65p |
2.65p |
Unchanged |
|
Total dividend for the year7 |
4.45p |
4.45p |
Unchanged |
|
Metric (as at) |
30 June 2026 |
30 June 2025 |
Change |
|
Cash and deposits |
£78.5m |
£66.2m |
+£12.3m |
|
Net assets |
£16.6m |
£16.5m |
+£0.1m |
|
Assets under Administration |
£1.26bn |
£1.13bn |
+11.6% |
|
Own Funds |
£111.9m |
£111.4m |
+0.4% |
|
Value of In-Force |
£102.7m |
£103.1m |
-0.4% |
|
Solvency coverage ratio |
170% |
169% |
+1pp |
1 Present Value of New Business Premiums.
2 Annual Premium Equivalent.
3 NICC measures new business commission paid after deducting commission clawbacks, reflecting both sales volumes and policy quality/persistency. See Key Performance Indicators.
4 WNICC applies profitability weightings to NICC to account for differences between products. The aim is to normalise commission across products with different underlying profitability. See Key Performance Indicators.
5 The FY25 comparatives are restated to correct prior-period errors. Further details are noted in the Financial Review and Note 1.2 to the Consolidated Financial Statements.
6 Expenses excluding litigation and other non-recurring items. See page 15.
7 Subject to approval at the AGM.
Operational & financial progress
Strong commercial momentum
New business increased across both single and regular-premium products. PVNBP increased by 31.4% to £108.3m, reflecting broad-based growth across the Group's international markets.
Improved profitability and cash generation
Underlying operating profit increased by 20.9% to £5.2m and profit before tax increased to £6.5m. Net cash flow before dividends improved to an inflow of £0.3m, reflecting stronger revenue generation and increased litigation recoveries.
Growth in recurring revenues
Assets under administration increased by 11.6% to £1.26bn. The enlarged asset base strengthens the recurring revenues from which future earnings and cash flows are generated.
Financial strength maintained
The Group remains strongly capitalised and highly liquid, with cash and deposits of £78.5m and a solvency coverage ratio of 170%. This financial strength supports investment in the Growth Strategy while maintaining the Board's focus on sustainable shareholder returns.
Strategic progress
Growth Strategy established
A clear multi-year Growth Strategy was developed to accelerate profitable growth through expanded distribution capacity, stronger adviser engagement, increased market presence and enhanced brand visibility across the Group's priority markets.
International footprint strengthened
Locally licensed products were launched in Japan and sales commenced through the Group's partnership with Guardian. The Group also received in-principle approval for a DIFC licence in the UAE and further strengthened its presence and distribution relationships in Latin America.
Commercial leadership strengthened
Philip Story was appointed Chief Distribution Officer to lead the next phase of the Group's commercial development and Growth Strategy execution. With more than 30 years of international insurance experience across the UK, Middle East, Asia and Africa, including senior executive and board-level roles, Philip brings significant expertise in building and leading distribution businesses. Based in the UAE and serving as Chairman of the DIFC Insurance Association, he further strengthens the Group's commercial leadership and supports the delivery of its growth ambitions.
Operating platform strengthened
The policy administration platform implemented in FY24 is performing well. Continued investment in digital capabilities and service delivery has created additional capacity to support future growth.
Litigation progress
The Group made significant progress in addressing legacy Hansard Europe litigation, agreeing a settlement approach for Italy with its insurers and securing substantially improved legal cost recoveries. These developments have materially reduced uncertainty, improved visibility over the remaining exposure and allow greater management focus on growth and strategic execution.
KEY PERFORMANCE INDICATORS
The Group monitors a range of financial and non-financial key performance indicators to assess business performance and strategic progress. The principal indicators monitored during FY26 are summarised below.
|
New Business – During FY26, the Group refined its primary new business KPI from Net Issued Commission Credit (NICC) to Weighted Net Issued Commission Credit (WNICC).
NICC measures base commission payable to intermediaries, net of commission clawbacks on lapsed policies, thereby reflecting both sales volumes and policy persistency.
WNICC applies profitability weightings to NICC to normalise production across products with differing underlying profitability and therefore provides a more consistent measure of the value of new business written across the Group's product range. The refinement aligns external KPI reporting with the measure used internally to manage and incentivise new business performance.
New business levels are reported daily and monitored weekly against target levels.
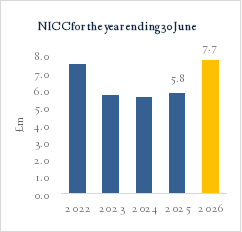
NICC was £7.7m for FY26, up 32.8% on FY25 (£5.8m).
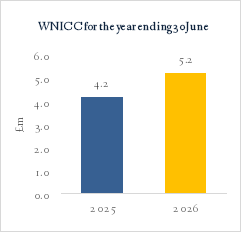
WNICC was £5.2m for FY26, up 23.8% on FY25 (£4.2m), reflecting higher levels of profitable new business written.
|
|
|
Administrative Expenses (excl. litigation and non-recurring items) – The Group maintains a rigorous focus on expense levels and the value gained from such expenditure. The objective is to develop processes to restrain increases in administrative expenses to the rates of inflation assumed in the charging structure of the Group’s policies.
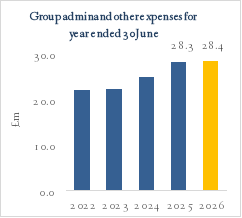
The Group’s administrative and other expenses for FY26 (excl. litigation and non-recurring items) were £28.4m compared to £28.3m in FY25. Further detail is contained in the section on Administrative and other expenses within the Financial Review. |
|
|
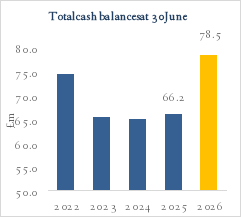
Cash – Bank balances and significant movements on balances are reported monthly. The Group’s cash and deposits at the balance sheet date were £78.5m (FY25: £66.2m). Movements are reflective of cash earned from new and existing business, commissions and expenses paid, investments in new systems, the level of inflight transactions, and the dividends paid to shareholders. |
|
|
Operational Resilience – Maintaining uninterrupted access to data and services is critical to the Group. Operational resilience is supported by a robust technology infrastructure, regular business continuity and penetration testing, and a continued focus on data security and integrity. The Group's ability to operate effectively through remote working further demonstrates the strength of these arrangements. | |
|
Risk profile – The Group's risk profile is monitored continuously through its established risk management framework, with senior management regularly reviewing actual, emerging and evolving risks. The principal risks facing the Group are summarised in the Principal Risks section. | |
|
Solvency – The Solvency Capital Requirement (“SCR”) of the Group and its subsidiaries is monitored quarterly and reported to the Board. The solvency coverage as at 30 June 2026 is 170% and detailed in Other Information. | |
BUSINESS MODEL & STRATEGY
Our Business Model
Hansard is a specialist provider of long-term savings and investment solutions, operating through a network of regulated entities across the Isle of Man, The Bahamas, the Republic of Ireland, Malaysia, Japan, and the UAE. Our business model is built on delivering secure, flexible, and transparent life assurance wrappers to international clients, supported by a robust digital infrastructure and a global distribution network of independent financial advisers (“IFAs”).
We serve a diverse client base of affluent international investors, institutions, and wealth-management groups, administering assets of £1.26bn across nearly 40,000 client accounts. Our products are exclusively distributed through IFAs and the retail operations of financial institutions, with local language support provided by our Regional Sales Managers and our award-winning Hansard OnLine platform.
Our operations are structured to ensure regulatory compliance, operational efficiency, and strategic agility. Each of our regulated insurance entities plays a distinct role:
- Hansard International (Isle of Man) supports business flows from Japan and Malaysia, through its branches in Tokyo and Labuan respectively, and reinsurance arrangements.
- Hansard Worldwide (The Bahamas) underwrites international and expatriate business globally.
- Hansard Europe (Republic of Ireland) manages legacy business, having ceased new business intake in 2013.
We do not offer investment advice, and our products carry no investment guarantees, ensuring that contract holders bear the investment risk. This model allows us to maintain a low-risk balance sheet and minimise capital strain, while offering clients access to a wide range of investment assets tailored to their needs.
Our business model is designed to scale efficiently, adapt to regulatory change, and support strategic growth initiatives.
Our Mission, Vision & Strategy
At Hansard, our mission is to empower clients to achieve lasting financial success while cultivating trusted relationships with quality distributors.
Our vision is to deliver competitive and innovative financial solutions to clients worldwide leveraging the expertise of high-quality distributors, anchored in trust, integrity, respect, quality, and innovation.
Our long-term strategy is to improve our business, grow our footprint and future-proof our operating model.
This strategy is underpinned by three imperatives:
- Improve: We are committed to enhancing client outcomes by recruiting, training, and retaining quality people; delivering excellent customer service; and strengthening our proposition through distributor feedback and market insight.
- Grow: We are focused on organic expansion, including our expansion in the Japanese market and deepening distributor relationships. We continue to develop bespoke distributor partnerships that support scalable, long-term growth.
- Future-proof: We are committed to embracing innovation and digital transformation to elevate client experiences, drive operational efficiency, and ensure resilience in a dynamic regulatory and economic environment.
Climate-related financial disclosures
The Board considers that the Group’s climate-related financial disclosures are consistent with the TCFD Recommendations and Recommended Disclosures. These disclosures are set out in the Corporate Social Responsibility section on pages 57 to 59.
Our Growth Strategy
Over recent years, our focus has been on strengthening and future-proofing the business. We have invested significantly in technology, regulatory infrastructure, products, people and service capability, while enhancing governance, operational resilience and financial discipline. Together, these initiatives have created a stronger, more scalable platform from which to grow.
While these priorities remain fundamental to the Group's long-term success, the Board concluded during FY26 that the greatest opportunity to create additional shareholder value now lies in accelerating profitable growth. As a result, the emphasis has evolved from building capability to increasing scale.
Hansard operates in large international markets where it enjoys established distribution relationships, regional expertise and a competitive product proposition, yet we continue to capture only a modest share of the opportunity available. Following a detailed strategic review, the Board concluded that the principal constraints on growth are distribution reach, market presence and brand visibility, rather than product capability, operational capacity or financial resources.
Our strategic priority is therefore to accelerate profitable growth by expanding our commercial reach, deepening distributor relationships and increasing market penetration across our priority regions. By leveraging the capabilities, infrastructure and capacity developed over recent years, we believe Hansard is well positioned to grow assets under administration, strengthen recurring revenues and deliver increasing value for shareholders over the long term.
Creating shareholder value
Hansard generates predominantly recurring fee income from long-term client assets. Increasing new business today builds assets under administration and expands the future recurring revenue base from which earnings and cash flows are generated. Combined with the capacity created through significant investment in our operating platform and infrastructure in recent years, growth in assets should drive operating leverage, enhance profitability and strengthen cash generation over time. The strategy is therefore designed not simply to increase sales, but to support sustainable dividends and create increasing long-term value for shareholders.
Why Hansard can win
The strategy builds on capabilities developed over several years:
|
Established distribution |
Competitive proposition |
Scalable operating model |
Financial strength |
|
Long-standing adviser and distributor relationships |
Strong single and regular-premium products |
Investment in technology, digital services and operational resilience |
Strong liquidity and solvency |
|
Regional knowledge and credibility |
Targeted innovation based on adviser and client needs |
Capacity to support higher activity and deliver operating leverage |
Capital-light model with capacity to fund growth |
Where we will focus
We will concentrate investment in three regions where Hansard has established capabilities and significant distribution potential:
- Middle East and Africa: expand sales capacity, deepen adviser relationships and leverage the DIFC licence.
- Latin America: increase regional coverage, broaden productive distribution and build on FY26 momentum.
- Asia, including Japan: develop the recently launched Japan platform and establish a foundation for wider regional growth.
This focused approach offers a more efficient route to growth than widespread new-market entry or acquisition-led expansion.
How we will deliver
Our plan comprises six priorities:
- Expand sales capacity and capability in priority regions.
- Strengthen market presence and brand visibility through focused commercial activity.
- Deepen adviser and distributor engagement and broaden productive relationships.
- Demonstrate long-term regional commitment through appropriate licences, partnerships and local presence.
- Improve service and client experience by reducing friction and increasing digital self-service.
- Maintain proposition competitiveness through targeted, commercially disciplined innovation.
Disciplined execution
Investment will be phased and governed through the Group’s established planning, risk and capital-management processes. Progress will be assessed through outcomes, including new business, productive distribution relationships, assets under administration, service performance, profitability and cash generation.
We enter FY27 with stronger commercial momentum, an established operating platform and a clear programme of action. Our immediate priority is execution: expanding distribution capacity, deepening adviser engagement, strengthening our presence in priority markets and continuing to improve service delivery. With disciplined execution, the strategy is intended to build a larger, more profitable and resilient Hansard and deliver increasing shareholder value over the long term.
FINANCIAL REVIEW
Restatement of comparatives
The FY25 comparatives have been restated to correct prior-period errors relating to certain income and foreign exchange revaluation, with a net impact on retained earnings at 30 June 2025 of nil but reducing FY25 profit before tax by £0.8m, from £1.8m to £1.0m. Comparative information throughout is presented on the restated basis. Further details are presented in Note 1.2 of the consolidated financial statements and the root cause of the errors has been identified and remediated.
Presentation of results
Due to the nature of the Group's unit-linked business model, the IFRS financial statements include significant policyholder-related asset, liability, income and expense movements which do not affect shareholder profitability. In addition, as the Group's products are long term in nature, initial fees and acquisition costs are recognised over the lifetime of each contract.
To assist readers in understanding the underlying performance of the business, management presents alternative performance measures ("APMs") alongside the IFRS results. These measures should be considered supplementary to, and not as a substitute for, the IFRS financial statements. Reconciliations to the most directly comparable IFRS measures are provided below.
For the year ended 30 June 2026, IFRS profit before tax increased to £6.5m (2025 restated: £1.0m), while underlying operating profit increased to £5.2m (2025 restated: £4.3m). The improvement principally reflects higher fee income, supported by favourable market conditions and growth in assets under administration. IFRS profit before tax also benefited from a net credit within litigation and other non-recurring items arising primarily from legal cost recoveries from insurers recognised during the year.
Abridged Consolidated Income Statement
The abridged consolidated income statement below presents the Group's underlying financial performance. It adjusts the IFRS results to remove investment gains and losses attributable to contract holder assets of £193.7m (2025: £27.1m) and £5.5m (2025: £5.1m) fund management fees collected on behalf of, and remitted to, third-party fund managers, neither of which impacts shareholder profitability. The statement also separately identifies litigation and other non-recurring items to improve comparability between reporting periods.
|
|
2026
£m |
2025 As restated £m |
|
Fees and commissions |
44.3 |
42.4 |
|
Investment and other income |
4.2 |
5.2 |
|
Total income |
48.5 |
47.6 |
|
Origination costs |
(15.0) |
(15.0) |
|
Operating expenses |
(26.1) |
(26.2) |
|
Depreciation and amortisation |
(2.2) |
(2.1) |
|
Underlying operating profit (non-GAAP) |
5.2 |
4.3 |
|
Litigation and non-recurring items |
1.3 |
(3.3) |
|
IFRS Profit before tax |
6.5 |
1.0 |
|
Tax |
- |
- |
|
IFRS Profit after tax |
6.5 |
1.0 |
New business
New business growth reflected broad-based improvements in adviser engagement, distribution activity and market presence across the Group's priority regions. Global Select continued to perform strongly, while Ascend contributed to the recovery in regular-premium sales. Growth was achieved across multiple regions and product lines, providing confidence that the improvement represents a broadening of the Group's commercial momentum rather than reliance on a single market or distribution relationship.
|
New business |
2026 £m |
2025 £m |
Change |
|
PVNBP |
108.3 |
82.4 |
+31.4% |
|
APE |
14.6 |
12.2 |
+19.7% |
|
PVNBP by type |
2026 £m |
2025 £m |
Change |
|
Single premium |
73.3 |
54.5 |
+34.5% |
|
Regular premium |
35.0 |
27.9 |
+25.4% |
|
Total PVNBP |
108.3 |
82.4 |
+31.4% |
|
APE by type |
2026 £m |
2025 £m |
Change |
|
Single premium |
7.3 |
6.0 |
+21.7% |
|
Regular premium |
7.3 |
6.2 |
+17.7% |
|
Total APE |
14.6 |
12.2 |
+19.7% |
|
PVNBP by region |
2026 £m |
2025 £m |
Change |
|
Middle East and Africa |
35.7 |
32.9 |
+8.5% |
|
Latin America |
34.2 |
28.1 |
+21.7% |
|
Rest of World |
26.9 |
16.2 |
+66.0% |
|
Asia (including Japan) |
11.5 |
5.2 |
+121.2% |
|
Total PVNBP |
108.3 |
82.4 |
+31.4% |
Most premiums are denominated in US Dollars (2026: 82%, 2025: 78%), with most of the balance in Sterling (2026: 12%, 2025: 16%) and Euro (2026: 5%, 2025: 6%).
Fees and commissions
Fees and commissions attributable to the Group rose 4.5% to £44.3m (2025: £42.4m). Contract fee income was £30.2m (2025: £28.5m), of which £17.9m relates to the amortisation of fees deferred in prior years, reflecting the cash-generative nature of the back book.
|
|
2026
£m |
2025 As restated £m |
|
Contract fee income |
30.2 |
28.5 |
|
Fund management fee income |
9.1 |
8.8 |
|
Commissions receivable |
5.0 |
5.1 |
|
Total fees and commissions |
44.3 |
42.4 |
Investment and other income
Investment and other income was £4.2m (2025: £5.2m), with bank interest income of £4.7m offset by a foreign exchange loss of £0.5m on the revaluation of net operating assets.
|
|
2026 £m |
2025 As restated £m |
|
Bank interest and other income receivable |
4.7 |
5.0 |
|
Foreign exchange (loss)/profit on revaluation |
(0.5) |
0.2 |
|
Total investment and other income |
4.2 |
5.2 |
Origination costs
Under IFRS, new business commissions and directly attributable costs are deferred and amortised over the expected life of each contract, typically 8 to 15 years. Origination costs recognised in the income statement were £15.0m (2025: £15.0m).
|
|
2026 £m |
2025 £m |
|
Amortisation of deferred origination costs |
13.2 |
13.2 |
|
Other origination costs incurred in the year |
1.8 |
1.8 |
|
Total origination costs |
15.0 |
15.0 |
Administrative and other expenses
A detailed breakdown of administrative and other expenses is provided in Notes 8 and 9 to the consolidated financial statements. The summary below focuses on expenses attributable to the Group’s own activities, excluding third-party fund management fees of £5.5m (2025: £5.1m), which are collected and passed through to external parties associated with underlying contracts.
Administrative and other expenses attributable to the Group were £27.1m (2025: £31.6m). Expenses excluding litigation (legal costs and insurance recoveries) and non-recurring items were £28.4m (2025: £28.3m). Recurring costs have increased, with computer development costs now recognised as a business-as-usual expense following the system implementation. Average headcount increased from 175 to 180. The litigation line was a net credit this year, reflecting substantially improved legal cost recoveries from insurers.
|
|
2026 £m |
2025 £m |
|
Salaries and other employment costs |
12.7 |
12.3 |
|
Other administrative expenses |
11.7 |
9.8 |
|
Professional fees, including audit |
3.0 |
3.6 |
|
Recurring administrative expenses |
27.4 |
25.7 |
|
Growth investment spend |
1.0 |
2.6 |
|
Excluding litigation and non-recurring items |
28.4 |
28.3 |
|
Litigation defence and settlement costs |
(2.1) |
2.8 |
|
Provision for doubtful debts |
0.8 |
0.5 |
|
Total administrative and other expenses |
27.1 |
31.6 |
Cash flow
The cash flow measures discussed below focus on the Group's own cash resources and therefore differ from the statutory IFRS cash flow statement. As is typical of our business model, writing new business creates a short-term cash strain from upfront commissions and acquisition costs, recovered over time through annual management charges.
Net cash before dividends was an inflow of £0.3m (2025 restated: outflow of £3.7m), reflecting stronger income and the litigation recoveries. After dividend payments of £6.1m (2025: £6.1m), net cash outflow was £5.8m (2025: £9.8m outflow). However, higher contract holder cash balances resulted in an increase in amounts due to contract holders of £17.8m (2025: £10.0m), contributing to a total increase in Group cash and deposits of £12.0m during the year. As a result, Group cash and deposits increased to £78.5m at 30 June 2026 (2025: £66.2m), further strengthening the Group's liquidity position.
The following non-GAAP table summarises the Group’s own cash flows in the year:
|
Summary cash flow |
2026 £m |
2025 £m |
|
Net cash surplus from operating activities |
4.7 |
3.8 |
|
Interest received |
4.6 |
4.7 |
|
Net cash inflow from operations |
9.3 |
8.5 |
|
Net cash investment in new business |
(8.7) |
(7.3) |
|
Purchase of property and computer equipment |
(0.3) |
(1.0) |
|
Net cash investment in bond portfolio |
- |
(3.8) |
|
Corporation tax paid |
- |
(0.1) |
|
Net cash inflow/(outflow) before dividends |
0.3 |
(3.7) |
|
Dividends paid |
(6.1) |
(6.1) |
|
Net cash flow after dividends |
(5.8) |
(9.8) |
|
Increase in amounts due to contract holders |
17.8 |
10.0 |
|
Net Group cash movements |
12.0 |
0.2 |
|
Group cash and deposits – opening position |
66.2 |
65.0 |
|
Effect of exchange rate movements |
0.3 |
1.0 |
|
Group cash and deposits – closing position |
78.5 |
66.2 |
The below table reconciles the key lines for this year in the above non-GAAP cash flow to the key lines in the consolidated cash flow shown on page 110.
|
|
Non-GAAP Cash Flow |
Consolidated Cash Flow Statement |
|
|
£m |
£m |
|
Net cash flow from operations before tax |
9.3 |
18.9 |
|
Adjust for net movement in policyholder financial assets and liabilities |
- |
(0.2) |
|
|
9.3 |
18.7 |
|
Purchase of property and computer equipment (tangible and intangible) |
(0.3) |
(0.3) |
|
Dividends paid |
(6.1) |
(6.1) |
|
Net cash investment in new business |
(8.7) |
- |
|
Cashflows from investing activities |
- |
(0.3) |
|
Increase in amounts due to contract holders |
17.8 |
- |
|
Net Group cash movements |
12.0 |
12.0 |
Liquidity
Group cash and deposits rose to £78.5m (2025: £66.2m), held across immediately available funds, short-term deposits and highly rated money market funds.
|
Group bank deposits and money market funds |
2026 £m |
2025 £m |
|
Money market funds and immediately available cash |
63.1 |
50.9 |
|
Short-term deposits with credit institutions |
0.6 |
0.6 |
|
Cash and cash equivalents under IFRS |
63.7 |
51.5 |
|
Deposits and money market funds |
14.8 |
14.7 |
|
Group cash and deposits |
78.5 |
66.2 |
Balance sheet
The following abridged balance sheet presents the Group's shareholder position and excludes the offsetting impact of policyholder assets and liabilities. It is a non-GAAP presentation intended to aid understanding and should be read alongside the IFRS balance sheet contained in the financial statements.
|
|
2026 £m |
2025 £m |
|
Deferred origination costs |
102.0 |
106.3 |
|
Other assets |
59.5 |
47.7 |
|
Bank deposits and money market funds |
78.5 |
66.2 |
|
Total assets |
240.0 |
220.2 |
|
Deferred income |
132.9 |
137.5 |
|
Other payables |
90.5 |
66.2 |
|
Total liabilities |
223.4 |
203.7 |
|
Net assets |
16.6 |
16.5 |
Assets under administration
Contract holder assets under administration rose 11.6% to £1,260.6m (2025: £1,129.8m), driven by strong premium inflows and market performance, partly offset by withdrawals. AuA is held £1,209.6m by Hansard International and £51.0m by Hansard Europe, which has been in run-off since closing to new business in 2013.
|
Assets under administration |
2026 £m |
2025 £m |
|
Opening balance |
1,129.8 |
1,150.9 |
|
Regular premium deposits |
55.6 |
64.4 |
|
Single premium deposits |
73.4 |
54.5 |
|
Withdrawals and charges |
(193.0) |
(167.1) |
|
Market and currency movements |
194.8 |
27.1 |
|
Closing balance |
1,260.6 |
1,129.8 |
|
Movement in the year |
130.8 |
(21.1) |
Litigation
The Group made significant progress in addressing legacy litigation associated principally with Hansard Europe. During the year, the Board approved a settlement-led strategy for certain insured litigation matters and agreed a settlement approach for Italy with the Group’s insurers, reducing uncertainty and securing substantially improved legal cost recoveries.
At 30 June 2026, estimated contingent litigation exposure was £9.7m (30 June 2025: £20.4m). A provision of £5.6m (30 June 2025: £0.7m) was recognised for matters where negotiated settlement had become the most likely method of resolution. These costs are expected to be substantially recovered under the Group's insurance arrangements, with related insurance recovery assets and receivables totalling £7.9m (30 June 2025: £0.6m), comprising a £5.6m settlement recovery asset and £2.3m of receivables relating to historic defence costs. The Group also received £2.1m of cash insurance recoveries during the year (30 June 2025: £0.4m). Collectively, these developments materially reduced litigation uncertainty and improved visibility over the Group’s remaining exposure. Further details are provided in Note 26 to the Consolidated Financial Statements.
Capital
The Group remains well capitalised under risk-based capital methodologies, with solvency cover at 170%, well above regulatory requirements, supported by a conservative investment strategy and a prudent provisioning approach.
Dividend
An interim dividend of 1.8p per share was paid in April 2026 (£2.5m). The Board has recommended a final dividend of 2.65p per share (2025: 2.65p), giving a total for the year of 4.45p (2025: 4.45p), subject to shareholder approval. The net asset value per share at 30 June 2026 was 12.1p (2025: 12.0p), based on net assets of £16.6m and 137,557,079 shares in issue.
OUTLOOK
FY26 was a year of growth and recovery, and we enter FY27 with increasing commercial momentum, strengthened profitability and a clear strategic direction. Alongside our commercial progress, we have materially reduced uncertainty associated with legacy Hansard Europe litigation, providing greater clarity over the Group's future opportunities and allowing management to focus increasingly on growth and strategic execution. Expanding distribution capacity, increasing market penetration and growing assets under administration remain important priorities as we continue to execute our strategy across all areas of the business.
In FY27, we will continue to invest selectively in growth opportunities across our priority markets, while maintaining a strong focus on operational excellence, service quality, financial discipline and risk management. Key priorities include expanding our international distribution footprint, successful execution of our Japan strategy, enhancing our digital capabilities and adviser experience, progressing the Group's capital management initiatives and advancing the resolution of legacy Hansard Europe litigation to reduce the associated uncertainty.
The Board believes the Group has a significant opportunity to accelerate growth and create long-term shareholder value. However, realising that opportunity is not without challenge, the strategy will require consistent execution over multiple years, effective prioritisation of resources and the successful delivery of several interconnected commercial, operational and strategic initiatives. The principal risk to the achievement of our ambitions is therefore increasingly one of execution rather than strategy.
Successful execution will depend on the quality of our leadership, the strength of our culture and our ability to attract, develop and retain talented people across the organisation. As the business grows and evolves, maintaining organisational capability, strengthening leadership capacity and ensuring that accountability, collaboration and customer focus remain deeply embedded within the Group will be critical to delivering our objectives.
The Group remains strongly capitalised, debt-free, highly liquid and cash generative. While macroeconomic, geopolitical and market uncertainties remain, we believe Hansard is well positioned to pursue its strategic objectives from a position of financial strength. The Board remains confident in the long-term opportunity available to the Group, whilst recognising that disciplined execution, operational resilience and strong risk management will be essential to converting that opportunity into sustainable growth, profitability and long-term value for shareholders and other stakeholders.
RISK MANAGEMENT & INTERNAL CONTROLS
The Enterprise Risk Management Framework is well embedded within the Hansard Group governance arrangements and operating practices, reflective of the Board’s focus on effective risk management as an integral element of corporate success. The ERM Framework sets out the governance arrangements, principles, guidelines, practices and standards for risk management and internal control, which cumulatively ensure that the business is robustly prepared to identify, understand, and navigate the uncertainties and risks which it may encounter, and which can either pose threats or offer opportunities. The ERM Framework ensures that all such threats and opportunities, whether actual or emerging, are identified, assessed, monitored, managed, and reported using structured, consistent, and comprehensive methodologies. These arrangements seek to embed risk management within strategic decision-making and business planning activities and to continuously shape organisational values and culture. The maturity of the ERM Framework has enhanced its capacity to respond and adapt quickly to emerging risks and adapt to changes arising via the internal or external environment. This ensures that risk management and internal control remain central to the Board’s oversight, direction and control of the Group, and support informed decision making and sound business practices.
Work has been invested during the reporting period to prepare for disclosure obligations in respect of the monitoring and review of material controls under Provision 29 of the UK Corporate Governance Code 2024, which take effects for the 2027 reporting period. The underlying foundations of the ERM Framework together with the principles governing its application, its technical structuring and cyclical reporting conventions have readily enabled progression of these preparations, ensuring that:
- The Board can evidence and demonstrate its monitoring of the risk management and internal control framework throughout the year, via the established quarterly risk and control assessment, escalation and reporting cycles.
- The basis for the Board’s ongoing monitoring and annual review is robust and covers all material financial, operational, reporting and compliance controls, identified via the pre-existing mechanisms for the capture of principal risks.
- Substantive governance arrangements are in place to support both the formal declarations regarding the effectiveness of material controls, as at the balance sheet date, and to ensure the transparent disclosure of material controls determined to be ineffective in terms of either design or operation.
A limited number of enhancements have been required to pre-existing monitoring and reporting arrangements. These are now being actively deployed across the Group and will be accommodated within reporting for the financial year ending 30 June 2027.
Approach
Having regard to the Financial Reporting Council’s ‘Corporate Governance Code Guidance’, the ERM Framework continues to encompass the policies, processes, tasks, cultural attributes, behaviours, reporting conventions, and other aspects of the Group’s environment, which cumulatively:
- Support the Board’s determination of the nature and extent of the Group’s principal risks and the boundaries of risk appetite governing the pursuit and achievement of strategic objectives.
- Inform the Board’s understanding and assessment of existing, evolving, and emerging risks, together with combinations of those risks in the form of plausible stresses and scenarios, which have the potential to threaten the Company’s business model, future performance, solvency, liquidity, operational resilience, regulatory standing, or reputation. This includes analysis of the likelihood, impact, and time horizon over which such risks, or combinations of risks, might emerge or crystallise and determining how such risks should be managed or mitigated to reduce their likelihood or impact.
- Facilitate the effective and efficient operation of the Group and its subsidiary entities by enabling a consolidated and comprehensive approach to the management of risks across the Group, with specific attention to aggregate impacts and effects, enabling appropriate responses to significant business, operational, financial, compliance and other risks to business objectives, so safeguarding the assets of the Group.
- Determine and verify the quality of internal and external reporting. This requires the maintenance of proper records and processes that generate a flow of timely, relevant, and reliable information from within and outside the Group, enabling the Board to form their own view on the effectiveness of risk management and internal control arrangements through the regular provision of relevant information and assurances.
- Seek to ensure continuous compliance with applicable laws and regulations as well as with internal policies governing the conduct of business.
- Drive the cultural tone and expectations of the Board in respect of governance, risk management and internal control arrangements and the delegation of associated authorities and accountabilities.
The ERM Framework has been designed to be appropriate to the nature, scale, and complexity of the Group’s business at both corporate and subsidiary level. The ERM Framework components are reviewed on at least an annual basis and refined, if necessary, to ensure they remain fit for purpose in substance and form and continue to support the Directors’ assessment of the adequacy and effectiveness of the Group’s risk management and internal control systems. Such assessment depends upon the Board maintaining a thorough understanding of the Group’s risk profile, including the types, characteristics, interdependencies, sources, and potential impact of both existing and emerging risks on an individual and aggregate basis.
Risk governance arrangements
The Board retains ultimate responsibility for the ERM Framework and its effective operation, and the Directors are responsible for determining, evaluating, and controlling the nature and extent of the risks which the Board is willing to accept across the spectrum of risk disciplines. The Board has formally delegated certain responsibilities in respect of internal controls and risk management to the Audit and Risk Committee. These responsibilities are defined within the Committee’s terms of reference and provide for a range of important oversight and scrutiny protocols including:
- Continuous review of the Group's internal financial controls (being the systems established to identify, assess, manage, and monitor financial risks) and other internal control and risk management systems relating to financial reporting.
- Robust assessment of the emerging and principal risks facing the Group, identified, and reported via established ERM Framework components, and the provision of comfort to the Board that risks are being managed and controlled within the Board’s overall risk appetite.
- Ensuring that the ongoing monitoring arrangements, which form a core component of the quarterly cycle of assessment, analysis, escalation and reporting, and annual review, covers all material controls, including but not limited to, financial, operational, reporting and compliance controls. Independent evaluation of the ERM Framework, on at least an annual basis, to confirm that it remains adequate, effective, and proportionate to the nature, scale and complexity of the Group and the risks inherent to the Group’s business.
During the year ended 30 June 2026 the Group Risk Forum was replaced by an Executive Risk Committee (“ERC”) and an Operational Risk Committee as part of the transitional enhancements supporting compliance with Provision 29. The Executive and Operational Risk Committee structure provides enhanced cross-functional oversight of principal risks and material controls, with collaborative accountability and alignment for ensuring risk management decisions align with strategic priorities. The value of effective, dynamic interfaces between the governance, risk management and internal control conventions of the ERM Framework and those constituting the Group and subsidiary Own Risk and Solvency Assessment (“ORSA”) cycles is a core focus for the ERC.
The Group ORSA report reflects the cycle of ongoing activities and arrangements which enable the Board and the Executive Committee to properly assess and understand at a practical level the short and long-term risks facing the Group and the capital required to cover those risks, under both normal and stressed conditions. The ORSA considers the major sources of risk that the Group, or a subsidiary entity, may face under the principal and subordinate risk designations of the ERM Framework. Both internal and external risks are considered, together with emerging risks and any risks associated with the Group’s systems of governance. The ORSA includes capital, performance and strategic information and provides management with key information for decision making.
The disciplines of the ERM Framework seek to coordinate risk management in respect of the Group as a whole, including for the purpose of ensuring compliance with capital adequacy requirements, liquidity adequacy requirements and regulatory capital requirements, in line with the Isle of Man Financial Services Authority Risk-Based Capital Regime.
Governance, risk management and internal control protocols remain structured upon a ‘Three Lines’ model, which determines how specific duties and responsibilities are assigned and coordinated. First Line management are responsible for identifying risks, executing effective controls, and escalating risk issues and events to the Group’s Control Functions. The Group Risk and Compliance Functions oversee and work in collaboration with the First Line and provide Second Line oversight of governance, risk management and internal control and compliance arrangements, ensuring that the business is conducted in a manner consistent with rules, limits, and risk appetite constraints. The Group Internal Audit Department provides independent, Third Line assurance services to the Board and the Executive Committee on the adequacy and effectiveness of the Group’s governance, risk management and internal control arrangements.
The ERM Framework seeks to add value through embedding risk management and effective internal control systems as continuous and developing processes within strategy setting, programme level functions and day-to-day operating activities. The ERM Framework also acknowledges the significance of organisational culture and values in relation to risk management and their impact on the overall effectiveness of the internal control framework.
Emerging Risks
The ERM Framework continues to promote the pursuit of its overarching performance, information, and compliance objectives through focus on five interrelated elements, which enable the management of risk at strategic, programme and operational level to be integrated, so that layers of activity support each other. The five interrelated elements are defined as:
- Management oversight and the control culture.
- Risk recognition and assessment.
- Control activities and segregation of duties.
- Information and communication.
- Monitoring activities and correcting deficiencies.
In addition to existing risks the ERM conventions, which support delivery of the elements listed above, target emerging and evolving risks using both top-down and bottom-up bases. The top-down aspect involves the Board regularly analysing and evaluating the nature and extent of the principal risks to which the Group is or may be exposed, even where these may be difficult to assess and quantify. The bottom-up approach involves the identification, review and continuous monitoring of risk issues and emerging risks at functional and divisional levels, with analysis and formal reporting to the Operational and Executive Risk Committees on a quarterly basis. This allows actions to be developed or adapted on a timely basis and enables onward analytical reporting to the Board. These arrangements ensure that the Board remains aware of potential changes in risk profile on a forward-looking basis and sensitive to the materiality of potential impacts.
Stress and scenario testing is used to explore, assess, and quantify emerging risks as well as to analyse and assess any changes in existing aspects of the ‘Risk Universe’, which are monitored via the ERM Framework. Such assessment and analyses use both quantitative tests and qualitative assessments to consider reasonably plausible risk events, including those stresses and scenarios that could lead to failure of the business, approximated to the range of impact types which can be envisaged. The results of the stress and scenario testing are considered and explored by the Executive Risk Committee, the Audit and Risk Committee and the Board, as necessary and appropriate.
The system of internal control is designed to identify, understand, mitigate, and manage, rather than eliminate risk of failure to achieve business objectives, and seeks to provide reasonable, rather than absolute, assurance against material misstatement or loss.
Review of Risk Management and Internal Control Systems
The results of the risk management processes combine to facilitate identification of the principal financial, operational, reporting and compliance risks and any associated key risks at a subordinate level. Established reporting cycles enable the Board to maintain oversight of the quality and value of risk management and internal control activities throughout the year and ensure that the entirety of the governance, risk management and internal control frameworks, which constitute the ERM Framework, are operating effectively and as intended. These processes have been in place throughout the year under review and up to the date of this report.
Independently of its quarterly and ad hoc risk reporting arrangements the Board has conducted its annual review of the effectiveness of the Company’s risk management and internal control systems including financial, operational, reporting and compliance controls. This review has been undertaken in collaboration with the Audit and Risk Committee, based upon analysis and evaluation of:
- Attestation reporting from the key subsidiary companies of the Group as to the effective functioning of the risk management and internal control frameworks and the ongoing identification and evaluation of risk within each subsidiary.
- Formal declarations from Executive Managers, via quarterly risk and control self-assessments, that risks falling under their respective span of control are being managed and assessed appropriately and key controls are working effectively and as intended. Reporting continues to focus on progress updates relating to the timely and effective delivery of Management Actions to address identified control weaknesses, in accordance with the commitments recorded in the Group Risk Management Platform. For the year ended 30 June 2026 the Board has maintained focus on any residual challenges following the 2024 systems migration and the effectiveness with which these challenges have been resolved.
- The cumulative results of cyclical risk reporting by senior and executive management via the Risk Committee structure, having regard to the ‘five pillar’ disciplines of the ERM Framework, and associated analytical reporting to the Audit and Risk Committee by the Chief Risk Officer. This ensures a balanced assessment of the risks the Group is facing or may face, within the context of the Group’s risk appetite metrics, and the effectiveness of the systems of risk management and internal control in managing those risks. As we progress through the 2027 Financial Year formalisation of the Board’s ongoing monitoring and annual review of material controls will take full effect and become an integral component of the oversight and reporting cycles.
- 2nd Line Compliance monitoring and independent assurance work by the Group Internal Audit Department, as far as these have confirmed the effective operation of governance, risk management and internal control arrangements, or have identified areas for enhancement, and progress in delivery of respective management actions.
- The financial reporting errors that resulted in a restatement of certain 2025 balances, including the improvements to the control environment that have been subsequently implemented.
On the basis of the review completed the Directors remain satisfied that the governance, risk management and internal control systems, which constitute the Group’s ERM Framework, have operated effectively and as intended throughout the reporting period and to the date of approval of the annual report and accounts. The Group has continued to derive benefit from long-standing and well embedded ERM protocols and practices in terms of continued management of the post-migration environment and the effective handling of any residual issues which have emerged. These arrangements have enabled the Board to receive timely, transparent, comprehensive and balanced reporting on risk experience and to understand foreseeable impacts, whilst monitoring the Company’s ability to respond effectively to risk events and internal control weaknesses. As at the date of approval of the annual report there are no matters which require additional disclosure.
Financial Reporting Process
Integral to ERM monitoring and reporting arrangements are the conventions which ensure that the Board maintains a continuous understanding of the financial impacts of the Group failing to meet its objectives, due to crystallisation of an actual or emerging risk, or via the stress and scenario events, which the Board considers to be reasonably plausible. This includes those stresses and scenarios that could lead to a failure of the business. Planning and sensitivity analyses incorporate Board approval of forecast financial and other information. The Board receives regular representations from Senior Executives in this regard.
Performance against targets is reported to the Board quarterly through a review of Group and subsidiary companies’ results based on accounting policies that are applied consistently throughout the Group. Financial and management information is prepared quarterly by the Chief Financial Officer (“CFO”) and presented to the Board and the Audit and Risk Committee. The members of the Audit and Risk Committee review the interim financial statements for the half year ending 31 December and the full financial year and engage with the CFO to discuss and challenge the presentation and disclosures therein. Once the draft document is approved by the Audit and Risk Committee, it is reviewed by the Board before final approval by the Board.
Outsourcing
The majority of investment dealing and custody processes in relation to contract holder assets are outsourced under a formal contract to Capital International Limited (CIL, https://www.capital-iom.com/), a company authorised by the Isle of Man Financial Services Authority and a member of the London Stock Exchange. The contract is managed by a dedicated Relationship Manager against a documented Service Level Agreement, which includes Key Performance Indicators. CIL is required to confirm quarterly that no material control weaknesses have been identified in their operations; this is overseen via service delivery monitoring performed by the Relationship Manager. Each year CIL are required to confirm and evidence the adequacy and effectiveness of their internal control framework through a formal Assurance Report on Internal Controls, with an external independent review performed in 2026.
Our core policy administration platform is provided as a Software as a Service solution by Majesco (www.majesco.com). This covers all policy and advisor administration as well as the provision of the Hansard Client and Advisor online portals which support self-service administration. Monthly service meetings are held with Majesco with a formal annual review undertaken. Majesco also participates in scheduled security tests and simulations. The Majesco system code is held in escrow with the NCC Group, which supports contingency planning in the event of a failure of a provider. During the year, the Group further enhanced its contractual arrangements with the provider, which further strengthens business continuity arrangements and supports the long-term operation and development of the platform.
Manx Telecom (www.manxtelecom.com) provides our hosting services and core internet connectivity, which supports several core infrastructure elements such as our virtual desktops and servers. Manx Telecom data centres operate to Tier 3 standard and are ISO 27001 accredited. Monthly service meetings are held with Manx Telecom with a formal annual review undertaken. Manx Telecom is an active participant in scheduled security tests and simulations.
Risks Relating to the Group’s Financial and Other Exposures
Hansard’s business model involves the controlled acceptance and management of risk exposures. Under the terms of the unit-linked investment contracts issued by the Group, the contract holder bears the investment risk on the assets in the unit-linked funds, as the policy benefits are directly linked to the value of the assets in the funds. These assets are administered in a manner consistent with the expectations of the contract holders. The Group maintains a precise match between the investment assets held and the contract holder liabilities, and so the market risk and credit risk lie with contract holders.
The Group’s exposure on this unit-linked business is limited to the extent that income arising from asset management charges and commissions is generally based on the value of assets in the funds, and any sustained falls in value will reduce earnings. In addition, there are certain financial risks (credit, market, and liquidity risks) in relation to the investment of shareholders’ funds. The Group’s exposure to financial risks is explained in Note 3 to the consolidated financial statements.
The Board believes that the principal risks facing the Group’s earnings and financial position are those risks which are inherent to the Group’s business model and operating environment. The regulatory landscape continues to evolve at both a local and international level and the risk management and internal control frameworks of the Group must remain responsive to developments which may change the nature, impact or likelihood of such risks, or the time horizon within which they might crystallise.
Principal Risks
The following table sets out the principal inherent risks that may impact the Group’s strategic objectives, profitability, capital position, operational resilience or capacity to achieve continuing compliance and provides an overview of how such risks are managed or mitigated. The Board robustly reviews and considers its principal risks on at least a quarterly basis and for the year ended 30 June 2026 has continued to consider specifically the likelihood, impacts and timescales within which such risks might crystallise, together with assessment of contingent uncertainties and any emerging risks. No emerging risks have been identified during the reporting period, which require disclosure additional to the principal risks described below.
|
Distribution Risk: | |
|
The business environment in which the international insurance industry operates remains subject to continuous change and development as new market and competitor forces come into effect, regulatory landscapes evolve, and technological advancements are realised. Any failure by the Group to ensure that distribution strategy is well planned, governed and executed, or to anticipate the emergence of events or conditions which obstruct the achievement of business plan targets, can be expected to result in a range of adverse outcomes, including: -
| |
|
How we manage the risk: |
Close monitoring of marketplace and competitor activity for signs of threats to forecast new business levels. Strategy revisions identified via the 2026 strategic planning cycle are designed to add transformative scale to the business, via investment in new markets and existing markets, development of new key distributor relationships and new product initiatives. |
|
Market Risk: | |
|
Market risks remain an inherent element of the Group’s unit-linked business model, and these are regularly assessed and monitored via the quarterly ERM conventions governing risk monitoring, analysis and reporting, with particular scrutiny of:
| |
|
How we manage the risk: |
|
|
Credit Risk: | |
|
In dealing with third party financial institutions, including banking, money market and settlement, custody, reinsurers and other counterparties, the Group is exposed to the risk of financial loss and potential disruption of core business functional and operational processes. Financial loss can also arise when the funds in which contract holders are invested become illiquid, resulting in past and future fee income not being received. | |
|
How we manage the risk: |
|
|
Liquidity and Cashflow Risk: | |
|
If the Group does not have sufficient levels of liquid assets and cashflow to support business activities or settle its obligations as they fall due, the Group may be in default of its obligations and may incur significant sanction, loss, or cost to rectify the position. | |
|
How we manage the risk: |
|
|
Legal, Regulatory and Compliance Risk: | |
|
Sensitivity to legal, regulatory and compliance risks remain heightened as changing political landscapes and shifting supervisory attitudes towards evidencing regulatory effectiveness become increasingly visible across all key jurisdictions. The direction of regulatory travel and supervisory expectations, particularly in respect of obligations to prevent and detect financial crime, continue to evolve. The potential impacts associated with crystallisation of a significant legal or compliance failing, including financial penalties, public disclosures, reputational damage, restrictions on activities and other forms of intervention are material. The velocity of crystallisation and breadth of activities in scope demands an increasingly holistic approach to compliance with rigorous oversight and monitoring measures. Simultaneously the interpretation or application of regulation over time may impact market accessibility, broker relationships and / or competitive viability. If the Group fails to monitor the legal and regulatory environment or adequately integrate the management of associated obligations within strategic, business model or business planning processes there may be material risk to the achievement of strategic objectives both in the short and longer term. | |
|
How we manage therisk: |
|
|
Operational Resilience Risk: | |
|
The Board recognises operational resilience risks to be those threats, originating via internal triggers or via external events, with the capacity to undermine the Group’s capabilities to prevent, adapt and respond to, and recover and learn from operational disruptions. Resilience risk and associated management and mitigation arrangements directly extend to consideration of threats originating via third parties and external providers, supply chains networks and outsourcing architectures. The Board remain conscious that global supervisory attention is focussed on regulating for resilience by ensuring that strategies such as grounding resilience analyses in key delivery requirements, appreciating the potential for systemic vulnerabilities and embracing a diversity of approaches, combine to strengthen the ability of financial services firms to withstand operational risk related events. | |
|
How we manage the risk: |
|
|
Employee Engagement and Talent Risk: | |
|
‘Talent risk’ remains a key feature of the Group’s operational risk agenda, with continued evidence at industry level of the persistent challenges linked to attracting and retaining employees across all financial services sectors. The Group’s strategy has core dependencies on attracting and retaining experienced and high-performing management and employees and building a strong and sustainable culture, driven by our purpose, our leadership, our performance management regime and our governance principles and objectives. The Board regularly monitor the risks which would emerge in the event of any failure to attract, develop, engage and retain key personnel, recognising that the knowledge, skills, attitudes and behaviours of our employees, and the success with which these attributes shape and define our culture, are central to our success. | |
|
How we manage the risk: |
|
|
Corporate Sustainability Risk: | |
|
The Board remain alert to the inherent risks which would emerge in the event of failure to integrate environmental, social and governance considerations into the Group’s strategic and business planning activities, or to proactively review, understand and act on the challenges and opportunities presented. ERM protocols and work to support climate-related financial disclosures continue to assess the plausibility of climate-risk and broader sustainability stresses emerging over short-, mid- and longer-term time horizons. Associated analyses have focussed on the impact of the Group’s business on the environment as well as the capacity for future environmental disruption to the Group’s strategic and business plan objectives and targets, taking account of both physical and transition risks. | |
|
How we manage the risk: |
|
|
Cyber and Information Security Risk: | |
|
Consistent with previous reporting periods, the nature and complexity of cyber threats and cyber risk continue to present material inherent risk across the Financial Services industry. The Hansard Group remains highly sensitive to the iterative sophistication and persistence of cyber criminals and the relative accessibility of highly advanced, nation-state type tools targeting both jurisdictional and institutional infrastructures. The challenges in understanding and anticipating the nature of cyber threats and cyber risks are continuously evolving and risk analysis during the reporting period has confirmed that, over the longer-term, technological advances, including advances in generative AI, will enable new tools of disruption to be conceptualised and developed. ERM protocols recognise the threats presented by organised crime exploiting weaknesses in cyber defences, whilst new technological capabilities and use of third-party platforms add to the complexity of understanding the extent of cyber exposures, which may originate outside the traditional control perimeter. Cybercrime linked to geopolitical instabilities and malevolent actors continue to present significant hazards, with escalated risk of IT disruption and the potential for outages beyond corporate control. Simultaneously changes in technology and the rapid growth of high-speed, internet-enabled mobile devices presents a further dimension to this source of risk, providing cyber criminals with ever more options for ingress. The Board remain conscious that failure to take adequate and appropriate measures to protect its systems and data from the inherent risk of attack, disruption and/or unauthorised access by internal or external parties, could result in confidential data being exposed and/or systems interruption. A significant cybercrime event could result in reputational damage, regulatory censure, and financial loss. | |
|
How we manage the risk: |
Building resilience to continuously evolving cyber risk remains focussed on three core areas - cyber risk identification, cyber risk governance and cyber risk resilience in the event of any material failure in core business systems, or business processes. This approach drives: -
|
|
Culture and Conduct Risk: | |
|
Organisational culture remains under scrutiny by the Board on the basis that it is recognised as a fundamental driver of corporate success, prudential soundness, and compliant conduct. Failure by the Board to emphasise and drive the right corporate culture, to provide appropriate incentive schemes, or to implement, monitor and manage strong governance, risk management and internal control frameworks in respect of conduct can be expected to result in material detriment to the Group, a subsidiary and/or individual officers or employees. Risk impacts have the potential to crystallise in the form of disruption to the achievement of strategic and commercial objectives, regulatory censure, financial sanction, reputational damage and/or criminal proceedings, in extremis. Clear and heightened regulatory expectations of individual and corporate accountability continue to connect governance, risk, and compliance obligations directly to cultural imperatives and the responsibilities assigned to individual Senior Managers. | |
|
How we manage the risk: |
|
Further details around financial risks are outlined in Note 3 of the consolidated financial statements.
Philip Kay
Chairman
23 September 2026
CONTENTS
|
Board of Directors |
Page 34 |
|
Directors’ Report |
Page 36 |
|
Directors’ Responsibilities |
Page 42 |
|
Corporate Governance Report |
Page 44 |
|
Report of the Audit and Risk Committee |
Page 76 |
|
Report of the Nominations Committee |
Page 80 |
|
Directors’ Remuneration Report |
Page 83 |
BOARD OF DIRECTORS
The Directors serving at the date of approval of this Annual Report and Accounts are as follows:
Philip Kay
Non-executive Chairman
Chair of the Nominations Committee. Member of the Remuneration Committee.
Philip was appointed as Non-executive Chairman with effect from 1 May 2022. He was previously appointed as an Independent Non-executive Director with effect from 3 March 2020. Philip has had a long career in investment banking and investment management. He is Chair of Schroder Japan Trust PLC and a fellow of Wolfson College, Oxford. He is a former Managing Director and Senior Advisor of Credit Suisse First Boston where he ran the firm's global Japanese cash equity business. He is also a former Director of Fidelity Japan Trust PLC, of Schroder Securities Limited and of Smith New Court PLC.
Thomas Morfett
Group Chief Executive Officer
Tom was appointed as Chief Executive Officer with effect from 2 August 2024, prior to which he was Chief Financial Officer with effect from 17 April 2023. He is a Fellow of the Institute of Chartered Accountants in England and Wales, a Fellow of the Institute and Faculty of Actuaries, and holds an MA in Mathematics from Oxford University.
Prior to joining the group, Tom was Financial Controller and Head of Actuarial for the Utmost Isle of Man group of companies, having previously held the same positions for the Quilter International group of companies. He has extensive experience within the Isle of Man life insurance sector including as Appointed Actuary for Canada Life’s Isle of Man companies, and roles at Zurich Isle of Man and Royal London Isle of Man. He trained as a Chartered Accountant with Deloitte.
Ollie Byrne
Group Chief Financial Officer
Ollie was appointed Chief Financial Officer and Executive Director of Hansard Global plc on 1 October 2024. He is also an Executive Director of Hansard International Limited and Hansard Worldwide Limited.
Since joining Hansard in 1997, Ollie has held a range of senior leadership positions across the Group, including Chief Operating Officer, Chief Strategy Officer and Commercial Director. During his career with Hansard, he has led numerous strategic, operational and commercial initiatives, with particular experience in business transformation, technology, product development and organisational leadership.
Ollie is a Fellow of the Institute and Faculty of Actuaries and holds an MA in Numerical Analysis and a BA in Mathematics from Trinity College Dublin. He began his career with Guardian Life in Ireland and has more than 30 years' experience in the international life assurance industry.
David Peach
Independent Non-executive Director
Chair of the Audit and Risk Committee. Member of Remuneration and Nominations Committees.
David was appointed as an independent Non-executive Director with effect from 31 December 2020. David is a Fellow of the Institute of Chartered Accountants in England and Wales and a Fellow of the Association of Corporate Treasurers. He has a BSc in Economics from the University of Warwick. He is also a Non-executive Director of IntegraLife International Ltd and IntegraLife UK Ltd, as well as 3 small captive insurance companies.
After training as an accountant with KPMG, David has had more than 25 years’ experience in financial services. He has held board level roles in insurance, banking, trust, and fund management companies across a number of different jurisdictions.
Marc Polonsky
Non-executive Director
Marc was appointed as a Non-executive Director on 26 September 2018, having previously served as an alternate Director to Dr Leonard Polonsky since 26 September 2013. He is managing trustee of The Polonsky Foundation, a UK-registered charity supporting cultural heritage, the arts and humanities education. He is a Retired Partner from international law firm White & Case.
Lynzi Harrison
Senior Independent Non-executive Director
Chair of Remuneration Committee. Member of Audit and Risk and Nominations Committees.
Lynzi has served as an Independent Non-Executive Director of the Company since 11 December 2025. She is a Fellow of the Chartered Institute of Management Accountants (CIMA), a Chartered Member of the Chartered Institute of Personnel and Development (CIPD), and a member of the Chartered Institute for Securities & Investment (CISI). She also holds an MSc in Human Resource Management from the University of Winchester and a postgraduate qualification in Financial Strategy from the University of Oxford.
Lynzi has more than 30 years’ experience in the financial services industry. During her career, she has held board-level positions across the wealth management and insurance sectors in a number of jurisdictions, working with organisations including Old Mutual plc, Quilter plc and Liverpool Victoria (LV=). Lynzi currently serves on the boards of Omnilife Ltd, Diligenta Ltd and PRIMIS Group. She is also a non-executive member of the With-Profits Committee of Utmost L&P UK.
Lynzi is a strong advocate for diversity and inclusion within the financial services industry. She is a role model for LGBT Great, an initiative focused on advancing LGBT+ inclusion within financial services and has served as a UK UN Women ambassador for the past four years.
Directors' Report
Financial statements
The Directors have pleasure in submitting their Annual Report on the affairs of the Company and the Group together with the financial statements and the auditor’s report for the year ended 30 June 2026. Where the context requires “the Group” means Hansard Global plc and its wholly owned subsidiaries.
Hansard Global plc is the holding company of the Group and is a commercial company on London Stock Exchange’s Main Market. The Company is a limited liability company incorporated and domiciled in the Isle of Man.
Activities
The principal activity of the Company is to act as the holding company of the Hansard Group of companies. The activities of the principal operating subsidiaries include the transaction of life assurance business and related activities.
Principal operating subsidiaries
The following companies are wholly owned subsidiaries of the Company and represent its principal operating subsidiaries at the balance sheet date and at the date of this report. All companies are incorporated in the Isle of Man with the exception of Hansard Europe dac, Hansard Worldwide Limited and Hansard Development Services Middle East Limited. Hansard Europe dac is incorporated in the Republic of Ireland and was closed to new business with effect from 30 June 2013. Hansard Worldwide Limited is incorporated in The Bahamas.
|
Company |
Business |
|
Hansard International Limited* |
Life Assurance |
|
Hansard Europe Designated Activity Company |
Life Assurance |
|
Hansard Worldwide Limited |
Life Assurance |
|
Hansard Administration Services Limited** |
Administration services |
|
Hansard Development Services Limited |
Marketing and development services |
|
Hansard Development Services Middle East Limited |
Marketing and development services |
* Hansard International Limited has two overseas branches in Labuan and Japan.
** Hansard Administration Services Limited has a branch in Ireland.
Results and dividends
The results of trading of the Group for the year under IFRS are set out in the consolidated statement of profit or loss on page 106 and the consolidated statement of other comprehensive income on page 107. The consolidated financial statements have been prepared under IFRS. The financial statements of the parent company have been prepared under UK Generally Accepted Accounting Practice (“UK GAAP”), comprising Financial Reporting Standard 102.
Additionally, certain information relating to Own Funds and Risk Based Capital is presented in the “Other Information” section of this report on pages 160 to 162. The Board believes that such information provides additional meaningful information on the financial position and performance of the Group in a particular financial year than that provided by IFRS reporting alone.
Results under IFRS
Profit before tax for the year was £6.5m, compared with a profit before tax for the prior year of £1.0m.
Dividends totalling £6.1m were paid during the year (2025: £6.1m).
Proposed final dividend
The Board has resolved to pay a final dividend of 2.65p per share on 12 November 2026, subject to approval at the Annual General Meeting on 4 November 2026 (“AGM”), to shareholders on the register on 2 October 2026 (with the ex-dividend date being 1 October 2026). If approved, this would bring the total dividends in respect of the year ended 30 June 2026 to 4.45p per share (2025: 4.45p per share).
In making this decision, the Board has carefully considered its current and future cash flows, the risks and potential impacts introduced by the on-going geopolitical position, global economic conditions, the outlook for future growth and profitability, the views of key stakeholders, including shareholders and regulators. The Board also notes that Group retained earnings are negative as at 30 June 2026, and that this does not impact the parent Company’s ability to pay the proposed dividend.
Business review and future developments
A full review of the Group’s activities during the year, recent events and future developments is contained in the Chair’s Statement on pages 2 and 3, the Chief Executive Officer’s Review on pages 4 to 5, the Performance Highlights and Indicators on pages 6 to 9, the Business Model and Strategy on pages 10 to 12, the Financial Review on pages 13 to 18 and the Outlook on page 19.
Risk management and internal controls
Details of the Group’s risk management and internal control processes can be found on pages 20 to 32. A summary of the principal risks and uncertainties can be found on pages 25 to 32.
Corporate governance and corporate social responsibility
The Corporate Governance Report provides full details on the efforts made by the Group in the areas of corporate governance and corporate social responsibility within the business, including the information required under Rule 7.2.6 of the FCA's Disclosure Guidance and Transparency Rules and is incorporated into the Directors' Report by reference.
Audit and Risk committee
The Audit and Risk Committee Report outlines how the integrity of the financial reporting and audit process is overseen and the maintenance of sound internal controls and risk management systems.
Directors’ remuneration
Details of Directors’ remuneration for the year can be found in the Directors’ Remuneration Report.
Directors
Details of Board members at the date of this report, together with their biographical details, are set out on pages 34 to 35. Except where otherwise noted, all Board members served throughout the financial year and to the date of this report. In accordance with the Articles of Association all the Directors will retire at the AGM and, where applicable and eligible, shall seek election or re-election.
Share capital
At 30 June 2026 the Company’s issued share capital comprised 137,557,079 ordinary shares of 50 pence each. As at 30 June 2026 the total voting rights of the Company were 137,557,079. There have been no changes to the issued share capital and total voting rights during the period from 30 June 2026 until the date of this report.
Further details of the issued share capital together with details of authorised share capital and movements during the year are included in Note 22 to the consolidated financial statements. The Company has one class of share in issue, ordinary shares of 50 pence each, all of which are fully paid.
Each ordinary share in issue carries equal rights including one vote per share on a poll at general meetings of the Company, subject to the terms of the Company’s Articles of Association and applicable laws. Votes may be exercised by shareholders attending or otherwise duly represented at general meetings. Deadlines for the exercise of voting rights by proxy on a poll at a general meeting are detailed in the notice of meeting and proxy cards issued in connection with the relevant meeting. There are no restrictions on voting rights or on the transfer of shares.
Substantial shareholdings
At 30 June 2026 the Company had been notified of the following holdings in its share capital.
|
Name |
Shares (millions) |
% holding |
|
The Polonsky Foundation
|
58.4 |
42.5 |
|
Aberforth Partners LLP |
20.0 |
14.6 |
|
Mr M A L Polonsky * |
7.8 |
5.7 |
|
Premier Miton Group plc |
5.7 |
4.1 |
* Including holdings of spouse
There have been no significant changes in these holdings between the balance sheet date and the date of this report.
Employee Benefit Trust
An Employee Benefit Trust (“EBT”) was established in February 2018 for the purpose of providing share-based reward.
During the year, net share awards totalling 472,512 shares were granted to Directors and Executive Committee members, with the awards vesting after 3 years, subject to the rules of the Deferred Bonus Plan. 264,881 shares were purchased during the year and transferred into the EBT, to give a total of 1,012,015 shares held as at 30 June 2026 (2025: 1,086,914). Further information can be found in Note 24.2.
Share incentive schemes
Save As You Earn programme
A Save As You Earn share save programme allows eligible employees to have the opportunity of acquiring an equity interest in the Company. The Save As You Earn programme was renewed for a further ten years at the 2017 AGM.
At the balance sheet date there were no options outstanding (2025: no options), details of which can be found in the Report of the Remuneration Committee.
Research and development
The Group’s development activities focus on bringing new products to market to leverage distribution opportunities.
Information about securities carrying voting rights
The following information is disclosed in accordance with DTR 7.2.6 of the FCA’s Disclosure Guidance and Transparency Rules:
- the Company’s capital structure and voting rights are summarised on page 37.
- details of the Company’s substantial shareholders are set out on page 38.
- an amendment to the Company’s Articles of Association and the giving of powers to issue or buy back the Company’s shares requires an appropriate resolution to be passed by shareholders.
- the Company may alter its Articles of Association by special resolution at a general meeting of the Company.
- the appointment and replacement of Directors are governed by the Company’s Articles of Association. The Articles of Association provide that the Directors may be appointed by ordinary resolution of the shareholders or by the Board. The Company must have not less than two, and not more than 12 Directors. Where Directors are appointed by the Board, they may only hold office until the next AGM of the Company where they will be eligible for election. Each Director must then retire from office at each AGM. The Company may remove a Director by ordinary resolution.
Powers of Directors
Subject to the Articles of Association, the Isle of Man Companies Acts 1931 to 2004 and related legislation and any directions given by resolution of shareholders, the business of the Company will be managed by the Board which may exercise all the powers of the Company.
Directors’ interests
Directors’ interests in shares in the Company and in options granted under the Save As You Earn programme are disclosed in the Directors’ Remuneration Report together with details of their contractual arrangements with the Group.
Controlling Shareholder
The Polonsky Foundation was the controlling shareholder of the Group at 30 June 2026 following a transfer of 49,946,319 shares from the Leonard Polonsky Revocable Trust on 27 October 2025. The Board confirms that the Company has been able to carry on its main business activity independently of its controlling shareholder throughout the financial year.
Company Secretary
The Company Secretary at 30 June 2026 was Hazel Stewart.
Forward-looking statements
The Chair’s statement, the Group Chief Executive Officer’s overview, the Business and Financial Review and other sections of this Annual Report and Accounts may contain forward-looking statements about the Group’s current plans, goals and expectations on future financial conditions, performance, results, strategy, and objectives. Statements containing the words: ‘believes’, ‘intends’, ‘expects’, ‘plans’, ‘seeks’, ‘anticipates’ and other words of similar meaning are forward-looking. All forward-looking statements involve risk and uncertainty. This is because they relate to future events and circumstances that are beyond the Group’s control.
As a result, the Group’s future financial condition, performance and results may differ materially from the plans, goals and expectations set out in the forward-looking statements. The Company will not undertake any obligation to update any of the forward-looking statements in this Annual Report and Accounts.
Annual General Meeting (AGM)
The AGM of the Company will be held on 4 November 2026 at the Company’s registered office.
A copy of the notice of the AGM will be available to shareholders on www.hansard.com together with this Annual Report and Accounts. As well as the business normally conducted at such a meeting, shareholders will be asked to elect or re-elect all Directors. The Directors consider that all the resolutions to be put to the AGM are in the best interests of the Company and its shareholders as a whole and will be voting in favour of them. The Board undertakes to apply the United Kingdom Listing Rules (“UKLR”) in relation to the re-appointment of the Independent Non-executive Directors. This requires that re-election is by majority of votes cast by independent shareholders as well as by majority of all shareholders.
Copies of the Letter of Appointment for the Non-executive Directors will be available for inspection at the Company’s registered office during normal business hours and the AGM venue 15 minutes prior to the AGM until the conclusion of the AGM.
In accordance with the Group’s normal practice, the total number of proxy votes lodged at the meeting on each resolution (categorised as for; against; and votes withheld) will be made available both at the meeting and subsequently on the Company’s website.
The Board has undertaken a review of the Company's constitutional and corporate governance framework and has concluded that it is in the best interests of the Company and its shareholders to modernise its corporate structure. Accordingly, at the forthcoming Annual General Meeting, shareholders will be asked to consider and approve proposals for the Company to re-register as a company incorporated under the Isle of Man Companies Act 2006, ceasing to be a company governed by the Companies Acts 1931–2004.
The Directors believe that a re-registration to a 2006 Act company will provide a more modern and flexible corporate framework, simplify certain administrative and governance requirements and align the Company's constitutional arrangements with current market practice, while maintaining appropriate standards of corporate governance and shareholder protection.
Full details of the proposed re-registration and the proposed LTIP referred to in the Remuneration Report together with the reasons for the Board's recommendations and the resolutions to be considered, will be set out in the Notice of Annual General Meeting and accompanying shareholder circular.
Political donations
The Group did not make any political donations during the year (2025: £nil).
Adequacy of the information supplied to the auditor
The Directors who held office at the date of approval of this Directors’ Report confirm that, so far as each is aware, there is no relevant audit information of which the Company’s auditor is unaware, and each Director has taken all steps they ought to have taken as a Director to make himself aware of any relevant audit information and to establish that the Company’s auditor is aware of that information.
Auditor
Subsequent to completing the audit of these financial statements, KPMG Audit LLC will resign as auditor and be replaced by KPMG Audit Limited. KPMG Audit Limited (“KPMG”), being eligible, have expressed their willingness to be appointed in office. The Audit and Risk Committee has recommended that KPMG be appointed as the Company’s auditor. Accordingly, a resolution to appoint KPMG as auditor to the Company, and to authorise the Directors to determine its remuneration, will be proposed at the 2026 AGM.
Going concern
The Directors have at the date of approving the financial statements, a reasonable expectation that the Company and the Group have adequate resources to operate as a going concern for the foreseeable future, being a period of 12 months from the approval of the financial statements and have prepared the financial statements on that basis.
In making this statement, the Directors have considered the impact on the business of the ongoing geopolitical position and global economic conditions. They have reviewed financial forecasts that include plausible downside scenarios such as reduced levels of new business and higher expenses arising from increased inflation. These show the Group continuing to meet solvency requirements for at least the required 12 months from the date of approval of the financial statements and that the Group has sufficient cash reserves to enable it to meet its obligations as they fall due.
The Directors are encouraged by the positive trajectory of new business over the last two years, reflecting the benefits of the Group’s strategic initiatives, investment in distribution, and broader market opportunities. While recognising that macroeconomic geopolitical and market uncertainties remain and that new business levels may fluctuate over time, the Group’s outlook remains positive, supported by its growth strategy and diversified international distribution model. The long-term nature of the Group’s business means that any changes in new business volumes do not have an immediate impact on profitability or cash flows. In the event of a sustained deterioration in market conditions, the Group would continue to manage costs and capital prudently, including reviewing dividend distributions where necessary.
The following factors are considered as supportive to the Group’s resilience to external market and economic challenges:
- The Group’s business model focuses on long term savings products, a majority of which are regular premium paying products which continue to receive cash inflows regardless of the amount of new business sold.
- The Group earns approximately a third of its revenues from asset-based income which is not immediately dependent on sourcing new business.
- New business channels are geographically dispersed and therefore less exposed to specific regional factors.
- The largest cash outflow associated with new business is commission expenditure which reduces directly in line with reduced sales.
- The Group has and continues to the date of this report to have, a strong capital position with significant levels of liquidity and cash (as outlined in the Business and Financial Review).
- The Group places the majority of its shareholder assets into conservative, highly-liquid, highly rated bank deposits and money market funds. These are typically not subject to price fluctuation and protect the Group’s assets against potential market volatility.
- The Group has no borrowings.
Post balance sheet events
There have been no material post-balance sheet events, which would require disclosure in, or adjustment to, these consolidated financial statements.
Longer-term viability statement
The Directors have assessed the prospects of the Group over a five-year period and have a reasonable expectation that the Group will be able to continue in operation and meet its liabilities as they fall due over the period of assessment.
The Group and its insurance subsidiaries are required to maintain minimum regulatory solvency capital levels based on the size and nature of business written.
The assessment of prospects is considered over a five-year period as this matches the period over which business plans are considered by the Board. The Board also considers it a reasonable period in light of rapidly changing regulation, competitive landscape and technology advances and developments.
The Group’s business plan and associated scenario modelling includes projections of the Group’s profit, capital, liquidity, and solvency. Scenario and stress testing consider the Group’s capacity to absorb or respond to potential economic, contract holder activity or operational stresses. These include material investment market declines, interest rate movements, mass surrenders by contract-holders and operational losses. Reverse stress tests are also considered to provide insight into the level of stress needed to breach regulatory solvency requirements.
The assessment also considered simultaneous multiple adverse impacts that could plausibly occur. This included a 42% reduction to new business (for year one and 51% reductions in subsequent years), a 25% reduction in AuA due to market declines and recurring elevated expenses all arising at the same time. While these stresses produce lower levels of profit, cash, and dividends, none of them produce an immediate risk to the viability of the business. This allows therefore for compensatory management actions to be taken to secure longer-term viability through for example expense and dividend reductions.
In making its overall assessment, the Board has also considered the principal and emerging risks and associated mitigating strategies which it has identified and outlined on page 22 to 32. The Directors confirm that they have undertaken a robust assessment of the principal and emerging risks facing the Group.
Statement of Directors’ responsibilities in respect of the Annual Report and the financial statements
The Directors are responsible for preparing the Annual Report and financial statements in accordance with applicable law and regulations.
Company law requires the Directors to prepare Group and Parent Company financial statements for each financial year. Under that law they are required to prepare the Group financial statements in accordance with international accounting standards in conformity with the requirements of the Companies Acts 1931 to 2004 and applicable law and have elected to prepare the Parent Company financial statements in accordance with United Kingdom Accounting Standards, comprising Financial Reporting Standard 102 ‘The Financial Reporting Standard Applicable in the UK and Republic of Ireland’ (“FRS 102”).
Under company law the Directors must not approve the financial statements unless they are satisfied that they give a true and fair view of the state of affairs of the Group and Parent Company and of the Group’s profit or loss for that period. In preparing each of the Group and Parent Company financial statements, the Directors are required to:
- select suitable accounting policies and then apply them consistently.
- make judgements and estimates that are reasonable, relevant, and reliable.
- state whether they have been prepared in accordance with international accounting standards in conformity with the requirements of the Companies Acts 1931 to 2004 and as regards the group financial statements, UK adopted International Accounting Standards.
- assess the Group and Parent Company’s ability to continue as a going concern, disclosing, as applicable, matters related to going concern.
- use the going concern basis of accounting unless they intend either to liquidate the Group or the Parent Company or to cease operations or have no realistic alternative but to do so.
The Directors are responsible for keeping adequate accounting records that are sufficient to show and explain the parent Company’s transactions and disclose with reasonable accuracy at any time the financial position of the parent Company and to enable them to ensure that its financial statements comply with the Companies Acts 1931 to 2004. They are responsible for such internal control as they determine is necessary to enable the preparation of financial statements that are free from material misstatement, whether due to fraud or error, and have general responsibility for taking such steps as are reasonably open to them to safeguard the assets of the Group and to prevent and detect fraud and other irregularities.
Under applicable law and regulations, the Directors are responsible for preparing a Directors’ Report, Directors’ Remuneration Report and Corporate Governance Statement that comply with that law and those regulations.
The Directors are responsible for the maintenance and integrity of the corporate and financial information included on the Company’s website. Legislation in the UK governing the preparation and dissemination of financial statements may differ from legislation in other jurisdictions.
Responsibility statement of the Directors in respect of the annual financial report
We confirm that to the best of our knowledge:
- the financial statements, prepared in accordance with the applicable set of accounting standards, give a true and fair view of the assets, liabilities, financial position and profit or loss of the Company and the undertakings included in the consolidation taken as a whole; and
- the Directors’ Report includes a fair review of the development and performance of the business and the position of the issuer, and the undertakings included in the consolidation taken as a whole, together with a description of the principal risks and uncertainties that they face.
- the Directors consider the annual report and accounts, taken as a whole, is fair, balanced and understandable and provides the information necessary for shareholders to assess the Company’s position and performance, business model and strategy.
By Order of the Board
Hazel Stewart
Company Secretary
23 September 2026
Corporate Governance Report
Compliance with Companies Acts
As an Isle of Man incorporated company, the Company’s primary obligation is to comply with the Isle of Man Companies Acts 1931 to 2004. The Board confirms that the Company is compliant with the relevant provisions of the Companies Acts.
Compliance with the UK Corporate Governance Code 2024 (“the Code”)
The Board believes that high standards of corporate governance are fundamental to the successful delivery of the Group’s strategy and the creation of long-term value for shareholders. Accordingly, the Board remains committed to maintaining robust governance arrangements and promoting the highest standards of corporate conduct throughout the Group.
During the year under review, the Group applied the principles and complied with the provisions of the Code, except as otherwise explained in this Corporate Governance Report. The Board considers that the Company’s governance framework is appropriate to the size, complexity and nature of the Group’s business and supports effective decision-making, accountability and risk management.
A copy of the Code is available on the Financial Reporting Council website at www.frc.org.uk.
The following specific information required in the Directors’ Report is included in other sections of this Annual Report and is incorporated by reference:
|
Board leadership and Company purpose.
The Board’s overarching role is to promote the Company’s long-term sustainable success, to generate value for shareholders and improve customer outcomes by providing simple, understandable and innovative financial solutions.
|
A Effective and entrepreneurial Board
B Purpose, values, strategy and culture
C Resources and controls
D Stakeholder engagement
|
Pages 50-53
Pages 5, 10
Pages 13-32
Pages 45-49 |
|
Division of responsibilities
The Board has a clear division of responsibilities between the leadership of the Board and executive leadership of the business.
Committee terms of reference determine the authority of each of the Board’s Committees.
Governance arrangements are in place to ensure that the Board and Directors can meet their obligations under the Code.
|
F Role of the Chairman
G Independence and division of responsibilities
H Non-Executive Directors
I How the Board operate
|
Page 50
Pages 51-52
Page 51
Pages 52-53 |
|
Composition, succession and evaluation
The Board, with the support of the Nominations Committee, conducts regular reviews of its composition (and that of its Committees) and leads the process for appointments to ensure plans are in place for orderly succession to both the Board and the Executive Committee.
The Board undertakes an annual review of its effectiveness and that of its Committees to ensure that the Board and its members continue to contribute effectively. |
J Appointments and succession planning
K Composition of the Board
L Board evaluation |
Pages 38, 81
Pages 50-51
Page 53 |
|
Remuneration
The Board, supported by the Remuneration Committee, ensures that the remuneration policies and practices are designed to support strategy and promote long-term sustainable success. |
P Alignment of remuneration with strategy, purpose and values
Q Remuneration policy
R Independent judgment, discretion and performance outcomes
|
Page 83
Page 84
Page 84 |
Other statutory disclosures
|
Directors of the Group |
Pages 34-35 |
|
Dividends |
Page 36 |
|
TCFD Reporting (including climate-related risks and opportunities) |
Pages 60-75 |
|
Future Prospects |
Page 12 |
|
Going concern Statement |
Pages 100, 114 |
|
Post balance sheet events |
Page 41 |
|
Reporting under Section 172 of the (UK) Companies Act 2006 and engagement with stakeholders |
Pages 45-49 |
|
Risk Management and Internal Controls |
Pages 20-32 |
Details on how we have applied the provisions and principles of the Code to our activities throughout the financial year and to the date of this report are set out in this Corporate Governance Report and/or in the following reports: the Directors’ Report, the Report of the Audit and Risk Committee, the Report of the Nominations Committee, and the Directors’ Remuneration Report.
For the year ended 30 June 2026, the Board considers that it has complied in full with the provisions of the Code, other than in respect of Provision 36 as further outlined in the Remuneration Report.
The Company did not comply with Provision 11 of the Code throughout the year as fewer than half of the Directors, excluding the Chair, were considered by the Board to be independent non-executive directors. The Board believes that the current composition of the Board provides an appropriate balance of skills, experience, knowledge and independence for the effective governance of the Group. All Directors contribute actively to Board discussions and decision-making, and independent challenge is provided by the Company's independent non-executive Directors. The Board and the Nominations Committee keep the composition of the Board under regular review and will continue to consider opportunities to strengthen further the proportion of independent non-executive representation, having regard to the size and circumstances of the Company.
Stakeholders
Stakeholders are critical to the Company's long-term, sustainable success. They are our shareholders, employees, regulators, distribution partners, service providers, and the communities in which we operate. This section explains why and how the Company interacts with these stakeholders, as well as the steps it takes to ensure that their interests are considered in the Board's decision making.
As the Company is listed on the Main Market of the London Stock Exchange, it reports on its compliance with the Code on a comply or explain basis. Provision 5 of the Code recommends that the Company report on how the interests of its key stakeholders were considered in board discussions and decision-making, including those matters outlined in Section 172 of the UK Companies Act 2006 (the "UK Companies Act"). While the Company is not domiciled in the United Kingdom, we have chosen to voluntarily report in accordance with Section 172 of the UK Companies Act to demonstrate our commitment to best practice governance and thorough application of the Code.
The tables on the following pages show how the Company and its Board interact with its stakeholders. We recognise that these relationships are the foundation for the Company's long-term viability, which benefits all parties. The Board recognises the significance of upholding a high standard of business conduct and stakeholder engagement, as well as having a positive impact on the environment in which we operate.
We actively engage with our key stakeholders to understand their perspectives and build effective relationships, and our engagement strategy for each stakeholder group is outlined in the tables on the following pages. Aside from stakeholder considerations, the Board recognises its responsibility to consider long-term impacts and the Company's impact on and from wider society and the environment.
The Board monitors performance against strategy and appropriate decision-making by receiving regular updates, both in Board and Committee meetings and through regular Board reports from the CEO, CFO, Executive Committee members, and other senior managers, all of which enable it to make well-informed principal decisions for the Company's and its various stakeholders' long-term success. We define principal decisions as those that are both material to the Group and significant to any of our key stakeholder groups. In making principal decisions, the Board has considered the outcome from its stakeholder engagement as well as the need to maintain a reputation for high standards of business conduct and the need to act fairly between the members of the Company. The Board believes that the Group's decision-making is balanced, and that Hansard's policies and actions meet the Group's obligations.
How the Board Promotes the Long-Term success of the Company
The Directors recognise that their overarching duty, both individually and collectively, is to act in good faith and in a manner most likely to promote the success of the Company, as defined in Section 172 of the UK Companies Act, for the benefit of shareholders as a whole, taking into account, among other things:
|
The likely consequences of any decision in the long term The Board’s focus is on ensuring that the Company generates and preserves value over the long term for all its shareholders. The Board’s aim is to make sure that decisions are consistent with the strategic objectives of the Company and the long-term success of the Company.
|
|
The interests of the Company’s employees The Board engages with employees via a variety of mechanisms and forums to ensure that employees interests are considered.
|
|
The need to foster the Company’s business relationships with suppliers, customers, and others The Board considers customers, suppliers, and other stakeholders, factoring in their needs, feedback, and concerns to make informed decisions that seek to benefit all parties. This ensures a balanced and sustainable business relationship. |
|
The impact of the Company’s operations on the community and the environment The Board’s corporate social responsibility (“CSR”) strategy focuses on minimising the Group’s environmental impact, making a positive contribution to society and supporting our people to make a difference to the environment.
|
|
The desirability of the Company maintaining a reputation for high standards of business conduct The Company has five core values that are the foundation of the Company’s culture: Trust, Integrity, Respect, Quality, and Innovation. These values ensure that the Company maintains a reputation for high standards in all areas of the business it conducts.
|
|
The need to act fairly between shareholders of the Company The Board actively engages with shareholders and considers their interests when setting the Company’s strategy.
|
Shareholders
|
Shareholders Our shareholders include institutional investors, retail investors, and management, among others.
|
|
Why we engage The Board recognises the importance of regularly engaging with shareholders in order to maintain a high level of transparency and accountability, to act fairly, and to inform the Company's decision making and future strategy. The Board is accountable to the shareholders for creating and delivering value through effective business governance.
|
|
How we engage The Group places considerable importance on developing its relationships with our shareholders and it aims to achieve this by way of the following regular communication activities: § regular dialogue with major institutional shareholders, both directly and through the Company’s advisers. § Annual General Meetings. § market announcements, corporate presentations, Annual Report and Accounts and other Company information which are available on our website at www.hansard.com
The Chair, the CEO, the CFO, and Committee Chairs are available to meet or correspond with major shareholders to discuss any areas of concern not resolved through normal channels of investor communication.
Arrangements can be made through the CFO, the Company Secretary, or the Company’s corporate brokers.
The Board is equally interested in communications with private shareholders and the CFO oversees communication with these investors. All information reported to the regulatory information services is simultaneously published on the Company’s website, affording the widest possible access to Company announcements.
The Board receives regular feedback on the views of shareholders on the Company from the Executive Directors after meetings with those shareholders, as well as from reports from the Company’s corporate brokers, the Chair and the Senior Independent Director.
There were no significant areas of concern raised during the 2026 financial year.
|
Employees
|
Employees We recognise that to meet our Company goals, we need to retain, attract and develop our talent pool, by providing a supportive and safe workplace where our employees can develop and thrive.
|
|
Why we engage We understand the importance of engaging with our employees and recognise that the Company culture and our overall remuneration and benefits package can have significant effect on employees. Communication therefore continues to be a key part of our Culture journey. We want our employees to have a voice, feel appreciated for their contribution and to understand their roles within the Company. It’s important that our employees are made aware of key business updates and that they can provide feedback on what’s important to them. We work hard to meet our employees' needs and to maintain strong relationships that foster a positive workplace culture.
|
|
How we engage We actively and regularly communicate with our employees via various mechanisms covering matters such as strategic updates, business performance and culture or any other matters which are relevant to employees. Our employees are also offered opportunities to provide feedback in different ways such as engagement and culture surveys and in team and individual settings. We provide regular training and development opportunities for our employees and make sure they receive regular feedback and recognition, supported via the performance management framework. We strive to provide a supportive and safe and comfortable working environment, as well as competitive wages and benefits. We encourage all our employees to provide feedback to the Board and provide open channels of communication for them to do so. David Peach is the designated Independent Non-executive Director for employee engagement.
|
Regulators
|
Regulators These are the governmental or regulatory bodies in charge of overseeing the Company's operations and ensuring compliance with applicable laws and regulations. Each of our regulators is in charge of overseeing various aspects of the Company's operations, including financial reporting and consumer protection.
|
|
Why we engage We work with our regulators to ensure that we are compliant with all policies, laws, and regulations. Regular communication with our regulators assists us in identifying potential risks and obtaining guidance on how to mitigate them.
|
|
How we engage The Company meets with its regulators proactively to address any concerns, and it establishes regular meetings to ensure that the Company is up to date on any proposed changes. We make every effort to respond to any queries or requests for information from our regulators in a timely manner. |
Distribution Partners
|
Distribution partners Those who assist the Company in distributing our products to our policyholders. Distribution partners are subject to a rigorous selection process prior to onboarding, and regular monitoring throughout the course of the business relationship.
|
|
Why we engage We understand the importance of maintaining positive relationships with our distribution partners in order to ensure that our products reach customers on time and accurately represent our brand.
|
|
How we engage All our distribution partners are supported by our regional sales managers, who provide regular training updates on our product range and any relevant regulation changes, as well as discussing new business development opportunities. This is further supported by regular daily contact around sales opportunities or operational queries to ensure that they receive the best service and to ensure they are knowledgeable about all the Company's products and processes.
|
Service Providers
|
Service Providers Those upon whose services the Company relies on to provide its products and services, both domestically and internationally.
|
|
Why we engage To ensure that the services on which the Company places reliance are delivered to the Company’s required standards and timelines.
|
|
How we engage We receive regular attestations from service providers and meet frequently to review the performance of services.
|
Communities
|
Communities The locations in which the Group maintains its operations, and in which our employees live.
|
|
Why we engage We appreciate that we have a responsibility to support our local communities.
|
|
How we engage As noted in Corporate Social Responsibility below, we encourage our employees to support local causes. We provide funding for a wide range of initiatives via the Green Team, and we provide our employees with dedicated time allowing them to participate in community engagement activities. We partner with local organisations directly where appropriate.
|
Compliance with the Market Abuse Regulation
To ensure compliance with the Market Abuse Regulation (“MAR”), the Company maintains internal policies, procedures, and controls in respect of market abuse, market manipulation and insider dealing. A Share Dealing Code is in place which all employees must adhere to. The Company has complied with this Share Dealing Code and MAR throughout the period.
Role of the Board of Directors and its principal Committees
The primary role of the Board is to provide leadership of the Company. The Company is directed and controlled both by its Board of Directors and through systems of delegation and escalation, to achieve its business objectives in accordance with high standards of transparency, probity, and accountability.
It achieves these goals by making decisions relating to key areas for the business, by overseeing the activities of the executive team, and by delegating certain matters for resolution through the principal Board Committees, namely the Audit and Risk Committee, the Executive Committee, the Nominations Committee and the Remuneration Committee.
The specific duties of the Board are clearly set out in a Schedule of Reserved Powers that addresses a wide range of corporate governance issues and lists those items that are specifically reserved for decision by the Board.
The primary responsibilities of the Board include, but are not limited to:
- formulation of medium- and long-term direction and strategy for the Group.
- establishment of capital structure and dividend policy.
- ensuring the Group’s operations are well managed and proper succession plans are in place.
- review of major transactions or initiatives proposed by management.
- implementation of policy and procedures to support the governance framework of the Group.
- regular review of the results and operations of the Group.
- ensuring that proper accounting records are maintained, and adequate controls are in place to safeguard the assets of the Group from fraud and other significant risks.
- regular evaluation of Board performance.
- oversight of the Group’s ERM Framework; and
- decisions regarding the Group’s policy on political donations.
The duties of the principal Board Committees are detailed in the relevant terms of reference, which are reviewed annually and are available on the Company’s website, www.hansard.com.
Board composition and key roles
At the date of this report the Board comprises the Non-executive Chair, two Independent Non-executive Directors, one Non-executive Director and two executive Directors: the Group Chief Executive Officer and the Group Chief Financial Officer.
As required by the Articles of Association, all Board members will offer themselves for election or re-election at the forthcoming AGM.
The Board supports greater transparency regarding the election and re-election of Independent Non-executive Directors. In compliance with the UKLR, the Company operates a dual voting structure for any resolutions on the election and re-election of the Independent Non-executive Directors. The results from the AGM votes on any such resolutions, together with other information normally circulated following the conclusion of the meeting, will be disclosed through the Regulatory Information Services following the conclusion of the AGM. In the event that the majority of independent shareholders are shown to have voted against these resolutions, a further vote will be called after 90 days.
Chairman
Philip Kay was appointed the Company’s Non-executive Chairman with effect from 1 May 2022. As required by the Code, Philip was considered independent upon appointment. The Chair leads the Board within a solid governance framework and ensures that the Board provides effective leadership for the Group including strategy and direction.
Group Chief Executive Officer
As Chief Executive Officer, Thomas Morfett leads the senior executive team in the day-to-day running of the Group’s business, including execution of the Group’s business plans and objectives and communicating its decisions and recommendations to the Board.
The division of responsibilities between the Chair and the Chief Executive Officer is clearly defined and has been approved by the Board. The Chair has no day-to-day involvement in the management of the Group. The Chief Executive Officer has direct charge of the Group on a day-to-day basis and is accountable to the Board for the financial and operational performance of the Group.
Group Chief Financial Officer
Ollie Byrne was appointed Chief Financial Officer on 1 October 2024. He leads the Group's Finance, Actuarial, Investment and Commercial functions and is a member of the Executive Committee.
Senior Independent Director
Lynzi Harrison is the Company’s Senior Independent Director. The Senior Independent Director provides a sounding board for the Chair and serves as an intermediary for the other Directors and is also available to shareholders should they have any concerns that they are unable to resolve through other channels, or when such channels would be inappropriate.
The responsibilities of the Chair, Group Chief Executive Officer and Senior Independent Director are available on the Company’s website, www.hansard.com.
Non-executive Directors
David Peach and Lynzi Harrison are considered by the Board to be Independent Non-executive Directors in accordance with the Code definition. Philip Kay, as Non-executive Chair, was considered independent on appointment. Marc Polonsky, a Non-executive Director, is not considered to be independent for the purposes of the Code resulting from his representation of the Polonsky Foundation shareholding.
The Non-executive Directors fulfil a critical role to constructively challenge all recommendations presented to the Board for approval and to provide the benefit of their experience and expertise to manage risk within the Group and enhance delivery of the overall strategy.
Board independence
The Board’s policy is to appoint and retain Independent Non-executive Directors who can apply their wider knowledge and experiences to their understanding of the Group. The process for appointing new Directors is conducted by the Nominations Committee.
It is the Board’s view that an Independent Non-executive Director also needs to be able to present an objective, rigorous and constructive challenge to management. To be effective, an Independent Non-executive Director needs to acquire a sound understanding of the industry and the Company to be able to evaluate properly the information provided.
Each Independent Non-executive Director serves for a fixed term not exceeding three years that may be renewed by mutual agreement and subject to shareholder approval at the AGM. Subject to the Board being satisfied with a Director’s performance, independence and commitment, an Independent Non-executive Director may have their terms renewed for up to nine years. Beyond that period, a Director would typically be considered to no longer be fully independent.
A review of the arrangements affecting all Non-executive Directors who served during the year covering the current term of appointment and review of their independence (where relevant) was undertaken by the Nominations Committee.
The Committee was satisfied that, based on their performance during their time on the Board, David Peach and Lynzi Harrison were, and remain independent.
Philip Kay, as Chair, was considered independent upon appointment.
Board meeting attendance
The Board meets regularly to determine the Company’s strategic direction, to review the Company’s operating and financial performance and to provide oversight that the Company is adequately resourced and effectively controlled.
The Company requires Directors to devote sufficient time to the Company in order to perform their duties. If Directors are not able to attend a meeting, they have the opportunity to submit their comments in advance to the Chair or the Company Secretary. If necessary, they can follow up with the Chair of the meeting.
The attendance of the Directors at scheduled Board and Committee meetings of which they were a member held during the year (and the maximum number of meetings that each Director could have attended) were as follows:
|
|
Board |
Audit and Risk |
Nominations |
Remuneration |
|
Number of meetings |
6 |
5 |
3 |
4 |
|
Philip Kay |
6/6 |
|
3/3 |
4/4 |
|
Noel Harwerth* |
0/2 |
0/2 |
0/1 |
0/1 |
|
Marc Polonsky |
6/6 |
|
|
|
|
David Peach |
6/6 |
5/5 |
3/3 |
4/4 |
|
Lynzi Harrison |
6/6 |
5/5 |
3/3 |
4/4 |
|
Thomas Morfett |
6/6 |
|
|
|
|
Ollie Byrne |
6/6 |
|
|
|
*Resigned 5 November 2025
The Chair of the relevant Board or Committee invited other Non-executive Directors to attend meetings of which they were not a member whenever considered appropriate. The CEO and CFO have standing invitations to Audit and Risk Committee meetings. Marc Polonsky attended or partially attended 4 Audit and Risk Committee Meetings, 3 Nominations Committee Meetings and 4 Remuneration Committee meetings.
Board committees
The Board has established standing committees to oversee important issues of policy and maintain such oversight outside the main Board meetings. Each committee operates within defined terms of reference, which can be accessed on the Company’s website. The committee positions held by the Directors as at the date of this report are summarised below:
- Audit and Risk Committee - Chair: David Peach. Members: Noel Harwerth (until 5 November 2025), Lynzi Harrison.
- Executive Committee - Chair: Thomas Morfett.
- Nominations Committee - Chair: Philip Kay. Members: David Peach, Noel Harwerth (until 5 November 2025), Lynzi Harrison.
- Remuneration Committee - Chair: Lynzi Harrison (with effect from 24 July 2025). Members: David Peach, Philip Kay, Noel Harwerth (until 5 November 2025).
The Chairs of the relevant Board Committees are available to engage with shareholders on any significant matters related to their areas of responsibility.
Reports from the Audit and Risk, Nominations and Remuneration Committees are set out in this Annual Report and Accounts, together with a summary of their activities during the year.
The Executive Committee is chaired by the Group Chief Executive Officer and currently meets fortnightly. The Executive Committee has responsibility for the day-to-day management of the Group, and other items as delegated from time to time by the Board. In addition to Thomas Morfett, the Executive Committee is currently comprised of Keith Brown (Head of Sales), Ollie Byrne (Chief Financial Officer), Alan Canny (Chief Actuary), Karen Corran (Head of People and Culture), Angela McCraith (Chief Risk Officer), Hazel Stewart (General Counsel & Company Secretary), Philip Story (Chief Distribution Officer) and John Whitehouse (Chief Transformation Officer).
Board processes
The agenda for each Board and Committee meeting is considered by the Chair or Committee Chair and the papers for each meeting are distributed by the Company Secretary to the Board or Committee members beforehand. As a standard agenda item during the scheduled Board meetings, the Chair and Non-executive Directors meet without the executive Directors present. The Chair maintains regular contact with the Chief Executive Officer and with the Non-executive Directors, outside of Board meetings or calls, in order to discuss specific issues.
Board performance review and effectiveness
The effectiveness of the Board is vital to the success of the Group. The Company undertakes a performance review each year to assess the performance of the Board, its Committees, the Directors, and the Chair. The Board engaged Boston Limited to conduct a board performance review in the year. The performance review took the form of a questionnaire, where Directors were required to rate certain aspects of the Board’s and Committees’ performance. The questionnaire also gave Directors the opportunity to provide comments on areas of focus, which included the structure of the Board, effectiveness of the Board, and committee-specific questions.
The responses to the performance review of the Board and the Committees were collated and analysed by the Chair and the Senior Independent Director. The results indicated that the Board continues to work well and there were no significant concerns among the Directors about the Board’s effectiveness. As part of the Chair’s performance review the Independent Non-executive Directors meet separately under the leadership of the Senior Independent Director who, in turn, engages in reviews with the Chair.
Following these reviews, the Directors have concluded that the Board and its Committees operate effectively. Additionally, the Chair and the Senior Independent Director have concluded that each Director contributes effectively and demonstrates full commitment to his duties.
Remuneration of Directors
The principles and details of Directors’ remuneration, as well as the composition and activities of the Remuneration Committee, are contained in the Directors’ Remuneration Report.
Insurance
The Company maintains insurance cover with respect to the liabilities of Directors and Officers within the Group. In addition, qualifying third party indemnity arrangements are in force for the benefit of the Directors within the Group and were in force for the benefit of former Directors of the Group during the year under review.
Board support
Directors are fully briefed in advance of Board and Committee meetings on all matters to be discussed. The Company Secretary is responsible for following Board procedures and advising the Board, through the Chair, on governance matters. All Directors have access to her advice and services.
The Board has adopted a procedure whereby Directors may, in the performance of their duties, seek independent professional advice at the Company’s expense if considered appropriate.
Directors of the life companies are required to complete several mandatory training sessions during each year, for example on Anti-Money Laundering responsibilities (provided by the Money Laundering Reporting Officer or an external supplier). Training and support is also provided on any other key topics that the Board feel appropriate in addition to their individual Continuing Professional Development requirements.
Risk management and internal controls
The Board has overall responsibility for the Group’s systems of risk management and internal control, and for reviewing their effectiveness. The Board recognises that the governance risk management and internal control arrangements which constitute the ERM Framework are intended to reduce, although cannot eliminate, the range of possibilities which might cause detriment to the Group. Similarly, the ERM Framework cannot provide protection with certainty against any failure of the Group to meet its business objectives, or guard against material errors, losses, fraud, or breaches of laws and regulations. Taking all of these factors into account the ERM Framework is intended to provide reasonable, but not absolute, assurance against material misstatement or losses and / or the breach of any laws or regulations.
The primary responsibility for developing and implementing internal control and risk management procedures covering all aspects of the business lies with the Executive Committee. As part of the reporting processes from the ERM Framework, the Board regularly receives written reports covering all such aspects in addition to overseeing controls and risk management procedures via the Audit and Risk Committee.
Individual managers have primary responsibility for ensuring compliance with Group policies, principles, and compliance obligations within their respective span of control. This includes the identification, evaluation, monitoring, management, and reporting of risks within their areas of responsibility. The substance and form of risk management activities and the quality of their application are regularly reviewed by the Executive Risk Committee and objectively analysed and evaluated by the Group’s Internal Audit function, with oversight by and reporting to the Audit and Risk Committee, which is ultimately responsible for reporting on the same to the Board.
Processes for identifying, evaluating, and managing the risks faced by the Group have been in place throughout the year under review and up to the date of this report. They are regularly reviewed by the Board, with the assistance of the Audit and Risk Committee.
The Board, through the Audit and Risk Committee, has reviewed the effectiveness of the Company’s risk management and internal control systems including material controls. On the basis of the review completed the Directors are satisfied that the governance, risk management and internal control systems, have operated effectively and as intended throughout the reporting period and to the date of approval of the annual report and accounts. Additional details in respect of this review are described at page 23 of the Report. As at the date of approval of the annual report there are no matters which require additional disclosure.
The Board has further undertaken a robust assessment of the principal risks facing the Group, including those that would threaten its business model, future performance, solvency, or liquidity, in accordance with provision 28 of the Code. Additional information on the principal risks and uncertainties faced by the Group, together with steps taken to manage them, can be found within the Principal Risk Report on pages 25-32.
Whistleblowing arrangements
The Group has an established Whistleblowing Policy, which is accessible to all employees, with new starters introduced to the Policy and its objectives during induction training. The Policy is designed to ensure the principles of, responsibilities for, and the approach to effective management of whistleblowing are clearly explained and that employees are empowered and supported to raise concerns, in confidence, where they have a reasonable belief of actual or potential wrongdoing. The Policy recognises that for some individuals raising a concern under the Group’s Whistleblowing arrangements may be a daunting or difficult experience and so provides for such concerns to be raised anonymously and/or outside the Management reporting line if preferable, providing for direct access to the Chief Risk Officer or the Chair of the Audit and Risk Committee.
Financial reporting process
The Group maintains a process to assist the Board in understanding the risks to the Group failing to meet its objectives. This incorporates a system of planning and sensitivity analysis incorporating Board approval of forecast financial and other information. Operational management reports monthly to the Executive Committee on a wide range of key performance indicators and other significant matters, whilst quarterly reporting under the conventions of the ERM Framework is considered by the Operational and Executive Risk Committees. The Board receives regular representations from the senior executives. Performance against targets is reported to the Board quarterly through a review of the Group’s and Company’s results based on accounting policies that are applied consistently throughout the Group. Draft management financial statements are prepared quarterly by the CFO.
The members of the Audit and Risk Committee review the draft financial statements for the half year ending 31 December and for the full financial year and engage with the CFO to discuss and challenge the presentation and disclosures therein. Once the draft document is approved by the Audit and Risk Committee, it is reviewed by the Board before final approval by the Board.
Financial reporting
The statement on the responsibilities of the Directors in relation to the preparation of the accounts and the Directors’ evaluation of the business as a going concern is contained in the Directors’ Report.
The Directors as at the date of this report consider that the Annual Report and Accounts, taken as a whole, are fair, balanced, and understandable and provide the information necessary for shareholders to assess the Company’s position and performance, business model and strategy.
Culture
The Board recognises that fostering a culture of high performance, continuous learning and colleague wellbeing is fundamental to the Group's long-term success.
Underpinned by strong corporate governance, our culture encourages integrity, accountability, collaboration and continuous improvement. The Board sets the tone from the top, ensuring our values and expected behaviours are embedded throughout the organisation and reflected in the decisions we make every day.
Our culture plays an important role in supporting the delivery of our strategic objectives while creating an environment where our people can thrive. We regularly seek employee feedback through anonymous engagement surveys and facilitated discussions, enabling us to better understand the employee experience, identify emerging themes and shape future people initiatives.
We continue to invest in the development of our people through professional qualifications, internal career opportunities, secondments and a broad programme of learning initiatives. During the year, we further strengthened leadership capability through the continuation of our ILM management development programme and delivered a range of mandatory and professional learning programmes, including Cybersecurity, Risk Management, Whistleblowing, Corporate Sustainability and Health & Safety. In addition, colleagues participated in development sessions focused on resilience, supporting both personal effectiveness and workplace wellbeing. These initiatives help ensure our people have the knowledge, skills and behaviours required to support the Group's strategic objectives and operate within a strong governance and risk management framework.
The wellbeing of our people remains a priority. Our Wellbeing Team promotes initiatives across three key areas: mental, physical and financial wellbeing. Through our Employee Assistance Programme, employees and their families have access to confidential guidance and support, complemented by a range of wellbeing initiatives designed to support overall health and resilience.
Our Green Team continues to champion environmental and social responsibility initiatives across the Group. Through charitable, community and sustainability-focused activities, colleagues are encouraged to make a positive contribution to the communities in which we operate, reinforcing our values and shared sense of purpose.
We are also supported by an active Sports and Social Team that organises a variety of events and activities throughout the year. These initiatives provide opportunities for colleagues to connect, strengthen relationships and foster a strong sense of belonging across the organisation.
People and gender reporting
We recognise our people are key to our success in delivering the strategic objectives of the business. Our core values of Trust, Integrity, Respect, Quality, and Innovation underpin our working environment and practices. We believe all our people can make a difference, and we continually work to ensure that they are appropriately developed, engaged, rewarded and retained.
The Group’s principal administrative operations are performed in the Isle of Man on behalf of the wider Group. Management of Hansard Europe, with certain support functions, is located in the Republic of Ireland. Employees of our Malaysian and Japanese branches are included in “Other” below. Regional Sales Managers and related market development resources are principally based in local markets to support IFAs and other intermediaries that introduce business to the Group.
As at 30 June the number of the Group’s employees (excluding Non-executive Directors) by location was as follows:
|
|
|
|
|
Location |
2026 |
2025 |
|
Isle of Man |
156 |
145 |
|
Republic of Ireland |
13 |
15 |
|
Other |
16 |
15 |
|
Total |
185 |
175 |
As at 30 June 2026, the Group employed a total of 94 male and 91 female employees (2025: 87 male, 88 female).
Within the Executive Committee, there were 5 male and 3 female executives.
Among employees reporting directly to Executive Committee members, there were 19 male and 12 female employees.
As at 30 June 2026, the Board comprised 5 male and 1 female Director. The Board of the Group’s principal operating subsidiary, Hansard International Limited, comprised 5 male and 2 female Directors.
The gender profile across the Group overall remains broadly balanced, with female representation in a number of senior leadership positions, including Chief Risk Officer, General Counsel and Company Secretary, and Head of People and Culture. The Group remains committed to fostering an inclusive and diverse workplace that supports equal opportunities for all employees.
The current composition of the Board is not in complete compliance with the diversity targets of the UKLR. The Board recognises the value of diversity in supporting effective decision-making and enhancing Board effectiveness. Appointments are made on merit against objective criteria, having due regard to the benefits of diversity, including gender, ethnicity, age, professional background, experience and skills. The Nominations Committee remains committed to maintaining an appropriate balance of skills, experience and diversity across the Board and senior management.
Corporate Social Responsibility
Overview
Approval of the Group’s revised Sustainability Strategy, in advance of the reporting period, delivered an enhanced basis for the Group’s enduring commitment to supporting and investing in practices and initiatives that positively impact society, the environment, the economy and the long-term success of the Group. The Sustainability Strategy is built around our three sustainability pillars:
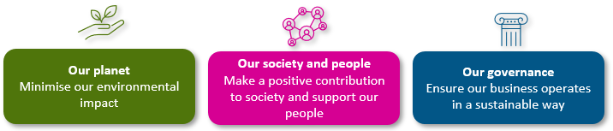
This is anchored by our core focus on the delivery of long-term value for our stakeholders while contributing positively to the broader community and environment. The Sustainability Strategy is also designed to embed sustainability principles deeper into our operations and to support stronger collaboration across key workstreams. Accountabilities throughout the business support the refinement of our internal controls and governance frameworks on an ongoing basis, strengthening our ability to manage sustainability-related risks and positioning the Group as a more resilient and future-focused organisation.
Our Group Sustainability Officer plays a leading role in identifying iterative enhancements to our sustainability positioning, reinforcing the value and the co-benefits presented by our sustainability initiatives. These initiatives will continue to evolve as we respond to future developments and prioritise a proportionate assessment of business impacts.
Our highlights
We have continued to promote and invest in sustainability related initiatives that align with our Sustainability Strategy, actively seeking new volunteering and sponsorship opportunities, in particular those which generate co-benefits, with the aim of maximising value both for our people and the organisations we are supporting.
We remain deeply committed to our Island home and we are proud to support causes and initiatives that celebrate the Island’s natural beauty and biodiversity together with Manx community, culture, and heritage. We also continue to support those initiatives which provide a platform for young people to enhance their learning and enable them to invest in their own future.
During the reporting period employees from across the Group have dedicated more than 300 hours to community-based projects and support for local charities, through utilisation of Company approved volunteering time, demonstrating the commitment of our people to supporting our local community and representing Hansard in a positive way.
Our Planet:
The Isle of Man remains proud of its status as the world’s first entire nation designated as a UNESCO Biosphere Reserve, with 2026 marking 10 years since this designation was awarded. Admission to UNESCO’s World Network of Biosphere Reserves in 2016 reflects a global accolade that celebrates the Island’s distinctive natural beauty and biodiversity, unique culture and heritage, resilient economy and crucially its community who care deeply, working together to create a sustainable future for all. Biosphere Isle of Man encompasses the entire Island and its territorial seas, and all individuals, and businesses, that live and work within it.
Hansard remains a committed Biosphere Isle of Man Business Partner, aligning our activities with the associated pledge points which form part of this commitment. During the reporting period our Group Sustainability Officer has been actively involved in a periodic review by Biosphere Isle of Man - providing feedback on how the partner scheme has worked so far and how it can be enhanced going forward. Building on our accreditation during 2024, our Group Sustainability Officer has also attended Biosphere Isle of Man’s flagship ‘Sustainable Mann’ training sessions, fostering relationships with organisations on a similar sustainability journey.
Our environmental initiatives are closely aligned with the pledge we have made as part of our Biosphere Isle of Man partnership - to make a positive environmental impact. These initiatives are primarily driven and supported by the Hansard ‘Green Team’ with oversight and direction from the Group Sustainability Officer. Key areas of focus during the reporting period have included:
-
Our continuing support for the Manx Wildlife Trust (MWT) through engagement in a number of initiatives including:
- Investment in the Crossags Project, the Island’s first carbon credit scheme, which also aims to enhance the biodiversity of the area through the planting of native trees. 2025 marked the second anniversary of planting at the site, which was celebrated with a guided walk around the site.
- Active employee participation in tree planting projects.
- Renewal of our corporate membership to proactively support MWT’s ongoing work.
- Sponsorship of a Marine Ranger.
- Activities undertaken in a number of our offices to celebrate Earth Day.
- Planting sphagnum moss as part of the Isle of Man Peat Partnership’s work to restore and protect the Island’s upland peatlands, a key source of carbon capture, and which will aid in flood reduction.
- Donation towards and volunteering hours contributed to support the creation of a new nature therapy space at The Children’s Centre Farm, providing a safe space for children to connect with nature.
Our Society and Our People:
Our people remain our greatest asset, and fostering a positive, inclusive and supportive culture is fundamental to Hansard’s long-term success and sustainability. We continue to invest in our people, with training and development opportunities available to each employee to enhance their career. In addition, we introduced a new mandatory ‘Corporate Sustainability’ training module for employees at all levels of the Group, and new starters, to complete. The training provides a high-level overview of the Group’s Sustainability Strategy and the initiatives we take as a business to act responsibly and address the risks, and opportunities, presented to Hansard.
At the end of the reporting period a decision was taken to establish a Charity Committee. This decision was made to improve governance arrangements between the various culture teams and ensure that the budget for each team aligned with its Terms of Reference. This change will also benefit employees, and the causes they wish to support, by providing a clear point of contact for any charity-aligned initiatives, projects, or fundraising activities.
We recognise the importance of supporting the local community and the positive impact employee engagement can have on both community outcomes and individual wellbeing. During the reporting period, our range of initiatives has included:
- Support for ‘Blein ny Gaelgey’ – the Year of the Manx Language, 2026: a vibrant, island-wide celebration of Manx Gaelic, the indigenous language of the Isle of Man, celebrating cultural and educational milestones and emphasising the revival and preservation of the language. With our Head Office based in the Isle of Man, we supported a ‘lunch and learn’ session, hosted by Culture Vannin, to provide a platform for both learning and celebrating Manx, fostering a sense of identity, belonging and cultural pride
- Continued sponsorship of the 2025 ‘LoveTech’ Summer Event, which encourages girls to enter into STEM careers. We have sponsored and supported this event through volunteering since 2023 and it remains a highlight of our corporate calendar.
- Maintaining our commitment to supporting the work that Junior Achievement undertakes across the Island’s schools. This year employees continued to volunteer time helping to deliver programmes in secondary schools. We also sponsored the ‘Sustainability Award’ as part of Junior Achievement’s company programme.
- Sponsorship of the annual ‘Shennaghys Jiu’ Festival, which provides a unique and inclusive platform for the Island’s gifted young musicians and dancers and the opportunity for developing local talent to flourish. The festival has also helped to build unique and collaborative relations with talented young people of our Celtic Nation neighbours, extending the Island’s cultural reach and reputation beyond our own shores.
- Providing our employees and their families with Manx National Heritage annual passes which provide access to sites across the Isle of Man to encourage engagement with local history and heritage.
- Support for local clubs and sports teams that our employees are members of, together with sponsorship for and donations to charity initiatives supported by active employee participation.
- Sponsorship of the Hello Little People alternative pantomime, an inclusive version of a traditional pantomime aimed at children with additional needs and which incorporates Manx culture.
- Provision of funding for refurbishment of St Olave’s Snooker Club to create a more inclusive and accessible community facility.
The Hansard ‘Wellbeing Team’ has continued promoting and supporting the physical, financial and mental wellbeing of employees across the Group. In parallel, a range of social, wellbeing and engagement initiatives have helped to strengthen connections between colleagues, encourage healthy lifestyles, enhance the resilience of our teams and build a strong sense of community. Key initiatives during the reporting period have included:
- Supporting ’Movember’ with activities to raise awareness of men’s health and wellbeing.
- Feel-Good February, delivered in partnership with the Green Team, promoting healthy habits, sustainable choices, kindness and positive wellbeing practices.
- Health and wellbeing awareness activities, including support and signposting for employees through the Employee Assistance Programme.
- Social and community events designed to strengthen colleague connections and encourage cross-functional collaboration.
- Employee appreciation and wellbeing initiatives throughout the year, helping to create a positive and supportive workplace culture.
We have also worked on building a closer relationship with our colleagues in Japan by aligning a number of our initiatives, including the promotion of Earth Day and activities throughout Mental Health Awareness Week.
Our Governance:
The Board holds ultimate accountability for overseeing sustainability-related risks and opportunities and the success of deliveries related to the Group’s Sustainability Strategy. In support of this accountability and associated reporting to the Board, sustainability remains a regular agenda item within a range of subordinate business forums, with the Group Sustainability Officer providing input and guidance where required.
Transparency and accountability are at the core of our sustainability efforts. We aim to provide regular updates against our three sustainability pillars to our stakeholders, as outlined below:
- Reporting to the Board - reporting is issued to the Board on a quarterly basis, with ad-hoc updates as required, and includes progress against reporting obligations, relevant changes or developments in the internal and external environments, updates on risks and opportunities, and broader sustainability trends that may impact Hansard.
- Internal Stakeholder Reporting is provided in relation to ongoing initiatives, via training, mailshots, or staff bulletins.
- External Stakeholder Reporting is undertaken in line with our reporting obligations and is reviewed and updated as required. More informal updates are posted on Hansard’s LinkedIn profile, showcasing some of our community engagement activities.
The Group Sustainability Officer monitors emerging and foreseeable changes to sustainability-related reporting frameworks and ensures the timely cascade of information.
Our Climate-Related Financial Disclosures
We have continued to invest time and resource throughout the 2026 reporting period targeting iterative improvement and enhancement of our internal processes in relation to climate risks and opportunities. The following section outlines the Group’s continued efforts to integrate both climate and broader sustainability-related risks and opportunities into our risk management, strategic planning and decision-making processes.
Our reporting seeks to provide our primary stakeholders, including our investors, our policyholders and our employees, with a clear understanding of our progress during the reporting period in identifying, understanding, and disclosing our exposures to climate related risks and strengthening strategic resilience to these exposures, with a focus on proportionality, whilst also seeking and understanding opportunities in the medium- to longer-term.
The Hansard Group remains proactively committed to supporting the Isle of Man Government’s initiatives associated with building a sustainable economy. This includes support for ‘Finance Isle of Man’ as they progress their work to develop a three-year ‘Roadmap’ to create a more sustainable economy for the Island.
Overview of the Taskforce on Climate-related Financial Disclosures (TCFD)
Aligning our strategic and tactical thinking with the objectives and intent of the TCFD recommendations is helping to drive an inclusive and proportionate approach to addressing our social responsibilities, as well as our environmental impacts and our governance practices. The TCFD recommendations remain relevant to our ambitions and provide a solid foundation from which we will continue to build our climate-related disclosures.
The four TCFD pillars:
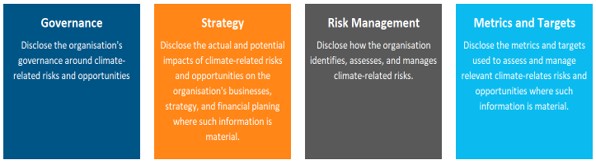
Our Approach
We remain conscious of the benefits inherent within holistic sustainability perspectives and reporting practices, and the value that an integrated strategic approach plays in achieving our broader organisational goals and long-term ambitions. By considering environmental, social, governance and economic factors in a connected and balanced way, we are better positioned to identify opportunities, manage risks, strengthen trust and create sustainable value over time.
The broader global landscape continues to evolve rapidly, shaped by changing stakeholder expectations, emerging regulatory requirements, technological advances, geopolitical influences and growing environmental and social challenges. These factors reinforce the Board’s commitment to maintaining a proactive, adaptable and forward-looking approach to sustainability, ensuring that our strategy remains relevant, resilient and aligned with both organisational priorities and the evolving needs of the communities in which we operate and our wider stakeholders. In line with this commitment, we continue to horizon scan and plan for future reporting requirements in line with emerging developments, ensuring we are well placed to engage with foreseeable change and adequately prepared for enhanced reporting obligations.
Relevant details of the Group’s work during the reporting period are organised under the four pillars of the TCFD disclosure framework, within the respective sections below. We continue to maintain a proportionate approach towards the transition to a low-carbon economy, balancing iterative progress with broader strategic priorities and protection of stakeholder interests.
Pillar 1 - Governance
The Board retains overall accountability for the effective functioning of the Group’s governance, risk management and internal control arrangements, including those relevant to sustainability-related risks and opportunities. The Board is accountable for determining, evaluating and controlling the nature and extent of these risks and opportunities, in reference to the varying levels of strategic, financial and operational stresses, and scenarios. Consideration is given to emerging as well as existing risk exposures over short, medium, and long-term time horizons. These activities are governed by the protocols of our established ERM Framework, described in more detail under ‘Pillar 3 – Risk Management’ below, which include both top-down and bottom-up risk assessment bases.
The Group’s sustainability goals are considered within the context of wider industry experience and stakeholder perspectives, having regard to the aggregate levels and types of risk the Board is prepared to accept within risk capacity as strategic and business plan objectives are pursued. During the reporting period the Board considered key developments and evolving trends in sustainability reporting obligations, in the insurance sector and broader business environment.
The new Sustainability Strategy, approved prior to the reporting period, builds on holistic sustainability perspectives and reporting practices and reinforces the importance of an integrated strategy to achieving the Group’s overall goals and ambitions. The Strategy incorporates clear governance structures and lines of responsibility, with closer links to the Group’s overarching business plans. A formal Sustainability Report is submitted to the Board on a quarterly basis, providing updates on work in progress to achieve objectives and targets, with advice on regulatory changes and trends in the wider business landscape. Simultaneously, the Hansard Global Risk Appetite Statement continues to be reviewed through a lens of sustainability and enhanced, or updated, where appropriate.
The governance structures which support the Board’s oversight of sustainability-related risks include the Group and subsidiary entity Audit and Risk Committees, the Executive Committee, the Executive Risk Committee and the Investment Committees of both Hansard International Ltd (HIL) and Hansard Europe Designated Activity Company (HE dac). The Investment Committees and the Executive Risk Committee also consider sustainability-related reporting as a standing agenda item, ensuring a structured approach to the identification of climate-related risks as part of this. Protocols remain in place to enable communication of the Investment Committees’ sustainability-related decisions to the Board. A summary view of the Group’s governance structures supporting the Board’s oversight of risks and opportunities is presented in Figure 1 below.
Figure 1: Group governance structures
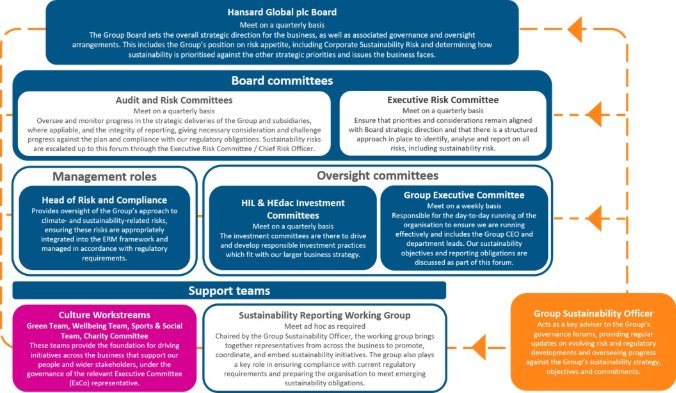
The Chief Risk Officer, supported by the Group Sustainability Officer, has specific accountabilities for monitoring deliveries and reporting against progress. The Sustainability Reporting Working Group enhances our disclosures and ensures compliance with increasingly complex reporting obligations alongside the introduction of further refinements to tracking and monitoring our emissions. As part of this work, responsibilities have been further clarified to ensure that reporting requirements fall within the relevant business functions, consistent with our wider objective of embedding sustainability within the business.
Pillar 2 – Strategy
The Group’s strategic goals in terms of climate-related risks and opportunities are focused on the creation of long-term value for our stakeholders whilst making a positive impact. The delivery of the Group’s strategic objectives in relation to sustainability falls within the three pillars of our Sustainability Strategy (as mentioned above).
The Group’s approach to the management and mitigation of climate- and broader sustainability-related risks and opportunities is built within the context of its corporate strategy and business plans. The main source of income for the Group continues to be the fees earned from the administration of insurance contracts. These fees are largely fixed in nature and amount. Approximately 30% of the Group’s revenues, under IFRS, are based upon the value of assets under administration. The new business generated in a particular year is expected to earn income for an average period of 13 to 15 years. Business is therefore long-term in nature both from a contract holder perspective and with regard to the income that is generated, which supports business overheads, business investment, remuneration of the distribution network and payment of dividends.
The Group’s products are unit-linked regular or single premium life assurance and investment contracts, which offer access to a wide range of investment assets, through internal funds or open architecture products. The contracts are flexible, secure, and held within wrappers, allowing life assurance cover, or other features, depending upon the needs of the client. The contract benefits are directly linked to the value of those assets that are selected by, or on behalf of, the client and held within the wrapper. The Group’s products do not currently include any contracts with financial options and/or guarantees regarding investment performance, which can require additional capital to be held. Levels of service and the delivery of fair client outcomes, the nature of the Group's products, the use of technology, and the ability of the contract holder to reposition assets within a contract are all designed to achieve retention of the contract holder relationship over the long term.
The Investment Committees for HIL and HE dac have autonomy over which internal funds we make available to clients, subject to the governing arrangements in force. The Morningstar sustainability ratings of funds are factored into the creation of new propositions and in reviewing the availability of existing funds. However, the nature of open architecture products is such that the investment decision ultimately rests with the client and their intermediary, subject to the selected assets meeting our criteria.
Historically, we have classified short- and medium-term time horizons as 0-5 years and 5-10 years respectively. To improve alignment with our strategic and financial planning frameworks, we have updated the time horizons applied to climate-related risks and opportunities to support more effective integration into business planning processes as set out below.
- Short term: 0-3 years
- Medium term: 3-10 years
- Long term: > 10 years
These time frames support analysis and assessment of climate-related risks and opportunities, together with broader sustainability considerations, which have the capacity to impact the Group’s strategy, business plans and financial performance. The Board provides oversight of climate-related risks and opportunities as part of the organisation’s broader governance and risk management framework. This oversight supports the identification, assessment and management of climate-related risks and opportunities over the short, medium and long term, including their actual and potential impacts on the organisation’s strategy, operations and financial planning. Forward-looking analysis, including consideration of relevant climate-related scenarios, is used to assess the resilience of the organisation’s strategy and to inform proportionate business planning, operational decision-making and investment activity in support of an orderly transition to a low-carbon economy.
The Group’s risk management arrangements, described in more detail within ‘Pillar 3 – Risk Management’ below, operate on a cyclical basis to enable the Group Board and the Executive Committee to properly assess and understand, at a practical level, the major sources of risk facing the Group, and the capital required to cover those risks, under both normal and stressed conditions. Internal and external risks are considered, together with emerging risks and any risks associated with the Group’s systems of governance, having regard to capital, performance, and strategic information, which ultimately provides the Board and Executive Committee with substantiated bases relevant to decision making. Forward-looking business plan and solvency projections use a range of stress and scenario testing and analyses to evaluate the adequacy of the Group’s overall financial resources, including capital and liquidity resources. The stress and scenario tests, described in more detail below, are derived from analytical review of the Group’s risk universe, enabling distinguishable patterns of impact to be considered and allowing plausible risk scenarios to be approximated into impact types, with attention given to both single and multi-factor scenarios.
ERM protocols and work to support climate-related financial disclosures have considered the plausibility of climate-risk stresses emerging over the duration of the forecast period. Associated analyses have focussed on the capacity for future disruption to the Group’s strategic and business plan objectives and targets, taking account of both physical and transition risks.
Climate-related risks are defined, at the highest level, as those risks arising from a failure to prepare for the physical and transitional risks that changes in climate and biodiversity will present to the Group, our suppliers, our customers, the communities in which we operate, and our wider stakeholders, resulting in potential financial loss, damage to reputation, regulatory fines, and / or environmental damage. This is captured within the context of the broader Corporate Sustainability Risk which we define as the risk of failing to integrate environment, social and governance considerations into the Group’s strategic and business planning activities, or to proactively review, understand and act on the challenges and opportunities presented. To help mitigate this risk we have taken actions to:
- Integrate sustainability issues into the Group’s core strategies and business plans. The strategy recognises the need for proportionate, value-driven and adaptive practices, which continuously enhance the Group’s corporate governance arrangements, as sustainability related issues evolve.
- Factor emerging sustainability-related issues into decision-making and understand the impacts for the tools and methodologies currently used to manage risk, including governance structures, risk ownerships, risk and control self-assessment principles, regulatory developments, third party service provisions and effective reporting.
- Develop and update relevant components in relation to the sustainability risk domain – including policies, procedures, risk indicators, management data and stress testing.
- Support initiatives addressing cultural alignment and structural resilience, which encompass core sustainability considerations, including Sustainability Training deliveries, and collaborative working between business forums leading on employee engagement initiatives.
The following section identifies the risk scenarios we have considered and their potential impacts, any risk mitigants, and relevant opportunities presented to the Group. Whilst these risk scenarios are included within our disclosures, they do not pose a material risk to the Group.
Physical risks are the direct impacts of climate change on an organisation’s operations and activities. These can be defined as either acute risk, resulting from sudden extreme weather events such as storms, heatwaves and flooding, or chronic risk, arising from longer-term changes in climate patterns, including rising sea levels and sustained temperature increases.
|
Physical Risks | |||
|
|
Potential Impact to Hansard |
Time Horizon |
Mitigants / Controls / Monitoring |
|
Acute Risks
Increased frequency and geographical coverage of extreme weather events (flooding, cyclones/hurricanes and heatwaves). |
Potential and existing customers have reduced disposable income to invest as they prioritise maintaining sufficient financial means to cover damage caused by extreme weather, leading to lower revenues and diminished future sales for Hansard. |
All |
Stress and scenario testing analyses the impacts of potential events in terms of below target sales, loss of revenue, and / or unplanned expenses.
Disaster recovery plans are in place to ensure continuity of services via robust contingency and technology solutions. |
|
Weather disasters result in extreme operational disruption, with potential for increased operational costs. | |||
|
Sudden market shocks triggered by natural disasters, leading to volatility in exchange rates or asset prices increasing pressure on IFRS earnings and/or equity-linked revenues. |
Maintain a diversified investment portfolio to mitigate or reduce the impact of sudden market shocks. | ||
|
Chronic Risks
Scarcity of multiple resources (fuel, food etc) to support global population levels leading to chronic health and wellbeing issues.
Habitability of certain geographical areas becomes unsustainable, resulting in loss of life or mass migration. |
Mass migration from countries susceptible to recurring extreme weather events or rendered uninhabitable to the extent that the business model becomes unsustainable |
Medium |
Diversify our geographic exposure, in line with our wider growth strategy. |
|
Asset prices, particularly those with high exposure to emissions or natural resources, are negatively impacted leading to a reduction in equity-linked revenues. |
Long |
Maintain a diversified investment portfolio to mitigate or reduce the impact of sudden market shocks. | |
|
Increased operational costs due to sustained temperature increases (e.g. electricity usage in relation to air-conditioning). |
Medium - Long |
Ensuring that our use of an reliance on fossil fuels is appropriate for our type of business and support local initiatives that aim to make a positive environmental impact. | |
|
Disruption to our supply chain where suppliers are based in regions that have a higher exposure to chronic risks of climate change. |
Broaden supplier risk assessments to consider regional exposure to climate change and climate resilience strategies to minimise the impact of disruption to Hansard. | ||
Transitional risks arise from the shift to a low-carbon economy and can impact organisations through changes in regulation, stakeholder expectations, market dynamics, technology, and reputational factors. Consistent with the prior reporting period, analysis of transition risks has considered the disruptions and shifts associated with advancement towards a low-carbon economy and the potential for these to impact the value of assets, erode important revenue streams and/or increase the cost of doing business. Transition risks include policy changes and regulatory reforms, which affect specific classes of financial assets relevant for available investments. Social movements and civil society activism may lead to reputational damage in the absence of appropriate risk mitigation strategies and communication actions. Associated risks may emerge more readily if the Group fails to adequately prepare for, or substantively comply with, mandated climate-risk disclosure obligations and/or its disclosures are found to be deficient.
|
Transitional Risks | |||
|
|
Potential Impact to Hansard |
Time Horizon |
Mitigants / Controls / Monitoring |
|
Policy and Legal
Enhanced reporting requirements associated with climate and sustainability.
Wider transition to renewable energies due to emission reduction commitments - increasing reliance on more volatile sources of power and the potential to drive up cost. |
Requirement to develop internal capabilities or recruit specialist individuals or consultants to ensure disclosures comply with legal and regulatory obligations. |
All |
Mandatory Corporate Sustainability training has been rolled out to all employees and is included within new-starter induction materials. |
|
Increased operational costs resulting from the transition to renewable energies and reliance on national infrastructure. |
Medium |
Monitor the development of renewable energy on the Isle of Man to identify potential entry points. | |
|
Inability to achieve emission reduction aims due to limited progress from energy suppliers and constrained market options (Isle of Man specific). |
Long | ||
|
Technological
Failure to invest in technologies that are climate or disaster resilient.
Data limitations based on new reporting requirements which require investment in new technologies. |
Costs associated with investing in new technologies or maintaining existing assets that are incompatible with a low-carbon economy or have limited resilience to climate change impacts. |
Medium |
Ensure the data and service centres we rely on have the capability of adapting to the impacts of climate change. |
|
Sunk costs due to early retirement of technologies which are no longer fit for purpose. |
Long |
Equipment can be returned for refurbishment or recycled where feasible. | |
|
Lack of data to satisfy regulatory reporting requirements could result in unclear climate-related impacts and exposures.
|
Medium – Long |
Regular periodic horizon scanning to identify emerging risks. | |
|
Market
A decline in product demand resulting from shifts in customer preferences and / or variations in customers’ investable wealth.
Reduced availability of suitable investment markets due to asset scarcity or increasingly stringent regulatory constraints. |
Failure to adapt our current investments in line with shifting market sentiment may result in lower or non-existent return. |
Assessing our exposure to carbon-intensive funds in order to identify and manage the potential climate-related risks. The majority of shareholder funds are invested in money market funds which limit direct exposure. | |
|
Reduced sales resulting from a failure to adapt our product and investment offerings to meet customer needs. |
Products are regularly reviewed and adapted to meet customer needs. | ||
|
Potential and existing customers may have less disposable income to invest in our products due to broader climate-related impacts such as rising cost of living and increased spending on adaptation methods.
|
All |
Our regular premium products offer flexible payment options which are available to customers who may experience a reduction in disposable income. | |
|
Reputational
Shifts in the wants and needs of stakeholders in relation to environmental issues.
Failure to comply with legal and regulatory obligations.
|
A decline in share price or investor withdrawal due to a loss of confidence in business decision making. |
Medium |
Maintain transparency around climate and sustainability-related issues within our disclosures. |
|
Failure to demonstrate sufficient long-term progress against ESG targets could lead to material financial loss and jeopardise the long-term viability of the business model. |
All |
Ensure a robust ESG governance and performance management framework is in place and operating effectively to monitor and report against ESG aims. | |
|
Disclosure of information that could be considered within the definition of greenwashing or greenhushing potentially leading to fines and reputational damage. |
All |
Any claims that we make must be true and substantiated by evidence. | |
Opportunities – in previous years, climate-related opportunities were captured alongside their corresponding risk. This year, we have adopted a different approach by identifying and presenting opportunities separately, placing greater emphasis on the positive outcomes that may arise from our climate-related activities and acknowledging their strategic importance to the business.
|
Opportunities | |||
|
Category |
Benefit |
Time Horizon |
Controls / Monitoring |
|
Physical – chronic / Reputational |
Continued investment in local projects which protect and enhance the biodiversity and natural ecosystems of the local area which will provide co-benefits such as: - Building trust and connections with the local community - Improved employee engagement and wellbeing - Helping to address climate and nature related issues - Enhancing company reputation - Strengthening the local landscape and reduce the physical impact of climate change |
All |
Green Team / Group Sustainability Officer to actively seek out opportunities to engage with local projects. |
|
Reputational |
Maintaining regulatory compliance and transparency in our disclosures can have a positive reputational impact. |
All |
Substantiate disclosures and statements with supporting evidence. |
|
Technological |
Driving internal efficiencies and reducing costs by adopting new technologies, where needed, whilst achieving emissions reduction as a co-benefit. |
Medium |
When evaluating investment in new technologies, ensure that climate impacts (e.g. energy efficiencies) are considered as part of the assessment process. |
|
Adoption of new technologies to enhance data tracking will improve management and monitoring of our climate-related exposures. |
Medium |
Integrate with governance processes and ensure that new technologies and data-tracking are effectively leveraged to improve management of climate-related exposures. | |
Whilst climate-related issues have not presented a material impact to the Group’s financial performance or position to the date of reporting, scenario testing during the year ended 30 June 2026 was calibrated to consider extreme but plausible stresses, reasonably foreseeable within the forecast period, arising via the physical and transition events described above. Early analysis of orderly and disorderly transitions and physical risks under specific temperature increase circumstances was considered as part of the initial FY 2026 Group ORSA cycle. However, the final analyses within our ORSA report do not yet include temperature specific scenarios. These analyses are presented as approximated assumptions, based on medium-term unplanned expense variances to meet costs associated with physical or transitional risks, declines in traditional business sales, and varying levels of sales impact within a specific region. Work is ongoing to refine the approach to and confidence in temperature specific scenario analyses. For the reporting period our modelling has reconfirmed that, in the absence of mitigating measures, an extreme multi-factor scenario could have the potential to disrupt key financial metrics, compared to base plan targets, due to reduced sales volumes and compromise of planned expense savings, with a deteriorating trajectory.
Overall, modelling continues to support a compelling view of the importance of the Group’s Sustainability Strategy and associated risk management and mitigation measures. On this basis, whilst the transition to a low-carbon economy is not expected to generate critical impacts for our business model or financial performance, the Group’s iterative work in anticipation of and preparation for broader sustainability reporting, including non-climate related disclosures, will strengthen analysis of reasonably foreseeable risks and impacts. The results of this work will enhance the resilience of the Group’s management and mitigation strategies, ensuring that short-, medium-, and long-term financial planning and strategic decision-making take account of the growing significance of climate and sustainability risks and opportunities. The governance arrangements established in respect of these risks and opportunities also promote recognition of the fact that they are complex and interconnected with wider ranging sustainability-related risks and opportunities, making them difficult to predict and plan for.
Developing further maturity of data and analytics, on a proportionate basis, will remain a priority going forward. This will enable the Board to continue its work towards:
- Further substantiating the range and plausibility of subordinate risks and opportunities within the main exposure categories
- Their capacity to impact specific areas of the Group’s business, over short, medium- and long-term time horizons.
Future iterations of our ORSA cycle will continue to assess the relative value of modelling specific temperature increase scenarios. Attention will then be given to the extent to which these issues might crystallise as a material financial impact for the Group and its stakeholders.
This will include further analysis of climate-related issues that affect the geographical regions in which we generate revenues – on a current and forward-looking basis, to enable more geographically specific disclosures, where these prove to be useful and value adding.
Pillar 3 – Risk Management
As with all businesses, the Group is exposed to risk in respect of its strategic and business plan objectives. The Board has overall responsibility for the Group’s system of risk management and internal control and for reviewing their effectiveness, supported by the governance structures, and reporting arrangements of the ERM Framework - discussed in detail within the Risk Management and Internal Controls section starting on page 20. The ERM Framework considers the identification and management of sustainability related risks, enabling the Group to readily apply its well-established and embedded risk management conventions and processes to identify, understand and assess relevant risks and opportunities in a manner consistent with the approach for all other risks to which the Group is or may be exposed. The ‘Schedule of Powers Reserved to the Board’ ensures that the Directors are responsible for determining, evaluating, and controlling the nature and extent of such risks and opportunities, including both quantifiable and non-quantifiable risks, and for assessing the effectiveness of the Group’s ERM Framework.
The policy objectives and conventions of the ERM Framework, which are mature and well embedded, guide and govern the identification, assessment, management, monitoring and reporting of all risks, including those which fall under the scope of Corporate Sustainability Risk as defined under the Strategy Pillar in the previous section, and exposures at strategic, programme and operational levels such that layers of core activity support each other and the relative significance of climate-related risks within the context of the broader risk portfolio. This is enabled by the application of risk appetite metrics, tolerance thresholds and ultimate boundaries, which are used to quantify risk issues and emerging risks with outputs reported to the Board on at least a quarterly basis.
Within this context, and consistent with the Group’s ERM protocols, risk management processes are undertaken on both a top-down and bottom-up basis depicted in Figure 2.
Figure 2: Approach to risk management.
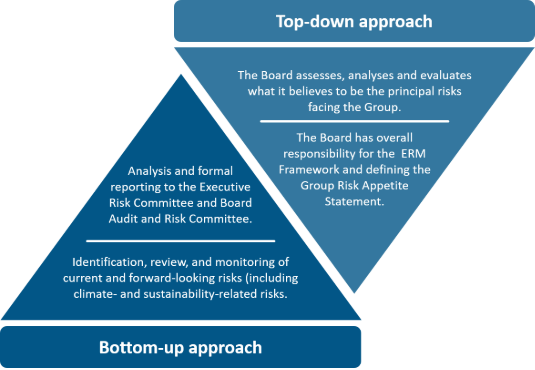
The Group Risk Taxonomy is a critical element of the Hansard Group ERM Framework. The Taxonomy is built upon five ‘pillars’, or categories of principal risk - each with a range of subordinate risk categories - and incorporates Corporate Sustainability Risk within the Strategic Risk pillar. This structure is mirrored in the Risk Appetite Framework to ensure consistency in risk classification and oversight. This Risk Taxonomy strengthens the monitoring of risk appetite as it is reflective of the nature of the risks to which the Group is or could be exposed in the pursuit of its business objectives and corporate strategies. Risk identification, measurement, monitoring, management, and reporting under the Group’s ERM Framework are based on this taxonomy and the approach enables a holistic and integrated view of climate-related risks and those with a broader sustainability nexus. While climate-related risk has not been classified as having a material impact, it is categorised within the Group’s Risk Appetite Framework as a Principal Risk under Corporate Sustainability Risk.
For some risks within the Group’s risk universe, such as strategic, reputational, group and some aspects of climate risks, the holding of capital by itself is considered by the Board to be an inappropriate mitigating measure. The governance, risk management and internal control mechanisms, which constitute the ERM Framework, facilitate the identification and evaluation of non-quantifiable risks, such as those associated with climate and sustainability, by aligning assessments with the risk appetite metrics approved by the Board. This approach, driven by ERM protocols, ensures that all risks within the risk universe (quantifiable and non-quantifiable) are treated with equivalence and reporting on risks is not limited to those which only support calculation of solvency requirements. This methodology allows the nature of the Group’s principal and subordinate risks, relative to strategic and business objectives, to be considered via stress and scenario testing and movements in Hansard’s risk profile, to be identified, managed, monitored and reported on a continuing basis. Additional details of stress and scenario testing relating to climate risks are described above as part of Pillar 2 – Strategy.
Pillar 4 – Metrics and Targets
The Group is committed to fostering sustainable business practices through a holistic approach, actively managing and minimising our environmental impacts. Achieving meaningful progress requires a well-informed understanding of climate-related factors, including physical and transition risks, climate resilience, and greenhouse gas (GHG) targets. This is promoted through education and involves a thorough evaluation of the Group’s emissions, alongside a recognition of the importance of clear and effective metrics that enable all stakeholders to analyse our impact.
The Group’s metrics and targets are intended to evidence and demonstrate how we are working to achieve reductions in energy use, and is measured in tonnes of CO2 equivalent (tCO2e). To calculate our emissions, we follow the Greenhouse Gas Protocol (GHGP) Corporate Standard. Under this Protocol we categorise emissions on the following basis:
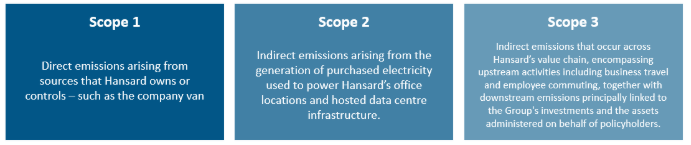
We have maintained our partnership with FutureTracker since 2021. This enables us to monitor and record our emissions via their online platform and receive a comprehensive annual report, setting out a detailed breakdown of our emissions footprint across Scopes 1, 2 and 3, along with valuable industry benchmarking insights. During Q1 of the reporting period FutureTracker launched their new platform which allows us to manage our data more effectively and empowers functional ownership of emissions data management.
Data for the year ended 30 June 2026 is set out at Figure 3 below, representing the most relevant and applicable data in respect of emissions for which the Group is responsible, measured in tCO2e. As we have set out in previous years, we use 2022 as our baseline year for Scope 1 and 2 data.
Figure 3: Emissions breakdown
|
Scope |
Description |
FY 20221 (tCO2e) |
FY 2025 (tCO2e) |
FY 2026 (tCO2e) |
|
1 |
Emissions from gas, refrigerants and owned vehicles: | |||
|
Fugitive Emissions |
10.60 |
0.23 |
0 | |
|
Static Combustion |
5.30 |
- |
- | |
|
Mobile Combustion |
0.90 |
0.17 |
0.12 | |
|
Gross Measurable Scope 1 Emissions |
16.80 |
0.40 |
0.12 | |
|
2 |
Electricity emissions using purchased electricity factor (market based) |
104.60 |
43.15 |
58.50 |
|
Gross Measurable Scope 2 Emissions |
104.60 |
43.15 |
58.50 | |
|
3 |
Emissions relating to activities within our wider value chain: | |||
|
Category 3 - Fuel related activities |
- |
40.63 |
42.62 | |
|
Category 6 - Business travel |
N/A |
93.46 |
114.01 | |
|
Category 7 - Employee commuting |
N/A |
95.88 |
88.40 | |
|
Category 7 - Working from home emissions |
N/A |
13.09 |
13.20 | |
|
Category 13 - Downstream leased assets3 |
N/A |
N/A |
2.17 | |
|
Gross Scope 3 Emissions |
|
243.06 |
260.40 | |
|
Gross Total Company Emissions |
121.40 |
286.612 |
319.02 | |
|
Carbon Offsets Purchased |
(121.40) |
(500) |
(500) | |
|
Net Measurable Scope 1, 2 and 3 Emissions |
0.00 |
(213.39) |
(180.98) | |
|
|
|
|
|
|
1 – 2022 is our baseline year for measurable Scope 1 and Scope 2 emissions
2 - Category 7 – Employee commuting and working from home emissions figures for FY2025 have been restated to reflect the change in methodology. Refer to relevant section on page 72.
3 – Category 13 – Downstream leased assets is a new category for FY2026.
Scope 1 and Scope 2 emissions
Our Scope 1 and 2 reporting total includes data from our Isle of Man, Ireland, and Japan offices.
Scope 1 emissions
Following a marginal increase in our mobile combustion figures in FY2025, we have managed to reduce this figure by 29%, from 0.17 tCO2e down to 0.12 tCO2e across this financial year. This is due to a reduction in usage of the company van by planning trips more efficiently.
We further reduced our fugitive emissions during the year, achieving zero emissions compared with 0.23 tCO2e in FY2025. This improvement was supported by enhanced data collection and verification processes, including confirmation from each office manager that no refrigerant top-ups were required and no leaks occurred from air conditioning systems during the reporting period.
Scope 2 emissions
In relation to our Scope 2 emissions profile, our largest contributor continues to be our electricity usage, mainly within our Isle of Man office. Usage, and therefore associated emissions, increased by 35.6% compared with FY2025 (43.15 tCO2e), to a total of 58.5 tCO2e. The increase reflects increased headcount across the year, greater office utilisation, and temporary operational activities associated with office refurbishment works. Scope 2 emissions per employee in the Isle of Man rose from 0.26 to 0.35 tCO2e per full-time employee.
Electricity usage in our Japan office has evidenced a slight increase of 5%, to generate a total of 5.47 tCO2e. Despite a slight increase in headcount within our Japan office, electricity usage per full-time employee fell slightly to 0.55 tCO2e, down from 0.58 tCO2e. Out of the three sites in which we operate, Japan has the highest emissions per full-time employee (FTE) as the electricity grid in Japan is more carbon intensive.
Electricity in our Ireland office remains sourced from renewable energy and consequently associated emissions remain at zero. We continue to monitor the situation regarding the availability of renewable energies for our Isle of Man and Japan offices, noting the constraints associated with island locations and utilisation of shared office spaces. Our data centre providers have maintained their contract to ensure they are purchasing electricity through the ‘Guaranteed Green Tariff’. This is a verified local tariff that ensures renewable energy is fed into the Isle of Man national grid to cover the number of units of electricity consumed by our data centre usage. Although the tariff ensures renewable energy is purchased to cover the usage, we have managed to reduce usage by 4.2% this year compared with FY2025 (FY2026:134,061 kWh; FY2025: 139,951 kWh). Equipment upgrades have been carried out throughout the year (where appropriate) to ensure efficiency.
Considering both Scope 1 and Scope 2 emissions categories, we have determined that the tCO2e per FTE across the Group is currently 0.34 tCO2e per FTE. This represents an increase of 36% compared to last year’s figure of 0.25 tCO2e per FTE, for the reasons set out within this section, but the figure is still below the benchmark average of 0.38 tCO2e per FTE. (The Group has been benchmarked by FutureTracker against a peer group of comparable, publicly reporting, financial institutions.)
Scope 3 emissions
Category 6 – Business travel
Business travel remains an important facet of our business model, as we work to build and develop relationships in strategically significant jurisdictions, opportunities to make positive progress in this area have been recognised. Although we achieved a reduction in business travel related emissions in FY2025, we have seen a 22% increase during the reporting period, mainly driven by international flights to/from strategically important sales regions. Domestic UK travel emissions also increased from 3.98 to 8.90 tCO2e. Domestic UK flights, per kilometre, are significantly more carbon intensive due to more frequent take-offs and landings. We have maintained our policy to favour economy class flights, which have lower emissions per passenger than business class flights.
After disclosing hotel stay emissions data for the first time in FY2025, we have again included this within our business travel data. Emissions linked to hotel stays increased by 20%, from 4.20 tCO2e to 5.03 tCO2e, which is reflective of the overall increase in travel.
We also included ferry travel in this year’s business travel data. Ferry travel is far less carbon intensive than flying, per passenger. Although we have no comparative figure to last year, ferry travel contributed 0.03 tCO2e to our business travel emissions profile.
Category 7 – Employee commuting and working from home emissions
During the reporting period, we undertook a review of the methodology used to calculate Category 7 emissions to improve the accuracy and completeness of our overall emissions profile. Following an assessment of our current approach, the enhanced methodology incorporates more granular data and revised calculation methods. This revised approach provides a more robust representation of actual commuting behaviours and better aligns with greenhouse gas accounting guidance and data availability.
As a result of this methodology change, Category 7 emissions reporting for the current year is not directly comparable with that previously disclosed. To maintain consistency and improve trend analysis the prior year baseline has been recalculated using the revised methodology, as shown in figure 3. This change has resulted in the restatement of FY2025 Category 7 employee commuting and working from home emissions from 102.77 tCO2e to 108.97 tCO2e. All year-on-year comparisons within this report are based on the restated figures to ensure consistency.
This change does not reflect a material increase or decrease in actual employee commuting activity during the prior year. Rather, it reflects an improvement in the quality of the underlying data and calculation approach used to estimate emissions. Recalculating the prior year figure ensures that year-on-year performance is assessed on a like-for-like basis and supports greater transparency in our climate-related disclosures.
With this in mind, the total emissions figure for employee commuting for FY2026 is 88.4 tCO2e. This represents a decrease of 7.8% and is mainly driven by changes in commuting patterns. Active travel largely remained consistent with last year’s figures, with bus travel decreasing by 45%. Petrol car travel decreased by 16%, whereas hybrid car travel increased by 60.5%, highlighting the wider societal move towards more energy-efficient car choices. It is also important to note that employee commuting methods vary greatly depending on where the office is based as the availability of public transport and the culture in each area differs. Japanese colleagues, for example, all commute into work via tram, train or the Metro, options which are not available for colleagues in the Isle of Man.
Emissions relating to remote working also saw a 1% increase of 0.11 tCO2e, which may be linked to increased headcount in the Isle of Man office and reduced desk availability subsequent to the sub-leasing of part of the Head Office premises.
Category 3 – Fuel-related emissions
Fuel related activities are activities that relate to the extraction, processing and transportation of fuels for use in vehicles, such as planes and cars. After first reporting on our fuel-related emissions last year, the data has helped to build a more accurate picture of the Group’s overall Scope 3 emissions. Fuel-related activities make up 16.4% of our total Scope 3 carbon emissions. There was an increase of 4.9% in this year’s fuel-related emissions (42.62 tCO2e compared with 40.63 tCO2e in FY2025), mainly driven by the increase in flight emissions, but partly offset by the reduced distance travelled by employee commuting.
Category 13 – Downstream leased assets
This is a new emissions category for the reporting period, and relates to a sublet arrangement within our Head Office which necessitates that the respective electricity consumption data, previously included within our Scope 2 emissions inventory, is now reported under Scope 3 Category 13 (Downstream Leased Assets). This is in line with the operational change and greenhouse gas reporting guidance.
The introduction of this category reflects a change in the use of our property portfolio rather than a material increase in overall energy consumption. The emissions reported under Category 13 relate solely to the leased area and represent electricity usage that would previously have been accounted for within our Scope 2 boundary.
Category 15 - Investments
Whilst we do not currently capture the Weighted Average Carbon Intensity (WACI) metrics for our Assets Under Administration (AuA) to input under Category 15 of the GHGP requirements, we provide our contract holders and their Independent Financial Advisors (IFAs) with two measures of sustainability using data from Morningstar regarding the underlying external mutual funds that are notionally linked to our Hansard Unit-linked Fund range, i.e.: -
- The ‘Morningstar ESG Risk Rating’ (formerly the Morningstar Sustainability Rating), which provides a framework for comparing thousands of mutual funds and exchange-traded funds (ETFs) based on ESG standards, with a clear five tier rating scale to indicate where a fund stands regarding ESG performance compared to its industry group.
- The Morningstar ‘Low Carbon Designation’, which is assigned to mutual funds and ETFs that have low carbon-risk scores and low levels of fossil-fuel exposure. The designation is an indicator that the companies held in a portfolio of a mutual fund or ETF are in general alignment with the transition to a low-carbon economy.
Category 5 – Waste generated in operations
Whilst we do not currently track and report on our Category 5 (waste generated in operations) emissions, conscious decisions are made about the way in which we dispose of waste and e-waste. Recycling facilities are available in each office location, and we have reduced the number of bins available in the office area to encourage recycling.
In relation to e-waste, during the reporting period we returned 370 pieces of redundant equipment including old servers and storage units. Our supplier subsequently refurbishes or recycles the old equipment resulting in a saving of approximately 9 tCO2e, and the recovery of several critical raw materials that can be reused.
Offsetting Position
As we continue work to reduce our GHG emissions, the Group maintains its commitment to investment in voluntary carbon offset programmes. Whilst we recognise that reducing our emissions must be prioritised over purchasing offsets, there are some emissions which fall outside our control and for which we do not yet have sufficient infrastructure to support a zero emissions outcome.
There is currently no verified carbon offsetting market at our Isle of Man Head Office location. Instead, we select projects that have a focus in geographical locations where our clients and / or our offices are based, ensuring that the projects are of high quality and that the credits are verified. We also focus on projects which capture and sequester carbon, and produce other co-benefits, such as improving lifestyles and have a positive community impact. This financial year we have purchased 150 tCO2e verified carbon offsets in the Sabah Rainforest Rehabilitation project based in Malaysia and 350 tCO2e verified carbon offsets in the Boomitra Grassland Restoration Project in Mexico.
In addition to purchasing offsets from verified sources, we also support projects on the Isle of Man which focus on the sequestration of carbon. The Crossags Project is one such example, with the expectation that once the trees on the site are sufficiently well-established, companies will be able to purchase local, high integrity, verified carbon offsets.
Our ambitions
As in previous years, we have maintained our ambition of reducing our emissions as follows:
- We will aim to reduce Scope 1 and Scope 2 emissions by 50% by 2030, and by 100% by 2050*.
- We will aim to reduce Scope 3 emissions, excluding those relating to our AuA**, by 50% by 2035 and 100% by 2050.
*2022 is our baseline year for measurable Scope 1 and Scope 2 emissions.
**We have not set an ambition for reducing emissions relating to AuA, as investment decisions are made by clients and/or their financial advisers. However, we are working to better understand the emissions associated with our AuA portfolio and explore opportunities to support clients and advisers who want to make more sustainable investment choices.
Enhancing our reporting
During the reporting period we have monitored initiatives to enhance climate and sustainability reporting for UK entities, including development of the UK Sustainability Reporting Standards (UK SRS) S1 and S2, and their anticipated future incorporation into the UK Listing Rules in the near term.
UK SRS represents a significant development in the UK’s approach to climate and sustainability reporting, aligning with jurisdictions that have already integrated the ISSB Sustainability Standards into their reporting frameworks. Greater alignment across jurisdictions supports improved comparability of disclosures, enabling more informed decision making.
In response to these developments, work has commenced to ensure we are well positioned to meet the new requirements. We have undertaken a gap analysis against UK SRS S2 to identify and prioritise required actions or enhancements, with the involvement of functional business areas and provision of training, to establish solid foundations which are future focused.
Pending finalisation of the UK SRS and their incorporation into the UK Listing Rules, we will continue to disclose the Scope 3 emissions data currently collected across the relevant categories. We will also review our approaches to ensure ongoing alignment with evolving regulatory requirements and expectations.
Overall, we have determined there to be no current material financial exposures arising out of our carbon emission levels in terms of specified regulatory caps or direct taxes. At present, our Executive Directors’ remuneration packages are not tied to performance against ESG metrics. We also do not produce any internal carbon pricing, as we do not consider it to be applicable to our current business model.
Stakeholder engagement and Board decision making
We recognise our obligations to adopt a responsible attitude towards our stakeholders in operating our business. As well as shareholders, key stakeholders include employees, contract holders, distribution partners, service providers and the communities in which we operate. The Board seeks to understand the views of such stakeholders in making any key decisions in accordance with the Code. The Board considers that the Group demonstrates a balanced approach in its decision making and that Hansard’s policies and actions fulfil the Group’s obligations.
The Board is accountable to the shareholders for creating and delivering value through the effective governance of the business. The Group places considerable importance on developing its relationships with shareholders and aims to achieve this by way of the following regular communication activities:
- regular dialogue with major institutional shareholders, both directly and through the Company’s advisors.
- market announcements, corporate presentations and other Company information which are available on our website at www.hansard.com; and
- the Annual Report and Accounts issued to all registered shareholders, either in hard copy or electronically.
The CEO and Chair typically meet with the investor community, major shareholders, and analysts at various points throughout the year.
In addition, the Chair of each Committee is available to meet or correspond with major shareholders to discuss any areas of concern not resolved through normal channels of investor communication. There were no significant areas of concern raised during the 2026 financial year. Arrangements can be made to meet with the Chair through the CFO or Company Secretary.
The Board is equally interested in communications with private shareholders and the CFO oversees communication with these investors. All information reported to the regulatory information services is simultaneously published on the Company’s website, affording the widest possible access to Company announcements.
The Board receives regular feedback on the views of shareholders on the Company from its executive team after meetings with those shareholders, as well as from reports from the Company’s corporate brokers, the Chair, and the Senior Independent Director.
By Order of the Board
Hazel Stewart
Company Secretary
23 September 2026
Report OF THE Audit AND RISK Committee
Purpose and terms of reference
This report provides details of the role of the Group Audit and Risk Committee and the work it has undertaken during the year. The primary function of the Audit and Risk Committee is to assist the Board in fulfilling its responsibilities to protect the interests of shareholders with regard to the integrity of financial reporting, risk management and internal controls and overseeing the relationship with the external auditor. The role, responsibilities and work of the Committee can best be understood by reference to its written terms of reference. These are published on the Company’s website, www.hansard.com.
Key responsibilities include:
- monitoring the integrity of the financial statements of the Group, including its annual and interim reports and other formal announcements relating to its financial performance.
- reviewing and reporting to the Board on significant financial reporting issues, accounting policies and judgements.
- reviewing summary financial statements, significant financial returns to regulators and any other financial information contained in certain other documents.
- recommending to the Board the appointment, re-appointment and removal of the external auditor and approving the terms of engagement and remuneration.
- monitoring the independence of the external auditor and the provision of non-audit services.
- monitoring the effectiveness and objectivity of the internal and external auditors.
- reviewing the Group’s systems and controls for the prevention of bribery and procedures for detection of fraud.
- reviewing the effectiveness of internal financial controls and risk management systems relating to financial reporting; and
- reviewing annually the Group’s internal audit requirements and budget.
Composition and structure
At the date of this report, the members of the Committee are David Peach and Lynzi Harrison, who are each Independent Non-executive Directors. David Peach is the Chair of the Committee. The Board is satisfied that during the year, and at the date of this report, at least one member of the Committee has competence in accounting and all members of the Committee have considerable recent and relevant financial experience and competence relevant to the sector in which the Company operates.
The Company Secretary acts as the secretary to the Committee. The Chair of the Committee reports to each subsequent meeting of the Board on the Committee’s work and the Board receives a copy of the minutes of each meeting of the Committee.
Meetings and frequency
The Committee met on 5 occasions during the financial year. The members’ attendance record is set out in the Corporate Governance Report.
During the year, the Chair invited the Group CFO, the other Non-executive Directors, the Head of Internal Audit and KPMG Audit LLC (“KPMG”) (the external auditor) to attend all meetings of the Committee. Other members of senior management, including the Group Chief Executive Officer, the Group Chief Actuary and the Head of Group Risk and Compliance were also invited to attend as appropriate.
It is the Committee’s practice to meet separately, at least once a year, with both the Internal Audit function and with the engagement partner of the external auditor, without any members of management being present. In addition, outside the structure of formal meetings, David Peach has had separate meetings throughout the year directly with the external auditor and the Internal Audit function. David also meets and has regular contact with the Chief Executive Officer, the Chief Financial Officer, the Chief Actuary and the Chief Risk Officer.
In performing its duties, the Committee has access to the services of the Internal Audit Function, the Company Secretary and, if required, external professional advisers.
Subsidiary company audit and risk committees
Each of the Group’s life assurance subsidiaries has established an audit and risk committee that provides an oversight role for its own business. The chair of each of those committees is an Independent Non-executive Director of the relevant company. Each committee operated throughout the financial year and considered specifically the reporting of outsourced services and the valuation of contract holder liabilities, having regard to the opinion of the Chief Actuary.
The minutes of the meetings of those committees are available to the Group Audit and Risk Committee which monitors in particular the adherence of the subsidiaries to regulatory requirements.
Committee activities during the financial year
- Review of accounting and reporting
During the financial year the Committee:
- agreed the annual audit plan with the external auditor, considered the auditor’s reports and monitored management actions in response to the issues raised.
- reviewed the annual and half-yearly report and accounts, including the external auditor’s reports, and associated announcements.
- reviewed the reports and projections of the head of actuarial function and considered any implications for disclosures.
- monitored the submission of key regulatory returns.
- monitored compliance with the relevant parts of the UK Corporate Governance Code, the effectiveness of internal controls and reporting procedures for risk management processes.
- continued to monitor the application of the Group’s policy on whistleblowing, reporting where relevant to the Board; and
- reviewed other Stock Exchange reporting prior to publication of each announcement.
Whilst reviewing the annual and half-yearly report and accounts, the Committee focussed on the following areas where significant financial judgements were required:
- the accounting principles, policies, assumptions, and practices adopted.
- judgements exercised in the production of the financial results including the valuation of certain financial investments, deferred origination costs and deferred income, and the appropriateness of key actuarial assumptions within financial and regulatory reporting.
- the impact of the ongoing geopolitical position with respect to valuation and provisioning issues, longer term actuarial assumptions of contract holder behaviour and going concern disclosures.
- the status of known or potential litigation claims against the Group including accounting treatment in the financial statements and judgements made on whether to recognise a provision or contingent liability, as well as associated insurance recoveries.
- the carrying amount of the investment in subsidiaries in the Parent Company including an assessment of whether any impairment should be recognised.
To assist the Committee’s review of key judgements around the accounting for litigation-related contingent liabilities and provisions, expert input was received from its legal advisors.
- Review of Internal Audit
The Head of Internal Audit reports to the Audit and Risk Committee on the effectiveness of the Group’s systems of risk management and internal control, the adequacy of those systems to manage business risk and to safeguard the Group’s assets and resources. The Internal Audit Department provides objective assurance on risks and controls to the Committee.
The plans, the level of resources and the budget of the Internal Audit Department are reviewed at least annually by the Committee. During the financial year the Committee monitored and reviewed the effectiveness and independence of the Internal Audit Department, including consideration of the plan of assurance and consulting activities (including changes thereof) and results from completed audits and concluded that the Department was fit for purpose.
- Review of External Audit
KPMG Audit LLC (KPMG) was appointed as external auditor in 2020 following a tender process held in 2019.
KPMG was re-appointed as auditor for the year ended 30 June 2026 following shareholder approval at the 2025 AGM.
As KPMG has now been incumbent auditor for 6 years, the Committee has, in line with its terms of reference, determined that it will carry out an Audit Tender during FY27, with any change in auditor taking place for the 27/28 financial year.
The Group has in place a policy to ensure the independence and objectivity of the external auditor. During the year, the Committee performed its annual review of the independence, effectiveness, and objectivity of KPMG, assessing the audit firm, the audit partner, and the audit teams. This is performed through written documentation provided by KPMG which is discussed and challenged where appropriate by the Committee.
The Committee was satisfied with its compliance with the Code and other relevant legislation for the year ended 30 June 2026.
Based on the Committee’s review and with input from Group management and Internal Audit, the Committee concluded that the audit service of KPMG was fit for purpose and provided a robust overall examination of the Group’s business and its associated financial reporting.
The Committee monitored compliance with the Group policy for the provision of non-audit services by the external auditor. This policy aims to ensure that external auditor objectivity and independence is safeguarded and sets out the categories of non-audit services which the external auditor is allowed to provide to the Group in line with the FRC’s Ethical Standard. Financial limits for non-audit related advice and consultancy work by the external audit firm apply to each company in the Group with a limit of £25,000 per company per year. Non-audit assignments exceeding the agreed limits, either individually or cumulatively, must have the prior approval of the Group Audit and Risk Committee. During the year, the Committee approved audit related assurance services relating to Solvency II and the Isle of Man’s risk-based solvency regime.
Details of the amount paid to the external auditors during the year for audit and non-audit related services are set out in Note 8 to the consolidated financial statements.
- Review of internal controls
The Committee has reported to the Board regarding the review of the Group’s risk management and internal control systems, and the results of this reporting are consistent with that set out in the “Review of Risk Management and Internal Control Systems” set out on page 23 of this report.
The Committee considered events during the year and to the date of signing of the Annual Report and Accounts, including internal reporting structures together with reporting from Internal Audit, external audit and the Chief Actuary.
The Committee is cognisant of the changes implemented in the UK Corporate Governance Code 2024 that relate to internal controls, and plans are underway to ensure full compliance as further reported in the “Review of Risk Management of Internal Systems”.
- Review of Committee performance
As part of the external Board performance review this year, the performance of the Audit and Risk Committee was reviewed. There were no areas of significant concern, and it was concluded that the Committee had effectively fulfilled its role.
David Peach
Chair of the Audit and Risk Committee
23 September 2026
REPORT OF THE Nominations Committee
This report provides details of the role of the Nominations Committee and the work it has undertaken during the year.
Purpose and terms of reference
The role, responsibilities and work of the Committee can best be understood by reference to its written terms of reference. These are published on the Company’s website. A summary is set out below:
- to regularly review the structure, size and composition required of the Board (including a review of the scope to further promote diversity of skills, social and ethnic background, nationality, experience, cognitive and personal strengths, knowledge, outlook, approach, and gender) and the membership of the Committees and make recommendations to the Board with regard to any changes.
- to consider succession planning processes for Directors and executive management positions and the opportunities available to the Company to further promote diversity and inclusion; and
- to be responsible for identifying and nominating for the approval of the Board, candidates to fill Board vacancies as and when they arise.
The Committee keeps under review the balance of skills on the Board and the knowledge, experience, length of service and performance of the Directors. It also reviews their external interests with a view to identifying any actual, perceived, or potential conflicts of interests, including the time available to commit to their duties to the Company. Prior to accepting any additional external appointments Directors are required to seek the Board’s approval.
The Committee regularly reviews the structure, size and composition of the Board and Board Committees. This review considers the knowledge, skills and experience of the Directors, and the diversity on the Board and each of its Committees to ensure they are effective in meeting current and future challenges. The skills and experience of the Board are mapped against desired skills using objective criteria to create a skills matrix.
The Group ensures that each of its companies is compliant with relevant applicable legislation relating to health and safety, employment legislation including sex, race, and other discrimination rules, in striving to be an equal opportunity employer. The Group’s recruitment process seeks to find candidates most suited for the job.
The Group respects the dignity of individuals and their beliefs and does not tolerate any sexual, racial, physical or any other form of harassment of employees nor tolerate any discrimination in the workplace.
Membership
At the date of this report, the members of the Committee were the Independent Non-executive Director David Peach, Senior Independent Non-executive Director, Lynzi Harrison, and the Non-executive Group Chairman, Philip Kay. Philip Kay is Chair of the Committee.
The Company Secretary acts as the secretary to the Committee. The Chair of the Committee reports to each subsequent meeting of the Board on the Committee’s work and the Board receives a copy of the minutes of each meeting of the Committee.
Activities of the Committee during the year
The Committee met on three occasions during the year. The members’ attendance record is set out in the Corporate Governance Report.
During the year and to the date of this report the Committee considered the following:
- reviewed the structure, size, and composition of the Board.
- reviewed the skills, experience, and knowledge of each Board member and of the Board as a whole.
- reviewed the time commitment required from the Chair and Non-executive Directors to fulfil their roles.
- instructed Boston Limited to conduct a Board Performance Review by way of a survey sent to all Directors.
- Implemented a Board Diversity Policy.
Directors’ appointments and induction
The Board has a formal procedure in respect of the appointment of new Directors, with the Nominations Committee leading the process and making recommendations to the Board. The Company has in place an induction programme for new Directors to provide them with a full, formal, and tailored induction on joining the Board, which ensures that they attain sufficient knowledge of the Company to discharge their duties and responsibilities effectively.
Diversity
The Committee and Board acknowledges the importance of diversity, including gender diversity, for the Company. The Board acknowledges the FCA Policy Statement on Diversity and Inclusion on company boards and executive management, which sets out targets as follows:
- At least 40% of the board are women.
- At least one of the following senior board positions is held by a woman - Chair, Chief Executive Officer (CEO), Senior Independent Director (SID) or Chief Financial Officer (CFO); and
- At least one board member is from a minority ethnic background, defined by reference to the categories recommended by the Office for National Statistics, excluding those listed as coming from a White ethnic background.
For the purposes of making the disclosures set out below, data was collected through self-reported submissions from the Board and Executive Committee.
|
|
Number of board members |
Percentage of the board |
Number of senior positions in the board (CEO, CFO, SID and Chair) |
Number in Executive Committee |
Percentage of Executive Committee |
|
Men |
5 |
83.3% |
3 |
5 |
63% |
|
Women |
1 |
16.7% |
1 |
3 |
38% |
|
Not specified/prefer not to say |
- |
- |
- |
- |
- |
|
|
Number of board members |
Percentage of the board |
Number of senior positions in the board (CEO, CFO, SID and Chair) |
Number in Executive Committee |
Percentage of Executive management |
|
White British |
5 |
83.3% |
4 |
8 |
100% |
|
White other (including minority white groups) |
- |
- |
- |
- |
- |
|
Mixed/ Multiple Ethnic Groups |
- |
- |
- |
- |
- |
|
Asian/Asian British |
- |
- |
- |
- |
- |
|
Black/African/Caribbean/ Black British |
- |
- |
- |
- |
- |
|
Other ethnic group, including Arab |
1
|
16.7% |
- |
- |
-
|
|
Not specified/ prefer not to say |
- |
- |
- |
- |
- |
The Company recognises that diversity of background, experience, skills, ethnicity, gender, age, disability, sexual orientation, religion and other personal characteristics contributes to effective decision-making, stronger governance and improved business performance.
The Board is committed to promoting a culture of inclusion in which all individuals are treated with dignity, fairness and respect and have equal opportunity to contribute and develop.
In making appointments to the Board, senior management and throughout the organisation, the Company seeks to appoint the best candidate on merit, while actively supporting a diverse range of candidates and perspectives. Recruitment, succession planning and promotion decisions are made through fair and transparent processes and without unlawful discrimination.
The Board reviews diversity and inclusion objectives and outcomes on a regular basis and considers diversity when assessing Board composition, succession plans and leadership development. The Company supports the objectives of the FCA's diversity reporting framework and will report transparently on its diversity policies, objectives and progress.
Each committee is comprised of independent Directors with a diversity of skills and experiences. The role of Senior Independent Director is held by a female and one Director identified in the ARA under the other ethnic group. Whilst only 17% of the Group Board are female, we have strong female representation across the business with three female executive committee members and 50% female representation on our extended leadership team.
The Board aims to maintain a composition that reflects a broad range of backgrounds and perspectives and takes account of the FCA's diversity targets and reporting expectations when considering Board succession, appointments and leadership development.
Review of Committee Performance
The Chair had regular meetings during the year with the Group Chief Executive Officer, Group Chief Financial Officer, and the Non-executive Directors. In addition, after each Board meeting, the Chair held informal sessions with the full Board (without management being present) and with only the Independent Non-executive Directors and the Non-executive Director in attendance (without executive Directors being present). A review of the performance of the Chair was performed by the Non-executive Directors led by the Senior Independent Director.
Philip Kay
Chair of the Nominations Committee
23 September 2026
DIRECTORS’ Remuneration REPORT
This report provides details of the role of the Remuneration Committee and the work it has undertaken during the year.
Purpose and terms of reference
The key responsibilities of the Committee are to:
- determine and make recommendations to the Board on the overall remuneration policy and the remuneration packages of the Executive Directors, the Company Secretary, and such other members of the Executive Committee as it considers appropriate.
- ensure that remuneration is designed to support strategy and promote the long-term sustainable success of the Group.
- review the Executive Directors’ service contracts.
- review the design and operation of share incentive schemes.
- oversee any changes in employee benefit structures throughout the Group; and
- annually review the fees for the Group non-executive directors, Group Chair of the Board, Group Senior Independent Director and the Chairs of the Group Board Sub-Committees.
The role, responsibilities and work of the Committee can best be understood by reference to its terms of reference. These are published on the Company’s website.
Membership
As at the date of this report, members of the Committee are the Independent Non-executive Director, David Peach, Senior Independent Non-executive Director, Lynzi Harrison and the Non-executive Group Chairman, Philip Kay. The Committee was chaired by Noel Harwerth until 23 July 2025. Lynzi Harrison was appointed as Chair effective 24 July 2025.
The Company Secretary acts as the secretary to the Committee. The Chair of the Committee reports to each subsequent meeting of the Board on the Committee’s work and the Board receives a copy of the minutes of each meeting of the Committee.
Activities of the Committee during the year
During the year there were four meetings of the Committee. The members’ attendance record is set out in the Corporate Governance Report.
At the request of the Committee Chair, the CEO also attends meetings and makes recommendations to the Committee regarding changes to particular remuneration packages (excluding himself) or to policies generally. Such recommendations are discussed by the Committee and adopted or amended as it sees fit. The Head of People and Culture provides all necessary support to the Remuneration Committee in executing their duties.
At the request of the Committee, the Head of People and Culture engaged Polymetrix Ltd to provide independent benchmarking information in relation to remuneration. Polymetrix Ltd has no connection with the Company or its Directors.
During the year the Committee also received advice from FIT Remuneration Consultants LLP (“FIT”) who were appointed to advise the Committee in 2022. FIT has no other connection with the Company (or its Directors) and the Committee is satisfied that the advice received from FIT in the 2026 financial year was independent and objective.
During the year and to the date of this report, the Committee addressed issues concerning remuneration and incentive schemes implemented by the Group, in particular:
- agreed awards to be made under bonus schemes for the year ended 30 June 2025.
- agreed Executive Director bonuses for the year ended 30 June 2025.
- agreed the weighting of the corporate performance objectives for the bonus schemes for the year ended 30 June 2026 and assessed achievement of these.
- reviewed Executive Directors’ salaries.
- reviewed Non-executive Directors’ fees for the Company and subsidiary appointments for the year ending 30 June 2026.
- reviewed the Group's incentive arrangements (as further described below).
- developed the terms for a Long-term Incentive Plan, to be proposed to shareholders at the forthcoming Annual General Meeting (as further described below).
- reviewed employee benefits.
- reviewed and approved the remuneration policy.
- agreed the weighting of the corporate performance objectives for the bonus schemes for the year ended 30 June 2027.
- agreed the continuation of enhanced annual bonus provision for 2027 for Executive Directors (CEO and CFO).
Summary of remuneration policy
As an Isle of Man registered company, the Company is not required to present a remuneration policy in the format required by the UK Companies Act. However, the following information is provided to summarise the remuneration policy.
The remuneration policy is designed to:
- recognise the need to be competitive in an international market, though taking account of the local knowledge and packages in the UK and the Isle of Man.
- support key business strategies and create a strong, performance-orientated environment.
- attract, motivate, and retain talent; and
- be aligned to proper risk management consistent with risk tolerance set out by the Board as part of its strategy.
The Committee is satisfied that the remuneration policy operated as intended during the year. The balance of fixed and variable remuneration provides a clear link between performance and reward, supports the Group's strategic objectives and remains aligned with shareholder interests.
The Committee did not exercise discretion in determining remuneration outcomes during the year beyond the exercise of normal commercial judgement in determining all remuneration outcomes appropriately. Bonus outcomes were determined in accordance with the approved remuneration framework and assessed performance outcomes.
Policy on Salary of Executive Directors
It is the policy of the Committee to pay base salaries to the Executive Directors at broadly market rates (taking account of the Isle of Man location where relevant) compared with those of executives of companies of a similar size and international scope, whilst also taking into account the Executive Directors’ personal performance and the performance of the Group. In addition, reliance is placed on the People and Culture function to provide appropriate benchmarking data.
Base salaries for the CEO and CFO were reviewed during the year as part of the Company's annual remuneration review process. In determining salary adjustments, the Committee considered individual and company performance, market competitiveness, external benchmarking data and internal equity.
Details of Executive Directors’ salaries and the fees for Non-executive Directors for the financial year ending 30 June 2027 are set out later in this report
Executive Directors join the Company’s pension scheme with employer contributions of 10% of salary. Thereafter, pension contribution rates increase in line with the Company’s length of service framework. Consequently, the CEO receives employer pension contributions of 10% of salary and the CFO receives employer pension contributions of 14% of salary. Both Executive Directors have elected to make additional pension contributions through salary sacrifice arrangements, as detailed in the Directors’ Remuneration table for the financial year ended 30 June 2026.
Policy on fees for Non-executive Directors
It is our policy to set the fees for each Non-executive Director so that they reflect the time commitment in preparing for and attending meetings, the responsibility and duties of the position and the contribution that is expected from them. Our policy is to pay a market rate which is reviewed annually by the Committee and a recommendation made to the Board for approval.
Incentive plans
The Company operates a number of incentive plans, further described below.
Cash-settled bonus scheme
The Committee approved the continuation of a cash-settled bonus scheme for all employees. The terms of the scheme that became effective from 1 July 2018 incorporate targets for both company and individual performance. Bonuses earned will be paid in the October following the end of the financial year.
Deferred Bonus Plan
The Company operates a bonus deferral plan (the Deferred Bonus Plan) as a mechanism for delivering part of any earned annual discretionary bonus in deferred shares rather than cash. The Plan is intended to strengthen alignment between participants and shareholders by linking part of annual variable remuneration to the Company’s share price over the applicable deferral period.
Awards under the Deferred Bonus Plan may be granted to Executive Directors and other selected employees of the Group who are awarded an annual discretionary bonus. Awards will normally vest after the applicable deferral period, subject to continued employment, any conditions imposed by the Remuneration Committee and the malus and clawback provisions in the Deferred Bonus Plan (as further described below).
The Company does not intend to issue new Shares or transfer treasury Shares to satisfy awards under the Deferred Bonus Plan. Instead, awards are expected to be satisfied using existing Shares purchased in the market and held through the Employee Benefit Trust (as further described in Note 24.2 to the consolidated financial statements) or other nominee arrangement approved by the Board. On that basis, the adoption and operation of the Deferred Bonus Plan does not require specific shareholder approval for the issue of new Shares.
The Deferred Bonus Plan does not of itself increase the maximum annual bonus opportunity under the Company’s remuneration framework. The Remuneration Committee will determine annually whether, and on what basis, the Deferred Bonus Plan should operate and the Company will provide shareholders with disclosure on the use of the Deferred Bonus Plan in the Directors’ Remuneration Report or other relevant shareholder communication, including the proportion of bonus deferred, the number or value of Shares subject to awards and any material exercise of discretion.
Enhanced annual bonus provision for Executive Directors
Our 2024 and 2025 Directors’ Remuneration Reports have explained the enhancement of annual bonus potential for our CEO and CFO by a further 40% of base salary. This enhanced potential will be available only if demanding performance metrics (which may include financial, shareholder value and strategic non-financial measures) are achieved to the Committee’s satisfaction. Any amounts payable under the enhanced potential are payable in cash.
No amount was paid or is payable in respect of the enhanced annual bonus provision for FY 2026.
It is the Committee’s intention that this enhanced potential for the CEO’s and CFO’s annual bonus should apply again in FY 2027.
Proposed Long-term Incentive Plan
The Company will seek shareholders’ approval at the AGM on 4 November 2026 to establish a Long-term Incentive Plan (“LTIP”) in which the Executive Directors may participate.
The LTIP is being proposed in order to provide an appropriate incentive for the participants to deliver on key financial metrics for the business over a period of four financial years to 30 June 2030. The metrics reflect the Group’s strategy with a focus on growing the business in ways that deliver added value to our shareholders. Benefits under the new LTIP will be capped for participants.
The proposed LTIP represents the first such plan offered by the Company. It is intended to be the Company’s LTIP for the four financial years to 30 June 2030; the LTIP will operate for this period and it is intended that there will be one award, based on performance over the four financial years to 30 June 2030.
A detailed summary of the terms of the proposed LTIP will be set out in the Notice of Meeting for the 2026 AGM. In summary, the key commercial terms are as follows:
|
Plan feature |
Summary terms | ||||||||||||||||||||||
|
Participants |
The CEO and CFO | ||||||||||||||||||||||
|
Performance Period |
Four financial years to 30 June 2030 | ||||||||||||||||||||||
|
Metrics |
The performance metric and modifier have been selected to reflect the Group’s strategy with a focus on growing the business in ways that deliver added value to our shareholders. The metric will be Weighted Net Issued Commission Credit (“WNICC”), which values new business over the performance period (Issued Commission Credit) net of actual cancellations in the performance period and with a profitability valuation weighting. A modifier applies such that any level of vesting attained under the WNICC metric may be reduced proportionately if cumulative dividends to shareholders declared in respect of the performance period are less than £24 million. Vesting is to be determined by the following scale.
Straight-line interpolation will apply between the WNICC vesting points. The cumulative dividend modifier will apply as follows:
All targets and ranges which have been set are appropriately stretching and will require superior performance over the performance period. All vesting outcomes will be confirmed by the Remuneration Committee, with overall company performance in the performance period to be considered as an underpin, as is normal for all incentive plans. | ||||||||||||||||||||||
|
Settlement mechanism |
Cash. Ensures total costs are fixed and there is no dilution of shareholders’ interests. | ||||||||||||||||||||||
|
Individual quantum at maximum performance |
For Executive Directors, the maximum cash benefit is capped and is equivalent to 1.5x FY26 base salary per annum for the four financial years (i.e. 6.0 x FY26 base salary in total: £1.5m for the CEO and £1.14m for the CFO) at maximum performance outcomes. | ||||||||||||||||||||||
|
Vesting |
Half of any attained LTIP cash will be paid out after calculation of the performance metrics and confirmation of vesting by the Remuneration Committee following the publication of financial results for the financial year to 30 June 2030. The remaining half will be deferred and paid 12 months later, contingent on continued employment. The Committee has discretion to remove or reduce the 12 months deferral period if it is in the best interests of the Company. | ||||||||||||||||||||||
|
Other terms |
Standard treatments will apply on early terminations (“good leaver and bad leaver”) or on a change of control of the Company, with any vesting in these cases dependent on performance assessments and subject to the normal application of time pro-rating rules. The malus and clawback provisions (see below) for all Company incentive plans will be incorporated in the LTIP rules. |
Malus and Clawback
Robust recovery and withholding provisions, malus and clawback, operate for all incentive plans operated by the Company.
Malus and clawback can operate in the following circumstances:
-
there is reasonable evidence of misbehaviour or material error by the participant, including where the participant:
- participated in or was responsible for conduct which resulted in significant losses to the Company; or
- failed to meet appropriate standards of fitness and propriety;
-
there has been:
- a material misstatement in the Company’s audited financial results; or
- a material downturn in the financial performance of the Company or of the business unit in which the participant is employed;
- there was an error in the information or assumptions on which the award was granted; or
- any other circumstance which the Remuneration Committee considers justifies the application of malus/clawback, including serious reputational damage or corporate failure,
The Remuneration Committee may, in its absolute discretion, determine that malus and/or clawback should apply and the extent to which it should apply.
At any time during the period of three years following the vesting of an award, the Remuneration Committee may determine that clawback should apply where any of the circumstances set out above has occurred. A three-year post-vesting clawback period is intended to ensure that the Remuneration Committee can take appropriate action where circumstances arise that indicate an award was not justified or where outcomes are subsequently found to have been misstated. Given the long-term nature of the Company's business and the potential for issues to emerge some time after performance is assessed, the Committee believes that the period of three years strikes an appropriate balance between maintaining executive accountability, protecting shareholder interests and providing certainty for participants.
There was no operation of either malus or clawback in relation to any of the Company’s incentive plans in the financial year ended 30 June 2026.
Employee Benefit Trust
An Employee Benefit Trust (“EBT”) was established in February 2018 in order to provide certain discretionary share-based awards as part of an overall compensation and retention package. During the year 264,881 shares were purchased and transferred into the EBT. As at 30 June 2026 the EBT held 1,012,015 shares (2025: 1,086,914). The EBT is further described in Note 24.2 to the consolidated financial statements.
Summary of Directors’ employment terms and conditions
In accordance with the Articles of Association all Directors are subject to annual re-election. All Directors subject to election/re-election on 5 November 2025 were elected/re-elected at the AGM held at that date. None of the Directors is engaged on a fixed term contract.
The key terms and benefits of the contractual arrangements between each Executive Director and the Company are as follows:
Thomas Morfett – Group Chief Executive Officer
The Service Agreement in place sets out the contractual employment arrangements, the key terms being Company contribution into personal pension arrangements; private healthcare for himself and his spouse; permanent health insurance; life assurance; full-pay sick leave for a maximum of eight weeks of absence, whether or not consecutive, in any 12-month period due to illness or injury and 30 days annual leave in addition to public holidays. Other than the right to receive a payment in lieu of notice upon termination, his service agreement dated 19 January 2023 (as amended) does not provide for any benefits upon termination of employment. The notice period (by either party) is six months.
Thomas was appointed to the Board on 17 April 2023. Thomas is a participant in the Deferred Bonus Plan, which is based on corporate and individual performance, as set out on page 85.
Ollie Byrne – Group Chief Financial Officer
The Service Agreement in place sets out the contractual employment arrangements, the key terms being Company contribution into personal pension arrangements; private healthcare for himself and his spouse; permanent health insurance; life assurance; full-pay sick leave for a maximum of eight weeks of absence, whether or not consecutive, in any 12-month period due to illness or injury and 30 days annual leave in addition to public holidays. Other than the right to receive a payment in lieu of notice upon termination, his service agreement dated 1 October 2024 does not provide for any benefits upon termination of employment. The notice period (by either party) is twelve months.
Ollie was appointed to the Board on 1 October 2024. Ollie is a participant in the Deferred Bonus Plan, which is based on corporate and individual performance, as set out on page 85.
Non-executive Directors
The appointment of each Non-executive Director has been confirmed by an individual letter of appointment which requires three-month notice to be given in the case of resignation and a one-month notice provision if Hansard wish to end the appointment. The Non-executive Directors do not have service contracts or any benefit-in-kind arrangements and do not receive any performance-related remuneration.
Stakeholder engagement
During the past year we have received feedback on remuneration from certain key shareholders through Non-executive Board member engagement. There is also an avenue for communication and feedback through our corporate broker relationships.
During the year, we conducted an employee engagement survey to better understand the key drivers of engagement across our organisation. The insights gathered were explored further through team discussions, where open and honest dialogue was actively encouraged.
These conversations provided valuable opportunities to gather feedback, explore our approach to reward, and discuss ideas for enhancing the overall employee experience. The themes and suggestions raised have helped inform our ongoing focus on employee engagement and workplace culture.
The key themes from these conversations were shared with both the Executive Committee and the Board, helping to shape our cultural priorities and guide our future action plans.
Directors’ Remuneration for Financial Year 2025/6
The following information, including the table below, includes audited information.
|
Name |
Salary and fees |
Pension |
Cash bonus |
Bonus in Shares 2 |
Other1 |
Aggregate |
Aggregate |
|
|
2026 |
2026 |
2026 |
2026 |
2026 |
2026 |
2025 |
|
|
£ |
£ |
£ |
£ |
£ |
£ |
£ |
|
Executive Directors |
|
|
|
|
|
|
|
|
Thomas Morfett3 (CEO) |
234,043 |
43,000 |
85,625 |
85,625 |
1,133 |
449,426 |
435,773 |
|
Ollie Byrne4 (CFO) |
169,267 |
49,987 |
56,288 |
56,288 |
2,322 |
334,152 |
241,616 |
|
Graham Sheward5 (CEO) |
- |
- |
- |
- |
- |
- |
284,622 |
|
Non-executive Directors |
|
|
|
|
|
|
|
|
Marc Polonsky |
50,000 |
- |
- |
- |
- |
50,000 |
50,000 |
|
Noel Harwerth6 |
12,386 |
- |
- |
- |
- |
12,386 |
45,154 |
|
Jose Ribeiro7 |
- |
- |
- |
- |
- |
- |
31,500 |
|
Philip Kay8 |
120,000 |
- |
- |
- |
- |
120,000 |
120,000 |
|
David Peach9 |
80,000 |
- |
- |
- |
- |
80,000 |
80,000 |
|
Lynzi Harrison10 |
62,217 |
- |
- |
- |
- |
62,217 |
29,167 |
|
Total |
727,913 |
92,987 |
141,913 |
141,913 |
3,455 |
1,108,181 |
1,317,832 |
1. “Other” includes healthcare benefits.
2. This element of the bonus award is awarded in shares under the Deferred Bonus Plan (i.e. deferred for a period of 3 years prior to vesting).
3. Thomas Morfett sacrifices part of his salary for further pension contributions (the value of pension contributions is shown within the Pensions column above).
4. Ollie Byrne sacrifices part of his salary for further pension contributions (the value of pension contributions is shown within the Pensions column above).
5. Graham Sheward (resigned 2 August 2024). The amount shown for Graham Sheward represents salary for July 2024 and then salary for his 12 months’ notice period (with the final payment for the balance of that 12 months’ notice period made in December 2024).
6. Noel Harwerth – resigned 5 November 2025.
7. Jose Ribeiro – resigned 31 December 2024.
8. The amount for Philip Kay includes additional fees in relation to his position as Chair of the Board and Chair of Hansard Europe dac.
9. The amount for David Peach includes additional fees in relation to his position as Chair of the Audit and Risk Committee and Directorship (and Chair of the Audit Committee) of Hansard Europe dac. He is also a Director of Hansard Administration Services Limited.
10. Lynzi Harrison – appointed as Senior Independent Director and Chair of Remuneration Committee effective 24 July 2025.
Annual Bonus for Executive Directors for Financial Year 2025/26
The Committee conducted an assessment of the CEO’s performance against his objectives for FY 2026 related to the achievement of the Company’s principal strategic objectives with a focus on strategic projects, leadership, expenses and IFRS profit.
Following this assessment, the Committee determined a formulaic outcome of 68.5% of the maximum award (equivalent to 100% of base salary) and agreed that this result was justified based on performance. As a result, the Committee approved a total bonus of 68.5% of base salary, split equally: 50% (£85,625) awarded in cash and 50% (£85,625) awarded in shares deferred for three years under the Deferred Bonus Plan.
The Committee conducted an assessment of the CFO’s performance against his objectives for FY 2026 related to the achievement of the Company’s principal strategic objectives with a focus on strategic projects, leadership, expenses and IFRS profit.
Following this assessment, the Committee determined a formulaic outcome of 59.25% of the maximum award (equivalent to 100% of base salary) and agreed that this result was justified based on performance. As a result, the Committee approved a total bonus of 59.25% of base salary, split equally: 50% (£56,287.50) awarded in cash and 50% (£56,287.50) awarded in shares deferred for three years under the Deferred Bonus Plan.
Executive management Deferred Bonus Plan awards
In addition to the Executive Directors, the remaining members of the Executive Committee also participate in the Deferred Bonus Plan. This resulted in the award of 231,133 shares which are deferred for a period of three years.
Directors’ interests in share capital
The following information, presented in the table below, includes audited information.
There are currently no requirements for any Director to have a shareholding in the Company. The Company does not have a policy for post-employment shareholding requirements. The Remuneration Committee considers that both the award of half of all annual bonus amounts in shares deferred for three years under the Deferred Bonus Plan and the performance targets set under the proposed Long-Term Incentive Plan sufficiently align the interests of our Executive Directors with the long-term interests of shareholders such that formal shareholding guidelines are not necessary for the Executive Directors.
The Polonsky Foundation (a UK Registered Charity of which Marc Polonsky is a trustee) has a beneficial interest in 58,494,027 shares in the Company’s share capital, or 42.52% (2025: 7.2%).
The table set out below shows the beneficial interests of other Directors and their spouses in the Company’s share capital, at 30 June 2026 and at 30 June 2025.
|
Number of shares |
Direct |
Indirect |
Total 2026 |
Direct |
Indirect |
Total 2025 |
|
Executive Directors |
|
|
|
|
|
|
|
Thomas Morfett |
74,899 |
- |
74,899 |
74,899 |
- |
74,899 |
|
Ollie Byrne |
105,800 |
- |
105,800 |
105,800 |
- |
105,800 |
|
Non-executive Directors |
|
|
|
|
| |
|
Marc Polonsky1 |
7,800,000 |
- |
7,800,000 |
7,800,000 |
- |
7,800,000 |
1Direct holdings include shares held by spouse.
There have been no other significant changes in these holdings between the balance sheet date and the date of this report.
Directors’ salaries and fees for the financial year ending 30 June 2027
The following table sets out the salary and fee levels approved by the Remuneration Committee for the year ending 30 June 2027 for each Director, as agreed by the Board. With the exception of the proposed LTIP, there have been no changes in relation to non-salary benefits applicable to any Director.
|
Name |
Salary and Fees 2027 |
|
|
£ |
|
Executive Directors |
|
|
Thomas Morfett (CEO) 1 |
275,000 |
|
Ollie Byrne (CFO) 2 |
200,000 |
|
Non-executive Directors |
|
|
Marc Polonsky |
50,000 |
|
Philip Kay3 |
130,000 |
|
David Peach4 |
88,000 |
|
Lynzi Harrison5 |
68,000 |
|
Total |
811,000 |
- CEO salary for 2027 has been reviewed and revised in line with market data.
- CFO salary for 2027 has been reviewed and revised in line with market data.
- The amount for Philip Kay includes additional fees in relation to his position as Chair of the Board and Chair of Hansard Europe dac. Fees for 2027 have been reviewed and revised in line with market data.
- The amount for David Peach includes additional fees in relation to his position as Chair of the Audit and Risk Committee and Directorship (and Chair of the Audit Committee) of Hansard Europe dac. He is also a Director of Hansard Administration Services Limited. Fees for 2027 have been reviewed and revised in line with market data.
- The amount for Lynzi Harrison includes additional fees in relation to her position as Chair of the Remuneration Committee and Senior Independent Director. Fees for 2027 have been reviewed and revised in line with market data.
Compliance with Code
As mentioned above, the Company does not currently operate a formal shareholding policy and, accordingly, the Company has not fully complied with Provision 36 of the UK Corporate Governance Code 2024 during the reporting period.
Lynzi Harrison
Chair of the Remuneration Committee
23 September 2026
Our opinion is unmodified
We have audited the financial statements of Hansard Global plc (“the Company”) and its subsidiaries (together, the ‘Group’) which comprise the consolidated balance sheet and parent company balance sheet as at 30 June 2026, the consolidated statements of profit and loss, other comprehensive income, changes in equity and cash flows and parent company statements of changes in equity and cash flows for the year then ended, and related notes, comprising material accounting policies and other explanatory information.
In our opinion,
- the accompanying financial statements give a true and fair view of the state of the Group's and of the Company's affairs as at 30 June 2026 and of the Group's profit for the year then ended;
- the Group financial statements have been properly prepared in accordance with UK-Adopted International Accounting Standards;
- the Company financial statements have been properly prepared in accordance with UK Accounting Standards including FRS 102 The Financial Reporting Standard applicable in the UK and Republic of Ireland; and
- the financial statements have been properly prepared in accordance with the requirements of the Companies Acts 1931 to 2004.
Basis for opinion
We conducted our audit in accordance with International Standards on Auditing (UK) (“ISAs (UK)”) and applicable law. Our responsibilities are described below. We have fulfilled our ethical responsibilities under, and are independent of the Company and Group in accordance with, UK ethical requirements including the FRC Ethical Standard as required by the Crown Dependencies' Audit Rules and Guidance. We believe that the audit evidence we have obtained is a sufficient and appropriate basis for our opinion.
Key audit matters: our assessment of the risks of material misstatement
Key audit matters are those matters that, in our professional judgement, were of most significance in the audit of the financial statements and include the most significant assessed risks of material misstatement (whether or not due to fraud) identified by us, including those which had the greatest effect on: the overall audit strategy; the allocation of resources in the audit; and directing the efforts of the engagement team. These matters were addressed in the context of our audit of the financial statements as a whole, and in forming our opinion thereon, and we do not provide a separate opinion on these matters. In arriving at our audit opinion above, the key audit matters, in decreasing order of significance for the financial statements were as follows:
|
|
The risk |
Our response |
|
|
|
|
|
Revenue recognition £49.8m (2025: £47.5m) Risk vs 2025: same Refer to the Audit and Risk Committee Report on page 76, note 5 accounting policy and note 18 disclosures.
|
Calculation error and subjective estimate The Group charges fees to investment contract holders for contract administration services, investment management services, payment of benefits and other services related to the administration of investment contracts. Determination of revenue earned can be complex where the fee calculation includes judgement in the determination of the life of the contract and actuarial funding factors to apply in amortisation of deferred income. There is a risk that the assumptions and judgements made in the determination of revenue may not be appropriate due to fraud or error.
Additionally, as certain fee income is determined based on the valuation of investments during the year, there is a risk that revenue may not be calculated accurately.
|
Our audit procedures included: Control design and operation
Use of KPMG specialists
Testing accuracy of data
Test of details
Assessing transparency
|
|
|
The risk |
Our response |
|
|
|
|
|
Litigation and claims liabilities, contingent liabilities disclosure Provision: £5.6m (2025: £0.7m) Contingent liabilities: £9.7m (2025: £20.4m) Risk vs 2025: same Refer to the Audit and Risk Committee Report on page 76, note 20 provision and note 26.1 accounting policy and disclosure.
|
Dispute outcomes and omitted exposures The Group is subject to a number of legal claims from policyholders in relation to the performance of assets linked to investment contracts and other asset related issues. Management evaluates each legal claim, taking into consideration the assessment and advice of external legal counsel. As at 30 June 2026, the Group had been served with cumulative writs with a net exposure (excluding cases for which a provision has been made) totalling £9.7m (2025: £20.4m) and the judgement made by management as to whether the Group is more likely than not to be successful in contesting these claims is highly subjective. It is the Group’s position that all such legal claims will be contested, except where the Group decides it is appropriate to reach a settlement agreement. This is on the basis that the Group does not provide investment advice and that any investment advice received by the policyholder would have been provided by a professional intermediary appointed by the policyholder. The amounts involved are potentially significant, and the application of accounting standards to determine the amount, if any, to be provided as a liability, is inherently subjective. There is a risk that the litigation provisions and disclosure for potential financial losses to the group may not be complete. There is also a risk that judgements made by management in assessing whether to recognise a provision or disclose a contingent liability may not be appropriate. The effect of these matters is that, as part of our risk assessment, we determined that the litigation provision liability and disclosed contingent liability has a high degree of estimation uncertainty, with a potential range of reasonable outcomes greater than our materiality for the Group financial statements as a whole. |
Our audit procedures included: Control design and implementation Testing the design and implementation of internal controls over the litigations process.
Confirmation from lawyers
Testing completeness and accuracy of data
Historical comparison
Test of details
Assessing transparency
|
|
|
The risk |
Our response |
|
|
|
|
|
Insurance recovery asset Insurance recovery asset: £7.9m (2025: Nil) Risk vs 2025: New Refer to the Audit and Risk Committee Report on page 76, note 15 other receivables and note 26.1 accounting policy and disclosure.
|
Insurance recovery asset recognition and recoverability
During the year, the Group recognised an insurance recovery asset in respect of litigation settlements and associated historical legal costs. There is a risk that the recognition criteria for a reimbursement asset under IAS 37 have not been met.
|
Our audit procedures included: Control design and implementation Testing the design and implementation of internal controls over the insurance recovery asset process. Test of details
Assessing transparency
|
|
|
The risk |
Our response |
|
|
|
|
|
Valuation of structured notes held at fair value (level 3) £76.8m (2025: £71.0m) Risk vs 2025: same Refer to the Audit and Risk Committee Report on page 76, note 3.6 accounting policy and note 17.3 disclosures |
Subjective valuation The Group holds and manages investments on behalf of policyholders. A number of the structured notes are noted as being illiquid in nature, predominantly due to an active market not being available for these investments. These assets are measured at fair value. Auditor judgement is required in determining the appropriate valuation methodology where external pricing sources are either not readily available or are unreliable. The fair value of structured notes is determined by using third party pricing information; therefore there is judgement involved to conclude whether the price obtained is reflective of fair value. There is a significant risk that the investments may not be valued appropriately due to estimation uncertainty inherent in unobservable pricing inputs or where a significant degree of judgement is required. There is also a risk that the fair value levelling disclosures in the financial statements might not be appropriate as required by IFRS 13. Due to the linked nature of the contracts administered by the Group’s insurance undertakings, any change in the value of structured notes will result in an equal and opposite change in the value of contract liabilities. Any change in the structured notes value will also have an impact on fee income which is calculated as a percentage of investment values. |
Our audit procedures included: Control design and implementation
Use of KPMG Specialists
Assessing disclosures
|
|
|
The risk |
Our response |
|
|
|
|
|
Parent Company’s investment in subsidiaries £71.8m (2025: £71.6m) Risk vs 2025: same Refer to page 76 of the Audit and Risk Committee Report and note 4 disclosures
|
Low risk, high value The carrying amount of the investment in subsidiaries represents 74.7% (2025: 73.7%) of the Company’s total assets. The carrying amount of the investment in subsidiaries is measured at cost less impairment and is considered to have a low risk of material misstatement. However, due to its materiality in the context of the Company’s financial statements, this is considered to be the area that had the greatest effect on our overall Company audit. |
Our audit procedures included: Tests of detail
Assessing Disclosures
|
Our application of materiality and an overview of the scope of our audit
Materiality for the Group financial statements as a whole was set at £207K (2025: £220K), determined with reference to a benchmark of group profit before tax. Materiality for the Company financial statements as a whole was set at £82K (2025: £154K), determined with reference to the allocated Group materiality as above, of which it represents 40% (2025: 70%).
In line with our audit methodology, our procedures on individual account balances and disclosures were performed to a lower threshold, performance materiality, so as to reduce to an acceptable level the risk that individually immaterial misstatements in individual account balances add up to a material amount across the financial statements as a whole. Performance materiality was set at 75% (2025: 75%) of materiality for the financial statements as a whole, which equates to £154k (2025: £165K) for the Group and £61.5K (2025: £115.5K) for the Company.
In addition, we have set a higher materiality at £10,800K (2025: £10,100K) solely for the purpose of identifying and evaluating the effect of misstatements that lead to a reclassification between line items within the policyholder assets and liabilities and associated income statement line items in the Group financial statements, to the extent that any such balances offset and have no net impact on the shareholder’s equity and reserves. This has been determined in reference to 0.75% (2025: 0.75%) of total assets.
We reported to the Audit Committee any corrected or uncorrected identified misstatements exceeding £10.4K (2025: £11.0K) for the Group and £4.1K (2025: £7.7K) for the Company, in addition to other identified misstatements that warranted reporting on qualitative grounds. For certain financial statement captions, as referred to above, any corrected or uncorrected identified policy holder reclassification misstatements exceeding £540K (2025: £505K) have been reported to the Audit Committee.
Our audit of the Group was undertaken to the materiality level specified above, which has informed our identification of significant risks of material misstatement and the associated audit procedures performed in those areas as detailed above.
We performed risk assessment procedures to determine which of the Group’s components are likely to include risks of material misstatement to the Group financial statements and which procedures to perform at these components to address those risks.
In total, we identified 11 components, having considered the structure of the Group. We performed audit procedures on 7 components, in relation to components that accounted for 100% of Group profit before tax and 100% of Group total assets.
Going concern
The directors have prepared the financial statements on the going concern basis as they do not intend to liquidate the Group or the Company or to cease their operations, and as they have concluded that the Group and the Company's financial position means that this is realistic. They have also concluded that there are no material uncertainties that could have cast significant doubt over their ability to continue as a going concern for at least a year from the date of approval of the financial statements (the “going concern period").
In our evaluation of the directors' conclusions, we considered the inherent risks to the Group and the Company's business model and analysed how those risks might affect the Group and the Company's financial resources or ability to continue operations over the going concern period. The risks that we considered most likely to affect the Group and the Company's financial resources or ability to continue operations over this period were:
- Availability of capital to meet operating costs and other financial commitments;
- Availability of capital to meet regulatory and solvency requirements;
We considered whether these risks could plausibly affect the liquidity in the going concern period by comparing severe, but plausible downside scenarios that could arise from these risks individually and collectively against the level of available financial resources indicated by the Group’s and Company’s financial forecasts.
We considered whether the going concern disclosure in note 1.4 to the Group financial statements gives a full and accurate description of the directors' assessment of going concern.
Our conclusions based on this work:
- we consider that the directors' use of the going concern basis of accounting in the preparation of the financial statements is appropriate;
- we have not identified, and concur with the directors' assessment that there is not, a material uncertainty related to events or conditions that, individually or collectively, may cast significant doubt on the Group and the Company's ability to continue as a going concern for the going concern period; and
- we have nothing material to add or draw attention to in relation to the directors' statement in the notes to the financial statements on the use of the going concern basis of accounting with no material uncertainties that may cast significant doubt over the Group and the Company's use of that basis for the going concern period, and that statement is materially consistent with the financial statements and our audit knowledge.
However, as we cannot predict all future events or conditions and as subsequent events may result in outcomes that are inconsistent with judgements that were reasonable at the time they were made, the above conclusions are not a guarantee that the Group and the Company will continue in operation.
Fraud and breaches of laws and regulations – ability to detect
Identifying and responding to risks of material misstatement due to fraud
To identify risks of material misstatement due to fraud (“fraud risks”) we assessed events or conditions that could indicate an incentive or pressure to commit fraud or provide an opportunity to commit fraud. Our risk assessment procedures included:
- enquiring of management as to the Group’s policies and procedures to prevent and detect fraud as well as enquiring whether management have knowledge of any actual, suspected or alleged fraud;
- reading minutes of meetings of those charged with governance; and
- using analytical procedures to identify any unusual or unexpected relationships.
As required by auditing standards, and taking into account possible incentives or pressures to misstate performance and our overall knowledge of the control environment, we perform procedures to address the risk of management override of controls and the risk of fraudulent revenue recognition, and the risk that management may be in a position to make inappropriate accounting entries. We did not identify any additional fraud risks.
We performed procedures including:
- identifying journal entries and other adjustments to test based on risk criteria and comparing any identified entries to supporting documentation;
- incorporating an element of unpredictability in our audit procedures and;
- those set out in the revenue recognition key audit matter.
Identifying and responding to risks of material misstatement due to non-compliance with laws and regulations
We identified areas of laws and regulations that could reasonably be expected to have a material effect on the financial statements from our sector experience and through discussion with management (as required by auditing standards), and from inspection of the Group’s regulatory and legal correspondence, if any, and discussed with management the policies and procedures regarding compliance with laws and regulations. As the Group is regulated, our assessment of risks involved gaining an understanding of the control environment including the entity’s procedures for complying with regulatory requirements.
The Group and Company are subject to laws and regulations that directly affect the financial statements including financial reporting legislation and taxation legislation and we assessed the extent of compliance with these laws and regulations as part of our procedures on the related financial statement items.
The Group and Company are subject to other laws and regulations where the consequences of non-compliance could have a material effect on amounts or disclosures in the financial statements, for instance through the imposition of fines or litigation or impacts on the Group and the Company’s ability to operate. We identified financial services regulation as being the area most likely to have such an effect, recognising the regulated nature of the Group’s activities and its legal form. Auditing standards limit the required audit procedures to identify non-compliance with these laws and regulations to enquiry of management and inspection of regulatory and legal correspondence, if any. Therefore if a breach of operational regulations is not disclosed to us or evident from relevant correspondence, an audit will not detect that breach.
Context of the ability of the audit to detect fraud or breaches of law or regulation
Owing to the inherent limitations of an audit, there is an unavoidable risk that we may not have detected some material misstatements in the financial statements, even though we have properly planned and performed our audit in accordance with auditing standards. For example, the further removed non-compliance with laws and regulations is from the events and transactions reflected in the financial statements, the less likely the inherently limited procedures required by auditing standards would identify it.
In addition, as with any audit, there remains a higher risk of non-detection of fraud, as this may involve collusion, forgery, intentional omissions, misrepresentations, or the override of internal controls. Our audit procedures are designed to detect material misstatement. We are not responsible for preventing non-compliance or fraud and cannot be expected to detect non-compliance with all laws and regulations.
Other information
The directors are responsible for the other information. The other information comprises the information included in the annual report but does not include the financial statements and our auditor's report thereon. Our opinion on the financial statements does not cover the other information and we do not express an audit opinion or any form of assurance conclusion thereon.
In connection with our audit of the financial statements, our responsibility is to read the other information and, in doing so, consider whether the other information is materially inconsistent with the financial statements or our knowledge obtained in the audit, or otherwise appears to be materially misstated. If, based on the work we have performed, we conclude that there is a material misstatement of this other information, we are required to report that fact. We have nothing to report in this regard.
Disclosures of emerging and principal risks and longer term viability
We are required to perform procedures to identify whether there is a material inconsistency between the directors’ disclosures in respect of emerging and principal risks and the viability statement, and the Group financial statements and our audit knowledge. We have nothing material to add or draw attention to in relation to:
- the directors’ confirmation within the longer-term viability statement (page 41) that they have carried out a robust assessment of the emerging and principal risks facing the Group, including those that would threaten its business model, future performance, solvency or liquidity;
- the emerging and principal risks disclosures describing these risks and explaining how they are being managed or mitigated;
- the directors’ explanation in the longer-term viability statement (page 41) as to how they have assessed the prospects of the Group, over what period they have done so and why they consider that period to be appropriate, and their statement as to whether they have a reasonable expectation that the Group will be able to continue in operation and meet its liabilities as they fall due over the period of their assessment, including any related disclosures drawing attention to any necessary qualifications or assumptions.
We are also required to review the longer-term viability statement, set out on page 41 under the Listing Rules. Based on the above procedures, we have concluded that the above disclosures are materially consistent with the Group financial statements and our audit knowledge.
Corporate governance disclosures
We are required to perform procedures to identify whether there is a material inconsistency between the directors’ corporate governance disclosures and the Group financial statements and our audit knowledge.
Based on those procedures, we have concluded that each of the following is materially consistent with the Group financial statements and our audit knowledge:
- the directors’ statement that they consider that the annual report and Group financial statements taken as a whole is fair, balanced and understandable, and provides the information necessary for shareholders to assess the Group’s position and performance, business model and strategy;
- the section of the annual report describing the work of the Audit Committee, including the significant issues that the Audit Committee considered in relation to the financial statements, and how these issues were addressed; and
- the section of the annual report that describes the review of the effectiveness of the Group’s risk management and internal control systems.
We are required to review the part of Corporate Governance Statement relating to the Company’s compliance with the provisions of the UK Corporate Governance Code specified by the Listing Rules for our review. We have nothing to report in this respect.
We have nothing to report on other matters on which we are required to report by exception
We have nothing to report in respect of the following matters where the Companies Acts 1931 to 2004 require us to report to you if, in our opinion:
- proper books of account have not been kept by the Company and proper returns adequate for our audit have not been received from branches not visited by us; or
- the Company financial statements are not in agreement with the books of account and returns; or
- certain disclosures of directors’ remuneration specified by law are not made; or
- we have not received all the information and explanations we require for our audit.
Respective responsibilities
Directors' responsibilities
As explained more fully in their statement set out on page 42, the directors are responsible for: the preparation of the financial statements including being satisfied that they give a true and fair view; such internal control as they determine is necessary to enable the preparation of financial statements that are free from material misstatement, whether due to fraud or error; assessing the Group and Company’s ability to continue as a going concern, disclosing, as applicable, matters related to going concern; and using the going concern basis of accounting unless they either intend to liquidate the Group or the Company or to cease operations, or have no realistic alternative but to do so.
Auditor's responsibilities
Our objectives are to obtain reasonable assurance about whether the financial statements as a whole are free from material misstatement, whether due to fraud or error, and to issue our opinion in an auditor’s report. Reasonable assurance is a high level of assurance, but does not guarantee that an audit conducted in accordance with ISAs (UK) will always detect a material misstatement when it exists. Misstatements can arise from fraud or error and are considered material if, individually or in aggregate, they could reasonably be expected to influence the economic decisions of users taken on the basis of the financial statements.
A fuller description of our responsibilities is provided on the FRC’s website at www.frc.org.uk/auditorsresponsibilities.
The purpose of this report and restrictions on its use by persons other than the Company's members as a body
This report is made solely to the Company’s members, as a body, in accordance with section 15 of the Companies Act 1982. Our audit work has been undertaken so that we might state to the Company’s members those matters we are required to state to them in an auditor’s report and for no other purpose. To the fullest extent permitted by law, we do not accept or assume responsibility to anyone other than the Company and the Company’s members, as a body, for our audit work, for this report, or for the opinions we have formed.
Nicholas Quayle
Responsible Individual
For and on behalf of KPMG Audit LLC
Chartered Accountants and Recognised Auditors
Heritage Court
41 Athol Street
Douglas
Isle of Man IM1 1LA
23 September 2026
Financial results under
UK Adopted International Accounting Standards
For the year ended
30 June 2026
|
Consolidated Statement of Profit or loss for the year ended 30 June 2026 | ||||||
|
| ||||||
|
|
|
Year ended |
Year ended | |||
|
|
|
30 June |
30 June | |||
|
|
|
2026 |
2025 As restated1 | |||
|
|
Notes |
£m |
£m | |||
|
|
|
|
| |||
|
|
|
|
| |||
|
Fees and commissions |
5 |
49.8 |
47.5 | |||
|
|
|
|
| |||
|
Investment income |
6 |
197.8 |
32.3 | |||
|
|
|
|
| |||
|
Other operating income |
|
- |
- | |||
|
|
|
|
| |||
|
|
|
247.6 |
79.8 | |||
|
|
|
|
| |||
|
Change in provisions for investment contract liabilities |
17 |
(193.6) |
(27.1) | |||
|
|
|
|
| |||
|
Origination costs |
7 |
(15.0) |
(15.0) | |||
|
|
|
|
| |||
|
Administrative and other expenses |
8 |
(32.5) |
(36.7) | |||
|
|
|
(241.1) |
(78.8) | |||
|
Profit before tax |
|
6.5 |
1.0 | |||
|
|
|
|
| |||
|
Income tax expense |
10 |
- |
- | |||
|
|
|
|
| |||
|
Profit for the year |
|
6.5 |
1.0 | |||
|
|
|
|
|
|
|
|
1See Note 1.2 for further details on the restatement.
The notes on pages 111 to 148 form an integral part of these financial statements.
|
Consolidated Statement of Other Comprehensive Income for the year ended 30 June 2026 | ||||||
|
| ||||||
|
|
|
Year ended |
Year ended | |||
|
|
|
30 June |
30 June | |||
|
|
|
2026 |
2025 As restated1 | |||
|
|
Notes |
£m |
£m | |||
|
Profit for the year |
|
6.5 |
1.0 | |||
|
Other comprehensive income |
|
|
| |||
|
Items that are or may subsequently be reclassified to Profit or Loss |
|
|
| |||
|
Cash flow hedges, effective portion of changes in fair value |
3 |
(0.3) |
- | |||
|
|
|
|
| |||
|
|
|
|
| |||
|
Total comprehensive income for the year |
|
6.2 |
1.0 | |||
|
|
|
|
|
|
|
|
|
Earnings per share | ||||||
|
|
|
|
|
|
As restated1 |
|
|
|
|
|
2026 |
2025 |
|
|
|
|
Note |
(p) |
(p) |
|
|
|
|
|
|
|
|
Basic |
|
|
11 |
4.7 |
0.7 |
|
|
|
|
|
|
|
|
Diluted |
|
|
11 |
4.7 |
0.7 |
|
|
|
|
|
|
|
1See Note 1.2 for further details on the restatement.
The notes on pages 111 to 148 form an integral part of these financial statements.
Consolidated Statement of Changes in Equity
for the year ended 30 June 2026
|
As restated |
|
Share |
Hedge |
Other |
Retained |
|
|
|
|
capital |
Reserve |
reserves |
earnings |
Total |
|
|
|
£m |
£m |
£m |
£m |
£m |
|
At 1 July 2024 (as reported) |
68.8 |
- |
(48.6) |
0.6 |
20.8 | |
|
Effect of prior period restatement1 |
- |
- |
- |
0.8 |
0.8 | |
|
At 1 July 2024 (as restated) |
68.8 |
- |
(48.6) |
1.4 |
21.6 | |
|
|
|
|
|
|
| |
|
Total comprehensive income for the |
- |
- |
- |
1.0 |
1.0 | |
|
year (as restated) |
|
|
|
|
| |
|
Share based payment reserve |
- |
- |
- |
- |
- | |
|
Transactions with owners |
|
|
|
|
| |
|
Dividends paid |
- |
- |
- |
(6.1) |
(6.1) | |
|
At 30 June 2025 (restated) |
68.8 |
- |
(48.6) |
(3.7) |
16.5 | |
|
|
|
Share |
Hedge |
Other |
Retained |
|
|
|
|
capital |
Reserve |
reserves |
earnings |
Total |
|
|
|
£m |
£m |
£m |
£m |
£m |
|
At 1 July 2025 |
68.8 |
- |
(48.6) |
(3.7) |
16.5 | |
|
Other comprehensive loss |
- |
(0.3) |
- |
- |
(0.3) | |
|
|
|
|
|
|
| |
|
Profit for the year |
- |
- |
- |
6.5 |
6.5 | |
|
|
|
|
|
|
| |
|
Total comprehensive income for the year |
- |
(0.3) |
- |
6.5 |
6.2 | |
|
Share based payment reserve |
- |
- |
- |
- |
- | |
|
Transactions with owners |
|
|
|
|
| |
|
Dividends paid |
- |
- |
- |
(6.1) |
(6.1) | |
|
At 30 June 2026 |
68.8 |
(0.3) |
(48.6) |
(3.3) |
16.6 | |
1See Note 1.2 for further details on the restatement.
The notes on pages 111 to 148 form an integral part of these financial statements.
|
Consolidated Balance Sheet As at 30 June 2026 |
|
|
|
30 June 2026 |
30 June 2025 As restated1 |
1 July 2024 As restated1 |
|
|
Notes |
£m |
£m |
£m |
|
Assets |
|
|
|
|
|
Intangible assets |
13 |
20.5 |
22.1 |
23.2 |
|
Property, plant and equipment |
13 |
2.4 |
2.8 |
2.6 |
|
Deferred origination costs |
14 |
102.0 |
106.3 |
112.1 |
|
|
|
|
|
|
|
Financial investments Measured at fair value: |
|
|
|
|
|
Equity securities |
3 |
95.9 |
76.8 |
78.9 |
|
Investments in collective investment schemes |
3 |
1,007.1 |
907.7 |
937.5 |
|
Fixed income securities, bonds and structured notes |
3 |
88.9 |
84.4 |
70.6 |
|
Measured at amortised cost: Deposits and money market funds |
3 |
1,191.9
95.8 |
1,068.9
87.2 |
1,087.0
88.2 |
|
|
|
|
|
|
|
Other receivables |
15 |
24.2 |
11.1 |
6.4 |
|
Cash and cash equivalents |
16 |
63.7 |
51.5 |
47.9 |
|
Total assets |
|
1,500.5 |
1,349.9 |
1,367.4 |
|
|
|
|
|
|
|
Liabilities |
|
|
|
|
|
Financial liabilities under investment contracts |
17 |
1,260.6 |
1,129.8 |
1,150.9 |
|
Deferred income |
18 |
132.9 |
137.5 |
140.2 |
|
Amounts due to investment contract holders |
17 |
66.3 |
48.4 |
38.6 |
|
Other payables |
19 |
18.5 |
17.0 |
15.6 |
|
Provisions |
20 |
5.6 |
0.7 |
0.5 |
|
Total liabilities |
|
1,483.9 |
1,333.4 |
1,345.8 |
|
Net assets |
|
16.6 |
16.5 |
21.6 |
|
|
|
|
|
|
|
Shareholders’ equity |
|
|
|
|
|
Called up share capital |
22 |
68.8 |
68.8 |
68.8 |
|
Other reserves |
23 |
(48.6) |
(48.6) |
(48.6) |
|
Hedge reserve |
|
(0.3) |
- |
- |
|
Retained earnings |
|
(3.3) |
(3.7) |
1.4 |
|
Total shareholders’ equity |
|
16.6 |
16.5 |
21.6 |
1See Note 1.2 for further details on the restatement.
The notes on pages 111 to 148 form an integral part of these financial statements.
The financial statements on pages 106 to 148 were approved by the Board on 23 September 2026 and signed on its behalf by:
Thomas MorfettOllie Byrne
Director Director
|
Consolidated Cash Flow Statement for the year ended 30 June 2026 | |||||||
|
|
|
|
|
2026 |
2025 As restated1 |
| |
|
|
|
|
|
|
£m |
£m |
|
|
|
|
|
|
|
|
|
|
|
Cash flow from operating activities |
|
|
| ||||
|
Profit before tax for the year |
6.5 |
1.0 |
| ||||
|
Adjustments for: |
|
|
| ||||
|
Depreciation and amortisation |
2.2 |
1.9 |
| ||||
|
Dividends receivable |
(8.1) |
(6.1) |
| ||||
|
Dividends received |
8.1 |
6.1 |
| ||||
|
Interest receivable |
(4.6) |
(4.9) |
| ||||
|
Interest received |
4.6 |
4.7 |
| ||||
|
Movement in share based payment reserve |
(0.2) |
- | |||||
|
Foreign exchange (losses) / gains |
(0.3) |
(0.9) |
| ||||
|
|
|
|
| ||||
|
Changes in operating assets and liabilities |
|
|
| ||||
|
Increase in other receivables |
(12.4) |
(4.1) |
| ||||
|
Decrease in deferred origination costs |
4.3 |
5.8 |
| ||||
|
Decrease in deferred income |
(4.6) |
(2.8) |
| ||||
|
Increase in creditors |
24.1 |
11.6 |
| ||||
|
Payment on settlement of derivatives |
(0.1) |
- |
| ||||
|
(Increase) / Decrease in financial investments |
(131.4) |
22.8 |
| ||||
|
Increase / (Decrease) in financial liabilities |
130.8 |
(21.1) |
| ||||
|
Cash flow from operations |
18.9 |
14.0 |
| ||||
|
Corporation tax paid |
- |
(0.1) |
| ||||
|
Cash flow from operations after taxation |
18.9 |
13.9 |
| ||||
|
Cash flows from investing activities |
|
|
| ||||
|
Investment in intangible assets |
(0.1) |
(0.5) |
| ||||
|
Investment in property, plant and equipment |
(0.2) |
(0.5) |
| ||||
|
Purchase of investments |
- |
(3.8) |
| ||||
|
Purchase of own shares |
(0.3) |
(0.1) |
| ||||
|
Cash flows used in investing activities |
(0.6) |
(4.9) |
| ||||
|
Cash flows from financing activities |
|
|
| ||||
|
Dividends paid |
(6.1) |
(6.1) |
| ||||
|
Principal elements of leased liabilities |
(0.3) |
(0.2) |
| ||||
|
Cash flows used in financing activities |
(6.4) |
(6.3) |
| ||||
|
Net increase / (decrease) in cash and cash equivalents |
11.9 |
2.7 |
| ||||
|
Cash and cash equivalents at beginning of year |
51.5 |
47.9 |
| ||||
|
Effect of exchange rate movements |
0.3 |
0.9 |
| ||||
|
Cash and cash equivalents at year end |
63.7 |
51.5 |
| ||||
|
|
|
|
|
|
|
|
|
1See Note 1.2 for further details on the restatement.
Notes to the consolidated financial statements
1 General Information
Hansard Global plc (“the Company”) is a limited liability company, incorporated in the Isle of Man under the Isle of Man Companies Acts 1931 to 2004, whose shares are publicly traded. The principal activity of the Company is to act as the holding company of the Hansard group of companies. The activities of the principal operating wholly owned subsidiaries include the transaction of life assurance business and related activities. Hansard Europe was closed to new business with effect from 30 June 2013. The subsidiaries of the Company are as follows:
|
Company name |
Incorporated |
Activity |
|
Hansard International Limited |
Isle of Man |
Life Assurance |
|
Hansard Worldwide Limited |
The Bahamas |
Life Assurance |
|
Hansard Europe Designated Activity Company |
Ireland |
Life Assurance |
|
Hansard Administration Services Limited |
Isle of Man |
Administration Services |
|
Hansard Development Services Limited |
Isle of Man |
Marketing and Development Services |
|
Hansard Development Services DMCC |
United Arab Emirates |
Marketing and Development Services |
|
Hansard Development Services (Middle East) Limited |
United Arab Emirates |
Marketing and Development Services |
Hansard Development Services (Middle East) Limited is a wholly owned subsidiary of Hansard Development Services Limited and is therefore an indirect wholly owned subsidiary of the Company.
The registered office of the Company is 55 Athol Street, Douglas, Isle of Man, IM99 1QL.
The Company has its primary listing on the London Stock Exchange.
- Principal accounting policies
The principal accounting policies adopted in the preparation of these consolidated financial statements are set out below or, in the case of accounting policies that relate to separately disclosed values in the primary statements, within the relevant note to these consolidated financial statements. These policies have been consistently applied, unless otherwise stated.
- Basis of preparation
The consolidated financial statements have been prepared in accordance with UK Adopted International Accounting Standards (“IFRSs”), the Isle of Man Insurance Act 2008, and with the Isle of Man Companies Acts 1931 to 2004. The financial statements have been prepared under the historical cost convention as modified by the revaluation of financial investments and financial liabilities at fair value through profit or loss. The Group has applied all International Financial Reporting Standards adopted by the United Kingdom and effective at 30 June 2026.
The Group underwrites an immaterial amount of insurance business. Management has undertaken an assessment of the impact of accounting for this business as investment business rather than insurance business and concluded that this would not have a material impact on the financial statements. Management will keep this assessment under review, and should the outcome change in future the Group accounting treatment will be reassessed. As a result, IFRS 17 has not been applied to these financial statements.
The preparation of financial statements in conformity with IFRS requires management to make judgements, estimates and assumptions that affect the application of policies and reported amounts of assets and liabilities at the date of the financial statements and the reported amounts of revenue and expenses during the reporting year. The areas involving a higher degree of judgement or complexity, or areas where assumptions and estimates are significant to the consolidated financial statements, are disclosed in Note 2.
Except where otherwise stated, the financial statements are presented in pounds sterling, the functional currency of the Company, rounded to the nearest one hundred thousand pounds.
The following UK-adopted IFRS have been issued but have not been applied in these financial statements. Their adoption is not expected to have a material effect on the financial statements, unless otherwise indicated:
- Amendments to IFRS 9 and IFRS 7: Classification and Measurement of Financial Instruments (effective 1 January 2026).
- Amendments to IFRS 9 and IFRS 7: Contracts Referencing Nature-dependent Electricity (effective 1 January 2026).
- Annual Improvements to the IFRS Accounting Standards – Volume 11 (effective 1 January 2026).
-
IFRS 18: Presentation and Disclosure in Financial Statements (effective 1 January 2027). IFRS 18 will replace IAS 1 Presentation of Financial Statements and applies for annual reporting periods beginning on or after 1 January 2027. The new accounting standards introduces the following key new requirements:
- Entities are required to classify all income and expenses into five categories in the statement of profit or loss, namely the operating, investing, financing, discontinued operations and income tax categories. Entities are also required to present a newly-defined operating profit subtotal. Entities’ net profit will not change.
- Management-defined performance measures (MPMs) are disclosed in a single note in the financial statements.
- Enhanced guidance is provided on how to group information in the financial statements.
- In addition, all entities are required to use the operating profit subtotal as the starting point for the statement of cash flows when presenting operating cash flows under the indirect method.
The Group is still in the process of assessing the impact of IFRS 18, particularly with respect to the structure of the statement of profit or loss, the statement of cash flows and the additional disclosures required for MPMs. The Group is also assessing the impact on how information is grouped in the financial statements.
There are no other standards, amendments or interpretations to existing standards that are not yet effective, that would have a material impact on the Group’s reported results.
- Restatement of Comparative information
During the year ended 30 June 2026, the Group identified two prior period errors relating to the recognition of certain income and the accounting for historical foreign exchange revaluation entries.
The first error arose following a systems process change, whereby a manual reversal adjustment relating to certain income was omitted. As a result, this income was recognised twice in the year ended 30 June 2025, resulting in an overstatement of fee and commission income and profit before tax and an understatement of amounts due to investment contract holders of £0.7 million. This error was also included in the condensed interim financial statements for the six months ended 31 December 2025 resulting in an overstatement of fee and commission income and profit before tax, and an understatement of amounts due to investment contract holders of £0.5m.
The second error related to historical foreign exchange revaluation differences which had been retained on the balance sheet in prior years instead of being recognised in the income statement. As a result, retained earnings at 1 July 2024 were understated by £0.8m and amounts due to investment contract holders were overstated by £0.8m. In addition, investment income and profit before tax for the year ended 30 June 2025 were overstated by £0.1m and amounts due to investment contract holders was understated by £0.1m. This error resulted in amounts due to investment contract holders being overstated by £0.7m in the condensed interim financial statements at 31 December 2025.
The comparative information has been restated in accordance with IAS 8 Accounting Policies, Changes in Accounting Estimates and Errors. The effect of the restatement on the Group's previously reported results and financial position is set out below.
Impact on the Consolidated Statements of Profit or Loss and Other Comprehensive Income:
|
Year ended 30 June 2025 |
|
| |
|
£m unless stated |
As reported |
Adjustment |
As restated |
|
|
|
|
|
|
Fees and commissions |
48.2 |
(0.7) |
47.5 |
|
Investment income |
32.4 |
(0.1) |
32.3 |
|
Profit before tax |
1.8 |
(0.8) |
1.0 |
|
Basic and diluted EPS |
1.3 |
(0.6) |
0.7 |
Impact on the Consolidated Balance Sheet:
|
As at 1 July 2024 |
|
|
|
|
|
As reported |
Adjustment |
As restated |
|
|
£m |
£m |
£m |
|
Amounts due to investment contract holders |
39.3 |
(0.8) |
38.5 |
|
Retained earnings |
0.6 |
0.8 |
1.4 |
|
|
|
|
|
|
As at 30 June 2025 |
|
|
|
|
Amounts due to investment contract holders |
48.4 |
- |
48.4 |
|
Retained earnings |
(3.7) |
- |
(3.7) |
Impact on the Consolidated Cash Flow Statement:
|
Year ended 30 June 2025 |
|
|
|
|
|
As reported |
Adjustment |
As restated |
|
|
£m |
£m |
£m |
|
Profit before tax |
1.8 |
(0.8) |
1.0 |
|
Increase in creditors |
10.8 |
0.8 |
11.6 |
During the year ended 30 June 2026 the Group also identified a disclosure error in relation to the amount of liabilities classified as level 2 under the fair value hierarchy, which has been restated as further detailed in note 3.6.
1.3 Basis of consolidation
The Group’s financial statements consolidate those of the parent company and all its subsidiaries as at 30 June 2026.
All transactions between Group companies are eliminated on consolidation. Amounts reported in the financial statements of subsidiaries have been adjusted where necessary to ensure consistency with the accounting policies adopted by the Group.
1.4 Going concern
On a Risk Based Solvency Capital basis, the Group’s capital position is strong and well in excess of regulatory requirements. The long-term nature of the Group’s business results in considerable recurring cash inflows arising from existing business. The Directors believe that the Group is well placed to manage its business risks successfully.
The Directors are satisfied that the Company and the Group have adequate resources to continue to operate as a going concern for the foreseeable future and have prepared the consolidated financial statements on that basis.
In making this statement, the Directors have reviewed financial forecasts that include plausible downside scenarios as a result of the ongoing geopolitical position and global macroeconomic conditions. These show the Group continuing to meet regulatory capital requirements over the next 12 months and that the Group has sufficient cash reserves to enable it to meet its obligations as they fall due.
The Directors are encouraged by the Group’s strong new business performance over the last two financial years, with growth achieved across both single and regular premium products and across multiple geographic regions. During FY26, the Group delivered its strongest new business growth in recent years, supported by increased adviser engagement, expanded distribution activity and strengthening market presence. Whilst the impact of new business growth on profit and cash flows emerges over the longer term given the nature of the Group’s products, this also provides management with time to respond to changing market conditions through operational and cost base adjustments if required. In the event of a sustained reduction in new business levels or assets under administration, the Group would take appropriate mitigating actions, including reducing the cost base and, where necessary, reviewing dividend distributions.
The following factors are considered as supportive to the Group’s resilience to external market and economic challenges:
- The Group’s business model focuses on long term savings products, both single premium, and regular premium paying products which continue to receive cash inflows regardless of the amount of new business sold.
- The Group earns approximately a third of its revenues from asset-based income which is not immediately dependent on sourcing new business. Initial fees in respect of new business are broadly offset by initial commissions, limiting the impact of any reduction in new business.
- New business channels are geographically dispersed and therefore less exposed to specific regional challenges.
- The largest expense associated with new business is commission expenditure which reduces directly in line with reduced sales.
- The Group has, and continues to the date of this report to have, a strong capital position with significant levels of liquidity and cash.
- The business has demonstrated operational resilience in being able to operate remotely from its offices without any material impact to processing and servicing levels. Its control environment continued to operate effectively during this time.
- The Group places the majority of its shareholder assets into conservative, highly-liquid, highly rated bank deposits and money market funds. These are typically not subject to price fluctuation and protect the Group’s assets against potential market volatility; and
- The Group has no borrowings.
2 Critical accounting estimates and judgements in applying accounting policies
Estimates, assumptions, and judgements are used in the application of accounting policies in these financial statements. Critical accounting estimates are those which involve the most complex or subjective judgements or assessments. Estimates, assumptions, and judgements are evaluated continually and are based on historical experience and other factors, including expectations of future events that are believed to be reasonable under the circumstances. Actual outcomes may differ from assumptions and estimates made by management. Revisions to estimates are recognised prospectively.
2.1 Accounting estimates and assumptions
The principal areas in which the Group applies accounting estimates are the amortisation of deferred origination costs and deferred income, the recoverability of deferred origination costs, the useful life of intangible assets, and the fair value of investments.
2.1.1 Amortisation of deferred origination costs and deferred income
The recognition and amortisation of deferred origination costs and deferred income require management judgement, particularly in determining the appropriate amortisation period.
Amortisation is based on the estimated life of the underlying contracts, typically between 8 and 15 years, and reflects assumptions regarding policy persistency. These assumptions are reviewed annually against actual experience. Certain contracts written between 2007 and 2015 are amortised on actual life.
2.1.2 Recoverability of deferred origination costs
Formal reviews to assess the recoverability of deferred origination costs on investment contracts are carried out at each balance sheet date to determine whether there is any indication of impairment based on the estimated future income levels.
If, based upon a review of the remaining contracts, there is any indication of irrecoverability or impairment, the contract’s recoverable amount is re-estimated. Impairment losses are reversed through the consolidated statement of comprehensive income if there is a change in the estimates used to determine the recoverable amount. Such losses are reversed only to the extent that the contract’s carrying amount does not exceed the carrying amount that would have been determined, net of amortisation where applicable, if no impairment loss had been recognised.
2.1.3 Fair value of financial investments
Where the Directors determine that there is no active market for a particular financial instrument, fair value is assessed using valuation techniques based on available relevant information and an appraisal of all associated risks as detailed in Note 3.
2.2 Judgements
The primary areas in which the Group has applied judgement in applying accounting policies are as follows:
- in assessing pending and threatened litigation, including determining whether a provision or contingent liability should be recognised or disclosed, the measurement of any provision recognised, and the recoverability of related insurance recoveries. These judgements are described further in Notes 15, 20 and 26.
- to determine the type of expenses that are treated as origination costs to be deferred. Any other expenses are expensed as incurred.
3 Financial risk management
Risk management objectives and risk policies
The Group’s objective in the management of financial risk is to minimise, where practicable, its exposure to such risk, except when necessary to support other objectives. The Group seeks to manage risk through the operation of unit-linked business whereby the contract holder bears the financial risk. In addition, shareholder assets are invested in highly rated investments.
Overall responsibility for the management of the Group’s exposure to risk is vested in the Board. To support it in this role, the Group ERM Framework is in place comprising risk identification, risk assessment, control and reporting processes. Additionally, the Board and the Boards of subsidiary companies have established a number of Committees with defined terms of reference. These are the Audit and Risk, Executive and Investment Committees. Additional information concerning the operation of the Board Committees is contained in the Corporate Governance section of this Annual Report.
The main significant financial risks to which the Group is exposed are set out below. For each category of risk, the Group determines its risk appetite and sets its investment, treasury and associated policies accordingly.
3.1 Market risk
This is the risk that the fair value of future cash flows of a financial instrument will fluctuate because of changes in market prices, analysed between price, interest rate and currency risk. The Group adopts a risk averse approach to market risk, with a stated policy of not actively pursuing or accepting market risk except where necessary to support other objectives. However, the Group accepts the risk that the fall in equity or other asset values, whether as a result of price falls or strengthening of sterling against the currencies in which contract holder assets are denominated, will reduce the level of annual management charge income derived from such contract holder assets and the risk of lower future profits.
The Group’s business is unit-linked, and the direct associated market risk is therefore borne by contract holders (although there is a secondary impact as shareholder income is dependent upon the fair value of contract holder assets). Other financial assets and liabilities held outside of contract holder unitised funds primarily consist of units in money market funds, cash and cash equivalents, and other assets and liabilities. Cash held in unitised money market funds and at bank is valued at par. The impact of a 1% change in interest rates is set out at 3.1(b) below. Other assets and liabilities are similarly unaffected by market movements.
As a result of these combined factors, the Group’s financial assets and liabilities held outside unitised funds are not materially subject to market risk, and movements at the reporting date in interest rates and equity values have an immaterial impact on the Group’s profit after tax and equity. Future revenues from annual management charges may be affected by movements in interest rates, foreign currencies and equity values. The Group does not control the asset selection strategy as assets are chosen by the contract holders.
(a) Price risk
Unit linked funds are exposed to securities price risk as the investments held are subject to prices in the future which are uncertain. The fair value of financial assets (designated at fair value through profit or loss) exposed to price risk at 30 June 2026 was £1,191.9m (2025: £1,068.8m). In the event that investment income is affected by price risk then there will be an equal and opposite impact on the value of the changes in provisions for investment contract liabilities in the same accounting period.
An overall change in the market value of the unit-linked funds would affect the annual management charges accruing to the Group since these charges, which are typically 1% per annum, are based on the market value of contract holder assets under administration. The approximate impact on the Group’s profits and equity of a 10% change in fund values, either as a result of price, interest rate or currency fluctuations, is £1.6m (2025: £1.6m).
(b) Interest rate risk
Interest rate risk is the risk that the Group is exposed to lower returns or loss as a direct or indirect result of fluctuations in the value of, or income from, specific assets arising from changes in underlying interest rates.
The Group is primarily exposed to interest rate risk on the corporate bonds and balances that it holds with credit institutions and in money market funds.
Taking into account the proportion of Group funds held on longer-term, fixed-rate deposits, a change of 1% per annum in interest rates will result in an increase or decrease of approximately £0.8m (2025: £0.6m) in the Group’s annual investment income and equity.
For corporate bonds, a 1% per annum increase or decrease in interest rates would be expected to result in a decrease or increase, respectively, of approximately £0.2 million and USD0.2 million (2025: £0.2 million and USD0.2 million) in the Group's unrealised gains and fair value of the assets.
A summary of the Group’s liquid assets at the balance sheet date is set out in Note 3.2.
(c) Currency risk
Currency risk is the risk that the Group is exposed to higher or lower returns as a direct or indirect result of fluctuations in the value of, or income from, specific assets and liabilities arising from changes in underlying exchange rates.
(c) (i) Group foreign currency exposures
The Group is exposed to currency risk on the foreign currency denominated bank balances, contract fees receivable and other liquid assets that it holds to the extent that they do not match liabilities in those currencies. The Group receives 79% (2025: 74%) of premiums in US Dollars and settles the majority of expenses in Sterling. To manage this risk, the Group commenced a hedging programme covering a portion of its forecast USD cash flows (see Note 3.1 c) iii) for further details). The impact of currency risk is also minimised by regular conversion of excess foreign currency funds to sterling. The Group is not exposed to currency risk in relation to policyholder liabilities and investments held to cover those liabilities, and thus they are excluded from the analysis below.
At the balance sheet date, the Group had exposures in the following currencies:
|
|
2026 |
2026 |
2026 |
2025 |
2025 |
2025 |
|
|
US$m |
€m |
¥m |
US$m |
€m |
¥m |
|
Gross assets |
36.4 |
18.9 |
799.1 |
21.7 |
17.1 |
534.0 |
|
Matching currency liabilities |
(40.7) |
(19.3) |
(1,079.2) |
(29.8) |
(17.5) |
(690.3) |
|
Uncovered currency exposures |
(4.3) |
(0.4) |
(280.1) |
(8.1) |
(0.4) |
(156.3) |
|
Sterling equivalent (£m) |
(3.2) |
(0.3) |
(1.3) |
(5.9) |
(0.3) |
(0.8) |
The approximate effect on profit before tax of a 5% change: in the value of US dollars to sterling is £0.2m (2025: £0.3m); in the value of the euro to sterling is less than £0.1m (2025: less than £0.1m); and in the value of the yen to sterling is less than £0.1m (2025: less than £0.1m).
(c) (ii) Financial investments by currency
Certain fees and commissions are earned in currencies other than sterling, based on the value of financial investments held in those currencies from time to time.
At the balance sheet date, the analysis of financial investments by currency denomination is as follows, US dollars: 76% (2025: 74%); euro: 17% (2025: 7%); sterling: 6% (2025: 18%); other: 1% (2025: 1%).
(c) (iii) Income subject to foreign currency risk
The Group is exposed to foreign currency risk arising from highly probable future cash inflows denominated in USD and other currencies. Variability in the USD/GBP exchange rate may affect the sterling value of future income and consequently the Group's future cash flows and earnings.
To manage this exposure, the Group entered into foreign exchange forward contracts during the year and designated these contracts as cash flow hedges of highly probable forecast USD-denominated income in accordance with IFRS 9. The objective of the hedging programme is to reduce volatility in future sterling cash flows resulting from movements in foreign exchange rates.
The Group’s policy is to hedge 100% of the first USD1m of USD-denominated income each month over a rolling 18-month horizon.
The Group uses plain vanilla FX forward contracts as hedging instruments. The critical terms of the forward contracts are closely aligned with those of the forecast cash inflows and, accordingly, the Group expects a high degree of economic offset between the hedged item and hedging instrument. The Group assesses hedge effectiveness on an ongoing basis by evaluating whether an economic relationship continues to exist between the hedged item and the hedging instrument and whether changes in the value of the hedging instrument are expected to offset changes in the value of the hedged cash flows attributable to movements in the USD/GBP exchange rate.
As the Group consistently generates forecast monthly USD-denominated income in excess of the USD1m designated in the hedge relationship, it does not expect the forecast transactions to fail to occur. Accordingly, the Group does not expect material hedge ineffectiveness to arise and no hedge ineffectiveness was recognised in profit or loss during the year (2025: nil).
The effective portion of changes in the fair value of the hedging instruments is recognised in other comprehensive income and accumulated within the cash flow hedge reserve. Amounts accumulated in the reserve are reclassified to profit or loss in the periods in which the forecast income impacts profit or loss. During the year, less than £0.1m (2025: nil) was reclassified from the cash flow hedge reserve to profit or loss.
|
Cash flow hedges of USD income |
2026 |
2025 |
|
£m unless stated |
|
|
|
Nominal amount of forward contracts (USDm) |
17.0 |
- |
|
Sterling equivalent |
12.5 |
- |
|
Carrying amount of forward exchange contracts recognised within Other Payables |
0.3 |
- |
|
Change in fair value of hedging instruments recognised in OCI |
(0.3) |
- |
|
|
2026 |
2025 |
|
|
£m |
£m |
|
Loss recognised in OCI during the period |
(0.3) |
- |
|
Amount reclassified from OCI to profit or loss |
- |
- |
|
Balance in cash flow hedge reserve at year end |
(0.3) |
- |
3.2 Credit risk
Credit risk is the risk that the Group is exposed to lower returns or loss if another party fails to perform its financial obligations to the Group. The Group has adopted a risk averse approach to such risk and has a stated policy of not actively pursuing or accepting credit risk except when necessary to support other objectives.
The clearing and custody operations for the Group’s security transactions are mainly concentrated with one broker, namely Capital International Limited, a member of the London Stock Exchange. At 30 June 2026 and 2025, substantially all contract holder cash and cash equivalents, balances due from investment brokers and financial investments are placed in custody with Capital International Limited. These operations are detailed in a formal contract that incorporates notice periods and a full exit management plan. Delivery of services under the contract is monitored by a dedicated relationship manager against a documented Service Level Agreement and Key Performance Indicators.
The Group has an exposure to credit risk in relation to its deposits with credit institutions, its investments in unitised money market funds and its investment in a bond portfolio. To manage these risks, deposits are placed in accordance with established policy, with credit institutions having a short-term rating of at least F1 or P1 from Fitch IBCA and Moody’s respectively and a long-term rating of at least A or A3. Investments in unitised money market funds are made only where such fund is AAA rated. Additionally, maximum counterparty exposure limits are set both at an individual subsidiary company level and on a Group-wide basis. The bond portfolios include only investment-grade assets, as rated by Standard & Poor’s (“S&P”).
These assets are considered to have a high degree of credit worthiness, and no assets of a lower credit worthiness are held. The following table sets out information about the credit quality of the Group’s deposits with credit institutions, corporate bonds and its investments in unitised money market funds.
|
|
2026 |
2025 |
|
|
£m |
£m |
|
Deposits (Based on Moody’s and Fitch ratings) AAA AA- to AA+ A- to A+ |
15.4 - 33.6 |
20.8 - 21.9 |
|
|
49.0 |
42.7 |
|
Cash at bank (Based on Moody’s and Fitch ratings) |
|
|
|
AA- to AA+ |
0.3 |
0.3 |
|
A- to A+ BBB |
28.9 0.3 |
23.2 - |
|
|
29.5 |
23.5 |
|
Corporate Bonds (Based on ratings by S&P) A- to A+ BBB- to BBB+ |
4.0 5.2 |
3.0 6.0 |
|
|
9.2 |
9.0 |
|
Total deposits, cash and corporate bonds |
87.7 |
75.2 |
Credit risk for financial assets held at amortised cost is recognised using an expected credit loss model. The model splits financial assets into those which are performing, underperforming and non-performing based on changes in credit quality since initial recognition. At initial recognition financial assets are considered to be performing. They become underperforming where there has been a significant increase in credit risk since initial recognition, and non-performing when there is objective evidence of impairment. Twelve months of expected credit losses are recognised in the statement of comprehensive income and netted against the financial asset in the statement of financial position for all performing financial assets, with lifetime expected credit losses recognised for underperforming and non-performing financial assets.
Receivables are designated as having no significant financing component and none of which are past due. The Group applies the IFRS 9 simplified approach to measuring expected credit losses for trade receivables by using a lifetime expected loss allowance.
Expected credit losses are based on the historic levels of loss experienced for the relevant financial assets, primarily overdrawn cash accounts held by policyholders, with consideration given to forward looking information.
Insurance recovery receivables are due from highly rated insurer counterparties being rated AA or AA- by S&P and at least AA- or A1 by Fitch and Moody’s respectively. Taking into account the financial strength of these counterparties and the expected timing of recovery, management has concluded that any expected credit losses are immaterial and, accordingly, no material loss allowance has been recognised at the reporting date.
The following table sets out the movement in expected credit losses.
|
|
2026 |
2025 |
|
|
£m |
£m |
|
At 1 July |
3.1 |
2.5 |
|
Credit loss charges in the year |
0.8 |
0.6 |
|
At 30 June |
3.9 |
3.1 |
At the balance sheet date, an analysis of the Group’s corporate bonds, cash and deposit balances was as follows:
|
|
2026 |
2025 |
|
|
|
|
|
|
£m |
£m |
|
Corporate bond portfolios |
9.2 |
9.0 |
|
Longer term deposits with credit institutions |
14.8 |
14.7 |
|
Cash and cash equivalents under IFRS |
63.7 |
51.5 |
|
|
87.7 |
75.2 |
3.3 Liquidity risk
Liquidity risk is the risk that the Group, though solvent, does not have sufficient financial resources to enable it to meet its obligations as they fall due, or can only secure them at excessive cost.
The Group’s objective is to ensure that it has sufficient liquidity over short-term (up to one year) and medium-term time horizons to meet the needs of the business. This includes liquidity to cover, amongst other things, new business costs, planned strategic activities, servicing of equity capital as well as working capital to fund day-to-day cash flow requirements.
Liquidity risk is principally managed in the following ways:
- Assets of a suitable marketability are held to meet contract holder liabilities as they fall due.
- Forecasts are prepared regularly to predict required liquidity levels over both the short-term and medium-term.
The Group’s exposure to liquidity risk is considered to be low since it maintains a high level of liquid assets to meet its liabilities.
3.3.1 Undiscounted contractual maturity analysis
Set out below is a summary of the undiscounted contractual maturity profile of the Group’s assets.
|
|
2026 |
2025 |
|
|
£m |
£m |
|
Maturity within 1 year |
|
|
|
Shareholder deposits and money market funds |
78.5 |
66.2 |
|
Other shareholder assets* |
25.7 |
6.3 |
|
|
104.2 |
72.5 |
|
Maturity from 1 to 5 years |
|
|
|
Other shareholder assets* |
8.8 |
3.0 |
|
Shareholder assets with maturity values within 5 years |
113.0 |
75.5 |
|
Other shareholder assets (no defined maturity profile or maturity greater than 5 years) |
139.4 |
144.6 |
|
Total shareholder assets |
252.4 |
220.1 |
|
Policyholder assets |
|
|
|
Gross assets held to cover financial liabilities under investment contracts |
1,260.6 |
1,129.8 |
|
Total assets |
1,513.0 |
1,349.9 |
* Other shareholder assets includes £12.5m (2025: nil) in relation to foreign exchange forward contracts.
Assets held to cover financial liabilities under investment contracts are deemed to have no fixed maturity since the corresponding unit-linked liabilities are repayable and transferable on demand. In certain circumstances the contractual maturities of a portion of the assets may be longer than one year, but the majority of assets held within the unit-linked funds are highly liquid. The Group actively monitors fund liquidity.
Set out below is a summary of the undiscounted contractual maturity profile of the Group’s liabilities.
|
|
2026 |
2025 |
|
|
£m |
£m |
|
Maturity within 1 year |
|
|
|
Amounts due to investment contract holders |
66.3 |
48.4 |
|
Other payables* |
25.2 |
14.6 |
|
Provisions |
5.6 |
0.7 |
|
|
97.1 |
63.7 |
|
Maturity from 1 to 5 years |
|
|
|
Other payables* |
4.5 |
1.0 |
|
Maturity greater than 5 years |
|
|
|
Other payables |
1.3 |
1.4 |
|
Liabilities with maturity values |
102.9 |
66.1 |
|
Other liabilities (no defined maturity profile) |
132.9 |
137.5 |
|
Shareholder liabilities |
235.8 |
203.6 |
|
Maturity within 1 year |
|
|
|
Financial liabilities under investment contracts |
50.1 |
46.3 |
|
Maturity from 1 to 5 years |
|
|
|
Financial liabilities under investment contracts |
217.1 |
197.1 |
|
Maturity greater than 5 years |
|
|
|
Financial liabilities under investment contracts |
993.4 |
886.4 |
|
Financial liabilities under investment contracts |
1,260.6 |
1,129.8 |
|
Total liabilities |
1,496.4 |
1,333.4 |
* Other payables includes £12.5m (2025: nil) in relation to foreign exchange forward contracts.
There is no significant difference between the value of the Group’s assets and liabilities on an undiscounted basis and the balance sheet values. Financial liabilities under investment contracts with a contractual maturity are deemed to be repayable and transferable on demand and have not been discounted in the balance sheet.
3.4 Insurance risk
Insurance risk is the risk of loss arising from actual experience being different than that assumed when an insurance product was designed and priced. For the Group, the key insurance risks are lapse risk, expense risk and mortality risk. However, the size of insurance risk is not deemed to be materially significant. From an accounting perspective all contracts have been classified as investment contracts.
3.4.1 Lapse risk
A key risk for investment contracts is policyholder behaviour risk in particular the risk that contracts are surrendered, or significant cash withdrawals are made before sufficient fees have been collected to cover up-front commissions paid by the Group. The risk is mitigated by charging penalties on the early surrender of contracts.
3.5 Classification and subsequent measurement of financial assets and liabilities
The Group recognises deposits with financial institutions and loans and borrowings on the date on which they are originated. All other financial instruments are recognised on the trade date, which is the date on which the Group becomes a part to the contractual provisions of the instrument.
A financial asset or financial liability is initially measured at fair value plus, for a financial asset or financial liability not measured at ‘fair value through profit and loss’ (“FVTPL”), transaction costs that are directly attributable to its acquisition or issue.
On initial recognition, a financial asset is classified as measured at amortised cost, ‘fair value through other comprehensive income’ (“FVOCI”) or FVTPL.
Financial assets are not reclassified subsequent to their initial recognition. A financial asset is measured at amortised cost if it meets both of the following conditions and is not designated as at FVTPL:
- It is held within a business model whose objective is to hold assets to collect contractual cash flows; and
- Its contractual terms give rise on specified dates to cash flows that are solely payments of principal and interest.
A financial asset is measured at FVOCI if it meets both of the following conditions and is not designated as at FVTPL:
- It is held within a business model whose objective is achieved by both collecting contractual cash flows and selling financial assets; and
- Its contractual terms give rise on specified dates to cash flows that are solely payments of principal and interest.
All financial assets not classified as measured at amortised cost or FVOCI as described above are measured at FVTPL. The classification of each financial asset and liability is commented on within each respective financial statement note. As at 30 June 2026 and 30 June 2025, only financial assets measured at amortised cost and FVTPL are held.
The subsequent measurement of each class of financial assets is defined in the below table:
|
Class of asset |
Subsequent measurement |
|
Financial assets at FVTPL |
Measured at fair value. Net gains and losses, including any interest or dividend income and foreign exchange gains and losses, are recognised in profit or loss. |
|
Financial assets at amortised cost |
Measured at amortised cost using the effective interest method. Interest income, foreign exchange gains and losses and impairment are recognised in profit or loss. Any gain or loss on derecognition is also recognised in profit or loss. |
On initial recognition, a financial liability is designated as amortised cost or FVTPL. The criteria for classification and subsequent measurement mirrors that of the financial assets, albeit the classification of ‘FVOCI’ does not exist for financial liabilities. Therefore, any liabilities which do not meet the amortised cost classification criteria, are designated as FVTPL.
The Group uses foreign exchange forward contracts to manage its exposure to fluctuations in foreign currency exchange rates arising from highly probable forecast foreign currency cash inflows.
Derivative financial instruments are recognised initially at fair value on the date a derivative contract is entered into and are subsequently remeasured to fair value at each reporting date. They are presented within Other payables in the Balance Sheet. See Note 3.1 c) for more details.
3.6 Fair value of financial assets and liabilities
The Group closely monitors the valuation of assets in markets that have become less liquid. Determining whether a market is active requires the exercise of judgement and is determined based upon the facts and circumstances of the market for the instrument being measured. Where the Directors determine that there is no active market for a particular financial instrument, for example where a particular collective investment scheme is suspended from trading, fair value is assessed using valuation techniques based on available, relevant, information and an appraisal of all associated risks. When a collective investment scheme recommences regular trading, the value would be transferred back to Level 1. This process requires the exercise of significant judgement on the part of Directors.
Due to the linked nature of the contracts administered by the Group’s insurance undertakings, any change in the value of financial assets held to cover financial liabilities under those contracts will result in an equal and opposite change in the value of contract liabilities. The separate effect on financial assets and financial liabilities is included in investment income and investment contract benefits, respectively, in the consolidated statement of comprehensive income.
IFRS 13 requires the Group to classify fair value measurements into a fair value hierarchy by reference to the observability and significance of the inputs used in measuring that fair value. The hierarchy is as follows:
- Level 1: fair value is determined using quoted prices (unadjusted) in active markets for identical assets.
- Level 2: fair value is determined using inputs other than quoted prices included within Level 1 that are observable for the asset either directly (i.e. as prices) or indirectly (i.e. derived from prices).
- Level 3: fair value is determined using inputs for the asset that are not based on observable market data (unobservable inputs).
The Group assesses transfers between levels of the fair value hierarchy at each reporting date. Transfers are recognised at the end of the reporting period in which the event or change in circumstances giving rise to the transfer occurs, such as changes in market activity, the suspension or resumption of trading, or changes in the observability of valuation inputs.
The following tables analyse the Group’s financial assets and liabilities at fair value, at 30 June 2026:
|
|
Level 1 |
Level 2 |
Level 3 |
Total |
|
Financial assets |
£m |
£m |
£m |
£m |
|
Equity securities |
95.9 |
- |
- |
95.9 |
|
Collective investment schemes |
997.3 |
4.0 |
5.8 |
1,007.1 |
|
Fixed income securities, bonds and structured notes |
1.5 |
9.3 |
78.1 |
88.9 |
|
Total financial assets at fair value through profit and loss |
1,094.7 |
13.3 |
83.9 |
1,191.9 |
|
Deposit and money market funds |
95.8 |
- |
- |
95.8 |
|
Total financial assets |
1,190.5 |
13.3 |
83.9 |
1,287.7 |
|
|
Level 1 |
Level 2 |
Level 3 |
Total |
|
|
£m |
£m |
£m |
£m |
|
Financial liabilities at fair value through profit or loss |
- |
1,317.1 |
- |
1,317.1 |
|
Derivative financial liabilities designated as cash flow hedges |
|
|
|
|
|
Forward exchange contracts |
- |
0.3 |
- |
0.3 |
All other financial assets and liabilities are measured at amortised cost which approximates to fair value.
Financial liabilities at fair value through profit or loss are mostly classified as level 2 on the basis that they relate to policies investing in financial assets at fair value through profit and loss.
The following tables analyse the Group’s financial assets and liabilities at fair value, at 30 June 2025:
|
|
Level 1 |
Level 2 |
Level 3 |
Total |
|
Financial assets |
£m |
£m |
£m |
£m |
|
Equity securities |
75.0 |
1.8 |
- |
76.8 |
|
Collective investment schemes |
901.2 |
5.6 |
0.9 |
907.7 |
|
Fixed income securities, bonds and structured notes |
2.9 |
10.5 |
71.0 |
84.4 |
|
Total financial assets at fair value through profit and loss |
979.1 |
17.9 |
71.9 |
1,068.9 |
|
Deposit and money market funds |
87.2 |
- |
- |
87.2 |
|
Total financial assets |
1,066.3 |
17.9 |
71.9 |
1,156.1 |
|
|
Level 1 |
Level 2 |
Level 3 |
Total |
|
|
£m |
£m |
£m |
£m |
|
Financial liabilities at fair value through profit or loss* |
- |
1,175.7 |
- |
1,175.7 |
*In the current year, the prior year presentation of Financial Liabilities at FVTPL was corrected to include amounts due to investment contract holders of £45.9m, measured at FVTPL which were incorrectly omitted from the disclosure. This restatement relates exclusively to this disclosure and does not impact the primary financial statements.
During the year ended 30 June 2026 £0.5m (2025: £nil) of collective investment scheme investments were transferred from Level 2 to Level 3 primarily as a result of the assets becoming suspended during the year.
During the year ended 30 June 2026, £nil (2025: £1.2m) of bond investments were transferred from Level 2 to Level 3 either as a result of the asset being suspended or changes in third party pricing information used to value the investments.
Valuation techniques and significant unobservable inputs
The following tables show the valuation techniques used in measuring Level 2 and Level 3 fair values for financial instruments in the statement of financial position, as well as the significant unobservable inputs used.
|
Type |
Valuation technique |
Significant unobservable input |
Sensitivity to changes in unobservable inputs |
|
Suspended assets (included within collectives or bonds and structured notes) Level 3: £1.9m (2025: £2.9m) |
Discounted net asset value. |
Discount factor (0-100%) and NAV. |
If the NAV was higher/lower, the fair value would be higher/lower. If the discount factor was higher/lower, the fair value would be lower/higher. |
|
Bonds and structured notes Level 2: £9.3m (2025: £10.5m) Level 3: £77.4m (2025: £71.0m) Collectives Level 2: £4.0m (2025: £5.6m) Level 3: £4.6m (2025: £0.9m) |
Market comparison/ discounted cash flow: The fair value is estimated considering: (i) current or recent quoted prices for identical securities in markets that are not active; and (ii) third party pricing sourced via Bloomberg. |
Level 2: Not applicable.
Level 3: Not applicable.
|
Level 2: Not applicable.
Level 3: Not applicable |
|
Foreign exchange forward contracts Level 2: £0.3m (2025: £nil) |
The fair value is determined using quoted forward exchange rates and yield curves.
|
Not applicable. |
Not applicable. |
The reconciliation between opening and closing balances of Level 3 assets are presented in the table below:
|
|
|
2026 |
2025 |
|
|
|
£m |
£m |
|
Opening balance |
|
71.9 |
61.8 |
|
Total gains / (losses)* recognised in profit or loss |
|
5.2 |
(1.1) |
|
Transfers into level 3 |
|
0.5 |
2.5 |
|
Transfers out of level 3 |
|
(1.2) |
- |
|
Purchases, sales, issues, and settlements |
|
7.5 |
8.7 |
|
Closing balance |
|
83.9 |
71.9 |
* The total gain recognised in profit or loss in respect of Level 3 financial assets during the year was £5.2m (2025: loss of £1.1m), of which £7.9m unrealised gains related to assets held at the reporting date. All such gains and losses are recognised within change in provisions for investment contract liabilities.
4 Segmental information
Disclosure of operating segments in these financial statements is consistent with reports provided to the Chief Operating Decision Maker (“CODM”) which, in the case of the Group, has been identified as the Executive Committee of Hansard Global plc.
In the opinion of the CODM, the Group operates in a single reportable segment, that of the distribution and servicing of long-term investment products. New business development, distribution, and associated activities in relation to the Republic of Ireland ceased with effect from 30 June 2013. All other activities of the Group are continuing.
The Group’s Executive Committee uses two principal measures when appraising the performance of the business: Weighted Net Issued Commission Credit (“WNICC”) and expenses. WNICC is derived from Net Issued Commission Credit (“NICC”), which measures the amount of basic initial commission payable to intermediaries on new business written, net of commission clawbacks on lapsed policies. WNICC applies profitability weightings to NICC to normalise production across products with differing underlying profitability and therefore provides a more consistent measure of the value of new business written across the Group’s product range.
WNICC is the Group’s primary internal measure for monitoring and incentivising new business performance and is reported daily and monitored weekly against target levels. NICC continues to be used as an operational measure of new business volumes and remains the basis of the reconciliation to direct origination costs presented below.
NICC is a measure of the value of new in-force business and top-ups on existing single premium contracts. NICC is the total amount of basic initial commission payable to intermediaries for business sold in a period and is calculated on each piece of new business. It excludes override commission paid to intermediaries over and above the basic level of commission.
The following table analyses NICC geographically and reconciles NICC to direct origination costs incurred during the year as set out in the Business and Operating Review section of this Annual Report and Accounts.
|
|
|
2026 |
2025 |
|
|
|
£m |
£m |
|
Middle East and Africa |
|
1.2 |
1.8 |
|
Latin America |
|
2.9 |
2.2 |
|
Rest of World |
|
3.0 |
1.6 |
|
Asia (including Japan) |
|
0.6 |
0.2 |
|
Net Issued Commission Credit |
|
7.7 |
5.8 |
|
Other commission costs paid to third parties |
|
2.3 |
2.5 |
|
Enhanced unit allocations |
|
(0.1) |
0.3 |
|
Direct origination costs incurred during the year |
|
9.9 |
8.6 |
Revenues and expenses allocated to geographical locations contained in sections 4.1 to 4.4 below reflect the revenues and expenses generated in or incurred by the legal entities in those locations.
4.1 Geographical analysis of fees and commissions by origin
|
|
|
2026 |
2025 As restated |
|
|
|
£m |
£m |
|
Isle of Man |
|
47.5 |
44.9 |
|
Republic of Ireland |
|
1.9 |
2.0 |
|
The Bahamas* |
|
0.4 |
0.6 |
|
|
|
49.8 |
47.5 |
* Hansard Worldwide, which is based in the Bahamas, fully reinsures its business to Hansard International. All external fees and commissions for Hansard Worldwide are therefore presented within the Isle of Man category. These amounted to £5.4m in 2026 (2025: £5.0m). The fees shown in the table above in respect of The Bahamas represent fees received by Hansard Worldwide from Hansard International.
4.2 Geographical analysis of profit before taxation
|
|
|
2026 |
2025 As restated |
|
|
|
£m |
£m |
|
Isle of Man |
|
2.8 |
2.1 |
|
Republic of Ireland |
|
3.0 |
(1.6) |
|
The Bahamas |
|
0.7 |
0.5 |
|
|
|
6.5 |
1.0 |
4.3 Geographical analysis of gross assets
|
|
|
2026 |
2025 |
|
|
|
£m |
£m |
|
Isle of Man* |
|
1,411.8 |
1,268.4 |
|
Republic of Ireland |
|
85.0 |
77.5 |
|
The Bahamas |
|
3.7 |
4.0 |
|
|
|
1,500.5 |
1,349.9 |
* Includes assets held in the Isle of Man in connection with policies written in The Bahamas. As at 30 June 2026 these amounted to £399.8m (30 June 2025: £298.7m).
4.4 Geographical analysis of gross liabilities
|
|
|
2026 |
2025 |
|
|
|
£m |
£m |
|
Isle of Man |
|
1,010.3 |
964.4 |
|
Republic of Ireland |
|
70.8 |
67.0 |
|
The Bahamas |
|
402.8 |
302.0 |
|
|
|
1,483.9 |
1,333.4 |
5 Fees and commissions
Contract fees and fund management charges are charged to the contract holders of investment contracts for contract administration services, payment of benefits, investment management services and other services related to the administration of investment contracts. Fees may be chargeable on either a fixed fee basis, a fee per transaction or in the case of fund management charges, as a percentage of assets under administration. Fees are recognised as revenue as the services are provided. Initial fees that exceed the level of recurring fees and relate to the future provision of services are deferred in the balance sheet and amortised on a straight-line basis over the life of the relevant contract. These fees are accounted for on the issue of a contract and on receipt of incremental premiums on existing single premium contracts.
Regular fees charged to contracts are recognised on a straight-line basis over the period in which the service is provided. Transactional fees are recorded when the required action is complete.
Commissions receivable arise principally from fund houses with which investments are held. Commission income is recognised on an accruals basis in accordance with the terms of the relevant agreements and over the period during which the related investments are held.
|
|
2026 |
2025 As restated |
|
|
£m |
£m |
|
Contract fee income |
30.2 |
28.5 |
|
Fund management charges |
14.6 |
13.9 |
|
Commissions receivable |
5.0 |
5.1 |
|
|
49.8 |
47.5 |
Fund management charges and commissions receivable (39% of the total above (2025: 40%)) are a function of the level of assets under administration.
6 Investment income
Investment income comprises dividends, interest, and other income receivable, realised and unrealised gains and losses on investments. Movements are recognised in the consolidated statement of comprehensive income in the period in which they arise. Dividends are accrued on the date notified. Interest is accounted for on a time proportion basis using the effective interest method.
|
|
2026 |
2025 As restated |
|
|
£m |
£m |
|
Interest income |
4.0 |
4.7 |
|
Dividend income |
8.1 |
6.1 |
|
Gains on realisation of investments |
64.8 |
35.8 |
|
Movement in unrealised gains / (losses) |
120.9 |
(14.3) |
|
|
197.8 |
32.3 |
7 Origination costs
Origination costs include commissions, intermediary incentives, and other distribution-related expenditure (Note 2.2). Origination costs which vary with, and are directly related to, securing new contracts and incremental premiums on existing single premium contracts are deferred to the extent that they are recoverable out of future net income from the relevant contract. Deferred origination costs are amortised on a straight-line basis over the life of the relevant contracts. Typical terms range between 8 years and 15 years. Origination costs that do not meet the criteria for deferral are expensed as incurred.
|
|
|
|
2026 |
2025 |
|
|
|
|
£m |
£m |
|
Amortisation of deferred origination costs |
13.2 |
13.2 | ||
|
Other origination costs |
1.8 |
1.8 | ||
|
|
15.0 |
15.0 | ||
8 Administrative and other expenses
Included in administrative and other expenses are the following:
|
|
|
2026 |
2025 |
|
|
|
£m |
£m |
|
Auditors’ remuneration: |
|
|
|
|
- Fees payable for audit services |
|
0.7 |
0.7 |
|
- Fees payable for audit related services pursuant to legislation |
|
0.1 |
0.1 |
|
Employee costs (see Note 9) |
|
12.7 |
12.0 |
|
Directors’ fees |
|
0.4 |
0.4 |
|
Fund management fees |
|
5.5 |
5.1 |
|
Renewal and other commission |
|
0.8 |
0.8 |
|
Professional and other fees |
|
3.2 |
3.4 |
|
Litigation defence costs and settlements |
|
(2.1) |
2.8 |
|
Credit loss allowance |
|
0.8 |
0.6 |
|
Licences and maintenance fees |
|
4.4 |
5.1 |
|
Insurance costs |
|
0.9 |
0.8 |
|
Depreciation and amortisation |
|
2.2 |
1.9 |
|
Communications |
|
0.1 |
0.1 |
9 Employee costs
The Group provides a range of benefits to employees, including annual bonus arrangements, paid holiday arrangements and defined contribution pension plans.
Short term benefits, including holiday pay and other similar non-monetary benefits, are recognised as an expense in the period in which the service is received.
The Group pays fixed pension contributions on behalf of its employees (defined contribution plans). Once the contributions have been paid the Group has no further payment obligations. The contributions are recognised as an expense when they are due. Amounts not paid are shown in accruals in the balance sheet. The assets of the plan are held separately from the Group in independently administered funds.
The Group operates an annual bonus plan for employees. An expense is recognised in the consolidated statement of comprehensive income when the Group has a legal or constructive obligation to make payments under the plan as a result of past events and a reliable estimate of the obligation can be made.
9.1 The aggregate remuneration in respect of employees (including sales employees and executive Directors) was as follows:
|
|
|
2026 |
2025 |
|
|
|
£m |
£m |
|
Wages and salaries |
|
11.3 |
10.9 |
|
Social security costs |
|
1.0 |
1.0 |
|
Contributions to pension plans |
|
0.9 |
0.8 |
|
|
|
13.2 |
12.7 |
Total salary and other employee costs for the year are incorporated within the following classifications:
|
|
|
2026 |
2025 |
|
|
|
£m |
£m |
|
Administrative and other expenses |
12.7 |
12.0 | |
|
Origination costs |
|
0.5 |
0.7 |
|
|
|
13.2 |
12.7 |
The above information includes Directors’ remuneration (excluding Non-executive Directors’ fees).
9.2 The average number of employees during the year was as follows:
|
|
|
2026 |
2025 |
|
|
|
No. |
No. |
|
Administration |
|
128 |
124 |
|
Distribution and marketing |
|
14.5 |
14 |
|
IT development |
|
37.5 |
37 |
|
|
|
180 |
175 |
10 Taxation
Taxation is based on profits and income for the period as determined with reference to the relevant tax legislation in the countries in which the Company and its subsidiaries operate. Tax payable is calculated using tax rates that have been enacted or substantively enacted by the balance sheet date. Tax is recognised in the consolidated statement of comprehensive income except to the extent that it relates to items recognised in equity. Tax on items relating to equity is recognised in equity.
The corporation tax expense for the Group for 2026 was £nil (2025: £nil). Corporation tax is charged on any profits arising at the following rates depending on location of the company or branch:
Isle of Man 0% (2025: 0%)
Republic of Ireland 12.5% (2025: 12.5%)
Japan 23.2% (2025: 23.2%)
Labuan 24% (2025: 24%)
The Bahamas 0% (2025: 0%)
Analysis of tax charge for the year
|
|
2026 |
2025 |
|
|
£m |
£m |
|
Current year tax |
- |
- |
|
Deferred tax |
- |
- |
|
Total tax charge |
- |
- |
Reconciliation of total tax charge
|
|
|
2026 |
2025 |
|
|
|
£m |
£m |
|
Profit before taxation |
6.5 |
1.0 | |
|
Tax on profits in taxable jurisdictions |
0.4 |
- | |
|
Utilisation of previously unrecognised tax losses |
(0.4) |
| |
|
Tax charge for the year |
- |
- | |
|
Effective tax rate |
|
- |
- |
At 30 June 2026, the Group had unutilised tax losses of approximately £5.0 million (2025: £8.4 million) available for offset against future taxable profits within Hansard Europe Dac. These losses give rise to a potential deferred tax asset of approximately £0.6 million (2025: £1.1 million) based on the applicable Irish corporation tax rate.
No deferred tax asset has been recognised in respect of these losses. The Directors do not consider it probable that sufficient future taxable profits will be available against which the remaining losses can be utilised and, accordingly, no deferred tax asset has been recognised.
The OECD’s Pillar II global minimum tax, based on the Global Anti-Base Erosion (GloBE) Model Rules, does not have an impact on the Group, as the Group’s total revenue is less than €750m.
11 Earnings per share
|
|
|
2026 |
2025 As restated1 |
|
Profit after tax (£m) |
6.5 |
1.0 | |
|
Weighted average number of shares in issue (millions) |
137.6 |
137.6 | |
|
Basic and diluted earnings per share in pence |
4.7 |
0.7 | |
1See Note 1.2 for details of the prior year restatement.
The Directors believe that there is no material difference between the weighted average number of shares in issue for the purposes of calculating either basic or diluted earnings per share. Earnings under either measure is 4.7p per share (2025: 0.7p).
12 Dividends
Interim dividends payable to shareholders are recognised in the year in which the dividends are paid. Final dividends payable are recognised as liabilities when approved by the shareholders at the Annual General Meeting.
The following dividends have been paid by the Group during the year:
|
|
|
Per share |
Total |
Per share |
Total |
|
|
|
2026 |
2026 |
2025 |
2025 |
|
|
|
p |
£m |
p |
£m |
|
Final dividend in respect of previous |
|
|
|
|
|
|
financial year |
|
2.65 |
3.7 |
2.65 |
3.7 |
|
Interim dividend in respect of current |
|
|
|
|
|
|
financial year |
|
1.80 |
2.4 |
1.80 |
2.4 |
|
|
|
4.45 |
6.1 |
4.45 |
6.1 |
The Board has resolved to pay a final dividend of 2.65p per share on 12 November 2026, subject to approval at the Annual General Meeting, based on shareholders on the register on 2 October 2026.
13 Intangible assets and property, plant and equipment
Intangible Assets
The historical cost of computer software is the purchase cost and the direct cost of internal development. Computer software is recognised as an intangible asset.
|
|
2026 |
2025 |
|
|
£m |
£m |
|
Intangible assets |
20.5 |
22.1 |
Amortisation is calculated so as to amortise the cost of intangible assets, less their estimated residual values, on a straight-line basis over the expected useful economic lives of the assets concerned and is included in administration and other expenses in the consolidated statement of comprehensive income.
The economic lives used for this purpose are:
|
Computer software |
3 to 15 years |
Following the migration of the Group’s policyholder book to the replacement policy administration system, amortisation commenced on 1st March 2024. The asset is being amortised over 15 years based on management’s assessment of the useful economic life of the asset.
|
|
2026 |
2025 |
|
Computer software |
£m |
£m |
|
Costs as at 1 July |
25.0 |
24.5 |
|
Capitalised additions |
0.1 |
0.5 |
|
Cost as at 30 June |
25.1 |
25.0 |
|
|
|
|
|
Accumulated amortisation at 1 July |
(2.9) |
(1.3) |
|
Charge for the year |
(1.7) |
(1.6) |
|
Accumulated amortisation as at 30 June |
(4.6) |
(2.9) |
|
|
|
|
|
Net Book Value |
20.5 |
22.1 |
The cost of computer software includes £13.9m of externally generated costs (2025: £13.8m) and £9.8m of internally generated costs (2025: £9.8m). £1.1m of amortisation currently relates to externally generated costs (2025: £2.1m) and £0.6m relates to internally generated costs (2025: £0.8m)
Property, plant and equipment
Property, plant and equipment includes both tangible fixed assets and ‘right of use assets’ recognised in accordance with IFRS 16 ‘Leases’.
|
|
2026 |
2025 |
|
|
£m |
£m |
|
Property, plant and equipment |
0.7 |
0.7 |
|
Right of use assets |
1.7 |
2.1 |
|
|
2.4 |
2.8 |
Property, plant and equipment is stated at historical cost less depreciation and any impairment. The historical cost of property, plant and equipment is the purchase cost, together with any incremental costs directly attributable to the acquisition.
Depreciation is charged on a straight-line basis to allocate the depreciable amount of an asset, less its estimated residual value, over its expected useful economic life and is included in administration and other expenses in the consolidated statement of comprehensive income.
The economic lives used for this purpose are:
|
Freehold property |
50 years |
|
Computer equipment |
3 to 5 years |
|
Fixtures & fittings |
4 years |
Right of use assets are depreciated over the useful life of the lease.
|
|
|
|
2026 |
2025 | ||
|
Property plant and equipment |
|
|
£m |
£m | ||
|
Cost as at 1 July |
|
|
11.0 |
10.5 | ||
|
Additions |
|
|
0.2 |
0.5 | ||
|
Disposals |
|
|
- |
- | ||
|
Cost as at 30 June |
|
11.2 |
11.0 | |||
|
|
|
|
| |||
|
Accumulated depreciation as at 1 July |
|
(10.3) |
(10.0) | |||
|
Charge for the year |
|
(0.2) |
(0.3) | |||
|
Accumulated depreciation as at 30 June |
|
(10.5) |
(10.3) | |||
|
|
|
|
| |||
|
Net Book Value |
|
0.7 |
0.7 | |||
|
|
|
|
|
|
|
|
IFRS 16 – Leases
The right-of-use assets for property leases are measured at an amount equal to the lease liability adjusted by the amount of any prepaid or accrued lease payments recognised immediately before the date of initial application, being the commencement date. The liabilities are measured at the present value of the remaining lease payments, discounted using an incremental borrowing rate. The weighted average incremental borrowing rate applied to the lease liabilities on 30 June 2026 was 7% (2025: 7%).
The Group leases various offices around the world to service its clients and operations. Rental contracts are typically made for periods of 1 to 15 years, incorporating break clauses where applicable. Lease terms are negotiated on an individual basis and contain differing terms and conditions. The lease agreements do not impose any covenants.
In determining the lease terms utilised in assessing the position under IFRS 16, management considers break clauses in leases, where appropriate. As a result of the current high inflation environment, as well as the amount spent on infrastructure it is likely the leases will continue past their break clauses.
Leases (other than those classified as short-term leases or leases of low-value assets) are recognised as a right-of-use asset and a corresponding liability at the date at which the leased asset is available for use by the Group. Each lease payment is allocated between the liability and a finance cost. The finance cost is charged over the lease period so as to produce a constant periodic rate of interest on the remaining balance of the liability for each period. The right-of-use asset is depreciated over the shorter of the asset’s useful life and the lease term on a straight-line basis.
Short-term leases (those with a lease term or useful life of less than 12 months at inception) and leases of low value assets (comprising IT-equipment and small items of office furniture) are recognised on a straight-line basis as an expense in administration and other expenses in the consolidated statement of comprehensive income.
The recognition of the right-of-use asset represents an increase in the property, plant and equipment net book value of £1.7m (30 June 2025: £2.1m). Lease liabilities relating to the right-of-use asset are included within other payables. The interest recognised on the lease liabilities in respect of the right of use asset was £0.2m (30 June 2025: £0.2m).
During the year the Group entered into a sub-lease for part of a building that is reported as a right-of-use asset. The group has classified the sub-lease as an operating lease, as it does not transfer substantially all of the risks and rewards incidental to the ownership of the sub-let asset. During the year the Group recognised rental income of less than £0.1m (2025: nil).
|
|
|
|
| ||||
|
|
|
|
2026 |
2025 |
| ||
|
|
|
|
£m |
£m |
| ||
|
Right of use asset recognised 1 July |
|
|
2.1 |
2.1 | |||
|
Additions during the period |
|
|
- |
0.2 | |||
|
Depreciation |
|
|
(0.4) |
(0.2) | |||
|
Net book value of right of use asset as at 30 June |
|
1.7 |
2.1 |
| |||
|
|
|
|
| ||||
|
Lease liability recognised 1 July |
|
2.7 |
2.7 | ||||
|
Additions during the period |
|
- |
0.2 | ||||
|
Lease payments made during the period |
|
(0.5) |
(0.4) | ||||
|
Interest on leases |
|
0.2 |
0.2 | ||||
|
Lease liability recognised as at 30 June |
|
2.4 |
2.7 | ||||
|
|
|
|
| ||||
|
Of which are: |
|
|
| ||||
|
Current lease liabilities |
|
0.3 |
0.3 | ||||
|
Non-current lease liabilities |
|
2.1 |
2.4 | ||||
|
|
|
|
|
|
|
|
|
14 Deferred origination costs
Amortisation of deferred origination costs is charged within the origination costs line in the consolidated statement of comprehensive income.
Formal reviews to assess the recoverability of deferred origination costs on investment contracts are carried out at each balance sheet date to determine whether there is any indication of impairment. If there is any indication of irrecoverability or impairment, the asset’s recoverable amount is estimated. Impairment losses are reversed through the consolidated statement of comprehensive income if there is a change in the estimates used to determine the recoverable amount. Such losses are reversed only to the extent that the asset’s carrying amount does not exceed the carrying amount that would have been determined, net of amortisation where applicable, if no impairment loss had been recognised.
The amount of deferred origination costs amortised each year is determined by the estimated lives of the Group’s products (Note 2). Reducing the estimated life of the total portfolio by 1 year would increase the annual amortisation for the next financial year by £1.8m. Increasing the estimated life of the total portfolio by 1 year would reduce the annual amortisation for the next financial year by £1.3m. Offsetting movements would also arise in deferred income as outlined in Note 18.
The movement in value over the financial year is summarised below.
|
|
2026 |
2025 |
|
|
£m |
£m |
|
At beginning of financial year |
106.3 |
112.1 |
|
Origination costs incurred and deferred during the year |
8.9 |
7.4 |
|
Origination costs amortised during the year |
(13.2) |
(13.2) |
|
At end of financial year |
102.0 |
106.3 |
|
|
2026 |
2025 |
|
Carrying value |
£m |
£m |
|
Expected to be amortised within one year |
12.8 |
11.7 |
|
Expected to be amortised after one year |
89.2 |
94.6 |
|
|
102.0 |
106.3 |
Management performs an impairment assessment annually. No impairment losses were recognised during the year (2025: £nil).
15 Other receivables
Other receivables which are financial assets are initially recognised at fair value and subsequently measured at amortised cost, less any provision for impairment.
|
|
|
|
2026 |
2025 |
|
|
|
|
£m |
£m |
|
Commission receivable |
|
|
1.4 |
1.4 |
|
Other debtors1 |
|
|
20.7 |
8.5 |
|
Prepayments |
|
|
2.1 |
1.2 |
|
|
|
|
24.2 |
11.1 |
|
Estimated to be settled within 12 months |
|
17.0 |
8.0 |
|
Estimated to be settled after 12 months |
|
7.2 |
3.1 |
|
|
|
24.2 |
11.1 |
1Other debtors have increased by £12.2m in the year. Of this, £7.9m (2025: £0.6m) relates to insurance recovery assets and receivables, comprising a settlement insurance recovery asset of £5.6m (2025: £nil) and receivables relating to historic defence costs of £2.3m (2025: £0.6m). The settlement insurance recovery asset is recognised when receipt is considered virtually certain and is measured at the amount expected to be recovered. Receivables relating to historic defence costs are recognised when receipt is considered probable and can be measured reliably. Amounts recognised in respect of insurance recovery assets and receivables are presented within administration expenses in the Statement of profit or loss. Further details are disclosed in Note 26. Due to the short-term nature of these assets the carrying value is considered to reflect fair value.
16 Cash and cash equivalents
Cash and cash equivalents include cash in hand, deposits held at call with banks, and other short-term highly liquid investments with a minimal cost to be converted to cash, with original maturities of three months or less, net of short-term overdraft positions where a right of set-off exists. In the below table, Money market funds includes all immediately available cash, other than specific short-term deposits.
|
|
2026 |
2025 |
|
|
£m |
£m |
|
Money market funds and call bank deposits |
63.1 |
50.9 |
|
Short-term deposits with credit institutions |
0.6 |
0.6 |
|
|
63.7 |
51.5 |
Premiums received are recognised as cash and cash equivalents on receipt, prior to investment to contract holder funds.
17 Financial liabilities under investment contracts
17.1 Investment contract liabilities, premiums and benefits paid
17.1.1 Investment contract liabilities
Investment contracts consist of unit-linked contracts written through subsidiary companies in the Group. Unit-linked liabilities are measured at fair value by reference to the underlying net asset value of the Group's unitised investment funds, determined on a bid basis, at the balance sheet date.
The decision by the Group to designate its unit-linked liabilities at fair value through profit or loss is to eliminate a measurement inconsistency that would otherwise arise from measuring the investments at FVTPL and the contract liabilities at amortised cost.
17.1.2 Investment contract premiums
Investment contract premiums are not included in the consolidated statement of comprehensive income but are reported as deposits to investment contracts and are included in financial liabilities in the balance sheet. On existing business, a liability is recognised at the point the premium falls due. The liability for premiums received on new business is deemed to commence at the acceptance of risk.
17.1.3 Benefits paid
Withdrawals from policy contracts and other benefits paid are not included in the consolidated statement of comprehensive income but are deducted from financial liabilities under investment contracts in the balance sheet. Benefits are deducted from financial liabilities and transferred to amounts due to investment contract holders based on notifications received, when the benefit falls due for payment or, on the earlier of the date when paid or when the contract ceases to be included within those liabilities.
17.2 Movement in financial liabilities under investment contracts
The following table summarises the movement in liabilities under investment contracts during the year:
|
|
|
2026 |
2025 |
|
|
|
£m |
£m |
|
Deposits to investment contracts |
129.0 |
118.9 | |
|
Withdrawals from contracts and charges |
(191.9) |
(167.1) | |
|
Change in provisions for investment contract liabilities |
193.7 |
27.1 | |
|
Movement in year |
130.8 |
(21.1) | |
|
At beginning of year |
1,129.8 |
1,150.9 | |
|
|
1,260.6 |
1,129.8 | |
|
|
2026 |
2025 |
|
|
£m |
£m |
|
Contractually expected to be settled within 12 months |
50.1 |
46.3 |
|
Contractually expected to be settled after 12 months |
1,210.5 |
1,083.5 |
|
|
1,260.6 |
1,129.8 |
The change in provisions for investment contract liabilities includes dividend and interest income and net realised and unrealised gains and losses on financial investments held to cover financial liabilities. Dividend income, interest income and gains and losses are accounted for in accordance with Note 6.
17.3 Investments held to cover liabilities under investment contracts
The Group classifies its financial assets into the following categories: financial investments and trade receivables. Financial investments consist of units in collective investment schemes, equity securities, fixed income securities and deposits with credit institutions. Collective investment schemes, equity securities and fixed income securities are designated at fair value through profit or loss. Deposits with credit institutions are designated at amortised cost.
The decision by the Group to designate its financial investments at fair value through profit or loss reflects the fact that the investment portfolio is managed, and its performance evaluated, on a fair value basis.
The Group recognises purchases and sales of investments on trade date. Investment transaction costs are written off in administration expenses as incurred.
All gains and losses derived from financial investments, realised or unrealised, are recognised within investment income in the consolidated statement of comprehensive income in the period in which they arise.
The value of financial assets at fair value through profit or loss that are traded in active markets (such as trading securities) is based on quoted market prices at the balance sheet date. The quoted market price for financial assets held by the Group is the current bid price. Investments in funds are valued at the latest available net asset valuation provided by the administrators or managers of the funds and companies, unless the Directors are aware of good reasons why such valuations would not be the most appropriate or indicative of fair value. Where necessary, the Group uses other valuation methods to arrive at the stated fair value of its financial assets, such as recent arms’ length transactions or reference to similar listed investments.
Loans and receivables are financial assets with fixed or determinable payments that are not quoted on an active market. Loans and receivables consist, primarily, of contract fees receivable, long-term cash deposits (i.e. with an original maturity duration in excess of three months) and cash and cash equivalents.
The following investments, other assets and liabilities are held to cover financial liabilities under investment contracts. They are included within the relevant headings on the consolidated balance sheet.
|
|
|
|
|
2026 |
2025 |
|
|
|
|
|
£m |
£m |
|
Equity securities |
95.9 |
76.8 | |||
|
Investments in collective investment schemes |
1,007.1 |
907.7 | |||
|
Fixed income securities, bonds and structured notes |
88.9 |
74.8 | |||
|
Deposits and money market funds |
71.8 |
73.0 | |||
|
Total assets |
1,263.7 |
1,132.3 | |||
|
Other payables |
(3.1) |
(2.5) | |||
|
Financial investments held to cover financial liabilities |
1,260.6 |
1,129.8 | |||
The other receivables and other payables fair value approximates amortised cost.
17.4 Amounts due to investment contract holders
Where financial liabilities under investment contracts mature or are redeemed by contract holders, such amounts payable are recorded as amounts due to investment contract holders.
18 Deferred income
Fees charged for services related to the management of investment contracts are recognised as revenue as the services are provided. Initial fees which exceed the level of recurring fees and relate to the future provision of services are deferred. These are amortised over the anticipated period in which services will be provided. The recognition of balances in the deferred income reserve is based on actuarial assumptions regarding the estimated life of each policy. These actuarial assumptions are complex in nature and are subject to estimation uncertainty (Note 2). The actuarial assumptions are reviewed regularly by the Appointed Actuary.
The amount of deferred income amortised each year is determined by the estimated lives of the Group’s products. Reducing the estimated life of the total portfolio by 1 year would increase the annual amortisation for the next financial year by £2.6m. Increasing the estimated life of the total portfolio by 1 year would reduce the annual amortisation for the next financial year by £1.8m. Offsetting movements would also arise in deferred origination costs as outlined in Note 14.
The movement in value of deferred income over the financial year is summarised below.
|
|
2026 |
2025 |
|
|
£m |
£m |
|
At beginning of financial year |
137.5 |
140.2 |
|
Income received and deferred during the year |
13.3 |
13.1 |
|
Income amortised and recognised in contract fees during the year |
(17.9) |
(15.8) |
|
At end of financial year |
132.9 |
137.5 |
|
|
2026 |
2025 |
|
Carrying value |
£m |
£m |
|
Expected to be amortised within one year |
18.5 |
15.7 |
|
Expected to be amortised after one year |
114.4 |
121.8 |
|
|
132.9 |
137.5 |
19 Other payables
Other payables are initially recognised at fair value and where permitted are subsequently measured at amortised cost. They are recognised at the point where service is received but payment is due after the balance sheet date. Other payables also include derivative financial liabilities arising from forward foreign exchange contracts. Such derivative financial liabilities are measured at fair value at each reporting date, with the accounting treatment of changes in fair value determined in accordance with the Group's policy for hedge accounting and derivative financial instruments.
|
|
|
2026 |
2025 |
|
|
|
£m |
£m |
|
Commission payable |
|
1.6 |
1.3 |
|
Other creditors and accruals |
|
14.2 |
13.0 |
|
Forward exchange contracts |
|
0.3 |
- |
|
|
|
|
|
|
Lease liabilities of which: |
|
|
|
|
Current lease liabilities |
|
0.3 |
0.3 |
|
Non-current lease liabilities |
|
2.1 |
2.4 |
|
|
|
18.5 |
17.0 |
20 Provisions
Provisions represent management's best estimate of the cost of settling insured litigation claims under the Group's revised strategy, further details of which are given in Note 26. The provision comprises the expected settlement costs for claims where an obligation exists and a reliable estimate can be made, taking into account claim-specific circumstances, historical settlement experience and legal advice, where appropriate. The following table reflects the movement in the provision during the period under review.
|
|
|
2026 |
2025 |
|
|
|
£m |
£m |
|
Settlement provision as at 1 July |
|
0.7 |
0.5 |
|
Additional provisions made in the period |
|
5.5 |
0.3 |
|
Released from the provision for settlements |
|
(0.6) |
(0.1) |
|
Settlement provision as at 30 June |
|
5.6 |
0.7 |
Further information outlined within IAS 37.85 is not disclosed on the basis that it may prejudice the Company’s position.
With the exception of the lease liabilities shown in Note 13, deferred income, and the provisions referred to above, all other payable balances, including amounts due to contract holders, are deemed to be current. Due to the short-term nature of these payables the carrying value is considered to reflect fair value.
21 Capital management
It is the Group’s policy to maintain a strong capital base in order to:
- satisfy the requirements of its contract holders, creditors and regulators.
- maintain financial strength to support new business growth and create shareholder value.
- match the profile of its assets and liabilities, taking account of the risks inherent in the business; and
- generate operating cash flows to meet dividend requirements.
Within the Group each subsidiary company manages its own capital. Capital generated in excess of planned requirements is returned to the Company by way of dividends. Group capital requirements are monitored by the Board.
The Company monitors capital on two bases:
- the total shareholder’s equity, as per the balance sheet; and
- the capital requirement of the relevant supervisory bodies, where subsidiaries are regulated.
The Group’s policy is for each company to hold the higher of:
- the Company’s internal assessment of the capital required; or
- the capital requirement of the relevant supervisory body, where applicable.
There has been no material change in the Group’s management of capital during the period. The Group continued to perform additional modelling around risks arising from the current geopolitical position and global economic conditions, and to give consideration to emerging market practice and regulatory expectations around capital conservation. All regulated entities within the Group exceed significantly the minimum solvency requirements at the balance sheet date.
The Group’s lead regulator, the Isle of Man FSA, monitors capital requirements for the Group as a whole. The insurance subsidiaries are directly supervised by their local regulators. The lead regulator’s approach to the measurement of capital adequacy is primarily based on monitoring the relationship of the Solvency Capital Requirement (‘SCR’) to regulatory capital. The capital held within Hansard Europe is considered not to be available for dividend to Hansard Global plc until such time as the legal cases referred to in Note 26 are substantially resolved.
22 Share capital
|
|
|
2026 |
2025 | |
|
|
|
£m |
£m | |
|
Authorised: |
|
|
| |
|
200,000,000 ordinary shares of 50p |
100.0 |
100.0 | ||
|
Issued and fully paid: |
|
|
| |
|
137,557,079 (2025: 137,557,079) ordinary shares of 50p |
68.8 |
68.8 | ||
|
|
|
|
|
|
No shares (2025: nil) were issued or bought back in the year.
23 Other reserves
Other reserves comprise the merger reserve arising on the acquisition by the Company of its subsidiary companies on 1 July 2005, the share premium account and the share save reserve. The merger reserve represents the difference between the par value of shares issued by the Company for the acquisition of those companies, compared to the par value of the share capital and the share premium of those companies at the date of acquisition.
|
|
2026 |
2025 |
|
|
£m |
£m |
|
Merger reserve |
(48.5) |
(48.5) |
|
Share premium |
0.1 |
0.1 |
|
Share save reserve |
0.1 |
0.1 |
|
Reserve for own shares held within EBT |
(0.3) |
(0.3) |
|
|
(48.6) |
(48.6) |
Included within other reserves is an amount representing 1,012,015 (2025: 1,086,914) ordinary shares held by the Group's employee benefit trust ('EBT') (see Note 24.2) which were acquired at a cost of £0.5m. The ordinary shares held by the trustee of the Group's employee benefit trust are treated as treasury shares in the consolidated balance sheet in accordance with IAS 32 'Financial Instruments: Presentation'.
This reserve arose when the Group acquired equity share capital under its EBT, which is held in trust by the trustee of the EBT. Treasury shares cease to be accounted for as such when they are sold outside the Group, or the interest is transferred in full to the employee pursuant to the terms of the incentive plan.
24 Equity settled share-based payments
The Company has established a number of equity-based payment programmes for eligible employees. The fair value of expected equity-settled share-based payments under these programmes is calculated at date of grant using a standard option-pricing model and is amortised over the vesting period on a straight-line basis through the consolidated statement of comprehensive income. A corresponding amount is credited to equity over the same period.
At each balance sheet date, the Group reviews its estimate of the number of options expected to be exercised. The impact of any revision in the number of such options is recognised in the consolidated statement of comprehensive income so that the charge to the consolidated statement of comprehensive income is based on the number of options that vest. A corresponding adjustment is made to equity.
The estimated fair value of the schemes and the imputed cost for the period under review is not material to these financial statements.
24.1 SAYE program
This is a standard scheme approved by the Revenue authorities in the Isle of Man that is available to all employees where individuals may make monthly contributions over three or five years to purchase shares at a price not less than 80% of the market price at the date of the invitation to participate.
At the date of this report, there were no options outstanding or granted under the SAYE scheme (2025: nil) and no transactions in SAYE programs in the current or prior years.
24.2 Incentive Plan Employee Benefit Trust
An Employee Benefit Trust was established in February 2018 to hold shares awarded to employees as an incentive on a deferred basis. Shares are granted under the scheme at fair value, which is based on the market value of the shares on that date. Shares granted under the scheme are purchased by the Trust in the open market and held until vesting. Awards made under the scheme would normally vest after three years.
|
|
|
2026 |
2025 |
|
|
|
No. of |
No. of |
|
Share Awards |
|
Shares |
Shares |
|
Outstanding at start of period |
|
829,429 |
926,000 |
|
Granted |
|
472,512 |
296,729 |
|
Vested |
|
(264,881) |
(393,300) |
|
Outstanding at end of period |
|
1,037,060 |
829,429 |
The Trust has been funded by way of a loan, and as at 30 June 2026 the outstanding balance on the loan was £801,080 (30 June 2025: £664,392). As at 30 June 2026 the Trust held 1,012,015 shares (2025: 1,086,914). 264,881 shares vested and were transferred during the year ended 30 June 2026 (2025: 393,300 vested and of those, 318,401 shares transferred in that year).
|
|
|
2026 |
2025 |
|
|
|
No. of |
No. of |
|
Shares Held by the Trust |
|
Shares |
Shares |
|
Outstanding at start of period |
|
1,086,914 |
1,257,000 |
|
Purchased |
|
264,881 |
296,729 |
|
Transferred following vesting |
|
(339,780) |
(466,815) |
|
Outstanding at end of period |
|
1,012,015 |
1,086,914 |
During the period the expense arising from share-based payment transactions was £0.2m (2025: £0.2m).
25 Related party transactions
25.1 Intra-group transactions
Various subsidiary companies within the Group perform services for other Group companies in the normal course of business. The financial results of these activities are eliminated in the consolidated financial statements.
25.2 Key management personnel compensation
At 30 June 2026 key management consisted of 21 individuals (2025: 21), being members of the Group’s Executive Committee, executive Directors of direct subsidiaries of the Company and the Non-executive Directors of both the Group and subsidiary companies.
The aggregate remuneration paid to key management during the year-ended 30 June 2026 was as follows:
|
|
2026 |
2025 |
|
|
£m |
£m |
|
Short-term employee benefits |
2.5 |
2.5 |
|
Post-employment benefits |
0.2 |
0.2 |
|
Total |
2.7 |
2.7 |
There were no outstanding amounts as at 30 June 2026 (2025: nil).
The total value of investment contracts issued by the Group and held by key management is nil (2025: nil).
25.3 Transactions with controlling shareholder
Until his death in March 2025 Dr L S Polonsky was regarded as the controlling shareholder of the Group; 49,946,319 shares in the Group were held by the Leonard Polonsky Revocable Trust. On 27 October 2025 the 49,946,319 shares held by the Leonard Polonsky Revocable Trust were transferred to the Polonsky Foundation. In the year ending 30 June 2026 there were no transactions with the controlling shareholder.
25.4 Incentive Plan Employee Benefit Trust
As further described in Note 24.2, an Employee Benefit Trust (“EBT”) was established in February 2018 to hold shares awarded to employees as an incentive on a deferred basis. The EBT has been funded by way of a loan, and as at 30 June 2026 the outstanding balance on the loan was £801,080 (30 June 2025: £664,392). As at 30 June 2026 the Trust held 1,012,015 shares (2025: 1,086,914).
26 Contingent liabilities
26.1 Litigation
The Group does not and has never given investment advice. Investment decisions are taken either by the contract holder directly or through a professional intermediary appointed by the contract holder. Contract holders bear the financial risk relating to the investments underpinning their contracts, as policy benefits are linked to the value of the underlying assets.
As reported previously, the Group has been subject to a number of complaints and legal proceedings relating to the selection and performance of assets linked to contracts and other asset-related matters. Most of the writs relate to historic business written prior to the closure to new business of Hansard Europe in 2013, with a small number relating to Hansard International Limited. Most of the cases have arisen in Italy, with a smaller number in Belgium and Germany.
At 30 June 2026, the Group had contingent liabilities in respect of ongoing litigation matters with an estimated gross exposure of £9.7m (2025: £20.4m). The reduction from the prior year mainly reflects the recognition of provisions for certain litigation matters following the Board's approval of a settlement-led strategy during the year, under which management concluded that negotiated settlement had become the most likely method of resolution. Accordingly, a provision of £5.6m (2025: £0.7m) has been recognised based on management's best estimate of the expected settlement cost of those matters. The determination of this provision required significant judgement in assessing the expected method of resolution, the likelihood of settlement and the estimation of associated costs. All other matters continue to be treated as contingent liabilities in accordance with IAS 37, having regard to the specific facts and circumstances of each case, advice received from the Group's legal representatives and management's assessment of the likelihood of a successful defence.
The Group maintains insurance cover in respect of certain litigation matters. At 30 June 2026, the Group had recognised insurance recovery assets and receivables totalling £7.9m (2025: £0.6m), comprising a settlement insurance recovery asset of £5.6m (2025: £nil) and receivables relating to historic defence costs of £2.3m (2025: £0.6m). In determining the amount recognised, management has exercised judgement in assessing the extent to which recoveries are expected, taking into account the terms of the relevant policies, communications with insurers and other available evidence.
During the year, the Group received £2.1m (2025: £0.4m) of insurance recoveries relating to costs previously incurred and paid. Additional amounts recognised at year end relate to settlement provisions and historic costs that management expects to recover under the Group's insurance arrangements. The Group also notes that certain claims included within contingent liabilities are subject to insurance cover and, where coverage applies, insurance recoveries would be expected in the event of an outflow.
In accordance with IAS 37, certain information that could reasonably be expected to prejudice seriously the outcome of ongoing legal proceedings has not been disclosed. Accordingly, the Group has not provided further details regarding specific matters, legal strategies or assessments that are subject to continuing litigation.
Subsequent to the reporting date, the Group received £0.5 million from its insurers in respect of insurance recovery assets recognised at 30 June 2026. There have been no other material developments in relation to the matters disclosed above.
26.2 Isle of Man Policyholders’ Compensation Scheme
The Group’s principal subsidiary, Hansard International is a member of the Isle of Man Policyholders’ Compensation Scheme governed by the Life Assurance (Compensation of Policyholders) Regulations 1991. The objective of the Scheme is to provide compensation for policyholders should an authorised insurer be unable to meet its liabilities to policyholders. In the event of a levy being charged by the Scheme members, Hansard International would be obliged to meet the liability arising at the time. The maximum levy payable in accordance with the regulations of the Scheme in respect of the insolvency of the insurer is 2% of long-term business liabilities. Hansard International’s products include a clause in their terms and conditions permitting it to recover any monies paid out under the Scheme from contract holders.
27 Foreign exchange rates
The Group’s functional currency is pounds sterling, being the currency of the primary economic environment in which the Group operates. The Group’s presentational currency is also pounds sterling.
Foreign currency transactions are translated into sterling using the applicable exchange rate prevailing at the date of the transactions. Monetary assets and liabilities denominated in foreign currencies are translated into sterling at the rates of exchange prevailing at the balance sheet date, and the gains or losses on translation are recognised in the consolidated statement of comprehensive income.
Non-monetary assets and liabilities that are held at historical cost are translated using exchange rates prevailing at the date of transaction; those held at fair value are translated using exchange rates ruling at the date on which the fair value was determined.
The closing exchange rates used by the Group for the conversion of significant consolidated balance sheet items to sterling were as follows:
|
|
|
|
|
|
2026 |
2025 |
|
US Dollar |
1.33 |
1.37 |
|
Japanese Yen |
216 |
198 |
|
Euro |
1.16 |
1.17 |
28 Events after the reporting period
This report for the year ended 30 June 2026 was approved for issue on 23 September 2026. No material events have occurred between the reporting date and the issue date that require disclosure under IAS 10 other than already disclosed elsewhere in these financial statements.
Hansard Global plc
Parent Company Statement of Changes in Equity
for the year ended 30 June 2026
|
|
|
Share |
Other |
Retained |
|
|
|
|
capital |
reserves |
earnings |
Total |
|
|
|
£m |
£m |
£m |
£m |
|
At 1 July 2024 |
68.8 |
0.2 |
14.8 |
83.8 | |
|
|
|
|
|
| |
|
Profit and total comprehensive income for the |
- |
- |
2.3 |
2.3 | |
|
year after taxation |
|
|
|
| |
|
|
|
|
|
| |
|
Transactions with owners |
|
|
|
| |
|
Dividends paid |
- |
- |
(6.1) |
(6.1) | |
|
At 30 June 2025 |
68.8 |
0.2 |
11.0 |
80.0 | |
|
|
|
Share |
Other |
Retained |
|
|
|
|
capital |
Reserves |
earnings |
Total |
|
|
|
£m |
£m |
£m |
£m |
|
At 1 July 2025 |
68.8 |
0.2 |
11.0 |
80.0 | |
|
|
|
|
|
| |
|
Profit and total comprehensive income for the |
|
|
3.1 |
3.1 | |
|
year after taxation |
|
|
|
| |
|
|
|
|
|
| |
|
Transactions with owners |
|
|
|
| |
|
Dividends paid |
- |
- |
(6.1) |
(6.1) | |
|
At 30 June 2026 |
68.8 |
0.2 |
8.0 |
77.0 | |
The notes on pages 152 to 159 form an integral part of these financial statements.
|
Hansard Global plc
Parent Company Balance Sheet As at 30 June 2026 | ||||||
|
|
|
|
|
|
|
|
|
|
|
|
|
|
|
|
|
|
|
|
|
|
2026 |
2025 |
|
|
|
|
|
Notes |
£m |
£m |
|
Assets |
|
|
|
|
|
|
|
Fixed assets |
|
|
| |||
|
Intangible assets |
6 |
20.4 |
21.6 | |||
|
Property, plant and equipment |
7 |
0.2 |
0.2 | |||
|
Investment in subsidiary companies |
4 |
71.8 |
71.6 | |||
|
Current assets |
|
|
| |||
|
Cash and cash equivalents |
|
0.3 |
3.5 | |||
|
|
|
|
| |||
|
Other receivables |
|
1.4 |
0.3 | |||
|
Amounts due from subsidiary companies |
5 |
1.9 |
- | |||
|
Total assets |
|
96.0 |
97.2 | |||
|
|
|
|
| |||
|
Liabilities |
|
|
| |||
|
Current Liabilities |
|
|
| |||
|
Other payables |
|
2.7 |
1.6 | |||
|
Amounts due to subsidiary companies |
5 |
16.3 |
15.6 | |||
|
Total liabilities |
|
19.0 |
17.2 | |||
|
Net assets |
|
77.0 |
80.0 | |||
|
|
|
|
| |||
|
|
|
|
| |||
|
Shareholders’ equity |
|
|
| |||
|
Called up share capital |
8 |
68.8 |
68.8 | |||
|
Share premium |
|
0.1 |
0.1 | |||
|
Retained earnings |
|
8.0 |
11.0 | |||
|
Share based payments reserve |
|
0.1 |
0.1 | |||
|
Total shareholders’ equity |
|
77.0 |
80.0 | |||
The notes on pages 152 to 159 form an integral part of these financial statements.
The parent company financial statements on pages 149 to 151 were approved by the Board on 23 September 2026 and signed on its behalf by:
Thomas Morfett Ollie Byrne
Director Director
|
Hansard Global plc
Parent Company Cash Flow Statement for the year ended 30 June 2026 | ||||||||
|
|
|
|
|
| ||||
|
|
|
|
|
2026 |
2025 | |||
|
|
|
|
|
|
£m |
£m | ||
|
|
|
|
|
|
|
| ||
|
Cash flow from operating activities |
|
| ||||||
|
Profit before tax for the year |
3.1 |
2.3 | ||||||
|
Adjustments for: |
|
| ||||||
|
Dividends received |
(13.6) |
(15.2) | ||||||
|
Movement in share-based payments reserve |
- |
- | ||||||
|
Amortisation and depreciation |
1.6 |
1.7 | ||||||
|
Impairment |
- |
1.6 | ||||||
|
|
|
| ||||||
|
Changes in operating assets and liabilities |
|
| ||||||
|
Increase in amounts due from subsidiaries |
(1.9) |
- | ||||||
|
Increase in amounts due to subsidiaries |
1.4 |
1.9 | ||||||
|
(Increase) / decrease in debtors |
(1.1) |
0.1 | ||||||
|
Increase / (decrease) in creditors |
1.1 |
(0.4) | ||||||
|
Cash flow used in operations |
(9.4) |
(8.0) | ||||||
|
|
|
| ||||||
|
Cash flows from investing activities |
|
| ||||||
|
Dividends received |
13.2 |
15.2 | ||||||
|
Investment in subsidiary undertaking |
(0.9) |
- | ||||||
|
Cash flows from investing activities |
12.3 |
15.2 | ||||||
|
Cash flows from financing activities |
|
| ||||||
|
Dividends paid |
(6.1) |
(6.1) | ||||||
|
Cash flows used in financing activities |
(6.1) |
(6.1) | ||||||
|
Net (decrease)/increase in cash and cash equivalents |
(3.2) |
1.1 | ||||||
|
Cash and cash equivalents at beginning of year |
3.5 |
2.4 | ||||||
|
Cash and cash equivalents at year end |
0.3 |
3.5 | ||||||
|
|
|
|
|
|
|
| ||
|
|
|
|
|
|
|
| ||
|
|
|
|
|
|
|
|
|
|
The notes on pages 152 to 159 form an integral part of these financial statements.
Notes to the parent company financial statements
1 General information
Hansard Global plc (“the Company”) is a limited liability company, and is incorporated and domiciled in the Isle of Man. The registered office of the company is 55 Athol Street, Douglas, Isle of Man, IM99 1QL. The Company is listed on the London Stock Exchange.
The principal activity of the Company is to act as the holding company of the Hansard group of companies (“the Group”).
The Company has its primary listing on the London Stock Exchange.
2 Significant accounting policies
2.1 Basis of preparation
The individual financial statements of the Company have been prepared on a going concern basis in compliance with United Kingdom Standards including Financial Reporting Standard 102 ‘The Financial Reporting Standard applicable in the United Kingdom and the Republic of Ireland’ (“FRS 102”) and the Isle of Man Companies Acts 1931 to 2004. They are prepared under the historical cost convention. In accordance with the provisions of the Isle of Man Companies Act 1982 the Company has not presented its own profit and loss account. The Company’s profit for the year ended 30 June 2026, including dividends received from subsidiaries, was £3.1m (2025: £2.3m).
The preparation of financial statements in conformity with FRS 102 requires the use of certain critical accounting estimates. It also requires management to exercise judgement in the process of applying the accounting policies. The areas involving a higher degree of judgement or complexity, or areas where assumptions and estimates are significant to the financial statements are disclosed in Note 3.
The following amendments to FRS 102 have been issued but have not been applied in these financial statements. Their adoption is not expected to have a material effect on the financial statements, unless otherwise indicated:
- Amendments to Section 20 Leases (effective 1 January 2026). This removes the distinction between operating and finance leases for lessees; with more leases recognised with an asset and liability on the balance sheet. On adoption the Company expects to recognise right-of-use assets and corresponding lease liabilities consistent with the accounting treatment applied in the Group’s consolidated financial statements under IFRS 16.
- Amendments to Section 23 Revenue from Contracts with Customers (effective 1 January 2026).
- Amendments to section 1A Small Entities (effective 1 January 2026).
- Amendments to Section 2A Fair Value Measurement (effective 1 January 2026). This aligns definitions with latest international standards and provides additional guidance.
There are no other standards, amendments or interpretations to existing standards that are not yet effective, that would have a material impact on the Company’s reported results.
2.2 Investment income
Investment income includes interest and dividends. Interest is accounted for on the accruals basis. Dividends are accrued on an ex-dividend basis.
2.3 Dividends payable
Dividends payable to shareholders are recognised in the year in which the dividends are approved. These amounts are recognised in the statement of changes in equity.
2.4 Revenue recognition
Revenue is measured at the fair value of the consideration received or receivable and represents the amount receivable for services rendered net of returns, discounts and rebates allowed by the Company, and value added taxes.
Where the consideration receivable in cash or cash equivalents is deferred, and the arrangement constitutes a financing transaction, the fair value of the consideration is measured as the present value of all future receipts using the imputed rate of interest.
The Company recognises revenue when the services are rendered, the amount of revenue can be measured reliably, and it is probable that future economic benefits will flow to the Company.
2.5 Employee benefits
The Company provides a range of competitive benefits to employees in line with local legislation for the jurisdiction in which they are based. Our Head Office proposition includes private health insurance with the option to include family members, permanent health insurance, death in service scheme, annual bonus arrangements, and non-contributory pension plans which can be further enhanced via salary sacrifice arrangements.
Short term benefits, including holiday pay and other similar non-monetary benefits, are recognised as an expense in the period in which the service is received.
A defined contribution plan is a pension plan under which the Company pays fixed contributions into a separate entity. Once the contributions have been paid the Company has no further payment obligations. The contributions are recognised as an expense when they are due. Amounts not paid are shown in accruals in the balance sheet. The assets of the plan are held separately from the Company in independently administered funds.
The Company operates an annual bonus plan for employees. An expense is recognised in the profit and loss account when the Company has a legal or constructive obligation to make payments under the plan as a result of past events and a reliable estimate of the obligation can be made.
2.6 Investments in subsidiaries
Investments in subsidiary companies are held at cost, adjusted for any impairment.
2.7 Foreign currencies
The Company’s presentational and functional currency is pounds sterling, being the currency of the primary economic environment in which the Company operates.
Foreign currency transactions are translated into sterling using the approximate exchange rate prevailing at the date of the transactions. Monetary assets and liabilities denominated in foreign currencies are translated into sterling at the rates of exchange prevailing at the balance sheet date and the gains or losses on translation are recognised in the profit and loss account.
2.8 Property, plant and equipment
Property, plant and equipment is stated at historic purchase cost less accumulated depreciation.
The cost of property, plant and equipment is their purchase cost, together with any incidental costs of acquisition. Depreciation is calculated so as to write off the cost of tangible assets, less their estimated residual values, on a straight-line basis over the expected useful economic lives of the assets concerned. The principal rates used for this purpose are:
|
Freehold property |
50 years |
|
Computer equipment |
3 years |
|
Fixtures and fittings |
4-10 years |
2.9 Intangible assets
Intangible fixed assets are stated at historic purchase cost less accumulated amortisation. The cost of intangible assets is their purchase cost, together with any incidental costs of acquisition. Amortisation is calculated so as to write off the cost of intangible assets, less their estimated residual values, on a straight-line basis over the expected useful economic lives of the assets concerned. The intangible asset represents a new suite of IT systems, brought into use on 1 March 2024. Amortisation commenced from that date, with the cost being amortised over 15 years, which is deemed to be the useful economic life of the asset.
2.10 Cash and cash equivalents
Cash and cash equivalents include cash in hand, deposits held at call with banks, and other short-term highly liquid investments with a minimal cost to be converted to cash, typically with original maturities of three months or less, net of short-term overdraft positions where a right of set-off exists.
2.11 Financial instruments
The Company has chosen to adopt Sections 11 and 12 of FRS 102 in respect of financial instruments.
- Financial assets
Basic financial assets, including trade and other receivables, (i.e., debtors and amounts due from group undertakings) and cash at bank, are initially recognised at transaction price, unless the arrangement constitutes a financing transaction, where the transaction is measured at the present value of the future receipts discounted at a market rate of interest. Such assets are subsequently carried at amortised cost using the effective interest method.
At the end of each reporting period financial assets measured at amortised cost are assessed for objective evidence of impairment. If an asset is impaired the impairment loss is the difference between the carrying amount and the present value of the estimated cash flows discounted at the asset’s original effective interest rate. The impairment loss is recognised in profit or loss.
If there is a decrease in the impairment loss arising from an event occurring after the impairment was recognised the impairment is reversed. The reversal is such that the current carrying amount does not exceed what the carrying amount would have been had the impairment not previously been recognised. The impairment reversal is recognised in profit or loss.
Financial assets are derecognised when (a) the contractual rights to the cash flows from the asset expire or are settled, or (b) substantially all the risks and rewards of ownership of the asset are transferred to another party or (c) control of the asset has been transferred to another party who has the practical ability to unilaterally sell the asset to an unrelated third party without imposing additional restrictions.
(ii) Financial liabilities.
Basic financial liabilities, including accruals and other creditors, and amounts due to group undertakings, are initially recognised at transaction price, unless the arrangement constitutes a financing transaction, where the debt instrument is measured at the present value of the future receipts discounted at a market rate of interest.
Other creditors are obligations to pay for goods or services that have been acquired in the ordinary course of business from suppliers. Accounts payable are classified as current liabilities if payment is due within one year or less. If not, they are presented as non-current liabilities. Trade payables are recognised initially at transaction price and subsequently measured at amortised cost using the effective interest method.
Financial liabilities are derecognised when the liability is extinguished, that is when the contractual obligation is discharged, cancelled or expires.
2.12 Operating lease assets
Leases that do not transfer all of the risks of ownership are classified as operating leases. Payments under operating leases are charged to the profit and loss account on a straight-line basis over the period of the lease.
2.13 Share capital
Ordinary shares are classified as equity.
2.14 Related parties
The Company discloses transactions with related parties which are not wholly owned by the same group. It does not disclose transactions with members of the same group that are wholly owned.
3 Critical accounting estimates and judgements in applying accounting policies
Estimates, assumptions and judgements are used in the application of accounting policies in these financial statements. Critical accounting estimates are those which involve the most complex or subjective judgements or assessments. Estimates, assumptions and judgements are evaluated continually and are based on historical experience and other factors, including expectations of future events that are believed to be reasonable under the circumstances. Actual outcomes may differ from assumptions and estimates made by management.
There are no areas in which the Company applies significant accounting estimates or assumptions.
4 Investment in subsidiary companies
The following schedule reflects the Company’s subsidiary companies at the balance sheet date and at the date of this report. All companies are wholly owned and incorporated in the Isle of Man, except where indicated.
Subsidiary company
Hansard International Limited
Hansard Worldwide Limited (incorporated in The Bahamas)
Hansard Europe Designated Activity Company (incorporated in the Republic of Ireland)
Hansard Development Services Limited
Hansard Administration Services Limited
The holding value of the Company’s investment in its subsidiaries is assessed annually for evidence of impairment. This assessment considers, among other factors, the cost versus carrying value of the investment, future dividend flows, going concern and the Value of In-Force of the Company’s subsidiaries in order to confirm there are no indicators of impairment identified.
|
|
2026 |
2025 |
|
Investment in Subsidiary Companies |
£m |
£m |
|
Cost as at 1 July |
71.6 |
72.5 |
|
Additions |
0.2 |
0.7 |
|
Impairment |
- |
(1.6) |
|
Cost as at 30 June |
71.8 |
71.6 |
The Company holds an investment in Hansard Europe Designated Activity Company, which is accounted for at cost in accordance with FRS 102 Section 9. An impairment charge was recognised at 30 June 2025 following a review of the recoverable amount of the investment.
As at 30 June 2026, management has not identified indicators of further impairment of subsidiaries, neither has it identified indicators or sufficient evidence to support the reversal of the impairment recognised in the prior year.
5 Amounts due from / (due to) subsidiary companies
The Company and various subsidiary companies within the Group perform services for other Group companies in the normal course of business. All balances are unsecured, interest free and repayable on demand.
6 Intangible assets
The historical cost of computer software is the purchase cost and the direct cost of internal development. Computer software is recognised as an intangible asset.
|
|
2026 |
2025 |
|
Carrying Values |
£m |
£m |
|
Computer software |
20.4 |
21.6 |
Computer software is stated at historical cost less amortisation and any impairment. The historical cost of computer software is the purchase cost of external software, together with internal development costs directly attributable to the asset.
Amortisation is calculated so as to amortise the cost of the intangible asset, less the estimated residual values, on a straight-line basis over the expected useful economic life of the asset concerned and is included in administration and other expenses in the statement of comprehensive income.
The carrying amount, residual value and useful life of the Company’s intangible asset is reviewed annually to determine whether there is any indication of impairment, or a change in residual value or expected useful life. If there is any indication of impairment, the asset’s carrying value is revised. Management has assessed the software assets for indicators of impairment at 30 June 2026 and concluded that no indicators of impairment existed.
The economic lives used for this purpose are:
|
Computer software 15 years |
|
|
2026 |
2025 |
|
Computer software |
£m |
£m |
|
Cost as at 1 July Additions |
23.7 0.4 |
23.7 - |
|
Cost as at 30 June |
24.1 |
23.7 |
|
Amortisation as at 1 July Charge for the year |
(2.1) (1.6) |
(0.5) (1.6) |
|
Amortisation as at 30 June |
(3.7) |
(2.1) |
|
Net Book Value |
20.4 |
21.6 |
The Company holds two software-related intangible assets. The primary software platform was brought into use on 1 March 2024 and is being amortised over a 15-year period, reflecting management's assessment of its useful economic life. On 30 June 2026, an additional software asset with a carrying value of £0.4m was transferred to the Company by way of dividend from Hansard Administration Services Limited. This asset is an add-on to the existing system and therefore will be amortised over the remaining life of that asset.
The cost of computer software includes £14.0m of externally generated costs (2025: £13.6m) and £10.1m of internally generated costs (2025: £10.1m). Amortisation includes £2.1m of externally generated costs (2025: £1.2m) and £1.6m of internally generated costs (2025: £0.9m).
7 Property, plant and equipment
Depreciation is included in the profit and loss account and calculated in line with the accounting policy published above.
|
|
2026 |
2025 |
|
Carrying Values |
£m |
£m |
|
Property, plant and equipment |
0.2 |
0.2 |
Property, plant and equipment is stated at historical cost less depreciation and any impairment. The historical cost of property, computer equipment and fixtures and fittings is the purchase cost, together with any incremental costs directly attributable to the acquisition.
Depreciation is calculated so as to amortise the cost of tangible assets, less their estimated residual values, on a straight-line basis over the expected useful economic lives of the assets concerned and is included in administration and other expenses in the statement of comprehensive income.
The carrying amount, residual value and useful life of the Company’s plant and equipment is reviewed annually to determine whether there is any indication of impairment, or a change in residual value or expected useful life. If there is any indication of impairment, the asset’s carrying value is revised.
The economic lives used for this purpose are:
|
Fixtures & fittings 4-10 years |
|
|
2026 |
2025 |
|
Fixtures and fittings |
£m |
£m |
|
Cost as at 1 July Additions |
1.2 - |
1.2 - |
|
Cost as at 30 June |
1.2 |
1.2 |
|
Accumulated Depreciation as at 1 July Charge for the year* |
(1.0) - |
(0.9) (0.1) |
|
Accumulated depreciation as at 30 June |
(1.0) |
(1.0) |
|
Net Book Value |
0.2 |
0.2 |
*The charge for the current year is less than £0.1m (2025: £0.1m).
8 Share capital
|
|
|
2026 |
2025 |
|
|
|
£m |
£m |
|
Authorised: |
|
|
|
|
200,000,000 ordinary shares of 50p |
100.0 |
100.0 | |
|
Issued and fully paid: |
|
| |
|
137,557,079 (2025: 137,557,079) ordinary shares of 50p |
68.8 |
68.8 | |
During the year no shares were issued or bought back (2025: nil).
The Company has previously received clearance from the London Stock Exchange to list a maximum of 1,200,000 shares necessary to meet its obligations to employees under the terms of the employee share save (SAYE) scheme. As at 30 June 2026 924,123 shares remained available for listing (2025: 924,123).
9 Related party transactions
The company has wholly owned subsidiaries as referred to in Note 4. Until his death in March 2025 Dr L S Polonsky was regarded as the controlling shareholder of the Group; 49,946,319 shares in the Group were held by the Leonard Polonsky Revocable Trust. On 27 October 2025 the 49,946,319 shares held by the Leonard Polonsky Revocable Trust were transferred to the Polonsky Foundation. In the year ending 30 June 2026 there were no transactions with the controlling shareholder.
During the year fees totalling £0.3m (2025: £0.3m) were paid to Non-executive Directors.
The aggregate remuneration paid to key management of the Company for the year ended 30 June was as follows:
|
|
2026 |
2025 |
|
|
£m |
£m |
|
Salaries, wages and bonuses |
1.9 |
1.9 |
10 Equity settled share-based payments
10.1 SAYE program
Shareholders have approved a Save as You Earn (“SAYE”) share save program for employees. The scheme is a standard SAYE plan, approved by the Revenue Authorities in the Isle of Man and is available to eligible employees. Under the terms of the scheme, individuals can invest up to £500 per month for a three or five-year period to purchase shares at a price not less than 80% of the market price on the date of the invitation to participate.
The scheme can be operated annually, with the option price and awards criteria normally being established in February. No scheme was issued during the years ended 30 June 2021 to 30 June 2026. The estimated fair value of the schemes and the imputed cost for the period under review is not material to these financial statements.
Details are available in Note 24 to the consolidated financial statements.
10.2 Incentive Plan Employee Benefit Trust
An Employee Benefit Trust (‘EBT’) was established in February 2018 to hold shares awarded to employees as an incentive on a deferred basis. Shares awarded under the scheme are purchased by the EBT in the open market and held until vesting. Awards made under the scheme would normally vest after three years. The shares are granted at fair value which is based on the market value of the shares on that date.
|
|
|
2026 |
2025 |
|
|
|
No. of |
No. of |
|
Share Awards |
|
Shares |
Shares |
|
Outstanding at start of period |
|
829,429 |
926,000 |
|
Granted |
|
472,512 |
296,729 |
|
Vested |
|
(264,881) |
(393,300) |
|
Outstanding at end of period |
|
1,037,060 |
829,429 |
The EBT has been funded by way of a loan, and as at 30 June 2026 the outstanding balance on the loan was £801,080 (30 June 2025: £664,392). As at 30 June 2026 the EBT held 1,012,015 shares (2025: 1,086,914). 264,881 shares vested and were transferred during the year ended 30 June 2026 (2025: 393,300 vested and 318,401 transferred).
|
|
|
2026 |
2025 |
|
|
|
No. of |
No. of |
|
Shares Held by the EBT |
|
Shares |
Shares |
|
Outstanding at start of period |
|
1,086,914 |
1,257,000 |
|
Purchased |
|
264,881 |
296,729 |
|
Transferred following vesting |
|
(339,780) |
(466,815) |
|
Outstanding at end of period |
|
1,012,015 |
1,086,914 |
During the period the expense arising from share-based payment transactions was £0.2m (2025: £0.2m).
11 Events after the reporting period
This report for the year ended 30 June 2026 was approved for issue on 23 September 2026. No material events have occurred between the reporting date and the issue date that require disclosure under IAS 10.
OTHER INFORMATION
Risk Based Solvency Capital
A) Risk Based Solvency capital position
The Group is subject to the Isle of Man Insurance (Group Supervision) Regulations 2019.
It has adopted the default consolidated accounts method (“Method 1”) to calculate the Group Solvency Capital Requirement (“SCR”) and Own Funds as required by these regulations. The solvency position as at 30 June 2026 has been reported below on this basis.
The Group shareholder Risk Based Solvency surplus at 30 June 2026 was £46.1m (30 June 2025: £45.6m) before allowing for payment of the 2026 final ordinary dividend.
All Risk Based Solvency and related data presented in this section is subject to change prior to submission to regulatory authorities.
|
|
|
30 June |
30 June |
|
Group Risk Based Solvency Capital position |
|
2026 Total |
2025 Total |
|
|
|
£m |
£m |
|
Own Funds |
|
111.9 |
111.4 |
|
Solvency Capital Requirement |
|
65.8 |
65.8 |
|
Free assets |
|
46.1 |
45.6 |
|
Solvency ratio (%) |
|
170% |
169% |
All Own Funds are considered Tier 1 capital.
The following compares Own Funds as at 30 June 2026 and 30 June 2025:
|
|
30 June 2026 |
30 June 2025 |
|
|
Own Funds £m |
Own Funds £m |
|
Value of In-Force |
102.7 |
103.1 |
|
Risk Margin |
(9.3) |
(8.7) |
|
Net Worth |
18.5 |
17.0 |
|
Total |
111.9 |
111.4 |
B) Analysis of movement in Group Solvency surplus
A summary of the movement in Group Solvency surplus from £45.6m at 30 June 2025 to £46.1m at 30 June 2026 is set out in the table below.
|
|
|
|
|
£m |
|
Risk Based Solvency surplus at 30 June 2025 |
45.6 |
|
Operating experience |
2.7 |
|
Investment performance |
9.4 |
|
Changes in assumptions |
(7.2) |
|
Impact of dividends paid |
(5.4) |
|
Foreign exchange |
1.0 |
|
Risk Based Solvency surplus at 30 June 2026 |
46.1 |
The movement in Group Risk Based Solvency surplus in the 2026 financial year was the result of operating experience, foreign exchange and investment performance, offset by changes in dividends paid and changes in assumptions. The change in assumptions is mainly driven by an increase in expense assumptions.
New business written had a negative £5.4m impact on solvency surplus for the period.
C) Analysis of Group Solvency Capital Requirement
The analysis of the Group’s Solvency Capital Requirement (“SCR”) by risk type is as follows:
|
Split of the Group’s Solvency Capital Requirement * |
30 June 2026 |
30 June 2025 |
|
Risks |
% of SCR |
% of SCR |
|
Market |
|
|
|
Equity |
48% |
46% |
|
Currency |
15% |
17% |
|
Insurance |
|
|
|
Lapse |
37% |
35% |
|
Expense |
21% |
19% |
|
Default |
2% |
2% |
|
Operational |
23% |
29% |
* Figures are the capital requirements prior to diversification benefits expressed as a percentage of the final diversified SCR.
D) Reconciliation of IFRS equity to Group Risk Based Solvency Shareholder Own Funds
|
|
|
30 June 2026 |
30 June 2025 |
|
|
|
£m |
£m |
|
IFRS shareholders’ equity |
|
16.6 |
16.5 |
|
Elimination of DOC |
|
(102.0) |
(106.3) |
|
Elimination of DIR |
|
132.9 |
136.8 |
|
Value of In-Force |
|
102.7 |
103.1 |
|
Liability valuation differences* |
|
(1.2) |
(3.6) |
|
Impact of risk margin |
|
(9.3) |
(8.7) |
|
Other** |
|
(27.8) |
(26.4) |
|
Risk Based Solvency Shareholder Own Funds |
|
111.9 |
111.4 |
* Liability valuation differences relate to additional provisions made for risk-based capital purposes, notably for contingent liabilities.
** Other is related to Intangible Assets not recognised on the solvency balance sheet.
E) Sensitivity analysis
The sensitivity of the Own Funds of the Group and of the Group’s life insurance subsidiaries to significant changes in market conditions is as follows:
|
|
|
30 June 2026 |
30 June 2025 |
|
|
|
Group |
Group |
|
|
|
£m |
£m |
|
Own Funds |
|
111.9 |
111.4 |
|
Impact of: |
|
|
|
|
10% instantaneous fall in equity markets |
|
(8.8) |
(8.5) |
|
100 basis points decrease in interest rates |
|
(0.5) |
(0.5) |
|
10% increase in expenses |
|
(7.6) |
(6.8) |
|
1% increase in expense inflation |
|
(4.9) |
(4.6) |
|
10% strengthening of sterling |
|
(9.4) |
(9.2) |
Glossary
Annualised premium equivalent (“APE”)
An industry measure of insurance new business sales. It is calculated as the sum of regular premiums and 10% of single premiums written in the year.
Assets under administration (“AuA”)
A measure of the total assets that the Group administers on behalf of contract holders, who have selected an external third-party investment manager.
Corporate Governance Code (“the Code”)
The UK Corporate Governance Code sets out guidance in the form of principles and provisions on how companies should be directed and controlled to follow good governance practice. The Financial Reporting Council requires companies listed in the UK to disclose how they have applied principles of the Code and whether they have complied with its provisions throughout the accounting year. Where the provisions have not been complied with, companies must provide an explanation for this.
Covered business
The in-force business of the Group, including all contracts issued by the Group’s life insurance subsidiaries and subsidiaries providing administration, distribution and other services, as at the valuation date. It excludes the value of any future new business that the Group may write after the valuation date.
Deferred origination costs (“DOC”)
The method of accounting whereby origination costs of long-term business are deferred in the balance sheet as an asset and amortised over the life of those contracts. This leads to a smoothed recognition of up-front expenses instead of the full cost in the year of sale.
Deferred income (“DIR”)
The method of accounting whereby front-end fees that relate to services to be provided in future periods are deferred in the balance sheet as a liability and amortised over the life of those contracts. This leads to a smoothed recognition of up-front income instead of the full income in the year of sale.
Discounting
The reduction to present value at a given date of a future cash transaction at an assumed rate, using a discount factor reflecting the time value of money.
Earnings per share (“EPS”)
EPS is a commonly used financial metric which can be used to measure the profitability and strength of a company over time. EPS is calculated by dividing profit by the number of ordinary shares. Basic EPS uses the weighted average number of ordinary shares outstanding during the year. Diluted EPS adjusts the weighted average number of ordinary shares outstanding to assume conversion of all dilutive potential ordinary shares, for example share awards and share options awarded to employees.
Economic assumptions
Assumptions in relation to future interest rates, investment returns, inflation, and tax.
Enterprise risk management (“ERM”) programme.
The framework of governance, risk management and internal control arrangements implemented by the Group to promote identification, monitoring and management of existing and emerging risks.
Group
Hansard Global plc and its subsidiaries.
Growth investment spend
Costs incurred investing in the future of our business, including technology to support our growth.
Independent Financial Advisors (“IFAs”)
A person or organisation authorised to give advice on financial matters and to sell the products of financial service providers. Outside the UK IFAs may be referred to by other names.
In-force
Long-term business which has been written before the period end and which has not terminated before the period end.
International Financial Reporting Standards (“IFRS”)
International Financial Reporting Standards are accounting standards issued by the International Accounting Standards Board (“IASB”). The Group's consolidated financial statements are required to be prepared in accordance with IFRS as adopted by the United Kingdom to allow comparable reporting between companies.
IFRS equity per share
Total IFRS equity divided by the diluted number of issued shares at the end of the period.
Key Performance Indicator (“KPI”)
This is one of several measures by reference to which the development, performance or position of the business can be measured effectively.
Maintenance expenses
Expenses related to the servicing of the in-force book of business (including investment and termination expenses and a share of overheads).
Net worth
The market value of the shareholders’ funds, determined on an IFRS basis, adjusted to exclude certain assets such as the deferred origination costs and liabilities such as deferred income and deduct any non-admissible assets. This has been adjusted for statutory reserves on the “Own Funds” basis.
Net Issued Commission Credit (“NICC”)
NICC is a measure of the value of new business written, including new policies and top-ups on existing single premium contracts. It represents the basic initial commission payable to intermediaries on new business, net of commission clawbacks arising from policy lapses. NICC excludes override commissions paid above the standard commission scale. As a result, NICC reflects not only sales volumes but also the quality and persistency of business written.
Origination costs
Expenses related to the procurement and processing of new business written including a share of overheads. Sometimes known as acquisition costs.
Own Funds
Those funds as defined under Solvency II, comprising Basic Own Funds and Ancillary Own Funds. Basic Own Funds consist of the excess of assets over liabilities as valued in accordance with Solvency II rules. Ancillary Own Funds consist of items other than Basic Own Funds which can be called up to absorb losses such as unpaid share capital or letters of credit and guarantees. The Group does not have any such Ancillary Own Funds.
Present Value of New Business Premiums (“PVNBP”)
The industry measure of insurance new business sales under the European Embedded Value methodology. It is calculated as 100% of single premiums plus the expected present value of new regular premiums.
Regular premium
A regular premium contract (as opposed to a single premium contract), is one where the contract holder agrees at inception to make regular payments throughout the term of the contract.
Risk Based Solvency
Solvency calculated according to the Isle of Man Insurance (Long-term business Valuation and Solvency) Regulations 2021. A solvency regime designed to be capable of a positive Solvency II equivalence assessment.
Risk discount rate
The present value of a future cash amount depends on its currency and the time until it will become available. The present value is determined using a discount rate that reflects currency and timing. Discount rates are set based on swap rates for the relevant currency determined at year-long intervals for amounts in GBP, EUR, USD and JPY up to year 30, and the year 30 rate thereafter. This covers over 95% of the future expected cash amounts by funds under management: other currencies are assumed to be subject to the GBP rate. Year 1 rates are used to unwind the existing business and are shown separately in the disclosures.
Single premium
A single premium contract (as opposed to a regular premium contract (see above)), involves the payment of one premium at inception with no obligation for the contract holder to make subsequent additional payments.
Solvency II
The EU-wide regulatory regime which aims to more closely align solvency capital to an insurer’s risk profile. It came into force on 1 January 2016.
Underlying Operating Profit
IFRS profit before tax less litigation and non-recurring expenses. This is considered an appropriate alternative measure as it shows the Group IFRS profitability on a “Business As Usual” basis.
Unit-linked policy
A policy where the benefits are determined by reference to the investment performance of a specified pool of assets referred to as the unit-linked fund.
Value of In-force (“VIF”)
The present value of expected future shareholder profits less the present value cost of holding capital required to support the in-force business.
Weighted Net Issued Commission Credit (“WNICC”)
WNICC is the Group's primary measure of new business performance. It is calculated by applying profitability weightings to Net Issued Commission Credit ("NICC"), reflecting the differing long-term profitability of the Group's products. By adjusting for these profitability differences, WNICC provides a consistent measure of the economic value of new business written and is used by management to monitor performance and align incentive arrangements with the creation of long-term shareholder value.
Financial Calendar
|
Financial Calendar for the financial year ending 30 June 2027 |
|
Ex-dividend date for final dividend |
1 October 2026 |
|
Record date for final dividend |
2 October 2026 |
|
Annual General Meeting |
4 November 2026 |
|
Payment date for final dividend |
12 November 2026 |
|
Publication of half-yearly results |
4 March 2027 |
|
Declaration of interim dividend |
4 March 2027 |
|
Ex-dividend date for interim dividend |
11 March 2027 |
|
Record date for interim dividend |
12 March 2027 |
|
Payment of interim dividend |
22 April 2027 |
|
Announcement of results for the year ended 30 June 2027 |
30 September 2027 |
|
Declaration of final dividend |
30 September 2027 |
|
Ex-dividend date for final dividend |
7 October 2027 |
|
Record date for final dividend |
8 October 2027 |
|
Annual General Meeting |
3 November 2027 |
|
Payment date for final dividend |
11 November 2027 |
|
Contacts and Advisors |
|
Registered Office 55 Athol Street Douglas Isle of Man IM99 1QL Tel: +44 (0)1624 688000 Fax: +44 (0)1624 688008 www.hansard.com
|
|
|
Non-executive Chair Philip Kay Philip.Kay@hansard.com
|
Broker Panmure Liberum Limited Ropemaker Place, Level 12 25 Ropemaker Street London EC2Y 9LY Tel. +44 (0)20 7886 2500 |
|
Financial Advisor Rothschild & Co New Court St Swithin’s Lane London EC4N 8AL Tel: +44 (0)20 7280 1966
|
Registrar MUFG Corporate Markets (Guernsey) Limited
Mont Crevelt House Bulwer Avenue St Sampson Guernsey GY2 4LH Tel (UK): 0871 664 0300* Tel: +44 (0)20 8639 3399
|
|
Independent Auditor KPMG Audit LLC Heritage Court 41 Athol Street Douglas Isle of Man IM1 1LA Tel: +44 (0)1624 681000 | |
|
*NB: 0871 Number – calls cost 12p per minute plus network extras. If you are outside the United Kingdom, please call +44 371 664 0300. Calls outside the United Kingdom will be charged at the applicable international rate. The helpline is open between 9.00 am – 5.30 pm, Monday to Friday excluding public holidays in England and Wales. |
UK Transfer Agent MUFG Corporate Markets Central Square, 29 Wellington St, Leeds LS1 4DL Tel (UK): 0871 664 0300 * Tel: +44 (0)20 8639 3399
|
RNS may use your IP address to confirm compliance with the terms and conditions, to analyse how you engage with the information contained in this communication, and to share such analysis on an anonymised basis with others as part of our commercial services. For further information about how RNS and the London Stock Exchange use the personal data you provide us, please see our Privacy Policy.

Latest directors dealings
- 1 minute ago Origin Enterprises (CDI)
- 7 minutes ago Prudential
- 3 hours ago Trufin
- 3 hours ago Everplay Group plc
- 3 hours ago Hilton Food Group