
Quarterly Activities Report September 2026
Summary by AI BETAClose X


NEWS RELEASE 30 October 2026
Quarterly Activities Report September 2026
GreenX Metals Limited (ASX:GRX, LSE:GRX, GPW:GRX, Germany-FSE:A3C9JR) (GreenX or the Company) is pleased to present its Quarterly Activities Report for the period during and subsequent to 30 September 2026.
SUMMARY
· TANNENBERG COPPER PROJECT (GERMANY)
o EXPLORATION TARGET:
o Exploration Target at Tannenberg of 144 to 279 Mt at 0.9% to 1.4% Cu and 15 to 21 g/t Ag for 1.3 to 3.9 Mt Cu and 69 to 188 Moz Ag demonstrates potential for a globally significant copper endowment at Tannenberg.
Cautionary Statement: The Exploration Target has been reported in accordance with the 2012 edition of the JORC Code (JORC Code). The potential quantity and grade of the Exploration Target is conceptual in nature. There has been insufficient exploration to estimate a Mineral Resource for the reported target areas. It is uncertain if further exploration will result in the estimation of a Mineral Resource.
o ONGOING WORK PROGRAMS:
o GreenX continues to advance a coordinated suite of exploration activities at Tannenberg, to test the validity of the Exploration Target.
o Work programs include collation and digitisation of historical geological, mine development, and production data, seismic surveys to aid future drilling campaigns) and commencement of an initial drill program (2027).
· ELEONORE NORTH PROJECT (GREENLAND)
o TWO NEW LICENCES EXPAND GOLD AND CRITICAL MINERALS PORTFOLIO:
o Multiple intrusion-related gold targets identified in two new licences covering ~1,600 km². The Company has been exploring the Eleonore North Project for reduced intrusion-related gold systems (RIRGS) since 2024. These new licences build on a growing understanding of this deposit style in this region and secures prospective Caledonian intrusions untested by the RIRGS model.
o Gold assays up to 50 g/t previously reported. Gold-mineralised boulders and quartz veins hosted in granitic intrusions were found in 1975. After a brief site visit in 1983, detailed gold-scheelite exploration was recommended, but none took place.
o Anomalous gold, silver, tungsten, and arsenic in regional sediment sampling corresponds to target intrusions. Caledonian intrusions and adjacent strata are shedding mineralised material into local streams. Despite strong results from the historic stream sediment sampling program, follow-up gold exploration never took place.
o Extensive evidence of tungsten mineralisation in the form of scheelite from stream sediment sampling. Tungsten is one of the foremost defence materials, widely used in high-strength applications and in armour-piercing ammunition. Tungsten is designated as a strategic raw material by the EU and a critical mineral by the US.
o 160 km-long mineralised structural corridor. 60 km to the southeast of the licenced Caledonian intrusions, the Malmbjerg Climax-type molybdenum porphyry deposit straddles the same fault system. 100 km to the north, the structural system passes through the Company's other licences which host the North Margeries Sb-W and South Margeries W historical deposits and the Noa Pluton Sb-Au-W prospect.
o GreenX's Eleonore North Project now comprises a portfolio of four exploration licences covering approximately 2,100 km² in East Greenland.
o 2026 FIELDWORK COMPLETED:
o Fieldwork is now complete. Reconnaissance sampling and mapping have tested the RIRGS model over the Caledonian intrusions within the new licences. This fieldwork was run in conjunction with exploration at the existing Eleonore North licences (refer to announcement dated 24 July 2026). Results from the July 2026 fieldwork are expected in the coming months.
o Bulk sampling of tungsten and antimony-mineralised material at North and South Margeries deposits is expected to support scoping study level metallurgical sighter test work.
o Archive core from North and South Margeries deposits was sampled and sent for assay prior to fieldwork commencing. Results are expected in the coming month.
· ARBITRATION SET-ASIDE PROCEEDINGS
o As previously announced, the Singapore Court dismissed, in its entirety, Poland's application to set aside the Company's ECT award, thereby upholding GreenX's previously announced right to compensation under the ECT award.
o A redacted version of the Singapore Court's judgment has been released and brought to the attention of the English courts in connection with the BIT set-aside proceedings, which were heard this month. Under the English Arbitration Act 1996, the threshold to succeed on a set aside application in the courts of England and Wales is exceptionally high, and courts typically reject these challenges unless there has been a serious procedural irregularity.
o Poland subsequently appealed the Singapore Court's decision. This appeal was heard by the Singapore Court of Appeal in September 2026, following which Poland will have no further rights of appeal within the Singapore court system.
o Following the Singapore Court's initial dismissal of Poland's ECT set-aside application, the Company has commenced preparations for enforcement activities in relation to the award.
o The Company will continue to defend its awards and update the market on both the ECT and BIT proceedings in accordance with its continuous disclosure obligations.
ENQUIRIES
|
Ben Stoikovich Chief Executive Officer
+44 207 478 3900 |
Kazimierz Chojna Investor Relations, Poland
Kim Eckhof Investor Relations, UK / Germany |
TANNENBERG COPPER PROJECT (GERMANY)
The Tannenberg Copper Project (Tannenberg) is a large scale, relatively shallow and potential high-grade copper brownfields exploration project that is strategically located in central Germany.
Copper is currently recognised as a strategic raw material by the European Union.
Prior to closure in the 1950's, the Richelsdorf mines produced 416,500 tonnes of copper and 33.7 million ounces of silver from Kupferschiefer type deposits. These historic mines consisted of shallow underground workings originally accessed from surface outcrops.
Kupferschiefer style deposits are a well-known and prolific subtype of sediment-hosted copper deposit that are the second most prevalent source of copper production and reserves in the world and have been historically mined in Germany and are still mined in Poland.
Germany has been a significant mining jurisdiction in the past and continues its mining tradition, including the K+S potash mines which operate 4 km away from the licence area and are located in the State of Hesse.
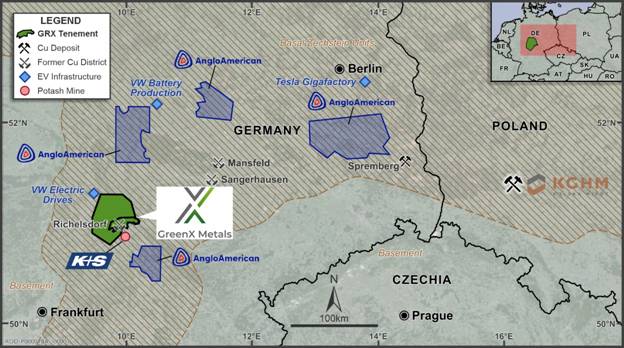
Figure 1: Tannenberg is located in the industrial centre of Europe within the Basal Zechstein trend (brown shading)
Exploration Target Highlights Potential for Large Scale Copper Silver Project
GreenX has previously announced an Exploration Target at Tannenberg (refer to announcement dated 28 May 2026). The estimated range of potential mineralisation in the Exploration Target is: 144 to 279 Mt at 0.9% to 1.4% Cu and 15 to 21 g/t Ag for 1.3 to 3.9 Mt Cu and 69 to 188 Moz Ag.
Cautionary Statement: The Exploration Target has been reported in accordance with the 2012 edition of the JORC Code (JORC Code). The potential quantity and grade of the Exploration Target is conceptual in nature. There has been insufficient exploration to estimate a Mineral Resource for the reported target areas. It is uncertain if further exploration will result in the estimation of a Mineral Resource.
|
Table 1: Exploration Target for Tannenberg |
|||||
|
Prospect |
Tonnes Range |
Cu Grade Range |
Ag Grade Range |
Contained Cu Range |
Contained Ag Range |
|
Zone 1 |
8 to 16 Mt |
0.9 to 1.4% Cu |
15 to 21 g/t Ag |
0.1 to 0.2 Mt Cu |
3.9 to 10.8 Moz Ag |
|
Zone 2 |
40 to 78 Mt |
0.4 to 1.1 Mt Cu |
19.3 to 52.7 Moz Ag |
||
|
Zone 3 |
96 to 186 Mt |
0.9 to 2.6 Mt Cu |
46.3 to 125.6 Moz Ag |
||
|
Total |
144 to 279 Mt |
1.3 to 3.9 Mt Cu |
69.4 to 188.4 Moz Ag |
||
The Exploration Target provides a modern view of the copper potential at Tannenberg. Unlike the 1940 historical estimate, which assessed only the thin Kupferschiefer shale horizon (refer to announcement dated 20 October 2025), the Exploration Target captures mineralisation in the hanging wall above and footwall below the shale. This is consistent with the modern understanding of Kupferschiefer deposits as evidenced at KGHM Polska Miedź S.A's (KGHM) mining operations in Poland.
From Historical Mining District to Exploration Target
Tannenberg has a long-documented history of drilling, mining and estimation work, providing well-defined and historically validated copper-siler mineralisation that underpins the Exploration Target.
The 1940 historical estimate, produced by Mansfeldsche Kupferschieferbergbau AG (Mansfeld AG), is based on a spatially relevant subset of 18 holes from a historical 95-hole drilling database and established 728,000 tonnes of contained copper at an average grade of 2.6% copper (in the narrow Kupferschiefer shale only) between the Wolfsberg and Schnepfenbusch mines in the north and the Ronshausen area in the south. The historical estimate covers mineralisation from a depth of 100 m in the north to 400 m in the southern end area near Ronshausen (refer to announcement dated 20 October 2025).
A later historical estimate from 1984 was produced by St Joe Explorations GmbH (St Joe), based on limited drilling between 1980 and 1984 (refer to announcements dated 2 August 2024 and 28 April 2025). The St Joe historical work estimated 169,000 tonnes of contained copper and 6.5 million ounces of contained silver within the small section of zone 3 (see Figure 2). St Joe assayed wider intersections and found that the mineralisation was up to 3.45 m thick. This is considerably thicker than the narrow Kupferschiefer shale assayed and estimated by Mansfeld AG in 1940. St Joe provided the first modern indication that economic mineralisation extends beyond the Kupferschiefer shale itself.
Cautionary statement: The historical estimates in this announcement are not reported in accordance with the JORC Code. A competent person has not done sufficient work to classify the historical estimates as a mineral resource or ore reserve in accordance with the JORC Code. It is uncertain that following evaluation and/or further exploration work that the historical estimates will be able to be reported as a mineral resource or ore reserve in accordance with the JORC Code.
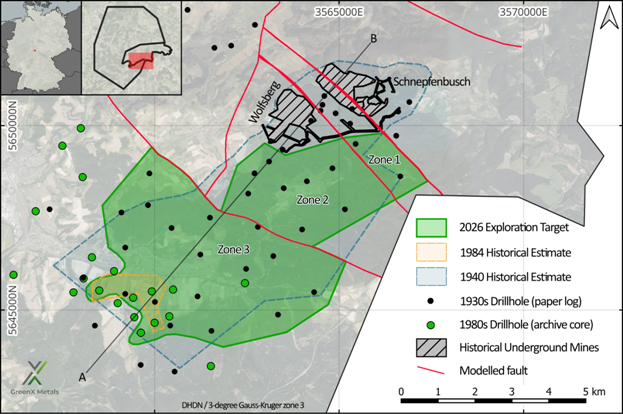
Figure 2: Outline of the Exploration Target and its relationship to previous historical estimates and historical underground mining operations at Tannenberg
Mineralogy Study Confirms Tannenberg Consistent with Polish Kupferschiefer Mines
GreenX has previously completed an early-stage mineralogy and processing study for Tannenberg (refer to announcement dated 17 June 2026). The mineralogy study was completed by SGS Canada Inc. at its Lakefield Ontario facility (SGS Lakefield). It was followed by an independent metallurgical review undertaken by MSA Mining Consulting UK Ltd (MSA-UK) through Principal Associate Metallurgist, Mr Gordon Cunningham. The review has benchmarked Tannenberg against operating and development Kupferschiefer mines in Poland, confirming that copper mineralisation at Tannenberg is consistent with copper-silver deposits in the region and is considered amenable to conventional flotation-based processing methods.
A key outcome of the study is the identification of a distinctly bi-modal grain size distribution of copper sulphides, with both coarse particles (>25 to 30 µm) and very fine disseminated material (<5 to 10 µm) present within the host rocks. This fine-grained component is pervasive, with all analysed sections containing copper mineralisation below 5 µm. The presence of this bi-modal distribution is considered a critical factor influencing comminution requirements, flotation performance and overall metallurgical recovery.
Ongoing Exploration Work Programs at Tannenberg
GreenX continues to advance a coordinated suite of exploration activities at the Project, which test the validity of the Exploration Target identified at Tannenberg and includes:
· Collation and digitisation of historical geological, mine development, and production data (ongoing);
· Seismic surveys to aid future drilling campaigns including collecting petrophysical measurements for seismic forward modelling; and
· Initial drill program (2027).
Copper Market
During the quarter, copper prices reached record highs, with London Metal Exchange copper trading at approximately US$14,875/t in September 2026. Supply conditions remained tight, with Chilean mine production in August 2026 falling approximately 13% year on year to 369,500 t, its lowest monthly level since 2011.
ELEONORE NORTH PROJECT (GREENLAND)
Eleonore North is located in East Greenland, where four licences covering approximately 2,100 km² are prospective for gold, antimony, copper and tungsten (Eleonore North or ELN). The project comprises licence MEL 2023-39, which hosts the Noa Prospect targeting a potentially large-scale bulk tonnage gold/antimony system with the potential to host a RIRGS; MEL 2018-19, which hosts the Margeries Prospects, where high-grade tungsten and antimony mineralisation has been identified as historical estimates; and MEL 2026-124 and MEL-S 2026-120, granted during the quarter, which cover the Forsblad and Alpefjord prospects respectively.
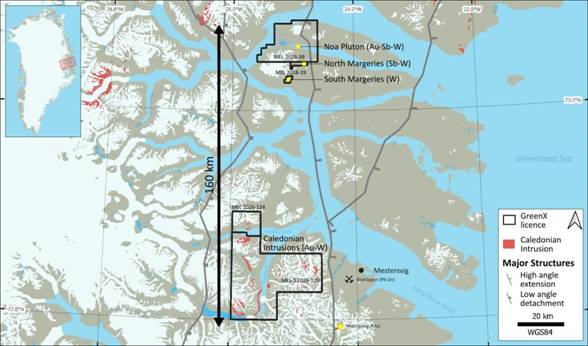
Figure 3: GreenX's Eleonore North Project now comprises a portfolio of four exploration licences in East Greenland.
Two New Licences Expand Gold and Critical Minerals Portfolio
During the quarter, GreenX announced that it had been granted two new exploration licences (MEL 2026-124 and MEL-S 2026-120) at Eleonore North (refer to announcement dated 4 August 2026). The Company has secured exclusive rights to ~1,600 km² of tenure prospective for reduced intrusion-related gold systems (RIRGS). These new licences complement the Company's existing licences located 100 km to the north.
The Company has been exploring Eleonore North for RIRGS since 2024. These new licences build on a growing understanding of this deposit style in this region and secures prospective Caledonian intrusions untested by the RIRGS model.
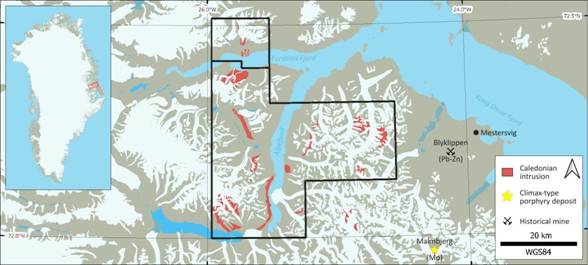
Figure 4: Location map of new Eleonore North licences in East Greenland with prospective Caledonian intrusions.
Historical Gold Results
In 1975, Nordisk Mineselskab A/S (Nordmine) collected gold-mineralised boulders and veins from the area now covered by the new licences (Table 2). Follow-up exploration involved stream sediment sampling throughout the region in 1979 and 1980. Heavy mineral concentrates from the earlier surveys were analysed in 1983. Gold, scheelite, and other indicator elements were detected within the licence areas. In 1983, geologists visited the site and recommended detailed follow-up exploration for gold and scheelite; however, no further exploration was conducted. Nordmine held an exclusive mineral licence covering 100,000 km² in East Greenland until its liquidation in 1992.
Table 2: Selected historical grab sample results sourced from a publicly available Greenland government database.
|
Sample # |
Au (g/t) |
Company |
Longitude |
Latitude |
Year |
|
7512078/5 |
50 |
Nordmine |
-25.79437 |
72.43450 |
1975 |
|
8313013/B |
26 |
Nordmine |
-25.80941 |
72.44610 |
1983 |
|
7505590 |
12.7 |
Nordmine |
-25.81334 |
72.43415 |
1975 |
|
8313011/D |
5.4 |
Nordmine |
-25.80574 |
72.44088 |
1983 |
|
8313012/A |
4.6 |
Nordmine |
-25.80448 |
72.44385 |
1983 |
|
7910508 |
2.0 |
Nordmine |
-25.69453 |
72.44298 |
1979 |
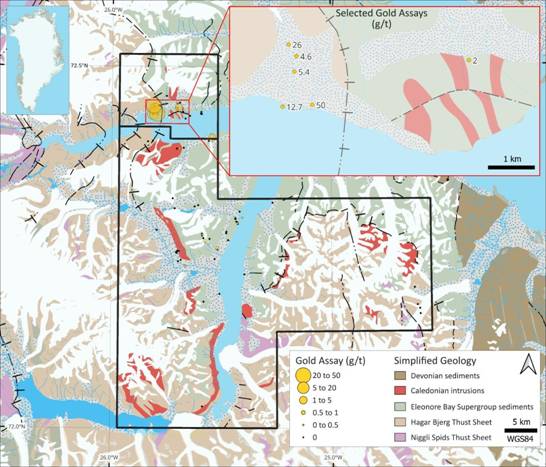
Figure 5: Simplified geological map with historical Nordmine grab sample gold results. The inset map shows the location of selected historical high-grade grab samples from Table 2. All results are available in Appendix 1 of the announcement dated 4 August 2026.
Geology, Gold and Critical Minerals Potential
The geological setting of the area is characterised by gneissic basement rocks and Proterozoic metasediments (Figure 5), separated by a major north-south thrust fault extending for 400 km (Figure 3). Thrusting and folding during the Caledonian orogeny juxtaposed the different rock packages. This major structure likely provided conduits for magma and later mineralised fluids. Caledonian intrusions are today found adjacent to fault zones in Eleonore Bay Supergroup sediments.
RIRGS deposits feature a geochemical zonation that changes with distance from the causative intrusion. Metal enrichments proximal to gold mineralisation typically include tungsten (W) and antimony (Sb). Geochemical signatures distal to gold mineralisation include enrichments in silver (Ag), copper (Cu), lead (Pb), and zinc (Zn). At the regional scale, arsenic (As) is a useful indicator for vectoring towards RIRGS-mineralised intrusions.
Regional stream sediment sampling included panning for heavy mineral concentrates. Analysis of the concentrate included counting grains of the tungsten-bearing mineral, scheelite. Figure 6 below shows the scheelite grain count in panned heavy mineral concentrates. There is a strong association between the Caledonian granites and high scheelite grain counts. The spatial association also applies to Au, Ag, Cu, Pb, Zn, and As in panned heavy mineral concentrates.
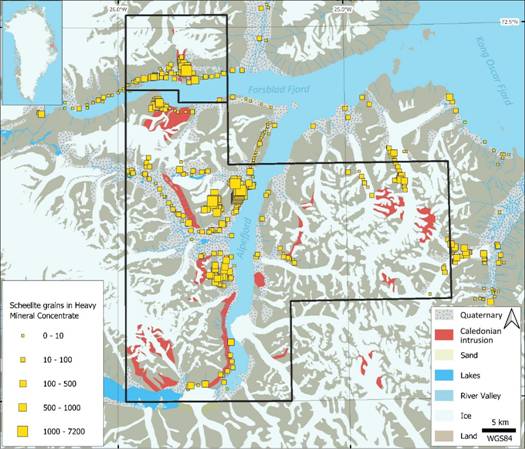
Figure 6: Scheelite grain count in historical panned heavy mineral concentrate samples.
Critical Minerals
Tungsten is designated as a Strategic Raw Material by the EU and a critical raw mineral by the US. Tungsten is one of the foremost defence materials, widely used in high-strength applications and ammunition. It is also suitable for high-temperature applications, such as supersonic and hypersonic vehicles. Tungsten's density makes it ideal for armour-piercing ammunition and counterweights in spacecraft. Commercially, it is mainly used when high strength is required, such as for cutting and construction tools. Global strategic interest in tungsten increased significantly in February 2025, when China announced sweeping export controls targeting tungsten and four other metals used across defence, clean energy and other industries.
About 90% of global tungsten comes from Russia, China and North Korea, with China alone accounting for about 80% of the world's tungsten output. The US has not had domestic tungsten production since 2015.
2026 Fieldwork Completed
During the quarter, GreenX announced that fieldwork had commenced at Eleonore North project in East Greenland (refer to announcement dated 24 July 2026). The exploration program was targeting gold (Au), W, and Sb.
Fieldwork at Eleonore North Project covered multiple objectives. At Noa Pluton, a RIRGS specialist conducted mapping and sampling to evaluate antimony and intrusion-related gold potential, and identify potential drill targets. At both North (Sb-W) and South Margeries (W), the team collected 50 kg to 100 kg bulk samples of mineralised material for scoping study level sighter test work. Recent hyperspectral analysis and prospectivity mapping have also highlighted alteration anomalies along strike and adjacent to both deposits (refer to announcement dated 14 May 2026). These untested hyperspectral anomalies have the potential to be satellite discoveries.
The field team also visited newly generated RIRGS targets in the broader region for reconnaissance style prospecting, as approved by the Greenland Mineral Resource Authority.
Reconnaissance sampling and mapping have tested the RIRGS model over the Caledonian intrusions within the new licences. This fieldwork was run in conjunction with exploration at the existing Eleonore North licences. Samples and bulk material are being sent for analysis. Results from the July 2026 fieldwork are expected in the coming months.
A summary of the 2026 work program at each licence is set out in Table 3.
Table 3: Summary of work at each Eleonore North licence.
|
Licence Code |
Target |
2026 Work Program |
|
MEL-S 2026-120 and MEL 2026-124 |
Caledonian Intrusions |
Reconnaissance sampling and mapping at target intrusions (July 2026). |
|
MEL 2023-39 |
Noa Pluton |
Sampling and mapping at the Noa Pluton Sb-Au-W prospect (July 2026). |
|
MEL 2018-19 |
North and South Margeries |
Bulk sampling Sb and W material from the Margeries deposits for sighter metallurgical test work (July 2026). Re-processing airborne hyperspectral survey data (May 2026). Core re-logging and re-sampling (May 2026). |
Next Steps at Eleonore North
· North and South Margeries: Rock samples collected during the program were sent for multi-element analysis while bulk material is undergoing metallurgical sighter test work. This test work is designed to provide scoping study level insights into the metallurgy and processing characteristics. Extensional and infill drilling could be warranted if the sighter test work is positive.
· Noa Pluton: Results from Noa Pluton will be evaluated by our RIRGS specialist to form the basis for follow-up exploration programs, including the potential to identify drill targets for future field seasons.
· Caledonian Intrusions: Data synthesis and exploration targeting can progress after results are received. Results from Noa Pluton and the Caledonian Intrusion targets will be evaluated by a RIRGS specialist to form a view on follow-up exploration programs.
SINGAPORE COURT DISMISSED POLAND'S SET ASIDE APPLICATION
As previously announced, the Singapore International Commercial Court of the Republic of Singapore (Singapore Court) has dismissed, in its entirety, Poland's application to set aside the Energy Charter Treaty (ECT) award, thereby upholding GreenX's previously announced right to compensation under the ECT.
In October 2024, GreenX was awarded approximately £252 million (A$477 million / PLN 1.3 billion) in compensation and interest in the Australia-Poland Bilateral Investment Treaty (BIT) award after a Tribunal had unanimously held that Poland breached its obligations under the BIT and ECT.
At the time of the award, approximately £183 million (A$347 million / PLN 934 million) was awarded pursuant to the ECT (with payments under one award offset against the other).
In addition, approximately £25 million (A$48 million / PLN 129 million) per annum is continuing to accrue and will continue to compound annually until full and final payment is made by Poland.
In 2025, Poland lodged a request to set-aside the ECT award in the Singapore Court (having also lodged a request to set-aside the BIT award in the courts of England and Wales in late 2024). The hearing for the ECT set-aside was held in the Singapore Court in July 2025.
Subsequently, the Singapore Court issued a judgment dismissing, in its entirety, Poland's application to set aside the ECT award.
A redacted version of the Singapore Court's judgment has been released and brought to the attention of the English courts in connection with the BIT set-aside proceedings, which were heard this month. Under the English Arbitration Act 1996, the threshold to succeed on a set aside application in the courts of England and Wales is exceptionally high, and courts typically reject these challenges unless there has been a serious procedural irregularity.
In February 2026, GreenX submitted a request to the Singapore Court to order Poland to reimburse it for its costs claimed in defending its rights in the set-aside proceedings, which amounted to A$1.6 million.
Following this request, the Singapore Court issued an order requiring Poland to pay the A$1.6 million, which has been paid in full.
Poland subsequently appealed to the Court of Appeal of the Republic of Singapore (Court of Appeal) to challenge the dismissal of the first ECT set-aside motion. The appeal has now been heard by the Court of Appeal, with its decision currently pending. The Court of Appeal, represents Poland's final level of appeal within the Singapore courts.
The threshold to succeed on a set-aside motion in either the Singapore or English courts is very high, with the courts rejecting set-aside applications in the vast majority of cases.
Following the Singapore Court's initial dismissal of Poland's ECT set-aside application, the Company has commenced preparations for enforcement activities in relation to the award.
The Company will continue to defend its awards and update the market in line with its continuous disclosure obligations.
-ENDS-
Forward Looking Statements
This release may include forward-looking statements, which may be identified by words such as "expects", "anticipates", "believes", "projects", "plans", and similar expressions. These forward-looking statements are based on GreenX's expectations and beliefs concerning future events. Forward looking statements are necessarily subject to risks, uncertainties and other factors, many of which are outside the control of GreenX, which could cause actual results to differ materially from such statements. There can be no assurance that forward-looking statements will prove to be correct. GreenX makes no undertaking to subsequently update or revise the forward-looking statements made in this release, to reflect the circumstances or events after the date of that release.
Competent Persons Statement
The information in this report that relates to exploration results were extracted from the ASX announcements dated 15 July 2024, 2 August 2024, 27 November 2024, 28 April 2025, 9 September 2025, 20 November 2025, 14 May 2026, 17 June 2026, 24 July 2026 and 4 August 2026 which are available to view at www.greenxmetals.com.
GreenX confirms that (a) it is not aware of any new information or data that materially affects the information included in the original announcements; (b) all material assumptions and technical parameters underpinning the content in the relevant announcements continue to apply and have not materially changed; and (c) the form and context in which the Competent Person's findings are presented have not been materially modified from the original announcements.
The information in this announcement that relates to the Exploration Target is based on information compiled by Mr Rui Goncalves, a Competent Person who is registered with the South African Council of Natural Scientific Professions, a Recognised Professional Organisation' included in a list promulgated by ASX from time to time. Mr Goncalves is a full-time employee of MSA Mining Consulting UK Ltd, an independent consulting company. Mr Goncalves has sufficient experience that is relevant to the style of mineralisation and type of deposit under consideration and to the activity being undertaken, to qualify as a Competent Person as defined in the 2012 Edition of the 'Australasian Code for Reporting of Exploration Results, Mineral Resources and Ore Reserves'. Mr Goncalves consents to the inclusion in this announcement of the matters based on his information in the form and context in which it appears.
The information in this announcement that relates to historical estimates for Tannenberg were extracted from the ASX announcement dated 20 October 2025 entitled 'GreenX Uncovers Historical Estimate at Tannenberg Copper Project' (Original Announcement).
GreenX confirms that (a) it is not in possession of any new information or data relating to the historical estimates that materially impacts on the reliability of the estimates or GreenX's ability to verify the historical estimates as mineral resources or ore reserves in accordance with the JORC Code; (b) that the supporting information provided in the Original Announcement referred to in ASX Listing Rule 5.12 continues to apply and has not materially changed; and (c) the form and context in which the Competent Person's findings are presented have not been materially modified from the Original Announcement.
The information contained within this announcement is deemed by the Company to constitute inside information as stipulated under the Market Abuse Regulations (EU) No. 596/2014 as it forms part of UK domestic law by virtue of the European Union (Withdrawal) Act 2018 ('MAR'). Upon the publication of this announcement via Regulatory Information Service ('RIS'), this inside information is now considered to be in the public domain.
APPENDIX 1: TENEMENT INFORMATION
As at 30 September 2026, the Company has an interest in the following tenements:
|
Location |
Tenement |
Percentage |
Status |
Tenement Type |
|
Germany |
Tannenberg |
90 |
Granted |
Exploration Licence |
|
Germany |
Tannenberg 2 |
90 |
Granted |
Exploration Licence |
|
Greenland |
Eleonore North Project (Licence No's MEL 2018-19, MEL 2023-39, MEL 2026-124 and MEL-S 2026-120) |
100 |
Granted |
Exploration Licence |
|
Greenland |
Arctic Rift Copper project (ARC) (Licence No. 2025-168) |
n/a1 |
Withdrawn1 |
Exploration Licence |
Note:
1 Given the prospectivity and focus on Tannenberg in Germany and at Eleonore North, and following a review of its portfolio of projects, the most efficient and effective use of the Company's resources, GreenX has agreed to wind up the ARC joint venture. The Company is currently in the process of relinquishing the ARC exploration licence held in Greenland and winding up the joint venture entity which is expected to be completed in the second half of 2026.
Appendix 2: Related Party Payments
During the quarter ended 30 September 2026, the Company made payments of A$222,000 to related parties and their associates. These payments relate to existing remuneration arrangements (director fees, consulting fees and superannuation of A$140,000 and for the provision of administrative, secretarial and corporate services of A$82,000).
Appendix 3: Exploration and Mining Expenditure
During the quarter ended 30 September 2026, the Company made the following payments in relation to exploration activities:
|
Activity |
A$000 |
|
Germany (Tannenberg) |
|
|
Ongoing exploration work programs (assays, reprocessing historical data, exploration target, etc) |
125 |
|
Personnel costs (geology and technical team) |
224 |
|
Sub-total |
349 |
|
|
|
|
Greenland (Eleonore North) |
|
|
Personnel costs (geology and technical team) |
274 |
|
Exploration work programs (data review, geoimagery, etc) |
30 |
|
Sub-total |
304 |
|
Total as reported in the Appendix 5B (items 1.2(a) and 2.1(d)) |
653 |
There were no mining or production activities and expenses incurred during the quarter ended 30 September 2026.
Appendix 4: Sources
|
Project |
Company |
Source Data |
Link |
|
|
Chilean copper mine production, August 2026 |
Bloomberg Línea (citing Instituto Nacional de Estadísticas, Chile) |
"Copper production in Chile plunges 13%, its lowest level in more than 15 years" (English translation of Spanish-language article), 30 September 2026 |
||
APPENDIX 5: TANNENBERG EXPLORATION TARGET
Archive Core Logging and Sampling
GreenX logged, sampled, and assayed a total of 4,389 m of archived core (Archive) and took 2,368 new samples. This program was initiated after the discovery that drill core had been retained in the archives of the Hessisches Landesamt für Naturschutz, Umwelt und Geologie (HLNUG) for over 40 years since drilling. This new logging and sampling has been conducted in accordance with industry standard practices and has facilitated the estimation of the Exploration Target ranges. In addition to the validation of the historical copper and silver grades around the historical mining areas (see announcement date 20 November 2025), the data has demonstrated that the copper and silver mineralisation persists many kilometres away from the historical copper mines (Wolfsberg, Schnepfenbusch, and Reichenberg).
The Archive work was completed by Palsatech in a specialist logging facility in Sweden. MSA Mining Consulting UK Ltd's (MSA-UK) independent competent person visited the facility while Archive core was being processed. All intercepts with significant Cu-Ag mineralisation were drilled by St Joe's during their 1980s exploration drilling.
The 1930s National Socialist drillhole database was compiled by GreenX geologists, transcribed from hard copy, historical records. An independent audit and verification of the data against these records was not undertaken by MSA-UK. Given that the intention is to declare an Exploration Target, this is not considered a material risk by MSA-UK.
Data validation was undertaken during the import routine in the form of correcting issues such as from/to errors and preparing the data in a format that can readily be imported into three-dimensional modelling software.
Geological Modelling
A geological model was constructed in Leapfrog Geo. Although a number of mapped faults cross the area, only five, relevant fault structures were considered in the model. Four stratigraphic units, namely the Basement, Rotliegend, Zechstein and Buntsandstein were modelled. Due its narrowness and the lateral scale of the model, which spans several kilometres, the Kupferschiefer layer was modelled only as the contact between the Rotliegend and Zechstein. Displacement by faulting is data driven, where the relative position of the stratigraphic units on either side of the fault determines the vertical displacement.
A conceptual mineralisation model was constructed from the drillhole data using a threshold value of 0.30 % Cu. This value was based on the log-probability plot for the combined dataset, which shows a break in the grade population around this threshold. This is a reasonable value, as it incorporates mineralisation in the footwall Rotliegend, the Kupferschiefer and the hanging wall Zechstein.
In addition to the grade threshold, a minimum thickness of 1.5 m was applied during the modelling process, based on regulation and practise at copper mines in Poland Where necessary, low-grade samples falling below the threshold were incorporated into the mineralised zone to achieve the minimum thickness, provided the full composite grade satisfied the threshold value. Due to the sampling bias in the National Socialist dataset, only data generated from 1980s era drilling was used to constrain the thickness of the mineralisation model.
However, the National Socialist data was used to infer lateral continuity of the mineralisation. In order to not overstate tonnages, the mineralisation was truncated against the modelled faults, extrapolated no more than 500 metres beyond the data and limited within the Tannenberg license boundary. Furthermore, mined out areas where discounted from the mineralisation model.
Three areas were considered, a larger area to the southwest, Zone 3, where the model is informed by a combination of Archive and National Socialist data and two smaller areas across fault boundaries towards the northeast, Zone 1 and Zone 2..
Zone 3 has an areal extent of approximately 6 km by 3.5 km. The mineralisation thins out towards the southwest and northwest where drillholes tend to have low-grade copper intercepts that do not meet the minimum thickness criteria, therefore being excluded from the model. Towards the northeast, the mineralisation terminates against a northwest-southeast running fault. Zone 2 is located adjacent to Zone 3 on the northeast side of the bounding fault, with an extent of 3.1 km in the northwest to southeast direction and 2.8 km in the northeast direction. Zone 1 is narrow, bound by two parallel faults and has an areal extent of 1.8 km by 900 m. Both Zones 1 and 2 have been restricted in extent from known mined out areas to the north.
Exploration Target: Grade and Thickness Estimation
A geological model was constructed in Leapfrog Geo. Although a number of mapped faults cross the area, only five, relevant fault structures were considered in the model. Four stratigraphic units, namely the Basement, Rotliegend, Zechstein and Buntsandstein were modelled. Due its narrowness and the lateral scale of the model, which spans several kilometres, the Kupferschiefer layer was modelled only as the contact between the Rotliegend and Zechstein. Displacement by faulting is data driven, where the relative position of the stratigraphic units on either side of the fault determines the vertical displacement.
The lateral extent of the mineralised zones is restricted by structural features and the license boundary, with little room for extrapolation. Therefore, tonnage ranges are given by assuming a variable thickness of the mineralised zones, which is supported by the dataset. Only the Archive data was used to derive grade and thickness ranges as it provides a complete vertical profile through the mineralised zone. Samples captured within the Zone 3 mineralised area were selected and composited to full thickness, resulting in ten composite samples. Full thickness composites were used to derive both grade and thickness ranges for the Exploration Target because this approach minimises the variability of the smaller sample intervals, thus reducing sampling bias and avoiding artificially inflated grades when estimating grade ranges. An additional drillhole, Ro 45, located to the north outside of the area of interest was also used to supplement the data. This hole was included as it is the only Archive drillhole outside of the modelled area that meets the minimum criteria and was incorporated to support the statistical analysis given the limited number of available data points. The remaining Archive holes were not considered as they fall outside the modelled extents of the mineralisation.
The list of drillholes, copper and silver grades and accumulated grades are shown in Table 4 below.
|
Table 4: List of full thickness composites for grade and thickness estimation |
|||||||
|
Hole ID |
From |
To |
Thickness (m) |
Cu (%) |
Ag (g/t) |
Accumulated Copper Grade Cu % per metre |
Accumulated Silver Grade Ag g/t per metre |
|
Ro 15 |
285.6 |
289.3 |
3.7 |
1.19 |
16.6 |
4.41 |
61.5 |
|
Ro 17 |
481.25 |
483 |
1.75 |
0.89 |
18.2 |
1.56 |
31.9 |
|
Ro 18 |
209 |
210.76 |
1.76 |
3.00 |
28.7 |
5.28 |
50.6 |
|
Ro 19 |
339 |
342 |
3 |
1.38 |
16.2 |
4.13 |
48.5 |
|
Ro 20 |
377 |
378.68 |
1.68 |
1.33 |
14.6 |
2.24 |
24.5 |
|
Ro 22 |
435.76 |
439.4 |
3.64 |
0.94 |
16.0 |
3.43 |
58.1 |
|
Ro 23 |
366 |
367.5 |
1.5 |
2.69 |
55.3 |
4.04 |
83.0 |
|
Ro 25 |
533.38 |
534.89 |
1.51 |
1.32 |
27.9 |
2.00 |
42.2 |
|
Ro 35 |
379.15 |
381 |
1.85 |
0.35 |
10.5 |
0.65 |
19.5 |
|
Ro 38 |
536.25 |
539.5 |
3.25 |
0.56 |
11.4 |
1.83 |
37.2 |
|
Ro 45 |
268.34 |
270.37 |
2.03 |
1.62 |
20.5 |
3.29 |
41.7 |
|
Source: MSA-UK |
|||||||
Statistics were derived for the length-weighted copper and silver grades and composite sample lengths as shown in Table 5.
|
Table 5: Summary statistics of mineralised drillhole composites |
|||||||
|
Variable |
Minimum |
Maximum |
Mean |
Median |
Lower Quartile |
Upper Quartile |
Coefficient of Variation |
|
Thickness (m) |
1.50 |
3.70 |
2.33 |
3.00 |
1.68 |
3.25 |
0.37 |
|
Cu grade (%) |
0.35 |
3.00 |
1.28 |
1.19 |
0.89 |
1.38 |
0.63 |
|
Ag grade (g/t) |
10.5 |
55.3 |
19.4 |
16.2 |
14.6 |
20.5 |
0.65 |
|
Source: MSA-UK |
|||||||
An attempt was made to derive grade and thickness ranges using a two-sided confidence interval method on the dataset however this statistical approach resulted in very narrow ranges which are not representative of the inherent variability of the data. Therefore, the interquartile range (IQR) was used instead to define the lower and upper grade and thickness ranges. In this case, the IQR is considered appropriate for this small dataset, as it provides a measure of dispersion around the median, thus reducing the influence of grade and thickness outliers. The resultant ranges are therefore a more realistic representation of the dataset (Table 6).
|
Table 6: Exploration Target lower and upper ranges for grade and thickness |
||
|
Variable |
Lower Range |
Upper Range |
|
Thickness (m) |
1.7 |
3.3 |
|
Cu (%) |
0.9 |
1.4 |
|
Ag (g/t) |
15 |
21 |
|
Source: MSA-UK Note: Grade and thickness ranges rounded to one decimal place to reflect this is an estimate |
||
Density data is not currently available for the project, therefore average densities were sourced from available literature (Taylor, R.D and Anderson, E.D., 2010). An assumption was made for a three metre thick mineable width with the Kupferschiefer shale representing 0.40 m of the total thickness, while the Zechstein and Rotliegend have assumed thicknesses of 1.30 m. Average densities were assigned as shown in Table 7.
|
Table 7: Assumed average densities per stratigraphic unit |
|||
|
Stratigraphic Unit |
Rock Type |
Thickness (m) |
Density (t/m3) |
|
Zechstein |
Limestone |
1.30 |
2.75 |
|
Kupferschiefer |
Shale |
0.40 |
2.40 |
|
Rotliegend |
Sandstone |
1.30 |
2.55 |
|
Source: Taylor, R.D and Anderson, E.D., 2010 |
|||
A weighted, average relative density for the three-metre-thick mineralised zone is calculated as 2.62 t/m3.
Exploration Target Estimation
The base case for the mineralisation is based on the areal extent of copper mineralisation, above a threshold of 0.30 % Cu, that meets a minimum thickness criteria of 1.50 m. Surfaces created in Leapfrog Geo were used to model lateral continuity of the mineralised zones and derive areas for three zones. Thickness ranges were derived from the Archive data and using an assumed average density of 2.62 t/m3, lower and upper ranges of tonnages were calculated as shown in Table 8.
|
Table 8: Tonnage ranges for each zone |
||||||
|
Zone |
Area (m2) |
Thickness (m) |
Density (t/m3) |
Tonnage (Mt) |
||
|
Lower |
Upper |
Lower |
Upper |
|||
|
Zone 1 |
1,800,000 |
1.7 |
3.3 |
2.62 |
8 |
16 |
|
Zone 2 |
9,000,000 |
40 |
78 |
|||
|
Zone 3 |
21,500,000 |
96 |
186 |
|||
|
Total |
43,000,000 |
144 |
279 |
|||
|
Source: MSA-UK. Note: m2 = square metres; m = metres; t/m3 = tonnes per cubed metre; Mt = Million Tonnes Areas are rounded to the nearest 100,000 m2 to reflect this is an estimate Tonnages are rounded to the nearest 1,000,000 tonne to reflect this is an estimate Grade and thickness ranges rounded to one decimal place to reflect this is an estimate |
||||||
Full thickness composite grade data was used to derive grade ranges for copper, with the estimated contained copper ranges shown in Table 9.
|
Table 9: Copper grade and contained metal ranges for each Zone |
||||||
|
Zone |
Tonnage (Mt) |
Cu Grade (%) |
Contained Cu (Mt) |
|||
|
Lower |
Upper |
Lower |
Upper |
Lower |
Upper |
|
|
Zone 1 |
8 |
16 |
0.9 |
1.4 |
0.1 |
0.2 |
|
Zone 2 |
40 |
78 |
0.4 |
1.1 |
||
|
Zone 3 |
96 |
186 |
0.9 |
2.6 |
||
|
Total |
144 |
279 |
1.3 |
3.9 |
||
|
Source: MSA-UK Note: Mt = Million Tonnes. Tonnages are rounded to the nearest 1,000,000 tonne to reflect this is an estimate Grade and thickness ranges rounded to one decimal place to reflect this is an estimate |
||||||
Similarly, silver grade ranges were used to derive contained silver lower and upper scenarios for each zone as shown in Table 10.
|
Table 10: Silver grade and contained metal ranges for each Zone |
||||||
|
Zone |
Tonnage (Mt) |
Ag Grade (g/t) |
Contained Ag (Moz) |
|||
|
Lower |
Upper |
Lower |
Upper |
Lower |
Upper |
|
|
Zone 1 |
8 |
16 |
15 |
21 |
3.9 |
10.8 |
|
Zone 2 |
40 |
78 |
19.3 |
52.7 |
||
|
Zone 3 |
96 |
186 |
46.3 |
125.6 |
||
|
Total |
144 |
279 |
69.4 |
188.4 |
||
|
Source: MSA-UK Note: Mt = Million Tonnes; Moz - million troy ounces g/t - gram per metric tonne; Tonnages are rounded to the nearest 1,000,000 tonne to reflect this is an estimate Ounces are rounded to the nearest 100,000 troy ounce to reflect this is an estimate Grade and thickness ranges rounded to one decimal place to reflect this is an estimate 1 troy ounce (oz) = 31.1034768 grams |
||||||
The Exploration Target for the combined Tannenberg mineralisation is shown in Table 11. As per the JORC Code, it must be stated that the potential quantity and grade of the Exploration Targets are conceptual in nature, that there has been insufficient exploration to estimate Mineral Resources and that it is uncertain if further exploration will result in the estimation of Mineral Resources.
|
Table 11: Tannenberg Combined Exploration Target |
|||||||||
|
Tonnages (Mt) |
Cu (%) |
Ag (g/t) |
Contained Cu (Mt) |
Contained Ag (Moz) |
|||||
|
Lower |
Upper |
Lower |
Upper |
Lower |
Upper |
Lower |
Upper |
Lower |
Upper |
|
144 |
279 |
0.9 |
1.4 |
15 |
21 |
1.3 |
3.9 |
69.4 |
188.4 |
|
Source: MSA-UK. Note: Mt = Million Tonnes; Moz - million troy ounces; g/t - gram per metric tonne; Tonnages are rounded to the nearest 1,000,000 tonne to reflect this is an estimate Contained copper and silver ounces are rounded to the nearest 100,000 troy ounce to reflect this is an estimate Grade and thickness ranges rounded to one decimal place to reflect this is an estimate 1 troy ounce (oz) = 31.1034768 grams |
|||||||||
Appendix 5B
Mining exploration entity or oil and gas exploration entity
quarterly cash flow report
Name of entity |
||
|
GreenX Metals Limited |
||
ABN |
|
Quarter ended ("current quarter") |
|
23 008 677 852 |
|
30 September 2026 |
Consolidated statement of cash flows |
Current quarter |
Year to date |
|
|
1. |
Cash flows from operating activities |
- |
- |
|
1.1 |
Receipts from customers |
||
|
1.2 |
Payments for |
(653) |
(653) |
|
|
(a) exploration & evaluation |
||
|
|
(b) development |
- |
- |
|
|
(c) production |
- |
- |
|
|
(d) staff costs |
(445) |
(445) |
|
|
(e) administration and corporate costs |
(293) |
(293) |
|
1.3 |
Dividends received (see note 3) |
- |
- |
|
1.4 |
Interest received |
100 |
100 |
|
1.5 |
Interest and other costs of finance paid |
- |
- |
|
1.6 |
Income taxes paid |
- |
- |
|
1.7 |
Government grants and tax incentives |
- |
- |
|
1.8 |
Other (provide details if material) (a) Business Development (b) Recoupment of legal costs (c) Arbitration and legal related expenses |
(220) - (2,147) |
(220) - (2,147) |
|
1.9 |
Net cash from / (used in) operating activities |
(3,658) |
(3,658) |
|
|
|||
|
2. |
Cash flows from investing activities |
- |
- |
|
2.1 |
Payments to acquire or for: |
||
|
|
(a) Entities |
||
|
|
(b) Tenements |
- |
- |
|
|
(c) property, plant and equipment |
- |
- |
|
|
(d) exploration & evaluation |
- |
- |
|
|
(e) investments |
- |
- |
|
|
(f) other non-current assets |
- |
- |
|
2.2 |
Proceeds from the disposal of: |
- |
- |
|
|
(a) entities |
||
|
|
(b) tenements |
- |
- |
|
|
(c) property, plant and equipment |
- |
- |
|
|
(d) investments |
- |
- |
|
|
(e) other non-current assets |
- |
- |
|
2.3 |
Cash flows from loans to other entities |
- |
- |
|
2.4 |
Dividends received (see note 3) |
- |
- |
|
2.5 |
Other (provide details if material) |
- |
- |
|
2.6 |
Net cash from / (used in) investing activities |
- |
- |
|
|
|||
|
3. |
Cash flows from financing activities |
- |
- |
|
3.1 |
Proceeds from issues of equity securities (excluding convertible debt securities) |
||
|
3.2 |
Proceeds from issue of convertible debt securities |
- |
- |
|
3.3 |
Proceeds from exercise of options |
- |
- |
|
3.4 |
Transaction costs related to issues of equity securities or convertible debt securities |
(16) |
(16) |
|
3.5 |
Proceeds from borrowings |
- |
- |
|
3.6 |
Repayment of borrowings |
- |
- |
|
3.7 |
Transaction costs related to loans and borrowings |
- |
- |
|
3.8 |
Dividends paid |
- |
- |
|
3.9 |
Other (provide details if material) |
- |
- |
|
3.10 |
Net cash from / (used in) financing activities |
(16) |
(16) |
|
|
|||
|
4. |
Net increase / (decrease) in cash and cash equivalents for the period |
|
|
|
4.1 |
Cash and cash equivalents at beginning of period |
13,382 |
13,382 |
|
4.2 |
Net cash from / (used in) operating activities (item 1.9 above) |
(3,658) |
(3,658) |
|
4.3 |
Net cash from / (used in) investing activities (item 2.6 above) |
- |
- |
|
4.4 |
Net cash from / (used in) financing activities (item 3.10 above) |
(16) |
(16) |
|
4.5 |
Effect of movement in exchange rates on cash held |
(1) |
(1) |
|
4.6 |
Cash and cash equivalents at end of period |
9,707 |
9,707 |
|
5. |
Reconciliation of cash and cash equivalents
|
Current quarter |
Previous quarter |
|
5.1 |
Bank balances |
2,707 |
7,382 |
|
5.2 |
Call deposits |
7,000 |
6,000 |
|
5.3 |
Bank overdrafts |
- |
- |
|
5.4 |
Other (provide details) |
- |
- |
|
5.5 |
Cash and cash equivalents at end of quarter (should equal item 4.6 above) |
9,707 |
13,382 |
|
6. |
Payments to related parties of the entity and their associates |
Current quarter |
|
6.1 |
Aggregate amount of payments to related parties and their associates included in item 1 |
(222) |
|
6.2 |
Aggregate amount of payments to related parties and their associates included in item 2 |
- |
|
Note: if any amounts are shown in items 6.1 or 6.2, your quarterly activity report must include a description of, and an explanation for, such payments. |
||
|
7. |
Financing facilities
|
Total facility amount at quarter end |
|
|
7.1 |
Loan facilities |
17,716* |
16,183 |
|
7.2 |
Credit standby arrangements |
- |
- |
|
7.3 |
Other (please specify) |
- |
- |
|
7.4 |
Total financing facilities |
17,716* |
16,183 |
|
|
|
|
|
|
7.5 |
Unused financing facilities available at quarter end |
1,533 |
|
|
7.6 |
Include in the box below a description of each facility above, including the lender, interest rate, maturity date and whether it is secured or unsecured. If any additional financing facilities have been entered into or are proposed to be entered into after quarter end, include a note providing details of those facilities as well. |
||
|
On 30 June 2020, the Company executed a Litigation Funding Agreement (LFA) for US$12.3 million (*now worth A$17.7 million with the movement of the A$ compared to the $US) with LCM Funding UK Limited a subsidiary of Litigation Capital Management Limited (LCM), to pursue the damages Claim in relation to the investment dispute between GreenX and Poland). To date, GreenX has drawn down US$11.2 million (A$16.2 million) (Outstanding Funding). In accordance with the terms of the LFA, once the compensation is received, LCM is entitled to be paid the Outstanding Funding, a multiple of five times the Outstanding Funding (based on the period since entering into the LFA) and from 1 January 2025, interest on the Outstanding Funding at a rate of 30% per annum, compounding monthly. |
|||
|
8. |
Estimated cash available for future operating activities |
$A'000 |
|
8.1 |
Net cash from / (used in) operating activities (item 1.9) |
(3,658) |
|
8.2 |
(Payments for exploration & evaluation classified as investing activities) (item 2.1(d)) |
- |
|
8.3 |
Total relevant outgoings (item 8.1 + item 8.2) |
(3,658) |
|
8.4 |
Cash and cash equivalents at quarter end (item 4.6) |
9,707 |
|
8.5 |
Unused finance facilities available at quarter end (item 7.5) |
1,533 |
|
8.6 |
Total available funding (item 8.4 + item 8.5) |
11,240 |
|
|
|
|
|
8.7 |
Estimated quarters of funding available (item 8.6 divided by item 8.3) |
3
|
|
Note: if the entity has reported positive relevant outgoings (ie a net cash inflow) in item 8.3, answer item 8.7 as "N/A". Otherwise, a figure for the estimated quarters of funding available must be included in item 8.7. |
||
|
8.8 |
If item 8.7 is less than 2 quarters, please provide answers to the following questions: |
|
|
|
8.8.1 Does the entity expect that it will continue to have the current level of net operating cash flows for the time being and, if not, why not? |
|
|
|
Answer: Not applicable |
|
|
|
8.8.2 Has the entity taken any steps, or does it propose to take any steps, to raise further cash to fund its operations and, if so, what are those steps and how likely does it believe that they will be successful? |
|
|
|
Answer: Not applicable |
|
|
|
8.8.3 Does the entity expect to be able to continue its operations and to meet its business objectives and, if so, on what basis? |
|
|
|
Answer: Not applicable |
|
|
|
Note: where item 8.7 is less than 2 quarters, all of questions 8.8.1, 8.8.2 and 8.8.3 above must be answered. |
|
Compliance statement
1 This statement has been prepared in accordance with accounting standards and policies which comply with Listing Rule 19.11A.
2 This statement gives a true and fair view of the matters disclosed.
Date: 30 October 2026
Authorised by: Company Secretary
(Name of body or officer authorising release - see note 4)
Notes
1. This quarterly cash flow report and the accompanying activity report provide a basis for informing the market about the entity's activities for the past quarter, how they have been financed and the effect this has had on its cash position. An entity that wishes to disclose additional information over and above the minimum required under the Listing Rules is encouraged to do so.
2. If this quarterly cash flow report has been prepared in accordance with Australian Accounting Standards, the definitions in, and provisions of, AASB 6: Exploration for and Evaluation of Mineral Resources and AASB 107: Statement of Cash Flows apply to this report. If this quarterly cash flow report has been prepared in accordance with other accounting standards agreed by ASX pursuant to Listing Rule 19.11A, the corresponding equivalent standards apply to this report.
3. Dividends received may be classified either as cash flows from operating activities or cash flows from investing activities, depending on the accounting policy of the entity.
4. If this report has been authorised for release to the market by your board of directors, you can insert here: "By the board". If it has been authorised for release to the market by a committee of your board of directors, you can insert here: "By the [name of board committee - eg Audit and Risk Committee]". If it has been authorised for release to the market by a disclosure committee, you can insert here: "By the Disclosure Committee".
5. If this report has been authorised for release to the market by your board of directors and you wish to hold yourself out as complying with recommendation 4.2 of the ASX Corporate Governance Council's Corporate Governance Principles and Recommendations, the board should have received a declaration from its CEO and CFO that, in their opinion, the financial records of the entity have been properly maintained, that this report complies with the appropriate accounting standards and gives a true and fair view of the cash flows of the entity, and that their opinion has been formed on the basis of a sound system of risk management and internal control which is operating effectively.
RNS may use your IP address to confirm compliance with the terms and conditions, to analyse how you engage with the information contained in this communication, and to share such analysis on an anonymised basis with others as part of our commercial services. For further information about how RNS and the London Stock Exchange use the personal data you provide us, please see our Privacy Policy.

Latest directors dealings
- 5 minutes ago Albion Technology & General VCT
- 2 hours ago Kazera Global
- 2 hours ago The Schiehallion Fund Limited NPV
- 2 hours ago Redcentric
- 2 hours ago Primary Health Properties