
Quarterly Activities Report June 2026
Summary by AI BETAClose X


NEWS RELEASE 31 JULY 2026
Quarterly Activities Report June 2026
GreenX Metals Limited (ASX:GRX, LSE:GRX, GPW:GRX, Germany-FSE:A3C9JR) (GreenX or the Company) is pleased to present its Quarterly Activities Report for the period ending and subsequent to 30 June 2026.
SUMMARY
· TANNENBERG COPPER PROJECT (GERMANY)
o EXPLORATION TARGET:
o Exploration Target announced demonstrates potential for a globally significant copper endowment at Tannenberg.
o Exploration Target captures hanging wall and footwall mineralisation above and below the Kupferschiefer shale: a modern view of the deposit that the 1940 historical estimate did not contemplate.
o Validated by Kupferschiefer mining in Poland, where up to 95% of mineable copper at KGHM Polska Miedź S.A's operations is hosted in the same footwall sandstone and hanging wall limestone units that host the Tannenberg Exploration Target.
o Built on validated historical foundations: the Exploration Target builds on the 1940 National Socialist historical estimate area; the 1984 St Joe historical estimate; validation via resampling and logging of 1980's core by GreenX and digitised archive material collected since August 2024.
o An inflection point for Tannenberg: with the Exploration Target estimated, GreenX now transitions from archive synthesis to active exploration, including Scoping Study-level metallurgical test work, a seismic survey and commencement of an initial drill program.
o Work completed by Palsatech in a specialist logging facility in Sweden with MSA Mining Consulting UK Ltd's independent competent person compiling the Exploration Target.
o MINERALOGY AND PROCESSING STUDY:
o Subsequent to the Exploration Target, GreenX completed an early-stage mineralogy and processing study for Tannenberg.
o Mineralogy study confirms Tannenberg mineralisation is consistent with producing Polish Kupferschiefer mines
o Independent metallurgical review by MSA Mining Consulting UK confirms Tannenberg confirms potential suitability for a conventional flotation-based processing route, as used at KGHM's (WSE:KGH) long-running operations and planned for Lumina Metals' (TSE:LMCU) Nowa Sól project.
o Established Kupferschiefer flowsheet provides a baseline processing route for Tannenberg. KGHM's operations process 30 Mtpa at 1.6% Cu and 45 g/t Ag, achieving 89% copper and 86% silver aggregate recovery from a blended feed of Kupferschiefer shale, sandstone and carbonate-hosted mineralisation using crushing, two-stage grinding, rougher flotation, fine regrinding and multi-stage cleaning.
o Modern processing technologies offer potential to enhance recoveries. Advances, including high-pressure grinding rolls, fine-particle flotation systems and advanced reagent schemes, will be investigated, with potential to improve liberation and recovery of fine-grained copper sulphides relative to legacy flowsheets developed decades ago for KGHM.
o The mineralogy study, completed by SGS Lakefield on ten drill core samples, shows that the copper is predominantly hosted in chalcocite with additional bornite, chalcopyrite and covellite, typical of Kupferschiefer deposits.
o Bi-modal copper sulphide grain size distribution identified, with both coarse (>25 to 30 µm) and very fine disseminated material (<5 to 10 µm), informing comminution and flotation circuit design.
o Historical extraction at Tannenberg materially de-risks metallurgy. The Tannenberg mines produced 416,500 tonnes of copper and 33.7 Moz of silver predominantly during the 1930's to 50's, when mineral processing technology was not as advanced as it is in modern times.
o Supports progression to scoping-level metallurgical testwork on representative samples of each lithology to seek to confirm initial mineralogical findings, assess comminution characteristics and evaluate flotation performance.
· ELEONORE NORTH PROJECT (GREENLAND)
o Fieldwork is currently underway at Eleonore North, targeting gold, tungsten and antimony mineralisation.
o A Reduced Intrusion-related Gold System specialist evaluating the Noa Pluton prospect as well as untested targets
o Bulk sampling of tungsten and antimony-mineralised material at North and South Margeries deposits is expected to support scoping-study level metallurgical sighter test work.
o Archive core from North and South Margeries deposits was sampled prior to fieldwork and are currently being assayed with results expected in the coming months.
o Aim of fieldwork in 2026 is to confirm drill ready targets at both North and South Margeries and Noa Pluton.
o Multiple walk-up surface anomalies identified along strike and adjacent to the existing high-grade tungsten and antimony historical estimates previously identified.
o A 2 km-long prospectivity anomaly at North Margeries sits adjacent to a major east-west fault structure, with multiple additional anomalies surrounding the South Margeries historical estimate.
o Targets were generated by applying modern processing techniques to a heritage dataset acquired from an airborne hyperspectral survey flown in 2000 across the East Greenland Licences.
o Tungsten and antimony are both listed as critical raw materials by the European Union and the United States, with global supply heavily concentrated in China.
· ARBITRATION SET-ASIDE PROCEEDINGS
o As previously announced, the Singapore Court rejected, in its entirety, Poland's application to set aside the Company's ECT award, thereby upholding GreenX's previously announced right to compensation under the ECT.
o A redacted judgment has been released by the Singapore Court, and the Company has brought the judgment to the attention of the English courts as part of the BIT set-aside proceedings. Under the English Arbitration Act 1996, the threshold to succeed on a set-aside application in the courts of England and Wales is exceptionally high, and courts typically reject these challenges unless there has been a serious procedural irregularity.
o Poland has applied to the Singapore Court of Appeal to challenge the rejection of the first ECT set-aside motion. This appeal is being heard in September 2026 by the Court of Appeal, following which Poland will have no further rights of appeal within the Singapore courts.
o The Company will continue to defend its awards and update the market in line with its continuous disclosure requirements.
ENQUIRIES
|
Ben Stoikovich Chief Executive Officer
+44 207 478 3900 |
Kazimierz Chojna Investor Relations - Poland
Kim Eckhof Investor Relations - UK / Germany |
TANNENBERG COPPER PROJECT (GERMANY)
The Tannenberg Copper Project (Tannenberg) is a large scale, relatively shallow and potential high-grade copper brownfields exploration project that is strategically located in central Germany.
Copper is currently recognised as a strategic raw material by the European Union.
Prior to closure in the 1950's, the Richelsdorf mines produced 416,500 tonnes of copper and 33.7 million ounces of silver from Kupferschiefer type deposits. These historic mines consisted of shallow underground workings originally accessed from surface outcrops.
Kupferschiefer style deposits are a well-known and prolific subtype of sediment-hosted copper deposit that are the second most prevalent source of copper production and reserves in the world and have been historically mined in Germany and are still mined in Poland.
Germany has been a significant mining jurisdiction in the past and continues its mining tradition, including the K+S potash mines which operate 4 km away from the license area and are located in the State of Hesse.
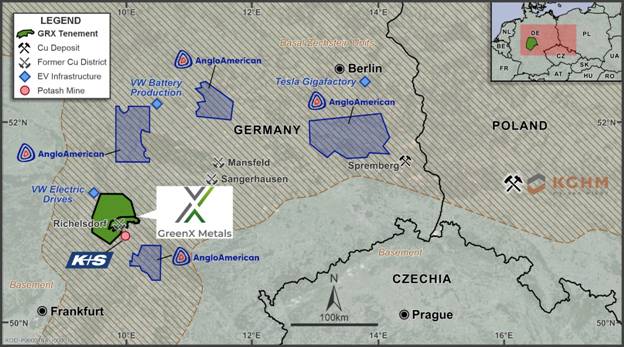
Figure 1: Tannenberg is located in the industrial centre of Europe within the Basal Zechstein trend
(brown shading)
Exploration Target Highlights Potential for Large Scale Copper Silver Project
During the quarter, GreenX announced an Exploration Target at Tannenberg. The estimated range of potential mineralisation in the Exploration Target is: 144 to 279 Mt at 0.9% to 1.4% Cu and 15 to 21 g/t Ag for 1.3 to 3.9 Mt Cu and 69 to 188 Moz Ag.
Cautionary Statement: The Exploration Target has been reported in accordance with the 2012 edition of the JORC Code (JORC Code). The potential quantity and grade of the Exploration Target is conceptual in nature. There has been insufficient exploration to estimate a Mineral Resource for the reported target areas. It is uncertain if further exploration will result in the estimation of a Mineral Resource.
|
Table 1: Exploration Target for Tannenberg |
|||||
|
Prospect |
Tonnes Range |
Cu Grade Range |
Ag Grade Range |
Contained Cu Range |
Contained Ag Range |
|
Zone 1 |
8 to 16 Mt |
0.9 to 1.4% Cu |
15 to 21 g/t Ag |
0.1 to 0.2 Mt Cu |
3.9 to 10.8 Moz Ag |
|
Zone 2 |
40 to 78 Mt |
0.4 to 1.1 Mt Cu |
19.3 to 52.7 Moz Ag |
||
|
Zone 3 |
96 to 186 Mt |
0.9 to 2.6 Mt Cu |
46.3 to 125.6 Moz Ag |
||
|
Total |
144 to 279 Mt |
1.3 to 3.9 Mt Cu |
69.4 to 188.4 Moz Ag |
||
The Exploration Target provides a modern view of the copper potential at Tannenberg. Unlike the 1940 historical estimate, which assessed only the thin Kupferschiefer shale horizon (refer to announcement dated 20 October 2025), the Exploration Target captures mineralisation in the hanging wall above and footwall below the shale. This is consistent with the modern understanding of Kupferschiefer deposits as evidenced at KGHM Polska Miedź S.A's (KGHM) mining operations in Poland.
From Historical Mining District to Exploration Target
The Tannenberg Project has a long-documented history of drilling, mining, and estimation work, providing well-defined and historically validated copper-silver mineralisation that underpins the Exploration Target.
A 95-hole drilling campaign was completed by the National Socialist Government between 1935 and 1938 across the Richelsdorf Mining District. This dataset formed the geological basis for the construction of three Kupferschiefer copper mines within the Tannenberg licence area, Reichenberg, Wolfsberg and Schnepfenbusch. These mines operated between the late 1930's and in some cases up to the mid 1950's. GreenX has digitised and integrated this drillhole database into its geological models (refer to announcement dated 11 September 2025).
The 1940 historical estimate, produced by Mansfeldsche Kupferschieferbergbau AG (Mansfeld AG), is based on a spatially relevant subset of 18 holes from the 95-hole database and established 728,000 tonnes of contained copper at an average grade of 2.6% copper (in the narrow Kupferschiefer shale only) between the Wolfsberg and Schnepfenbusch mines in the north and the Ronshausen area in the south. The historical estimate covers mineralisation from a depth of 100 m in the north to 400 m in the southern end area near Ronshausen (refer to announcement dated 20 October 2025).
A later historical estimate from 1984 was produced by St Joe Explorations GmbH (St Joe), based on limited drilling between 1980 and 1984 (refer to announcements dated 2 August 2024 and 28 April 2025). The St Joe historical work estimated 169,000 tonnes of contained copper and 6.5 million ounces of contained silver within the small section of zone 3 (see Figure 2). St Joe assayed wider intersections and found that the mineralisation was up to 3.45 m thick. This is considerably thicker than the narrow Kupferschiefer shale assayed and estimated by Mansfeld AG in 1940. St Joe provided the first modern indication that economic mineralisation extends beyond the Kupferschiefer shale itself.
Cautionary statement: The historical estimates in this announcement are not reported in accordance with the JORC Code. A competent person has not done sufficient work to classify the historical estimates as a mineral resource or ore reserve in accordance with the JORC Code. It is uncertain that following evaluation and/or further exploration work that the historical estimates will be able to be reported as a mineral resource or ore reserve in accordance with the JORC Code.
Modern Thickness Model
The modern understanding of the Kupferschiefer deposit model, as evidenced at KGHM's Polish mining operations on the same geological setting as Tannenberg, shows that up to 95% of mineable copper can be hosted in the footwall sandstone and hanging wall limestone, with mineralisation often occurring up to 30 m above and 60 m below the Kupferschiefer shale horizon.
Applying the thick mineralisation concept to the historically defined Tannenberg footprint produces a statistically-derived mineralised thickness of 1.7 m to 3.3 m, compared with the 20 cm to 60 cm (shale-only) thickness used in the 1940 historical estimate. The 1.7 m to 3.3 m thickness is consistent with the wider intercepts confirmed by St Joe in the 1980s and has now been independently validated by GreenX's resampling of available archived core.
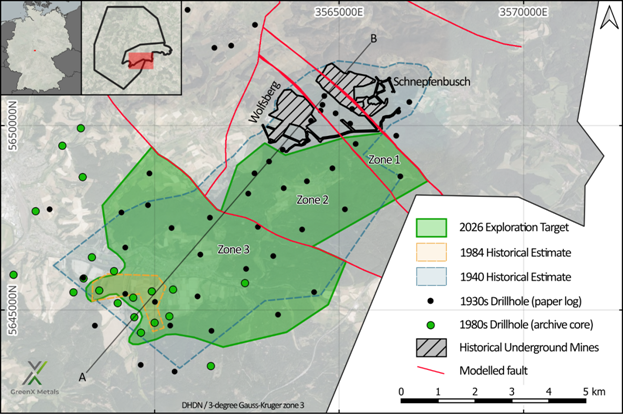
Figure 2: Outline of the Exploration Target and its relationship to previous historical estimates and historical underground mining operations at Tannenberg
Mineralogy Study Confirms Tannenberg Consistent with Polish Kupferschiefer Mines
During the quarter, GreenX completed an early-stage mineralogy and processing study for Tannenberg (refer to announcement dated 17 June 2026). The mineralogy study was completed by SGS Canada Inc. at its Lakefield Ontario facility (SGS Lakefield). It was followed by an independent metallurgical review undertaken by MSA Mining Consulting UK Ltd (MSA-UK) through Principal Associate Metallurgist, Mr Gordon Cunningham. The review has benchmarked Tannenberg against operating and development Kupferschiefer mines in Poland, confirming that copper mineralisation at Tannenberg is consistent with copper-silver deposits in the region and is considered amenable to conventional flotation-based processing methods.
Typical Processing Methods - Kupferschiefer Operations (KGHM and Lumina Metals Analogues)
The sediment-hosted (Kupferschiefer) copper-silver deposits in Poland provide a well-established processing analogue for GreenX's Tannenberg Project, with both long-running operations at KGHM and a recent Preliminary Economic Assessment (PEA) for Lumina Metals' Nowa Sól Project applying similar flotation-based processing routes with selective regrinding.
At KGHM's operations, approximately 30 Mtpa of ore is treated from the Kupferschiefer sequence at an average feed grade of around 1.6% copper and 45 g/t silver. The plant processes a blended feed comprising Kupferschiefer shale, sandstone and carbonate-hosted mineralisation. Processing is based on a conventional sulphide flotation flowsheet, starting with crushing followed by two-stage grinding (rod-ball or ball-ball milling) to a primary grind size of approximately 75 μm (Source: KGHM, Micon, 2013 (see Appendix 4)).
Following grinding, the slurry is treated through flotation circuits consisting of two stages of rougher flotation. The rougher concentrate is then reground to a much finer size, typically less than 20 μm, before passing through multi-stage cleaning circuits. This combination of initial grinding and subsequent fine regrinding is critical to liberate the fine-grained copper sulphide minerals characteristic of Kupferschiefer deposits. The process produces a copper concentrate grading approximately 23% Cu and containing significant silver, with typical metallurgical performance of around 89% copper recovery and 86% silver recovery. The final concentrate is then transported to smelting and refining facilities, where copper metal is produced and silver and other by-products are recovered.
The PEA stage Nowa Sól Cu-Ag Project, owned by Lumina Metals and located within the same Kupferschiefer belt as both Tannenberg and the KGHM mines, provides a modern comparison and follows a similar processing philosophy (Source: Lumina Metals, Micon, 2026 (see Appendix 4)). The proposed flowsheet incorporates semi-autogenous grinding (SAG) with ball milling and pebble crushing, targeting a primary grind size of approximately 60 μm, followed by flotation processing. As with KGHM, the flotation circuit includes two stages of rougher flotation, with the rougher concentrate subjected to fine regrinding (to approximately 11 μm) and multiple cleaning stages to improve concentrate grade and recovery.
The Nowa Sól flowsheet is designed to produce a copper concentrate grading greater than 26% Cu, with strong silver credits (in excess of 1,200 g/t Ag), and expected recoveries of more than 88% for copper and approximately 86% for silver. The final concentrate is planned to be thickened and filtered prior to sale.
Together, these operating and development analogues demonstrate that Kupferschiefer mineralisation can be successfully processed using conventional flotation circuits that incorporate fine grinding, concentrate regrinding and multi-stage cleaning. They also highlight the importance of achieving sufficient liberation of fine-grained copper minerals, a key factor in maximising recovery and concentrate quality in this style of deposit. In the cases of both KGHM and Lumina, there remains a strong opportunity to refine and optimise the flowsheets. In KGHM's case, the plant was built many decades ago, and the Lumina flowsheet used a limited amount of sample material.
Comparison or Tannenberg Copper-Silver Mineralisation with Polish Analogues
The new mineralogical work was completed by SGS Lakefield on ten selected historical drill core samples distributed throughout the mineralised area. The analysis covered three types of mineralisation, including shale, sandstone and carbonate, and provided confirmation of the deportment of the Tannenberg mineralisation, allowing for an important comparison to the Polish deposits. The study utilised TESCAN Integrated Mineral Analyzer (TIMA) and Scanning Electron Microscopy (SEM) techniques to characterise mineral composition, grain size and liberation behaviour.
The results indicate that copper mineralisation is dominated by chalcocite, with additional contributions from bornite, chalcopyrite and covellite, together with minor pyrite, galena and sphalerite. Copper occurs across Kupferschiefer shale, sandstone and carbonate lithologies, with the shale generally hosting the highest grades.
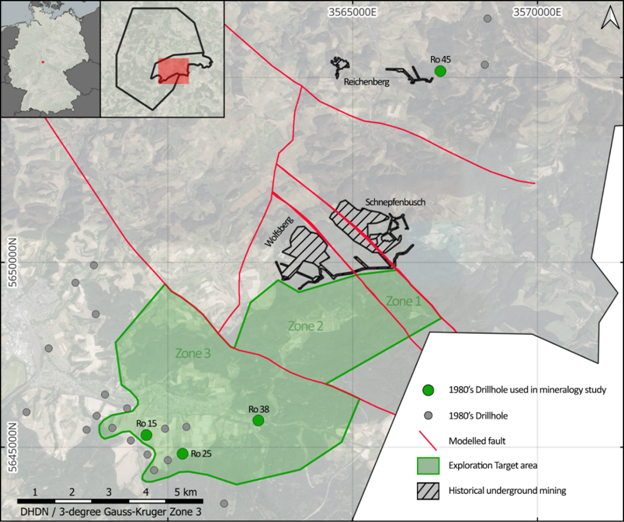
Figure 3: Map showing location of drill holes, indicating those used in the mineralogy study.
A key outcome of the study is the identification of a distinctly bi-modal grain size distribution of copper sulphides, with both coarse particles (>25 to 30 µm) and very fine disseminated material (<5 to 10 µm) present within the host rocks. This fine-grained component is pervasive, with all analysed sections containing copper mineralisation below 5 µm. The presence of this bi-modal distribution is considered a critical factor influencing comminution requirements, flotation performance and overall metallurgical recovery.
When compared to Polish Kupferschiefer operations and development projects, the Tannenberg mineralisation shows strong similarities in grain-size distribution. The presence of fine and disseminated sulphide mineralisation is consistent with observations from these analogue deposits, where fine grinding and regrinding are required to achieve adequate liberation.
|
Hole: Ro 45 |
268.34 m Kupferschiefer
|
269.00 m Kupferschiefer
|
269.63 m Footwall Grauligend
|
|
Hole: Ro 25 |
533.38 m Kupferschiefer
|
533.89 m Kupferschiefer
|
|
|
Hole: Ro 15 |
286.24 m Hanging wall Limestone
|
287.00 m Hanging wall Limestone
|
288.20 m Hanging wall Limestone |
|
Hole: Ro 38 |
536.66 m Kupferschiefer
|
539.00 m Footwall Grauligend
|
|
|
|
|||
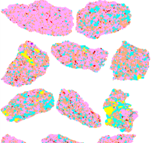
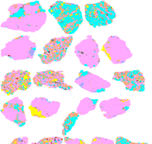
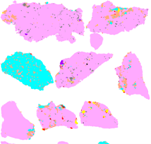
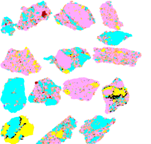
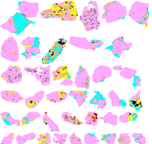
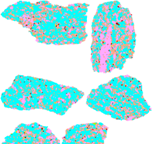
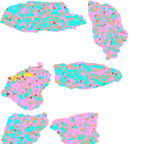
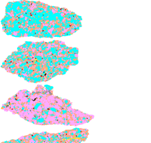
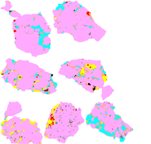
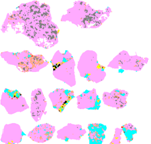


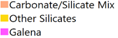
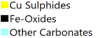


Figure 4: Copper sulphide gangue mineral association images for the ten samples which formed part of the study. The width of each image is 1.5mm.
Based on these similarities, conventional flotation processing is considered an appropriate baseline metallurgical approach for Tannenberg. The Polish analogues demonstrate that crushing, primary grinding, flotation, concentrate regrinding and multi-stage cleaning can achieve strong recoveries of copper and silver from Kupferschiefer ores.
As with all such operations, the bi-modal grain size distribution identified at Tannenberg suggests that particular attention will need to be given to comminution strategy, including the potential requirement for finer grinding to effectively liberate ultra-fine copper minerals.
The mineralogical data also indicates the presence of organic carbon and minor deleterious elements, which may report to concentrate and influence product quality. As a result, future metallurgical testwork will evaluate additional processing steps, such as carbon pre-flotation or specialised reagent schemes, to optimise concentrate grade and marketability.
Based on the mineralogy report, it has been concluded that the Tannenberg mineralisation is materially similar to Polish analogue ores and that the Tannenberg mineralisation is potentially well suited to a flotation-based processing flowsheet and that, subject to further test work, metallurgical recoveries are comparable to, or potentially better than the ~89% Cu and ~86% Ag recoveries reported from Polish mines may be achievable at Tannenberg. Further, the Tannenberg project may potentially produce a copper-silver concentrate of a type that could have strong market acceptance.
RECENT DEVELOPMENTS IN COPPER PROCESSING TECHNOLOGIES
While Kupferschiefer deposits in Poland have been processed for decades using conventional flotation circuits, more recent technological developments offer opportunities to enhance metallurgical performance.
Advances in comminution technologies, such as high-pressure grinding rolls, can improve the liberation of fine-grained copper minerals by breaking ore along natural grain boundaries. This is particularly important for Kupferschiefer mineralisation, where a significant portion of copper occurs in very fine particles.
In addition, modern flotation technologies and specialised fine-particle recovery systems can improve recovery of ultra-fine sulphide minerals, while advanced reagent schemes and pre-treatment steps, such as carbon pre-flotation, may further enhance concentrate grade.
These developments indicate that modern flowsheets have the potential to achieve improved copper and silver recoveries compared to historic operations, particularly for fine-grained Kupferschiefer ores.
This initial mineralogical assessment at Tannenberg also highlights the importance of detailed metallurgical testwork to optimise grind size, concentrate quality and recovery for the Project. The shallow depth of the Tannenberg project, with the existence of spoil heaps and potentially accessible old workings will facilitate metallurgical test work being conducted during early project study phases.
Ongoing Exploration Work Programs at Tannenberg
GreenX continues to advance a coordinated suite of exploration activities at the Project, which test the validity of the Exploration Target identified at Tannenberg and includes:
· Accessing historical underground mines for scoping study-level metallurgical test work, chip sampling, as well as mapping and surveying for 3D modelling - 2H 2026;
· Collation and digitisation of historical geological, mine development, and production data - ongoing;
· Analysis of the use of seismic surveys to aid future drilling campaigns including collecting petrophysical measurements for seismic forward modelling - Q2 2026;
· Seismic survey, if appropriate - commencement H2 2026; and
· Initial drill program - commencement late 2026.
Eleonore North Project
Eleonore North is located in East Greenland on Ymer Island, where two licences covering approximately 525 km² are prospective for gold, antimony, copper and tungsten (Eleonore North or ELN). The project comprises licence MEL 2023-39, which hosts the Noa Prospect targeting a potentially large-scale bulk tonnage gold/antimony system with the potential to host a RIRGS; and MEL 2018-19, which hosts the Margeries Prospects, where high-grade tungsten and antimony mineralisation has been identified as historical estimates.
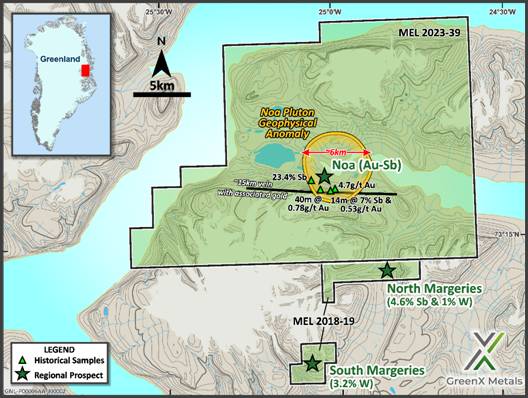
Figure 5: Overview of gold and critical metal prospects within Eleonore North.
2026 Fieldwork Underway
Subsequent to the quarter, GreenX announced that fieldwork had commenced at Eleonore North. The exploration programme is targeting gold (Au), tungsten (W), and antimony (Sb).
Fieldwork at Eleonore North this year covers multiple objectives. At Noa Pluton, a Reduced Intrusion-related Gold System (RIRGS) specialist will conduct mapping and sampling to evaluate the intrusion-related gold potential and identify potential drill targets. At both North (Sb-W) and South Margeries (W), the team will collect 50 kg to 100 kg bulk samples of mineralised material for scoping study level sighter test work. Recent hyperspectral analysis and prospectivity mapping have also highlighted alteration anomalies along strike and adjacent to both deposits (refer to announcement dated 14 May 2026). These untested hyperspectral anomalies have the potential to be satellite discoveries.
The field team has also visited newly generated RIRGS targets in the broader region for reconnaissance style prospecting.
|
|
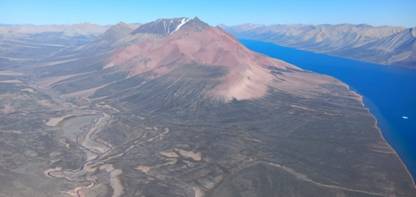
Photo 1: Helicopter view of southern Ymer Island en route to Eleonore North.
|
|
|
Photo 2: Field team at South Margeries (W). |

New High Priority Tungsten and Antimony Targets Identified to be used in the field
During the quarter, GreenX announced that the reprocessing of a historical airborne hyperspectral survey has identified multiple new high-priority tungsten, antimony, and gold targets at Eleonore North. The new targets sit along strike and adjacent to the existing high-grade tungsten and antimony historical estimates identified at North and South Margeries, providing the Company with potential walk-up surface targets to test during the ongoing field season.
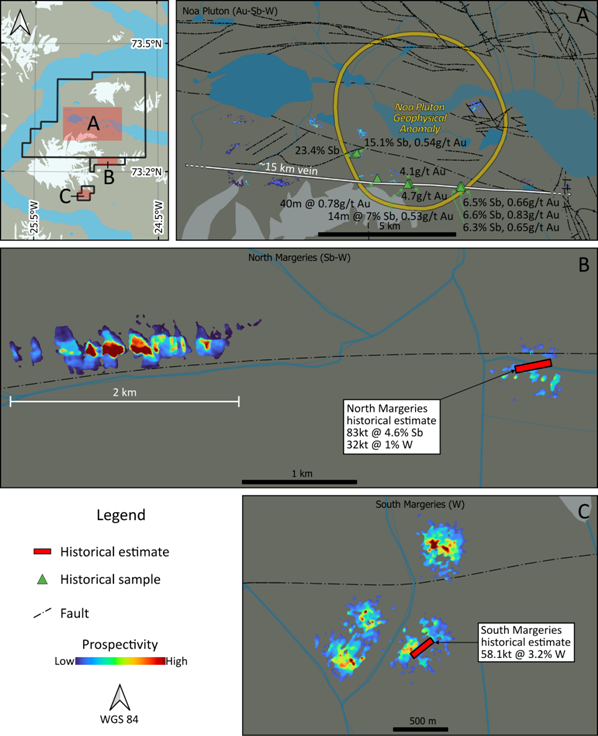
Figure 6: Prospectivity analysis by TheiaX highlights new areas for investigation around Noa Pluton, and North and South Margeries Prospects
Cautionary statement: The historical estimates in this announcement are not reported in accordance with the JORC Code. A competent person has not done sufficient work to classify the historical estimate as a mineral resource or ore reserve in accordance with the JORC Code. It is uncertain that following evaluation and/or further exploration work that the historical estimate will be able to be reported as a mineral resource or ore reserve in accordance with the JORC Code.
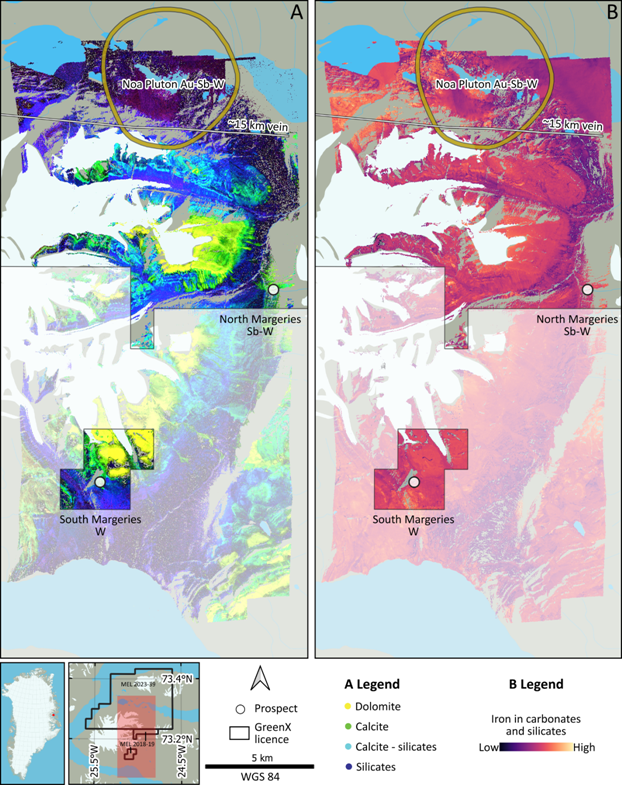
Figure 7: Location of the airborne hyperspectral survey with examples of spectral data products. A: False colour composite illustrating the dominant distribution of four mineral groups. B: Relative abundance of iron in carbonates and silicates.
Survey Background and Processing
Flown in 2000, the airborne hyperspectral survey was part of "Project HyperGreen". The Geological Survey of Denmark and Greenland (GEUS) commissioned the project, which was financed by Greenland's Bureau of Minerals and Petroleum. Data acquisition was contracted to HyVista Corporation (Australia), which used a HyMap system mounted in a Dornier 228 aircraft. Six flight lines covering 186 line-km produced a survey area with dimensions of approximately 12 km x 25 km. The survey produced a pixel size of 5 m, making it high resolution compared to typical satellite surveys, which range from 15 m to 30 m.
Raw data from the survey has been stored by GEUS and was recently made available to GreenX. Data processing was completed by TheiaX GmbH (TheiaX) in Germany. Processing involved converting the raw data from radiance to reflectance values, orthorectification, mosaicking, spectral index calculations and culminated in a prospectivity analysis.
Results and Prospectivity Analysis
The prospectivity analysis identified surface anomalies that share spectral patterns observed at the known historical estimate occurrences at North and South Margeries. These prospective areas represent surface anomalies that have the potential to be walk-up discoveries.
At North Margeries (Figure 6B), a 2 km-long prospectivity anomaly sits 3 km west of the historical estimate and adjacent to a large east-west fault structure.
At South Margeries (Figure 6C), multiple prospectivity anomalies surround the Historical Estimate and likely sit in faults that do not appear in the 1:500,000 scale geological maps.
The anomalies were identified by recognising patterns in spectral indexes proximal to the known mineral occurrences, then applying those patterns across the broader licence area. Various spectral index maps were produced during processing. False colour composites can illustrate the dominant distribution of mineral groups (Figure 7A). Two band indexes can separately illustrate the relative abundance of a mineral group or their compositional variation, e.g., abundance of iron ± magnesium silicates or compositional variation of those silicates from iron-rich to magnesium-rich end members. Various one band index maps were produced to show relative abundance, e.g., iron in carbonates and silicates (Figure 7B).
Upcoming Work Programs
With the ground fieldwork at ELN currently underway upcoming results and work includes the following:
· Collection of samples for multielement analysis;
· Collect bulk sample material for both tungsten and antimony metallurgical sighter test work;
· Field mapping and sampling to ground-truth RIRGS targets and identify drill targets;
· Reprocessing of historic geophysics/hyperspectral data and field mapping to identify drill targets; and
· RIRGS specialist to evaluate the prospect for future field season drill targets.
SINGAPORE COURT DISMISSED POLAND'S SET ASIDE APPLICATION
As previously announced, the Singapore International Commercial Court of the Republic of Singapore (Singapore Court) has rejected, in its entirety, Poland's application to set aside the Energy Charter Treaty (ECT) award, thereby upholding GreenX's previously announced right to compensation under the ECT.
In October 2024, GreenX was awarded approximately £252 million (A$480 million / PLN 1.3 billion) in compensation and interest in the Australia-Poland Bilateral Investment Treaty (BIT) award after a Tribunal had unanimously held that Poland breached its obligations under the BIT and ECT.
At the time of the award, approximately £183 million (A$350 million / PLN 930 million) was awarded pursuant to the ECT (with payments under one award offset against the other).
Interest of approximately 14 million (A$26 million / PLN 71 million) per annum is continuing to accrue and will continue to compound annually until full and final payment is made by Poland.
In 2025, Poland lodged a request to set-aside the ECT award in the Singapore Court (having also lodged a request to set-aside the BIT award in the courts of England and Wales in late 2024). The hearing for the ECT set-aside was held in the Singapore Court in July 2025.
Subsequently, the Singapore Court issued a judgment rejecting, in its entirety, Poland's application to set aside the ECT award.
A redacted judgment has been released by the Singapore Court and the Company has brought the judgment to the attention of the English courts as part of the BIT set-aside proceedings which is being heard in October 2026. Under the English Arbitration Act 1996, the threshold to succeed on a set-aside application in the courts of England and Wales is exceptionally high, and courts typically reject these challenges unless there has been a serious procedural irregularity.
In February 2026, GreenX submitted a request to the Singapore Court to order Poland to reimburse it for its costs claimed in defending its rights in the set-aside proceedings, which amounted to A$1.6 million.
Following this request, the Singapore Court issued an order requiring Poland to pay the A$1.6 million, which has now been paid in full.
Poland has applied to the Court of Appeal of the Republic of Singapore (Court of Appeal) to challenge the rejection of the first ECT set-aside motion. This appeal is being heard in September 2026 by the Court of Appeal, following which Poland will have no further rights of appeal within the Singapore courts. The threshold to succeed on a set-aside motion in either the Singapore or English courts is very high, with the courts rejecting set-aside applications in the vast majority of cases.
The Company will continue to defend its awards and update the market in line with its continuous disclosure requirements.
-ENDS-
Forward Looking Statements
This release may include forward-looking statements. These forward-looking statements are based on GreenX's expectations and beliefs concerning future events. Forward looking statements are necessarily subject to risks, uncertainties and other factors, many of which are outside the control of GreenX, which could cause actual results to differ materially from such statements. GreenX makes no undertaking to subsequently update or revise the forward-looking statements made in this release, to reflect the circumstances or events after the date of that release.
Competent Persons Statement
The information in this report that relates to exploration results were extracted from the ASX announcements dated 15 July 2024, 2 August 2024, 27 November 2024, 28 April 2025, 9 September 2025, 20 November 2025, 14 May 2026, and 17 June 2026 which are available to view at www.greenxmetals.com.
GreenX confirms that (a) it is not aware of any new information or data that materially affects the information included in the original announcements; (b) all material assumptions and technical parameters underpinning the content in the relevant announcements continue to apply and have not materially changed; and (c) the form and context in which the Competent Person's findings are presented have not been materially modified from the original announcements.
The information in this announcement that relates to the Exploration Target is based on information compiled by Mr Rui Goncalves, a Competent Person who is registered with the South African Council of Natural Scientific Professions, a Recognised Professional Organisation' included in a list promulgated by ASX from time to time. Mr Goncalves is a full-time employee of MSA Mining Consulting UK Ltd, an independent consulting company. Mr Goncalves has sufficient experience that is relevant to the style of mineralisation and type of deposit under consideration and to the activity being undertaken, to qualify as a Competent Person as defined in the 2012 Edition of the 'Australasian Code for Reporting of Exploration Results, Mineral Resources and Ore Reserves'. Mr Goncalves consents to the inclusion in this announcement of the matters based on his information in the form and context in which it appears.
The information in this announcement that relates to historical estimates for Tannenberg were extracted from the ASX announcement dated 20 October 2025 entitled 'GreenX Uncovers Historical Estimate at Tannenberg Copper Project' (Original Announcement).
GreenX confirms that (a) it is not in possession of any new information or data relating to the historical estimates that materially impacts on the reliability of the estimates or GreenX's ability to verify the historical estimates as mineral resources or ore reserves in accordance with the JORC Code; (b) that the supporting information provided in the Original Announcement referred to in ASX Listing Rule 5.12 continues to apply and has not materially changed; and (c) the form and context in which the Competent Person's findings are presented have not been materially modified from the Original Announcement.
The information in this announcement that relates to the historical estimate for Eleonore North were extracted from the ASX announcement dated 24 November 2025, entitled 'Greenx Targeting Gold, Tungsten & Antimony At Eleonore North Project In Greenland' (ELN Original Announcement).
GreenX confirms that (a) it is not in possession of any new information or data relating to the historical estimate that materially impacts on the reliability of the estimates or GreenX's to verify the historical estimates as mineral resources or ore reserves in accordance with the JORC Code; (b) that the supporting information provided in the ELN Original Announcement referred to in ASX Listing Rule 5.12 continues to apply and has not materially changed; and (c) the form and context in which the Competent Person's findings are presented have not been materially modified from the ELN Original Announcement.
The information contained within this announcement is deemed by the Company to constitute inside information as stipulated under the Market Abuse Regulations (EU) No. 596/2014 as it forms part of UK domestic law by virtue of the European Union (Withdrawal) Act 2018 ('MAR'). Upon the publication of this announcement via Regulatory Information Service ('RIS'), this inside information is now considered to be in the public domain.
APPENDIX 1: TENEMENT INFORMATION
As at 30 June 2026, the Company has an interest in the following tenements:
|
Location |
Tenement |
Percentage |
Status |
Tenement Type |
|
Germany |
Tannenberg 1 |
90 |
Granted |
Exploration Licence |
|
Germany |
Tannenberg 2 |
90 |
Granted |
Exploration Licence |
|
Greenland |
Eleonore North gold project |
100 |
Granted |
Exploration Licence |
|
Greenland |
Arctic Rift Copper project (ARC) (Licence No. 2025-168) |
-2 |
Withdrawn2 |
Exploration Licence |
Notes:
1 Following a technical review and in accordance with Greenland's mining law, the northern portion of MEL 2023-39 was relinquished during the quarter. This has reduced the licence area from 1,190 km² to 494 km² and, as a result, decreased the minimal annual exploration obligations for MEL 2023-39. During the quarter, the Company also submitted applications for two additional exploration licences in northern Greenland.
2 Given the prospectivity and focus on Tannenberg in Germany and at Eleonore North, and following a review of its portfolio of projects, the most efficient and effective use of the Company's resources, GreenX has agreed to wind up the ARC joint venture. The Company is currently in the process of relinquishing the ARC exploration licence held in Greenland and winding up the joint venture entity which is expected to be completed in the second half of 2026.
Appendix 2: Related Party Payments
During the quarter ended 30 June 2026, the Company made payments of A$262,000 to related parties and their associates. These payments relate to existing remuneration arrangements (director fees, consulting fees and superannuation of A$179,000 and for the provision of administrative, secretarial and corporate services of A$83,000).
Appendix 3: Exploration and Mining Expenditure
During the quarter ended 30 June 2026, the Company made the following payments in relation to exploration activities:
|
Activity |
A$000 |
|
Germany (Tannenberg) |
|
|
Ongoing exploration work programs (assays, reprocessing historical data, exploration target, etc) |
210 |
|
Personnel costs (geology and technical team) |
246 |
|
Sub-total |
456 |
|
|
|
|
Greenland (Eleonore North) |
|
|
Personnel costs (geology and technical team) |
216 |
|
Exploration work programs (data review, geoimagery, etc) |
13 |
|
Sub-total |
229 |
|
Total as reported in the Appendix 5B (items 1.2(a) and 2.1(d)) |
685 |
There were no mining or production activities and expenses incurred during the quarter ended 30 June 2026.
APPENDIX 4: Company Specific Sources
|
Project |
Company |
Status |
Source Data |
Link |
|
Legnica-Glogów Copper Belt |
KGHM Polska Miedź S.A. |
Producing |
NI 43-101 Technical Report (Feb-2013) |
"Technical Report on the Copper-Silver Production Operations of KGHM Polska Miedź S.A. in the Legnica-Głogów Copper Belt Area of Southwestern Poland" prepared by Micon International Limited. | KGHM Corporate website |
|
Nowa Sól Copper Silver Project |
Lumina Metals Corp |
Development |
NI 43-101 Preliminary Economic Assessment (8-April-2026) |
APPENDIX 5: TANNENBERG EXPLORATION TARGET
Archive Core Logging And Sampling
GreenX logged, sampled, and assayed a total of 4,389 m of archived core (Archive) and took 2,368 new samples. This program was initiated after the discovery that drill core had been retained in the archives of the Hessisches Landesamt für Naturschutz, Umwelt und Geologie (HLNUG) for over 40 years since drilling. This new logging and sampling has been conducted in accordance with industry standard practices and has facilitated the estimation of the Exploration Target ranges. In addition to the validation of the historical copper and silver grades around the historical mining areas (see announcement date 20 November 2025), the data has demonstrated that the copper and silver mineralisation persists many kilometres away from the historical copper mines (Wolfsberg, Schnepfenbusch, and Reichenberg).
The Archive work was completed by Palsatech in a specialist logging facility in Sweden. MSA Mining Consulting UK Ltd's (MSA-UK) independent competent person visited the facility while Archive core was being processed. All intercepts with significant Cu-Ag mineralisation were drilled by St Joe's during their 1980s exploration drilling.
The 1930s National Socialist drillhole database was compiled by GreenX geologists, transcribed from hard copy, historical records. An independent audit and verification of the data against these records was not undertaken by MSA-UK. Given that the intention is to declare an Exploration Target, this is not considered a material risk by MSA-UK.
Data validation was undertaken during the import routine in the form of correcting issues such as from/to errors and preparing the data in a format that can readily be imported into three-dimensional modelling software.
Geological Modelling
A geological model was constructed in Leapfrog Geo. Although a number of mapped faults cross the area, only five, relevant fault structures were considered in the model (Figure 1). Four stratigraphic units, namely the Basement, Rotliegend, Zechstein and Buntsandstein were modelled. Due its narrowness and the lateral scale of the model, which spans several kilometres, the Kupferschiefer layer was modelled only as the contact between the Rotliegend and Zechstein. Displacement by faulting is data driven, where the relative position of the stratigraphic units on either side of the fault determines the vertical displacement.
A conceptual mineralisation model was constructed from the drillhole data using a threshold value of 0.30 % Cu. This value was based on the log-probability plot for the combined dataset (Figure 5), which shows a break in the grade population around this threshold. This is a reasonable value, as it incorporates mineralisation in the footwall Rotliegend, the Kupferschiefer and the hanging wall Zechstein.
In addition to the grade threshold, a minimum thickness of 1.5 m was applied during the modelling process, based on regulation and practise at copper mines in Poland Where necessary, low-grade samples falling below the threshold were incorporated into the mineralised zone to achieve the minimum thickness, provided the full composite grade satisfied the threshold value. Due to the sampling bias in the National Socialist dataset, only data generated from 1980s era drilling was used to constrain the thickness of the mineralisation model.
However, the National Socialist data was used to infer lateral continuity of the mineralisation. In order to not overstate tonnages, the mineralisation was truncated against the modelled faults, extrapolated no more than 500 metres beyond the data and limited within the Tannenberg license boundary. Furthermore, mined out areas where discounted from the mineralisation model.
Three areas were considered, a larger area to the southwest, Zone 3, where the model is informed by a combination of Archive and National Socialist data and two smaller areas across fault boundaries towards the northeast, Zone 1 and Zone 2, as shown in Figure 1 above.
Zone 3 has an areal extent of approximately 6 km by 3.5 km. The mineralisation thins out towards the southwest and northwest where drillholes tend to have low-grade copper intercepts that do not meet the minimum thickness criteria, therefore being excluded from the model. Towards the northeast, the mineralisation terminates against a northwest-southeast running fault. Zone 2 is located adjacent to Zone 3 on the northeast side of the bounding fault, with an extent of 3.1 km in the northwest to southeast direction and 2.8 km in the northeast direction. Zone 1 is narrow, bound by two parallel faults and has an areal extent of 1.8 km by 900 m. Both Zones 1 and 2 have been restricted in extent from known mined out areas to the north.
Exploration Target: Grade and Thickness Estimation
A geological model was constructed in Leapfrog Geo. Although a number of mapped faults cross the area, only five, relevant fault structures were considered in the model (Figure 1). Four stratigraphic units, namely the Basement, Rotliegend, Zechstein and Buntsandstein were modelled. Due its narrowness and the lateral scale of the model, which spans several kilometres, the Kupferschiefer layer was modelled only as the contact between the Rotliegend and Zechstein. Displacement by faulting is data driven, where the relative position of the stratigraphic units on either side of the fault determines the vertical displacement (Figure 4).
The lateral extent of the mineralised zones is restricted by structural features and the license boundary, with little room for extrapolation. Therefore, tonnage ranges are given by assuming a variable thickness of the mineralised zones, which is supported by the dataset. Only the Archive data was used to derive grade and thickness ranges as it provides a complete vertical profile through the mineralised zone. Samples captured within the Zone 3 mineralised area were selected and composited to full thickness, resulting in ten composite samples. Full thickness composites were used to derive both grade and thickness ranges for the Exploration Target because this approach minimises the variability of the smaller sample intervals, thus reducing sampling bias and avoiding artificially inflated grades when estimating grade ranges. An additional drillhole, Ro 45, located to the north outside of the area of interest was also used to supplement the data. This hole was included as it is the only Archive drillhole outside of the modelled area that meets the minimum criteria and was incorporated to support the statistical analysis given the limited number of available data points. The remaining Archive holes were not considered as they fall outside the modelled extents of the mineralisation.
The list of drillholes, copper and silver grades and accumulated grades are shown in Table 2 below.
|
Table 2: List of full thickness composites for grade and thickness estimation |
|||||||
|
Hole ID |
From |
To |
Thickness (m) |
Cu (%) |
Ag (g/t) |
Accumulated Copper Grade Cu % per metre |
Accumulated Silver Grade Ag g/t per metre |
|
Ro 15 |
285.6 |
289.3 |
3.7 |
1.19 |
16.6 |
4.41 |
61.5 |
|
Ro 17 |
481.25 |
483 |
1.75 |
0.89 |
18.2 |
1.56 |
31.9 |
|
Ro 18 |
209 |
210.76 |
1.76 |
3.00 |
28.7 |
5.28 |
50.6 |
|
Ro 19 |
339 |
342 |
3 |
1.38 |
16.2 |
4.13 |
48.5 |
|
Ro 20 |
377 |
378.68 |
1.68 |
1.33 |
14.6 |
2.24 |
24.5 |
|
Ro 22 |
435.76 |
439.4 |
3.64 |
0.94 |
16.0 |
3.43 |
58.1 |
|
Ro 23 |
366 |
367.5 |
1.5 |
2.69 |
55.3 |
4.04 |
83.0 |
|
Ro 25 |
533.38 |
534.89 |
1.51 |
1.32 |
27.9 |
2.00 |
42.2 |
|
Ro 35 |
379.15 |
381 |
1.85 |
0.35 |
10.5 |
0.65 |
19.5 |
|
Ro 38 |
536.25 |
539.5 |
3.25 |
0.56 |
11.4 |
1.83 |
37.2 |
|
Ro 45 |
268.34 |
270.37 |
2.03 |
1.62 |
20.5 |
3.29 |
41.7 |
|
Source: MSA-UK |
|||||||
Statistics were derived for the length-weighted copper and silver grades and composite sample lengths as shown in Table 3.
|
Table 3: Summary statistics of mineralised drillhole composites |
|||||||
|
Variable |
Minimum |
Maximum |
Mean |
Median |
Lower Quartile |
Upper Quartile |
Coefficient of Variation |
|
Thickness (m) |
1.50 |
3.70 |
2.33 |
3.00 |
1.68 |
3.25 |
0.37 |
|
Cu grade (%) |
0.35 |
3.00 |
1.28 |
1.19 |
0.89 |
1.38 |
0.63 |
|
Ag grade (g/t) |
10.5 |
55.3 |
19.4 |
16.2 |
14.6 |
20.5 |
0.65 |
|
Source: MSA-UK |
|||||||
An attempt was made to derive grade and thickness ranges using a two-sided confidence interval method on the dataset however this statistical approach resulted in very narrow ranges which are not representative of the inherent variability of the data. Therefore, the interquartile range (IQR) was used instead to define the lower and upper grade and thickness ranges. In this case, the IQR is considered appropriate for this small dataset, as it provides a measure of dispersion around the median, thus reducing the influence of grade and thickness outliers. The resultant ranges are therefore a more realistic representation of the dataset (Table 4).
|
Table 4: Exploration Target lower and upper ranges for grade and thickness |
||
|
Variable |
Lower Range |
Upper Range |
|
Thickness (m) |
1.7 |
3.3 |
|
Cu (%) |
0.9 |
1.4 |
|
Ag (g/t) |
15 |
21 |
|
Source: MSA-UK Note: Grade and thickness ranges rounded to one decimal place to reflect this is an estimate |
||
Density data is not currently available for the project, therefore average densities were sourced from available literature (Taylor, R.D and Anderson, E.D., 2010). An assumption was made for a three metre thick mineable width with the Kupferschiefer shale representing 0.40 m of the total thickness, while the Zechstein and Rotliegend have assumed thicknesses of 1.30 m. Average densities were assigned as shown in Table 5.
|
Table 5: Assumed average densities per stratigraphic unit |
|||
|
Stratigraphic Unit |
Rock Type |
Thickness (m) |
Density (t/m3) |
|
Zechstein |
Limestone |
1.30 |
2.75 |
|
Kupferschiefer |
Shale |
0.40 |
2.40 |
|
Rotliegend |
Sandstone |
1.30 |
2.55 |
|
Source: Taylor, R.D and Anderson, E.D., 2010 |
|||
A weighted, average relative density for the three-metre-thick mineralised zone is calculated as 2.62 t/m3.
Exploration Target Estimation
The base case for the mineralisation is based on the areal extent of copper mineralisation, above a threshold of 0.30 % Cu, that meets a minimum thickness criteria of 1.50 m. Surfaces created in Leapfrog Geo were used to model lateral continuity of the mineralised zones and derive areas for three zones. Thickness ranges were derived from the Archive data and using an assumed average density of 2.62 t/m3, lower and upper ranges of tonnages were calculated as shown in Table 6.
|
Table 6: Tonnage ranges for each zone |
||||||
|
Zone |
Area (m2) |
Thickness (m) |
Density (t/m3) |
Tonnage (Mt) |
||
|
Lower |
Upper |
Lower |
Upper |
|||
|
Zone 1 |
1,800,000 |
1.7 |
3.3 |
2.62 |
8 |
16 |
|
Zone 2 |
9,000,000 |
40 |
78 |
|||
|
Zone 3 |
21,500,000 |
96 |
186 |
|||
|
Total |
43,000,000 |
144 |
279 |
|||
|
Source: MSA-UK. Note: m2 = square metres; m = metres; t/m3 = tonnes per cubed metre; Mt = Million Tonnes Areas are rounded to the nearest 100,000 m2 to reflect this is an estimate Tonnages are rounded to the nearest 1,000,000 tonne to reflect this is an estimate Grade and thickness ranges rounded to one decimal place to reflect this is an estimate |
||||||
Full thickness composite grade data was used to derive grade ranges for copper, with the estimated contained copper ranges shown in Table 7.
|
Table 7: Copper grade and contained metal ranges for each Zone |
||||||
|
Zone |
Tonnage (Mt) |
Cu Grade (%) |
Contained Cu (Mt) |
|||
|
Lower |
Upper |
Lower |
Upper |
Lower |
Upper |
|
|
Zone 1 |
8 |
16 |
0.9 |
1.4 |
0.1 |
0.2 |
|
Zone 2 |
40 |
78 |
0.4 |
1.1 |
||
|
Zone 3 |
96 |
186 |
0.9 |
2.6 |
||
|
Total |
144 |
279 |
1.3 |
3.9 |
||
|
Source: MSA-UK Note: Mt = Million Tonnes. Tonnages are rounded to the nearest 1,000,000 tonne to reflect this is an estimate Grade and thickness ranges rounded to one decimal place to reflect this is an estimate |
||||||
Similarly, silver grade ranges were used to derive contained silver lower and upper scenarios for each zone as shown in Table 8.
|
Table 8: Silver grade and contained metal ranges for each Zone |
||||||
|
Zone |
Tonnage (Mt) |
Ag Grade (g/t) |
Contained Ag (Moz) |
|||
|
Lower |
Upper |
Lower |
Upper |
Lower |
Upper |
|
|
Zone 1 |
8 |
16 |
15 |
21 |
3.9 |
10.8 |
|
Zone 2 |
40 |
78 |
19.3 |
52.7 |
||
|
Zone 3 |
96 |
186 |
46.3 |
125.6 |
||
|
Total |
144 |
279 |
69.4 |
188.4 |
||
|
Source: MSA-UK Note: Mt = Million Tonnes; Moz - million troy ounces g/t - gram per metric tonne; Tonnages are rounded to the nearest 1,000,000 tonne to reflect this is an estimate Ounces are rounded to the nearest 100,000 troy ounce to reflect this is an estimate Grade and thickness ranges rounded to one decimal place to reflect this is an estimate 1 troy ounce (oz) = 31.1034768 grams |
||||||
The Exploration Target for the combined Tannenberg mineralisation is shown in Table 9. As per the JORC Code, it must be stated that the potential quantity and grade of the Exploration Targets are conceptual in nature, that there has been insufficient exploration to estimate Mineral Resources and that it is uncertain if further exploration will result in the estimation of Mineral Resources.
|
Table 9: Tannenberg Combined Exploration Target |
|||||||||
|
Tonnages (Mt) |
Cu (%) |
Ag (g/t) |
Contained Cu (Mt) |
Contained Ag (Moz) |
|||||
|
Lower |
Upper |
Lower |
Upper |
Lower |
Upper |
Lower |
Upper |
Lower |
Upper |
|
144 |
279 |
0.9 |
1.4 |
15 |
21 |
1.3 |
3.9 |
69.4 |
188.4 |
|
Source: MSA-UK. Note: Mt = Million Tonnes; Moz - million troy ounces; g/t - gram per metric tonne; Tonnages are rounded to the nearest 1,000,000 tonne to reflect this is an estimate Contained copper and silver ounces are rounded to the nearest 100,000 troy ounce to reflect this is an estimate Grade and thickness ranges rounded to one decimal place to reflect this is an estimate 1 troy ounce (oz) = 31.1034768 grams |
|||||||||
Appendix 5B
Mining exploration entity or oil and gas exploration entity
quarterly cash flow report
|
Name of entity |
||
|
GreenX Metals Limited |
||
|
ABN |
|
Quarter ended ("current quarter") |
|
23 008 677 852 |
|
30 June 2026 |
|
Consolidated statement of cash flows |
Current quarter |
Year to date |
|
|
1. |
Cash flows from operating activities |
- |
- |
|
1.1 |
Receipts from customers |
||
|
1.2 |
Payments for |
(685) |
(1,347) |
|
|
(a) exploration & evaluation |
||
|
|
(b) development |
- |
- |
|
|
(c) production |
- |
- |
|
|
(d) staff costs |
(382) |
(1,618) |
|
|
(e) administration and corporate costs |
(164) |
(1,099) |
|
1.3 |
Dividends received (see note 3) |
- |
- |
|
1.4 |
Interest received |
163 |
275 |
|
1.5 |
Interest and other costs of finance paid |
- |
- |
|
1.6 |
Income taxes paid |
- |
- |
|
1.7 |
Government grants and tax incentives |
- |
- |
|
1.8 |
Other (provide details if material) (a) Business Development (b) Recoupment of legal costs (c) Arbitration and legal related expenses |
(54) 11 (908) |
(293) 1,592 (3,906) |
|
1.9 |
Net cash from / (used in) operating activities |
(2,019) |
(6,396) |
|
|
|||
|
2. |
Cash flows from investing activities |
- |
- |
|
2.1 |
Payments to acquire or for: |
||
|
|
(a) Entities |
||
|
|
(b) Tenements |
- |
- |
|
|
(c) property, plant and equipment |
(6) |
(19) |
|
|
(d) exploration & evaluation |
- |
(835) |
|
|
(e) investments |
- |
- |
|
|
(f) other non-current assets |
- |
- |
|
2.2 |
Proceeds from the disposal of: |
- |
- |
|
|
(a) entities |
||
|
|
(b) tenements |
- |
- |
|
|
(c) property, plant and equipment |
- |
- |
|
|
(d) investments |
- |
- |
|
|
(e) other non-current assets |
- |
- |
|
2.3 |
Cash flows from loans to other entities |
- |
- |
|
2.4 |
Dividends received (see note 3) |
- |
- |
|
2.5 |
Other (provide details if material) |
- |
- |
|
2.6 |
Net cash from / (used in) investing activities |
(6) |
(854) |
|
|
|||
|
3. |
Cash flows from financing activities |
- |
14,095 |
|
3.1 |
Proceeds from issues of equity securities (excluding convertible debt securities) |
||
|
3.2 |
Proceeds from issue of convertible debt securities |
- |
- |
|
3.3 |
Proceeds from exercise of options |
- |
- |
|
3.4 |
Transaction costs related to issues of equity securities or convertible debt securities |
(4) |
(220) |
|
3.5 |
Proceeds from borrowings |
- |
- |
|
3.6 |
Repayment of borrowings |
- |
- |
|
3.7 |
Transaction costs related to loans and borrowings |
- |
- |
|
3.8 |
Dividends paid |
- |
- |
|
3.9 |
Other (provide details if material) |
- |
- |
|
3.10 |
Net cash from / (used in) financing activities |
(4) |
13,875 |
|
|
|||
|
4. |
Net increase / (decrease) in cash and cash equivalents for the period |
|
|
|
4.1 |
Cash and cash equivalents at beginning of period |
15,432 |
6,826 |
|
4.2 |
Net cash from / (used in) operating activities (item 1.9 above) |
(2,019) |
(6,396) |
|
4.3 |
Net cash from / (used in) investing activities (item 2.6 above) |
(6) |
(854) |
|
4.4 |
Net cash from / (used in) financing activities (item 3.10 above) |
(4) |
13,875 |
|
4.5 |
Effect of movement in exchange rates on cash held |
(21) |
(69) |
|
4.6 |
Cash and cash equivalents at end of period |
13,382 |
13,382 |
|
5. |
Reconciliation of cash and cash equivalents |
Current quarter |
Previous quarter |
|
5.1 |
Bank balances |
7,382 |
4,432 |
|
5.2 |
Call deposits |
6,000 |
11,000 |
|
5.3 |
Bank overdrafts |
- |
- |
|
5.4 |
Other (provide details) |
- |
- |
|
5.5 |
Cash and cash equivalents at end of quarter (should equal item 4.6 above) |
13,382 |
15,432 |
|
6. |
Payments to related parties of the entity and their associates |
Current quarter |
|
6.1 |
Aggregate amount of payments to related parties and their associates included in item 1 |
(262) |
|
6.2 |
Aggregate amount of payments to related parties and their associates included in item 2 |
- |
|
Note: if any amounts are shown in items 6.1 or 6.2, your quarterly activity report must include a description of, and an explanation for, such payments. |
||
|
7. |
Financing facilities Add notes as necessary for an understanding of the sources of finance available to the entity. |
Total facility amount at quarter end |
|
|
7.1 |
Loan facilities |
17,777* |
16,239 |
|
7.2 |
Credit standby arrangements |
- |
- |
|
7.3 |
Other (please specify) |
- |
- |
|
7.4 |
Total financing facilities |
17,777* |
16,239 |
|
|
|
|
|
|
7.5 |
Unused financing facilities available at quarter end |
1,538 |
|
|
7.6 |
Include in the box below a description of each facility above, including the lender, interest rate, maturity date and whether it is secured or unsecured. If any additional financing facilities have been entered into or are proposed to be entered into after quarter end, include a note providing details of those facilities as well. |
||
|
On 30 June 2020, the Company executed a Litigation Funding Agreement (LFA) for US$12.3 million (*now worth A$17.8 million with the movement of the A$ compared to the $US) with LCM Funding UK Limited a subsidiary of Litigation Capital Management Limited (LCM), to pursue the damages Claim in relation to the investment dispute between GreenX and Poland). To date, GreenX has drawn down US$11.2 million (A$16.2 million) (Outstanding Funding). In accordance with the terms of the LFA, once the compensation is received, LCM is entitled to be paid the Outstanding Funding, a multiple of five times the Outstanding Funding (based on the period since entering into the LFA) and from 1 January 2025, interest on the Outstanding Funding at a rate of 30% per annum, compounding monthly. |
|||
|
8. |
Estimated cash available for future operating activities |
$A'000 |
|
8.1 |
Net cash from / (used in) operating activities (item 1.9) |
(2,019) |
|
8.2 |
(Payments for exploration & evaluation classified as investing activities) (item 2.1(d)) |
- |
|
8.3 |
Total relevant outgoings (item 8.1 + item 8.2) |
(2,019) |
|
8.4 |
Cash and cash equivalents at quarter end (item 4.6) |
13,382 |
|
8.5 |
Unused finance facilities available at quarter end (item 7.5) |
1,538 |
|
8.6 |
Total available funding (item 8.4 + item 8.5) |
14,920 |
|
|
|
|
|
8.7 |
Estimated quarters of funding available (item 8.6 divided by item 8.3) |
7
|
|
Note: if the entity has reported positive relevant outgoings (ie a net cash inflow) in item 8.3, answer item 8.7 as "N/A". Otherwise, a figure for the estimated quarters of funding available must be included in item 8.7. |
||
|
8.8 |
If item 8.7 is less than 2 quarters, please provide answers to the following questions: |
|
|
|
8.8.1 Does the entity expect that it will continue to have the current level of net operating cash flows for the time being and, if not, why not? |
|
|
|
Answer: Not applicable |
|
|
|
8.8.2 Has the entity taken any steps, or does it propose to take any steps, to raise further cash to fund its operations and, if so, what are those steps and how likely does it believe that they will be successful? |
|
|
|
Answer: Not applicable |
|
|
|
8.8.3 Does the entity expect to be able to continue its operations and to meet its business objectives and, if so, on what basis? |
|
|
|
Answer: Not applicable |
|
|
|
Note: where item 8.7 is less than 2 quarters, all of questions 8.8.1, 8.8.2 and 8.8.3 above must be answered. |
|
Compliance statement
1 This statement has been prepared in accordance with accounting standards and policies which comply with Listing Rule 19.11A.
2 This statement gives a true and fair view of the matters disclosed.
Date: 31 July 2026
Authorised by: Company Secretary
(Name of body or officer authorising release - see note 4)
Notes
1. This quarterly cash flow report and the accompanying activity report provide a basis for informing the market about the entity's activities for the past quarter, how they have been financed and the effect this has had on its cash position. An entity that wishes to disclose additional information over and above the minimum required under the Listing Rules is encouraged to do so.
2. If this quarterly cash flow report has been prepared in accordance with Australian Accounting Standards, the definitions in, and provisions of, AASB 6: Exploration for and Evaluation of Mineral Resources and AASB 107: Statement of Cash Flows apply to this report. If this quarterly cash flow report has been prepared in accordance with other accounting standards agreed by ASX pursuant to Listing Rule 19.11A, the corresponding equivalent standards apply to this report.
3. Dividends received may be classified either as cash flows from operating activities or cash flows from investing activities, depending on the accounting policy of the entity.
4. If this report has been authorised for release to the market by your board of directors, you can insert here: "By the board". If it has been authorised for release to the market by a committee of your board of directors, you can insert here: "By the [name of board committee - eg Audit and Risk Committee]". If it has been authorised for release to the market by a disclosure committee, you can insert here: "By the Disclosure Committee".
5. If this report has been authorised for release to the market by your board of directors and you wish to hold yourself out as complying with recommendation 4.2 of the ASX Corporate Governance Council's Corporate Governance Principles and Recommendations, the board should have received a declaration from its CEO and CFO that, in their opinion, the financial records of the entity have been properly maintained, that this report complies with the appropriate accounting standards and gives a true and fair view of the cash flows of the entity, and that their opinion has been formed on the basis of a sound system of risk management and internal control which is operating effectively.
RNS may use your IP address to confirm compliance with the terms and conditions, to analyse how you engage with the information contained in this communication, and to share such analysis on an anonymised basis with others as part of our commercial services. For further information about how RNS and the London Stock Exchange use the personal data you provide us, please see our Privacy Policy.

Latest directors dealings
- 10 minutes ago CloudCoco Group
- 17 minutes ago Schroder Real Estate Investment Trust Ltd
- 19 minutes ago SSE
- 31 minutes ago RentGuarantor Holdings PLC
- 41 minutes ago Centrica