
Half Year Results
Summary by AI BETAClose X

14 September 2026

FOR IMMEDIATE RELEASE
GlobalData Plc
Half Year Results
30 June 2026
Resilient H1 performance and strategic evolution to drive long-term value creation
GlobalData Plc (LSE: DATA, GlobalData, the Group), the leading data, insight, and technology company, today publishes its results for the half year ended 30 June 2026 (HY26).
The period saw stable operational performance alongside the continued strategic evolution of the Group's operating model to an end-market divisional structure to drive long-term value creation.
Commenting on H1 performance and GlobalData's strategic evolution, Mike Danson, Chief Executive Officer of GlobalData Plc, said: "As we approach the conclusion of the Growth Transformation Plan, we can reflect on the significant operational progress made. We have established an end-market-led divisional structure, brought entrepreneurial leadership closer to our customers and created a corporate centre focused on disciplined value creation. While H1 saw substantial organisational progress, revenue and growth remained below our ambitions and the benefits of the transformation have not yet been reflected in our financial performance. The foundations are now in place, and our focus is firmly on execution.
Healthcare provides a clear proof point for the strength of the model and demonstrates its potential to be replicated across the portfolio. We are also seeing encouraging early signs elsewhere: Consumer delivered underlying revenue growth of 7% in the half while renewal rates remained resilient across both the Healthcare and Non-Healthcare divisions.
Our immediate priority is to accelerate underlying revenue growth, supported by targeted investment. Underlying revenue growth has been more muted than expected, and full-year revenue is now expected to track consistent with first-half performance - still in line with market expectations, albeit towards the lower end of the range. This revenue outturn, together with new investment in AI-native workflows, proprietary data and human expertise, means full-year margins are expected to be more consistent with the first half. These investments are designed to improve revenue quality, driving stronger renewal rates, accelerate growth over the longer term, as well as driving margin efficiency.
Our continued investment for growth is focused on building market-leading businesses, while maintaining a flexible and disciplined approach to capital allocation and to realising value across the portfolio. The resilience of our subscription revenues and strength of balance sheet provide the capacity to invest both for growth and return capital to shareholders."
Resilient growth in challenging markets
· Revenue grew 4% to £162.9m (HY25: £156.5m), with underlying¹ growth of 1%, reflecting a challenging macroeconomic backdrop in which sales cycles elongated industry-wide, as well as the ongoing embedding of key investments and transformation across the business.
Underlying profitability in line with HY25
|
= |
Underlying Adjusted EBITDA and Adjusted operating profit were flat year-on-year, when adjusting for currency and one-off revenue benefits (see note 3 of Financial Review). On a reported basis: |
|
|
· Adjusted EBITDA¹ increased 5% to £54.8m (HY25: £52.1m) (reflecting flat performance on an underlying basis), with Adjusted EBITDA margin¹ improving one percentage point to 34% (HY25: 33%). |
|
|
· Adjusted operating profit¹ increased 6% to £46.7m (HY25: £44.0m), with adjusted operating profit margin¹ improving one percentage point to 29% (HY25: 28%). |
|
|
· Profit before tax reduced by 6% to £23.2m, as finance charges increased due to increased bank debt. |
|
|
· Adjusted fully diluted EPS¹ increased 8% to 2.7p (HY25: 2.5p). |
Customer relationships are holding and forward visibility of FY26 is strong
· Volume and value renewal rates have been consistent through the half across both Healthcare and Non-Healthcare.
· Contracted Forward Revenue¹ grew 4% to £163.3m (HY25: £157.4m), reflecting underlying growth of 1%, providing strong visibility for the remainder of FY26 and beyond.
Active measures being undertaken
· Investment in proprietary data and AI-first transformation underway, which will enhance the depth, coverage and timeliness of our key datasets. These investments are focused on improving KPI's around client usage and renewal rates, with some AI-driven operational efficiencies expected to flow into FY27 and beyond.
· Continue to invest in sales and go-to-market teams
o We have clear examples of where existing investment has worked well in the past 18 months (Consumer division grew underlying 7% in H1), as well as Non-Healthcare Inside Sales (which have started to see signals in churn improvement) and we will continuously evolve and invest in our sales teams, drawing on best practice in the Group.
· Strong central model to drive value via a centralised operating model, allowing our divisional management teams to focus on their customers and end markets.
· Strengthened leadership, deeper talent and playbooks.
Disciplined capital allocation and a clear medium-term path
· The Group continues its flexible strategy on capital allocation, with the acquisition of Cambridge Healthcare in the first half as well as £19m returned to shareholders through share buybacks.
· A further £30m tender was announced at the end of H1, which has now completed, taking capital returned to over £49m during FY26 to date, contributing to 8% increase in Adjusted diluted earnings per share.
· Our medium-term targets reflect a clear focus on accelerating underlying revenue growth. With supporting investment for growth acceleration, we expect a more measured recovery of Adjusted EBITDA margins towards 40%.
Continued M&A value opportunities:
· For Non-Healthcare, the near-term M&A focus is on realising revenue synergy opportunities from recent acquisitions, with M&A in the Non-Healthcare division de-prioritised in the interim as previously signalled.
· The Healthcare division will continue to actively pursue M&A with a focus on assets with revenue growth, proprietary content, quality of earnings and high customer retention metrics.
Highlights
Financial results for the six months ended 30 June 2026.
|
Key performance metrics |
HY 2026
|
HY 2025 |
Growth |
Underlying growth1
|
|
Revenue |
£162.9m |
£156.5m |
4% |
1% |
|
Operating profit |
£30.9m |
£28.5m |
8% |
|
|
Operating profit margin |
19% |
18% |
1pt |
|
|
Adjusted EBITDA1 |
£54.8m |
£52.1m |
5% |
0% |
|
Adjusted EBITDA margin1 |
34% |
33% |
1pt |
|
|
Profit before tax (PBT) |
£23.2m |
£24.7m |
-6% |
|
|
Basic earnings per share (EPS) |
1.2p |
0.8p |
50% |
|
|
Adjusted basic EPS (restated)1 |
2.7p |
2.5p |
8% |
|
|
Interim dividend per share |
0.3p |
0.3p |
- |
|
|
Contracted Forward Revenue1 |
£163.3m |
£157.4m |
4% |
1% |
|
Net bank debt1 |
(£133.0m) |
(£16.8m) |
692% |
|
Outlook: building momentum and evolving strategy to drive long-term value creation
|
= |
For FY26, underlying revenue growth is expected to be more muted than expected, still in line with market expectations2, albeit towards the lower end of the range. |
|
= |
The reduction in revenue outturn, together with targeted investments through the second half will mean margins are more subdued than market expectations, and in line with the first half Adjusted EBITDA margin. Therefore, we expect Adjusted EBITDA for FY26 to be below market expectations. |
|
= |
Longer term, the investments that we are making now should lead to a positive impact on revenue quality and client renewal rates giving us a stronger foundation for accelerating growth, as well as delivering operational and margin benefits. |
|
= |
GlobalData continues to be focused on delivering long-term sustainable growth, underpinned by its resilient subscription model, differentiated proprietary data and content, increasing application of AI and divisional-value creation model. The Board believes that investment at this time to support revenue growth is in the best interests of long-term value creation and therefore expects a more cautious recovery in margins in the medium term than previously stated. |
|
= |
The Group will maintain a flexible and opportunistic approach to capital allocation, balancing investment for growth, selective M&A and returns to shareholders. |
Note 1: Defined in the explanation of non-IFRS measures on page 18.
Note 2: Current analyst consensus for FY26 is as follows: Revenue within a range of £325.3m - £335.7m, Adjusted EBITDA within a range of £121.0m - £126.7m.
-ENDS-
ENQUIRIES
|
GlobalData Plc |
|
|
Mike Danson, Chief Executive Officer Graham Lilley, Chief Financial Officer |
0207 936 6400 |
|
|
|
|
J.P. Morgan Cazenove (Joint Broker) |
0203 493 8000 |
|
Bill Hutchings Mose Adigun |
|
|
|
|
|
Panmure Liberum (Joint Broker) |
0203 100 2000 |
|
Rupert Dearden James Sinclair-Ford |
|
|
|
|
|
Investec Bank Plc (Joint Broker) |
0207 597 5970 |
|
Henry Reast Virginia Bull |
|
|
|
|
|
FTI Consulting (Financial PR) |
0203 727 1000 |
|
Edward Bridges Dwight Burden Emma Hall |
globaldata@fticonsulting.com |
|
|
|
Notes to Editors
About GlobalData Plc
GlobalData Plc (LSE: DATA) is a company which provides an intelligence and productivity platform that empowers leaders to act decisively in a world of complexity and change. By uniting proprietary data, human expertise, and purpose-built AI into a single, connected platform, we help organisations to see what's coming, move faster, and lead with confidence.
One Platform Model
GlobalData's One Platform model is the foundation of our business and is the result of years of continuous investment, targeted acquisitions, and organic development. This model governs everything we do, from how we develop and manage our products, to our approach to sales and customer success, and supporting business operations At its core, this approach integrates our proprietary data, human expertise, and purpose-built AI into an integrated suite of solutions, designed to serve a broad range of industry markets and customer needs on a global basis. The operational leverage this provides means we can respond rapidly to changing customer needs and market opportunities, and continuously manage and develop products quickly, at scale, with limited capital investment as well as providing unique integration opportunities for M&A.
Strategic Priorities
GlobalData's four strategic priorities are: Customer Obsession, World-Class Product, Sales Excellence and Operational Agility.
Cautionary Statement
This interim statement has been prepared solely to provide information to shareholders to assess how the directors have performed their duty to promote the success of the company.
The interim statement contains certain forward-looking statements. These statements are made by the directors in good faith based on the information available to them up to the time of their approval of this report and such statements should be treated with caution due to the inherent uncertainties, including both economic and business risk factors, underlying any such forward-looking information.
CHIEF EXECUTIVE'S REVIEW
GlobalData today: the gold standard for trusted intelligence
At GlobalData, we build and operate market-leading businesses in information services, driven by a passion for the opportunities that arise from the convergence of data, people, and AI. This is the GlobalData way and our entrepreneurial heritage sets us apart. We are business builders, innovators, and investors - combining the deep sector and market knowledge of a proven operator, with the financial acumen of a successful investor.
We've established a buy and build heritage over a number of years building market leading businesses, creating a truly differentiated intelligence platform that unites the power of proprietary data, human expertise, and AI. Our global scale and diversified platform allow us to operate in almost every sector and market, with a portfolio of market leading businesses with established and defensible positions.
Our culture and expertise is an advantage, built by experienced entrepreneurs and passionate operators who have lived the journey of successfully acquiring, building, and scaling businesses. Our teams are hands-on, proactive to act, and support our portfolio businesses in seizing their biggest opportunities and navigating common challenges. Our scale lets us transfer expertise across domains - spanning strategy, commercial, product, and M&A - across our operations and businesses, creating a dynamic portfolio united in a common purpose.
Our platform-based operating model is powered by a single platform and underpinned by a significant amount of proprietary data - built through years of continuous investment, targeted acquisitions, and organic development - empowers everything from product development to sales and customer success, to operations. It is proven to deliver a tangible advantage to our businesses. This operating leverage lets us rapidly respond to changing customer needs and market opportunities, manage and develop our businesses at scale, with limited capital investment.
Our culture, platform, and portfolio give us financial strength and strategic optionality within our operating model - enabling long-term, shareholder-first investment, whilst remaining flexible to value creation opportunities. The combination of platform capabilities and financial expertise strengthens every deal, capital raise, and partnership, supported by a model that enables us to deploy talent across the portfolio and quickly stand-up world-class teams to support new strategic initiatives, acquisitions and joint ventures.
Philosophy and principles of our strategic evolution to an end-market divisional structure
Our strategic approach is grounded in Customer Obsession, which shapes how we make decisions across sales, products and operations. Our foundations are strong, and the rigour with which we run our business is strengthening further. The progress made since launching the Growth Transformation Plan gives us confidence that the model is working.
|
= |
Since launching the Growth Transformation Plan in January 2024, we have completed 7 acquisitions (BTMI, LinkUp, Celent and Deallus in 2024, AI Palette and Stylus in 2025, and Cambridge Healthcare in H1 2026), investing over £132m to strengthen our proprietary data and competitive intelligence capabilities. |
|
= |
Our AI Hub has been adopted by more than 90% of customers, with a 3x increase in active users, reflecting the depth of engagement our platform now commands. We have established a commercial partnership with Microsoft, including MCP integration with Microsoft 365 Copilot. |
|
= |
Our solutions-led sales model is now embedded across the business, with expanded sales capacity and a new strategic account management framework in place. |
|
= |
On 5 March 2026, we were admitted to the Main Market of the London Stock Exchange. |
Our portfolio is powered by these strong foundations. We have adopted a philosophy of embedding best practice playbooks across the business to ensure consistency and accelerate value creation. This philosophy manifests in our transition to an end-market divisional structure, pairing the GlobalData platform advantage with market-focused businesses led by dedicated management and go-to-market teams. By aligning our organisation around customer needs rather than product lines, we are able to respond more rapidly to changing customer requirements and market opportunities while maintaining the operational leverage of our One Platform model. Our central leadership operationalises our strategic philosophy by creating a mechanism to share, scale and evolve what works across the business.
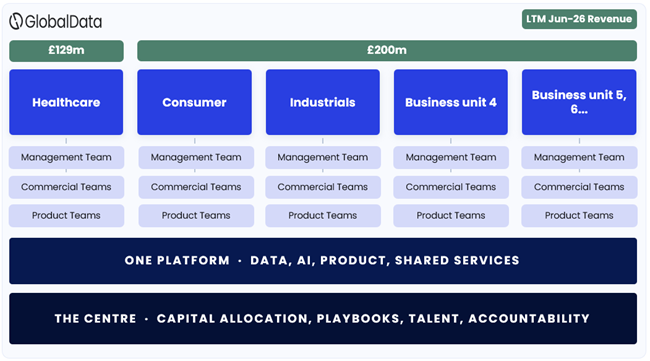
Our model is built on a structural advantage:
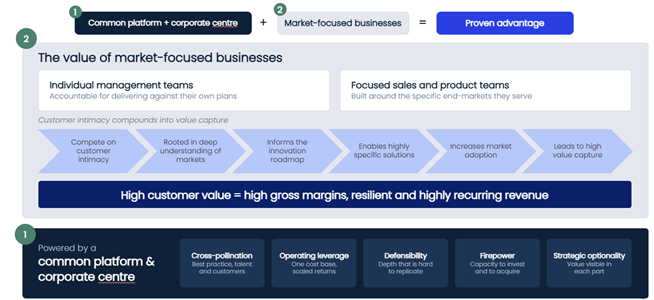
Healthcare is the proof point of the divisional approach
By embedding our solutions-based sales methodology and applying our playbooks for go-to-market and customer engagement, we have demonstrated the effectiveness of the model in a large, complex end market.
The sale of 40% interest in Healthcare during 2024 established a valuation of £1.115bn for the division, equivalent to over 20x EBITDA/ EV multiple. The transaction enhanced the Group's financial flexibility, supporting more than £132m of acquisitions and the return of over £189m to shareholders via tender offers and share buybacks.
Healthcare now has a dedicated management team focused on accelerating growth, supported by the Group's central capabilities and playbooks. This separation demonstrates GlobalData's broader value creation thesis: the ability to identify, isolate, optimise and unlock value in high-potential business segments with decisive speed.
HY26
During the first half, on an underlying basis revenue growth was 1%. The reported revenue growth was 4%, which was impacted by adverse currency headwinds (particularly in the first quarter) and benefitted from M&A based growth from Stylus (part of our Consumer business) and Cambridge Healthcare (Healthcare) as well as a one-off benefit of complimentary period revenue adjustment of £3.3m.
The underlying revenue performance was underpinned by robust renewal rates, both on a volume and value basis (>£20k: Value Renewal Rate 91% (December 2025: 89%), Volume Renewal Rate 83% (December 2025: 83%)).
In order to improve our organic growth rate, we have a significant opportunity if we can reduce churn and increase the volume renewal rates. We have seen some signals of improvement when we look at the performance of our Inside Sales team in Non-Healthcare, who have introduced stronger processes and focus on our smaller clients and we will continuously evolve and invest in our sales teams, drawing on best practice in the Group.
There are some variations in growth around the Group, both Healthcare and Non-Healthcare underlying revenue growth was 1%. Consumer delivered high single digit growth, including 7% underlying growth, and Industrials delivered low-single-digit growth, offset by performances in the rest of the portfolio. We believe the growth rates reflect the different stages of maturity in the management teams in place, but are confident in the teams we now have established across the business in the last 12-18 months.
Underlying Adjusted EBITDA was flat on a like-for-like basis, with reported Adjusted EBITDA increasing by 5% to £54.8m (HY 2025: £52.1m). Adjusted EBITDA margin increased to 34% (HY 2025: 33%). Margin progression was moderated by the effect of recent acquisitions, continued investment in the business and modest underlying revenue growth.
Continued investment in AI-native workflows, proprietary data and our go-to-market teams will support organic revenue opportunities
The focus on long-term shareholder value creation is focused on maximising the Group's organic revenue opportunities over the longer term. We are focused on two Group initiatives to achieve this objective.
1. Investment initiative launched to improve customer outcomes with our AI-first transformation programme
During the period, we have launched GlobalData's wide-reaching AI-first internal transformation programme to modernise how the Group builds and delivers proprietary content by orchestrating AI-native workflows with human expertise, accelerating product development, deepening customer engagement and driving the next phase of growth through to 2030.
Our proprietary data is the cornerstone and foundation of this key initiative - our AI-first initiative to sharpen our workflows and processes to deliver deeper, broader and more timely data coverage, all while continuing to build our proprietary data assets. The financial benefit of AI-driven operational efficiencies is expected to begin flowing through during the end of the second half of FY26 and into FY27.
This programme represents a fundamental shift in how we operate, embedding AI into our core content creation and product development processes rather than treating it as an add-on capability. The integration of AI-native workflows with human expertise allows us to maintain the quality and insight that our customers expect while improving our speed and scale of delivery. We expect the implementation to drive operational efficiency in the medium and long-term, but the project is fundamentally focused on improving customer outcomes through broader, deeper and more timely data and insights to our clients. We expect this initiative to be a catalyst both accelerating top-line growth as well as structurally improving margins.
2. Continued investment in our go-to-market teams
To accelerate growth we will continue to invest in our go-to-market teams. We have clear examples of where existing investment has worked well in the past 18 months (Consumer division grew underlying 7% in H1), as well as Non-Healthcare Inside Sales (which have started to see signals in churn improvement) and therefore we will continuously evolve and invest in our sales teams, drawing on best practice in the Group.
Promotion to FTSE 250
During the period, the Group achieved two further milestones in its growth journey: our move from AIM to the Main Market of the London Stock Exchange, completed on 5 March 2026, and our subsequent promotion to the FTSE 250 on 22 June 2026. Together, these mark a significant step change in GlobalData's profile and stand as further proof points of the momentum behind our strategy.
Capital allocation
A key advantage of GlobalData's business model is the optionality it creates for business building. This is driven by the diversity of assets across the platform, multiple potential combinations between them, a track record of successful acquisitions alongside a pipeline of future opportunities, and varying levels of asset maturity across the Group. This flexibility allows us to respond quickly to market opportunities and, where appropriate, bring assets together to accelerate growth and create additional value.
This optionality informs our approach to capital allocation, allowing the Group to deploy capital flexibly and be opportunistic in how it delivers shareholder value creation. Since 2024, we have invested £132m on acquisitions and returned £189m to shareholders through tender offers and share buybacks, demonstrating our ability to balance investment for growth with direct capital returns.
The Group remains committed to operating within its target net leverage range of 2-3x. We have recently strengthened our financing position by increasing our existing Non-Healthcare facility by £60m to £245m, on a three-year term with a one-year extension option, subject to customary closing conditions. We have also extended the £200m Healthcare facility by a further year to December 2028. Together, these actions provide the Group with enhanced flexibility and capacity to support its capital allocation priorities.
Outlook
The focus on long-term shareholder value creation is focused on maximising the Group's organic revenue opportunities over the longer term.
|
= |
For FY26, underlying revenue growth is expected to be more muted than expected, still in line with market expectations, albeit towards the lower end of the range. |
|
= |
The reduction in revenue outturn, together with targeted investments through the second half will mean margins are more subdued than market expectations, and in line with the first half Adjusted EBITDA margin. Therefore, we expect Adjusted EBITDA for FY26 to be below market expectations. |
|
= |
Longer term, the investments that we are making now should lead to a positive impact on revenue quality and client renewal rates giving us a stronger foundation for accelerating growth, as well as delivering operational and margin benefits. |
|
= |
GlobalData continues to be focused on delivering long-term sustainable growth, underpinned by its resilient subscription model, differentiated proprietary data and content, increasing application of AI and divisional-value creation model. The Board believes that investment at this time to support revenue growth is in the best interests of long-term value creation and therefore expects a more cautious recovery in margins in the medium term than previously stated. |
|
= |
The Group will maintain a flexible and opportunistic approach to capital allocation, balancing investment for growth, selective M&A and returns to shareholders. |
Leadership, talent and thank you to employees
The first half of 2026 has provided further validation of our operational model and the transformation undertaken over the past three years. While the financial benefits are not yet reflected in our results, due in part to the different stages of maturity across our businesses, we now believe we have the operating model and talent needed to accelerate organic revenue growth. This transformation has demanded considerable effort from teams across the Group. This deliberate, above-market investment in senior and mid-tier leadership over the last two years has been made to ensure we have a competitive advantage built not just on technology, but on the people who design, deploy, and continuously improve it.
Our strong talent base of analysts, researchers, technologists, data scientists and AI specialists are embedded across the business, working hard to give our global clients the data they need to make informed decisions quickly. This deep pool of talent and expertise has taken years to assemble. It underpins the resilience of our platform and strengthens our ability to innovate and succeed in an AI-first environment.
I would like to thank our people for their commitment and adaptability as we have embedded new ways of working and repositioned the business for long-term value creation. Our four strategic priorities - Customer Obsession, World-Class Product, Sales Excellence and Operational Agility - continue to guide how we work together and the standards we hold ourselves to.
Mike Danson
Chief Executive Officer
14 September 2026
FINANCIAL REVIEW
|
ADJUSTED FIGURES |
|
|
|
|
|
For the Period Ended 30 June: |
2026 (Unaudited) £m |
2025 (Unaudited) £m |
Reported Growth |
Underlying Growth |
|
Revenue |
162.9 |
156.5 |
4% |
1% |
|
EBITDA1 |
54.8 |
52.1 |
5% |
0% |
|
Operating profit1 |
46.7 |
44.0 |
6% |
0% |
|
Operating profit margin1 |
29% |
28% |
1pt |
|
|
Profit before tax1 (restated) 2 |
39.0 |
40.2 |
-3% |
|
|
Tax charge1 (restated) 2 |
(12.1) |
(12.6) |
-4% |
|
|
Profit after tax1 (restated) 2 |
26.9 |
27.6 |
-3% |
|
|
Free cash flow1 |
31.3 |
42.6 |
-27% |
|
|
Basic earnings per share1 (pence) (restated) 2 |
2.7 |
2.5 |
8% |
|
|
|
|
|
|
|
|
REPORTED FIGURES |
|
|
|
|
|
For the Period Ended 30 June: |
2026 (Unaudited) £m |
2025 (Unaudited) £m |
Reported Growth |
Underlying Growth |
|
Revenue |
162.9 |
156.5 |
4% |
1% |
|
Operating profit |
30.9 |
28.5 |
8% |
|
|
Operating profit margin |
19% |
18% |
1pt |
|
|
Profit before tax |
23.2 |
24.7 |
-6% |
|
|
Tax charge |
(9.1) |
(11.1) |
-18% |
|
|
Profit after tax |
14.1 |
13.6 |
4% |
|
|
Cash flow from operations |
50.8 |
66.1 |
-23% |
|
|
Net bank debt1 |
(133.0) |
(16.8) |
692% |
|
|
Basic earnings per share (pence) |
1.2 |
0.8 |
50% |
|
1 Defined in the explanation of non-IFRS measures on page 18.
2 In prior years, the Group included share-based payments and associated costs, as well as unrealised foreign exchange costs/(gains) as an adjustment to operating profit. The Group updated the classification of adjusting items within the adjusted profits calculation in 2025 with a view to provide more comparable performance metrics across its peers. As a result of the amended calculation method, prior year comparatives have been amended to report adjusted profits on a consistent basis.
Reconciliation of statutory numbers to alternative performance measures:
|
For the Period Ended 30 June: |
2026 (Unaudited) £m |
2025 (Unaudited) £m |
Variance % |
|
Reconciliation: |
|
|
|
|
Operating profit |
30.9 |
28.5 |
8% |
|
Restructuring and corporate projects |
4.6 |
6.2 |
-26% |
|
Acquisition and integration costs |
1.3 |
3.4 |
-62% |
|
Amortisation of acquired intangible assets |
6.9 |
5.9 |
17% |
|
Impairment of acquired intangible assets |
3.0 |
- |
100% |
|
Adjusted operating profit1 |
46.7 |
44.0 |
6% |
|
Depreciation |
3.3 |
3.2 |
3% |
|
Amortisation of software |
2.5 |
1.4 |
79% |
|
Share-based payments charge |
0.5 |
6.8 |
-93% |
|
Costs relating to share-based payments scheme |
0.4 |
0.4 |
- |
|
Revaluation loss/ (gain) on short- and long-term derivatives |
0.4 |
(1.3) |
-131% |
|
Unrealised operating foreign exchange loss/ (gain) |
1.0 |
(2.4) |
-142% |
|
Adjusted EBITDA1 |
54.8 |
52.1 |
5% |
|
Adjusted EBITDA margin1 |
34% |
33% |
1pt |
1 Defined in the explanation of non-IFRS measures on page 18.
The financial position and performance of the business are reflective of the core financial elements of our business model: visible and recurring revenues, high incremental margins, scalable opportunity and strong cash flows.
The Directors believe that Adjusted EBITDA, Adjusted EBITDA margin, Adjusted profit before tax, Adjusted profit after tax and Adjusted earnings per share provide additional useful information on the operational performance of the Group to shareholders (as well as understanding the underlying performance of these measures), and internally we review the results of the Group using these measures. The term 'Adjusted' is not a defined term under IFRS and may not therefore be comparable with similarly titled profit measures reported by other companies. It is not intended to be a substitute for, or superior to, IFRS measures of profit.
1. Executive Summary
Underlying revenue grew 1%, with currency headwinds (especially in Q1) offset by M&A growth from Stylus and Cambridge Healthcare. Renewal rates stayed robust (Value 91%, up from 89% at the end of December 2025; Volume 83%, flat compared with the end of December 2025), but lifting volume renewal rates and cutting churn remains our biggest lever for organic growth, and early signs from Non-Healthcare Inside Sales, with tighter processes and sharper focus on smaller clients, are encouraging.
Adjusted EBITDA rose 5% to £54.8m, though underlying growth was flat (Adjusted EBITDA margin of 34%, up from 33%) as was held back by M&A dilution and continued investment against low single-digit underlying revenue growth.
2. Revenue
Revenue grew by 4% in the six months to June 2026; this was driven mainly by recent acquisitions (Stylus and Cambridge Healthcare), which contributed £7.9m of year-on-year growth (5%), complimentary period revenue adjustment of £3.3m1, alongside underlying revenue growth of 1%. These were somewhat offset by adverse foreign currency movements of £3.4m (2%). Total revenue for the half was £162.9m (HY 2025: £156.5m).
Subscription revenue (representing 76% of revenue, HY 2025: 74%) grew by 6%. The volume and value renewal rates (measured over the last twelve months) have remained consistent at 83% and 91% respectively for clients spending more than £20,000 (December 2025 Volume Renewal Rate 83%, December 2025 Value Renewal Rate 89%).
Other, non-subscription revenue, declined by 2%, which is reflective of discontinued and disposed non-core assets not contributing to revenue in HY26.
The table below is included to reconcile the reported revenue and the impact of acquisitions, currency movements and other items to show the underlying revenue performance in the period.
|
|
£m |
|
Revenue as reported - HY 2026 |
162.9 |
|
Add back currency movements (from underlying business) |
3.4 |
|
Deduct post-acquisition revenue of acquired businesses |
(7.9) |
|
Deduct complimentary period revenue adjustment relating to prior periods1 |
(3.3) |
|
Adjust for disrupted event revenues2 |
0.7 |
|
Revenue underlying - HY 2026 |
155.8 |
|
|
|
|
Revenue as reported - HY 2025 |
156.5 |
|
Deduct revenue of disposed entities and discontinued products3 |
(2.0) |
|
Revenue underlying - HY 2025 |
154.5 |
|
|
|
|
Reported Growth |
4% |
|
Underlying Growth |
1% |
1 Revenue associated with complimentary periods which has been aligned with the provisions of IFRS15 'Revenue from Contracts with Customers'. This had a catch-up effect in HY 2026 but relates to revenue earned in previous years.
2 Events rephased as a result of disruption in the Middle East.
3 The Group disposed of Internet Business Group Limited on 31 October 2025. Discontinued non-core publications and events included in HY 2025 revenue.
3. Profit before tax
Profit before tax for the period declined by £1.5m to £23.2m (HY 2025: £24.7m) reflecting an increase in operating profit offset with increases to finance charges driven by higher bank debt.
|
£m |
Period ended 30 June 2026 |
Period ended 30 June 2025 |
Change % |
|
Revenue |
162.9 |
156.5 |
4% |
|
Operating costs (excluding adjusting items) |
(108.1) |
(104.4) |
4% |
|
Adjusted EBITDA |
54.8 |
52.1 |
5% |
|
Depreciation |
(3.3) |
(3.2) |
3% |
|
Amortisation of acquired intangible assets |
(6.9) |
(5.9) |
17% |
|
Amortisation of software |
(2.5) |
(1.4) |
79% |
|
Impairment of acquired intangible assets |
(3.0) |
- |
100% |
|
Share-based payments charge |
(0.5) |
(6.8) |
-93% |
|
Restructuring and corporate projects |
(4.6) |
(6.2) |
-26% |
|
Acquisition and integration costs |
(1.3) |
(3.4) |
-62% |
|
Costs relating to share-based payment schemes |
(0.4) |
(0.4) |
- |
|
Revaluation (loss)/ gain on short- and long-term derivatives |
(0.4) |
1.3 |
-131% |
|
Unrealised operating foreign exchange (loss)/ gain |
(1.0) |
2.4 |
-142% |
|
Finance costs |
(7.7) |
(3.8) |
103% |
|
Profit before tax |
23.2 |
24.7 |
-6% |
Adjusted EBITDA
Adjusted EBITDA increased by 5% to £54.8m (HY 2025: £52.1m). Revenue growth of £6.4m was offset with cost increases of £3.7m, meaning that the overall net increase to Adjusted EBITDA was £2.7m. Adjusted EBITDA margin increased to 34% (HY 2025: 33%). Included within Adjusted EBITDA for HY 2026 is £3.3m of revenue associated with complimentary periods which has been aligned with the provisions of IFRS15 'Revenue from Contracts with Customers'. This has had a one-off beneficial impact in HY 2026.
|
|
£m |
|
Adjusted EBITDA as reported - HY 2026 |
54.8 |
|
Add back currency movements |
0.4 |
|
Deduct post-acquisition Adjusted EBITDA of acquired businesses |
- |
|
Deduct complimentary period revenue adjustment relating to prior periods |
(3.3) |
|
Adjusted EBITDA underlying - HY 2026 |
51.9 |
|
Adjusted EBITDA as reported - HY 2025 |
52.1 |
|
|
|
|
Reported Growth |
5% |
|
Underlying Growth |
0% |
Segmental Performance
|
ADJUSTED FIGURES |
HY 2026 |
Reported Growth |
Underlying Growth |
|||
|
£m |
GlobalData Non-Healthcare |
GlobalData Healthcare |
Corporate (unallocated) |
Group Total |
||
|
Revenue |
|
|
|
|
|
|
|
Services satisfied over a period of time |
71.3 |
52.0 |
- |
123.3 |
6% |
|
|
Services satisfied at a point time |
26.4 |
13.2 |
- |
39.6 |
-2% |
|
|
Total revenue |
97.7 |
65.2 |
- |
162.9 |
4% |
1% |
|
|
|
|
|
|
|
|
|
Adjusted EBITDA |
24.1 |
31.6 |
(0.9) |
54.8 |
5% |
0% |
|
Adjusted EBITDA margin |
25% |
48% |
|
34% |
|
|
|
Adjusted operating profit |
18.6 |
29.0 |
(0.9) |
46.7 |
6% |
0% |
|
Adjusted operating profit margin |
19% |
44% |
|
29% |
|
|
|
|
|
|
|
|
|
|
|
Reconciliation: |
|
|
|
|
|
|
|
Operating profit |
11.2 |
23.2 |
(3.5) |
30.9 |
|
|
|
Restructuring and corporate projects |
1.1 |
0.9 |
2.6 |
4.6 |
|
|
|
Acquisition and integration costs |
0.3 |
1.0 |
- |
1.3 |
|
|
|
Amortisation of acquired intangibles |
5.1 |
1.8 |
- |
6.9 |
|
|
|
Impairment of acquired intangibles |
0.9 |
2.1 |
- |
3.0 |
|
|
|
Adjusted operating profit |
18.6 |
29.0 |
(0.9) |
46.7 |
|
|
|
Amortisation (excluding amortisation of acquired intangibles) |
2.4 |
0.1 |
- |
2.5 |
|
|
|
Depreciation |
2.5 |
0.8 |
- |
3.3 |
|
|
|
Share-based payments charge |
0.4 |
0.1 |
- |
0.5 |
|
|
|
Costs related to share-based payment schemes |
0.4 |
- |
- |
0.4 |
|
|
|
Movement in unrealised operating and derivative foreign exchange |
(0.2) |
1.6 |
- |
1.4 |
|
|
|
Adjusted EBITDA |
24.1 |
31.6 |
(0.9) |
54.8 |
|
|
|
ADJUSTED FIGURES |
HY 2025 |
Reported Growth |
Underlying Growth |
|||
|
£m |
GlobalData Non-Healthcare |
GlobalData Healthcare |
Corporate (unallocated) |
Group Total |
||
|
Revenue |
|
|
|
|
|
|
|
Services satisfied over a period of time |
68.9 |
47.1 |
- |
116.0 |
7% |
|
|
Services satisfied at a point time |
27.7 |
12.8 |
- |
40.5 |
31% |
|
|
Total revenue |
96.6 |
59.9 |
- |
156.5 |
12% |
1% |
|
|
|
|
|
|
|
|
|
Adjusted EBITDA |
24.2 |
28.8 |
(0.9) |
52.1 |
-10% |
-8% |
|
Adjusted EBITDA margin |
25% |
48% |
|
33% |
|
|
|
Adjusted operating profit |
13.3 |
31.6 |
(0.9) |
44.0 |
|
|
|
Adjusted operating profit margin |
14% |
53% |
|
28% |
|
|
|
|
|
|
|
|
|
|
|
Reconciliation: |
|
|
|
|
|
|
|
Operating profit |
3.7 |
29.0 |
(4.2) |
28.5 |
|
|
|
Restructuring and corporate projects |
1.7 |
1.2 |
3.3 |
6.2 |
|
|
|
Acquisition and integration costs |
3.2 |
0.2 |
- |
3.4 |
|
|
|
Amortisation of acquired intangibles |
4.7 |
1.2 |
- |
5.9 |
|
|
|
Adjusted operating profit |
13.3 |
31.6 |
(0.9) |
44.0 |
|
|
|
Amortisation (excluding amortisation of acquired intangibles) |
1.4 |
- |
- |
1.4 |
|
|
|
Depreciation |
2.3 |
0.9 |
- |
3.2 |
|
|
|
Share-based payments charge |
5.5 |
1.3 |
- |
6.8 |
|
|
|
Costs related to share-based payment schemes |
0.4 |
- |
- |
0.4 |
|
|
|
Movement in unrealised operating and derivative foreign exchange |
1.3 |
(5.0) |
- |
(3.7) |
|
|
|
Adjusted EBITDA |
24.2 |
28.8 |
(0.9) |
52.1 |
|
|
Adjusting items
Adjusting items (detailed in note 7) totalled £18.1m during the period (HY 2025: £19.0m). Significant items include:
|
= |
Share-based payment charge totalling £0.5m (HY 2025: £6.8m).
|
|
= |
Restructuring costs totalling £2.0m were incurred, which have principally arisen as a result of exit costs linked to restructuring projects and rates costs linked to offices which the Group has exited. Corporate projects costs of £2.6m were additionally incurred in relation to the AIM to Main Market movement (HY 2025 restructuring and corporate projects: £6.2m).
|
|
= |
Revaluation of short- and long-term derivatives and unrealised operating foreign exchange contributed a total loss in the first half of £1.4m (HY 2025: £3.7m gain). This is a result of fluctuations in currency exchange rates.
|
|
= |
Other significant movements on adjusting items include an increase in amortisation of acquired intangibles of £1.0m to £6.9m (HY 2025 £5.9m) and an impairment of acquired customer relationship intangibles balances totalling £3.0m across the Group.
|
Finance costs
Net finance costs have increased by £3.9m to £7.7m (HY 2025: £3.8m), including IFRS16 leases interest cost of £0.6m (HY 2025: £0.6m). The increase is as a result of increased average drawn debt in the period of H1 2026 compared with H1 2025. The cash paid in interest in HY 2026 was £6.5m (HY 2025: £3.2m).
Leases
Within our operating costs, depreciation in relation to right-of-use assets was £2.4m (HY 2025: £2.4m). Our net finance costs include interest of £0.6m in relation to lease liabilities (HY 2025: £0.6m).
4. Foreign exchange impact on results
The Group derives around 60% of revenues in currencies other than Sterling, compared with around 40% of its cost base. The impact of currency movements in the period reduced revenue by £3.4m.
|
£m |
Revenue |
Net operating costs1 |
Adjusted EBITDA |
Adjusted EBITDA Margin |
Contracted Forward Revenue |
|
Reported |
162.9 |
(108.1) |
54.8 |
34% |
163.3 |
|
Add back currency movements |
|
|
|
|
|
|
US Dollar |
3.5 |
(1.6) |
1.9 |
|
(0.9) |
|
Euro |
(0.3) |
- |
(0.3) |
|
(0.2) |
|
Other |
0.2 |
(1.4) |
(1.2) |
|
0.1 |
|
Constant currency |
166.3 |
(111.1) |
55.2 |
33% |
162.3 |
|
30 June 2025 Reported |
156.5 |
(104.4) |
52.1 |
33% |
157.4 |
|
Constant currency growth2 |
6% |
6% |
6% |
- |
3% |
1 Operating costs excluding adjusting items.
2 Defined in the explanation of non-IFRS measures on page 18.
5. Taxation
The interim period income tax expense has been calculated using the forecast effective tax rate that would be applicable to expected total annual earnings, i.e. the estimated average annual effective income tax rate applied to the pre-tax income of the interim period. To the extent practicable, where different income tax rates apply to different categories of income, a separate rate has been used for each individual category of interim period pre-tax income.
Using this approach, the overall annual effective income tax rate is currently forecast to be 28.4% (HY 2025: 31.8%). This broadly represents the blended corporation tax rate for FY 2025 in the UK of 25.0%, adjusted for expenses which are not deductible for tax purposes (1.2%), including M&A and restructuring costs incurred to facilitate the Company's strategic agenda, an increase in un-recognised deferred tax assets (1.9%) plus other net permanent difference (0.3%).
Reconciliation of statutory income tax charge to adjusted income tax charge is presented below:
|
£m |
Period ended 30 June 2026
|
Period ended 30 June 2025 Restated |
|
Statutory income tax charge |
9.1 |
11.1 |
|
Amortisation of acquired intangible assets |
2.0 |
1.5 |
|
Impairment of acquired intangible assets |
0.8 |
- |
|
Acquisition and integration costs |
0.2 |
- |
|
Restructuring and corporate projects |
0.7 |
- |
|
Movement in unrecognised deferred tax |
(0.7) |
- |
|
Adjusted income tax charge |
12.1 |
12.6 |
The adjusted tax charge for HY 2025 has been restated due to the calculation of adjusted profits being amended during the financial year ended 31 December 2025, which has been further discussed within the earnings per share section of this report.
6. Earnings per share
|
£m |
Period ended 30 June 2026 |
Period ended 30 June 2025 |
Change % |
|
Earnings attributable to equity holders: |
|
|
|
|
Basic earnings per share (pence) |
1.2 |
0.8 |
50% |
|
Diluted earnings per share (pence) |
1.2 |
0.8 |
50% |
|
Adjusted basic earnings per share (pence) (restated) |
2.7 |
2.5 |
8% |
|
Adjusted diluted earnings per share (pence) (restated) |
2.7 |
2.5 |
8% |
|
£m |
Period ended 30 June 2026
|
Period ended 30 June 2025 Restated |
|
Profit before tax |
23.2 |
24.7 |
|
Restructuring and corporate projects |
4.6 |
6.2 |
|
Acquisition and integration costs |
1.3 |
3.4 |
|
Amortisation of acquired intangible assets |
6.9 |
5.9 |
|
Impairment of acquired intangible assets |
3.0 |
- |
|
Adjusted profit before tax1 |
39.0 |
40.2 |
|
Adjusted income tax expense1 |
(12.1) |
(12.6) |
|
Adjusted profit after tax1 |
26.9 |
27.6 |
|
Allocated to equity holders of the parent |
19.3 |
18.8 |
|
Allocated to non-controlling interest |
7.6 |
8.8 |
1 Defined in the explanation of non-IFRS measures on page 18.
In prior years, the Group included share-based payments and associated costs, as well as unrealised foreign exchange costs/(gains) as an adjustment to operating profit. The Group updated the classification of adjusting items in 2025 with a view to provide more comparable performance metrics across its peers. As a result of the amended calculation method, prior year comparatives have been amended to report adjusted profits on a consistent basis.
Basic EPS was 1.2 pence per share (HY 2025: 0.8 pence per share). Fully diluted profit per share was 1.2 pence per share (HY 2025: 0.8 pence per share). Adjusted basic earnings per share grew from 2.5 pence per share (restated) to 2.7 pence per share, representing 8% growth.
7. Share count
Reconciliation of basic weighted average number of shares to the diluted weighted average number of shares:
|
|
Period ended 30 June 2026 No' m |
Period ended 30 June 2025 No' m |
|
Basic weighted average number of shares, net of shares held in treasury reserve |
705.7 |
765.9 |
|
Dilutive share options in issue - scheme 1 |
0.7 |
0.7 |
|
Dilutive share options in issue - scheme 2 |
- |
0.5 |
|
Dilutive share options in issue - scheme 4 |
- |
- |
|
Diluted weighted average number of shares |
706.4 |
767.1 |
Reconciliation of basic number of shares to the diluted number of shares as at the balance sheet date of 30 June 2026:
|
|
Period ended 30 June 2026 No' m |
Period ended 30 June 2025 No' m |
|
Basic number of shares |
746.9 |
806.5 |
|
Shares held in treasury reserve |
(50.5) |
(51.3) |
|
Dilutive share options in issue - scheme 1 |
0.7 |
0.7 |
|
Dilutive share options in issue - scheme 2 |
- |
0.5 |
|
Dilutive share options in issue - scheme 4 |
- |
- |
|
Diluted number of shares |
697.1 |
756.4 |
8. Dividends
We are pleased to declare an interim dividend of 0.3 pence per share (HY 2025: 0.3 pence). The interim dividend will be paid on 23 October 2026 to shareholders on the register at the close of business on 25 September 2026. The ex-dividend date will be on 24 September 2026.
9. Cash generation
|
£m
|
Period ended 30 June 2026
|
Period ended 30 June 2025
|
Change % |
|
Cash flow generated from operations |
50.8 |
66.1 |
-23% |
|
Interest paid |
(6.5) |
(3.2) |
103% |
|
Income taxes paid |
(3.6) |
(13.3) |
-73% |
|
Contingent consideration paid1 |
(2.3) |
(0.3) |
667% |
|
Principal elements of lease payments |
(3.2) |
(2.8) |
14% |
|
Purchase of intangible and tangible assets |
(3.9) |
(3.9) |
- |
|
Free cash flow2 |
31.3 |
42.6 |
-27% |
|
Operating cash flow conversion %2 |
93% |
127% |
|
|
Free cash flow conversion %2 (restated)3 |
80% |
106% |
|
1 Cash cost relating to contingent consideration included in the Consolidated Statement of Cash Flows within operating activities (£0.8m (HY 2025: £0.3m)) and investing activities (£1.5m (HY 2025: £nil)).
2 Defined in the explanation of non-IFRS measures on page 18.
3 Free cash flow conversion for 2025 has been restated due to the calculation of adjusted profits being amended during the financial year ended 31 December 2025, which has been further discussed within the earnings per share section of this report.
Cash generated from operations reduced by 23% to £50.8m (HY 2025: £66.1m), representing 93% of Adjusted EBITDA (HY 2025: 127%). The reduction of operating cash flow is reflective of £3.4m in cash-settled share based payments paid in HY26 as a one-off transaction, cash collection on three key contracts rephased into H2 2026 (received in H1 during 2025) of £3.2m, adverse impact of foreign exchange on USD collections of £3.0m, and cash held as at 30 June 2025 (and included within operating cash flow HY 2025) of £5.2m in taxes owed on share sales by the employee benefit trust in relation to the exercise of LTIP awards (subsequently remitted in July 2025). On a like-for-like basis, operating cash flow is broadly flat.
Capital expenditure was £3.9m during the period (HY 2025: £3.9m). Capital expenditure represented 2.4% of revenue (HY 2025: 2.5%).
Free cash flow decreased by 27% to £31.3m, reflecting trading movements discussed above. Free Cash Flow represented 80% of Adjusted Profit Before Tax (HY 2025 (restated): 106%).
10. Reconciliation of net bank debt
The Group defines net bank debt as short- and long-term borrowings less cash and cash equivalents. The amount excludes items related to leases.
|
£m |
30 June 2026 |
30 June 2025 |
|
|
Short- and long-term borrowings |
(181.0) |
(76.8) |
|
|
Cash |
48.0 |
60.0 |
|
|
Net bank debt |
(133.0) |
(16.8) |
|
A reconciliation of cash generated from operations, free cash flow and opening and closing net bank debt is set out below.
|
£m |
Period ended 30 June 2026 |
Period ended 30 June 2025 |
Growth |
|
Cash flow generated from operations |
50.8 |
66.1 |
-23% |
|
Interest paid |
(6.5) |
(3.2) |
103% |
|
Income taxes paid |
(3.6) |
(13.3) |
-73% |
|
Contingent consideration1 |
(2.3) |
(0.3) |
667% |
|
Principal elements of lease payments |
(3.2) |
(2.8) |
14% |
|
Purchase of intangible and tangible assets |
(3.9) |
(3.9) |
- |
|
Free cash flow |
31.3 |
42.6 |
-27% |
|
Dividends paid |
(8.5) |
(7.7) |
10% |
|
Net M&A2 |
(21.7) |
(8.2) |
165% |
|
Settlement of hire purchase liability |
(0.1) |
- |
100% |
|
Settlement of related party liability |
(0.9) |
- |
100% |
|
Acquisition of own shares for cancellation |
(18.6) |
(39.7) |
-53% |
|
Acquisition of own shares |
- |
(11.0) |
-100% |
|
Net cash flow |
(18.5) |
(24.0) |
-23% |
|
Opening net (bank debt)/ cash |
(114.2) |
10.1 |
-1231% |
|
Non-cash movement in borrowings |
(0.7) |
0.1 |
-800% |
|
Currency translation |
0.4 |
(3.0) |
-113% |
|
Closing net bank debt |
(133.0) |
(16.8) |
692% |
|
Last 12 months Adjusted EBITDA3 |
112.9 |
111.1 |
2% |
|
Net bank debt leverage |
-1.2X |
-0.2x |
-1.0x |
1 Cash cost relating to contingent consideration included in the Consolidated Statement of Cash Flows within operating activities (£0.8m (HY 2025: £0.3m)) and investing activities (£1.5m (HY 2025: £nil)).
2 Cash cost relating to acquisitions included in the Consolidated Statement of Cash Flows within investing activities (£20.6m, excluding contingent consideration cash cost (HY 2025: £8.2m)) and financing activities (£1.1m (HY 2025: £nil)).
3 Reflects 12 month rolling Adjusted EBITDA results. £112.9m reconciles as H2 2025 (£58.1m) and H1 2026 (£54.8m), £111.1m reconciles as H2 2024 (£59.0m) and H1 2025 (£52.1m).
11. M&A transactions
On 1 April 2026, the Group acquired the entire share capital of Cambridge Healthcare Research Limited and its non-trading wholly owned subsidiary for cash consideration of £21.3m plus issuance of a loan note of £0.7m which has been classified as an amount owed to related parties within the Consolidated Statement of Financial Position. Cambridge Healthcare Research is a market-leading competitive intelligence (CI) solutions provider focused on the global life sciences sector. The acquisition creates the opportunity for the Group to build deeper, more embedded relationships with major brands within the pharmaceutical sector and creates the potential for GlobalData to deliver more value to our clients.
12. Contracted Forward Revenue
Contracted Forward Revenue grew from £157.4m as at 30 June 2025 to £163.3m as at 30 June 2026. Contracted Forward Revenue is a major component of our significant revenue visibility for the forthcoming period.
|
£m |
30 June 2026 |
30 June 2025 |
|
Deferred revenue |
125.7 |
126.8 |
|
Amounts not due/subscription not started at 30 June |
0.9 |
0.7 |
|
Invoiced Forward Revenue |
126.6 |
127.5 |
|
Contracted not yet invoiced |
36.7 |
29.9 |
|
Contracted Forward Revenue |
163.3 |
157.4 |
|
£m |
GlobalData Non-Healthcare |
GlobalData Healthcare |
Total Group |
|
Contracted Forward Revenue as reported - 30 June 2026 |
101.5 |
61.8 |
163.3 |
|
Add back currency movements (from underlying business) |
(0.8) |
(0.4) |
(1.2) |
|
Add back complimentary period revenue adjustment |
0.9 |
2.2 |
3.1 |
|
Deduct Contracted Forward Revenue of acquisitions |
(4.8) |
(1.6) |
(6.4) |
|
Contracted Forward Revenue underlying - 30 June 2026 |
96.8 |
62.0 |
158.8 |
|
30 June 2025 |
94.7 |
62.7 |
157.4 |
|
Reported growth |
7% |
-1% |
4% |
|
Underlying growth |
2% |
-1% |
1% |
Explanation of non-IFRS Measures
|
Financial measure |
How we define it |
Why we use it |
|
Adjusted diluted EPS |
Adjusted profit after tax per diluted share (reconciliation between statutory profit and adjusted profit shown on page 14). Diluted share defined as total of basic weighted average number of shares (net of shares held in treasury reserve) and share options in issue at end of period (reconciliation between basic weighted average number of shares and diluted weighted average number of shares in note 9). |
In order to provide additional useful information to assess the year-on-year operational business performance. Use of these measures aids comparability to the prior year given the variability of the adjusting items size from one year to the next. |
|
Adjusted EBITDA |
Earnings before interest, tax, depreciation and amortisation, adjusted to exclude costs associated with acquisitions, restructuring of the Group, share-based payments, impairment, unrealised operating exchange rate movements and the impact of foreign exchange contracts. This is reconciled to the statutory operating profit on page 8. |
|
|
Adjusted operating profit |
Operating profit adjusted to exclude costs associated with acquisitions, restructuring of the Group and amortisation and impairment of acquired intangible assets. This is reconciled to the statutory operating profit on page 8. |
|
|
Adjusted operating profit margin |
Adjusted operating profit as a percentage of revenue. This is calculated on page 8. |
|
|
Last 12 months Adjusted EBITDA |
Earnings before interest, tax, depreciation and amortisation, adjusted to exclude costs associated with acquisitions, restructuring of the Group, share-based payments, impairment, unrealised operating exchange rate movements and the impact of foreign exchange contracts in the 12 months preceding the period end date. This is reconciled on page 16. |
|
|
Adjusted EBITDA margin |
Adjusted EBITDA as a percentage of revenue. This is calculated on page 8. |
|
|
Adjusted EPS |
Adjusted profit after tax per share (reconciliation between statutory profit and adjusted profit shown on page 14). |
|
|
Adjusted income tax expense |
Represents the statutory income tax expense adjusted for the tax effect on adjusting items. In addition, the adjusted income tax expense includes the effect of any tax rate changes. This is reconciled to the statutory income tax charge on page 13. |
|
|
Adjusted profit before tax |
Profit before tax adjusted to exclude amortisation and impairment of acquired intangible assets, costs associated with acquisitions, restructuring of the Group and revaluation of the interest rate swap. This is reconciled to the profit before tax on page 14. |
|
|
Adjusted profit after tax |
The sum of adjusted profit before tax and adjusted income tax expense. This is calculated on page 14. |
|
|
Constant currency growth |
Underlying growth is calculated by excluding the impact of movement in exchange rates. Constant currency growth is reconciled to reported growth on page 12 for revenue, net operating costs, Adjusted EBITDA, Adjusted EBITDA margin and Contracted Forward Revenue. |
To give the reader an idea of the growth of the business without the impact of foreign exchange fluctuations, which may add to the transparency and understanding of the results. |
|
Free cash flow |
Cash flow generated from operations less interest paid, income taxes paid, contingent consideration paid, principal elements of lease payments and purchase of intangible and tangible assets. This is calculated on page 15. |
Indicates the extent to which the Group generates discretionary funds for reinvesting in growth, paying dividends or reducing debt. |
|
Free cash flow conversion |
Free cash flow divided by Adjusted profit before tax. This is calculated on page 15. |
|
|
Invoiced Forward Revenue |
Invoiced Forward Revenue relates to amounts that are invoiced to clients at the statement of financial position date, which relate to future revenue to be recognised. This is reconciled to deferred revenue on page 17. |
Acts as an indication of revenue visibility for the forthcoming period. |
|
Contracted Forward Revenue |
Defined as Invoiced Forward Revenue (as defined above) plus contracted revenue that has not yet been invoiced as at the statement of financial position date. This is reconciled to deferred revenue on page 17. |
|
|
Revenue Visibility |
Defined as Contracted Forward Revenue plus expected revenue from in year renewals, based upon a consistent renewal rate. |
|
|
Net bank debt |
Short and long-term borrowings (excluding lease liabilities) less cash and cash equivalents. This is reconciled on page 16. |
Provides an insight into the debt position of the Group, taking into account current cash resources. |
|
Net bank debt leverage |
Net bank debt calculated as a multiple of the last 12 months Adjusted EBITDA. Detailed calculation is provided on page 16. |
|
|
Net cash flow |
Free cash flow less dividends paid, net M&A costs, acquisition of own shares, cash received on drawdown of loans and cash paid on repayment of loans. This is calculated on page 16. |
Indicates the extent to which the Group generates cash from Adjusted profits. |
|
Operating cash flow conversion |
Cash flow generated from operations divided by Adjusted EBITDA. This is calculated on page 15. |
Indicates the extent to which the Group generates cash from Adjusted EBITDA. |
|
Organic growth |
Organic growth is calculated by excluding the results of acquired businesses. |
The reason we use organic and underlying growth as a metric is to give the reader an idea of the growth of the business without the impact of acquisitions and foreign exchange fluctuations, which may add to the transparency and understanding of the results. This also aids the Directors to review performance on a like-for-like basis. |
|
Underlying growth |
Underlying growth is calculated by excluding the impact of movement in exchange rates and the results of acquired/discontinued/disposed businesses and products. For the current reporting period, underlying growth also includes adjustments relating to complimentary periods and events rephased as a result of disruption in the Middle East. Underlying revenue is reconciled to reported revenue on page 9. Underlying Adjusted EBITDA is reconciled to reported Adjusted EBITDA on page 10. Underlying Contracted Forward Revenue is reconciled to reported Contracted Forward Revenue on page 17. |
Responsibility Statement
We confirm that to the best of our knowledge:
a) the consolidated interim financial statements have been prepared in accordance with the United Kingdom adopted International Accounting Standard 34, "Interim Financial Reporting";
b) the consolidated interim financial statements, which have been prepared in accordance with the applicable set of accounting standards, give a true and fair view of the assets, liabilities, financial position and profit or loss of the issuer, or the undertakings included in the consolidation as a whole as required by DTR 4.2.4R;
c) the interim management report includes a fair review of the information required by DTR 4.2.7R, namely;
i. an indication of important events that have occurred during the first six months of the financial year and their impact on the consolidated interim financial statements; and
ii. a description of the principal risks and uncertainties for the remaining six months of the financial year.
d) the interim management report includes, as required by DTR 4.2.8R, a fair review of material related party transactions that have taken place in the first six months of the financial year and any material changes in the related-party transactions described in the Annual Report and Accounts for the year ended 31 December 2025 that could have a material effect on the financial position or performance of the enterprise in the first six months of the current financial year.
Approved by the Board on 14 September 2026 and signed on its behalf by:

Mike Danson
Chief Executive
Independent review report to GlobalData Plc
Conclusion
We have been engaged by the company to review the condensed set of financial statements in the half-yearly financial report for the six months ended 30 June 2026 which comprises the consolidated income statement, the consolidated statement of comprehensive income, the consolidated statement of financial position, the consolidated statement of changes in equity, the consolidated statement of cash flows and related notes 1 to 15.
Based on our review, nothing has come to our attention that causes us to believe that the condensed set of financial statements in the half-yearly financial report for the six months ended 30 June 2026 is not prepared, in all material respects, in accordance with United Kingdom adopted International Accounting Standard 34 and the Disclosure Guidance and Transparency Rules of the United Kingdom's Financial Conduct Authority.
Basis for Conclusion
We conducted our review in accordance with International Standard on Review Engagements (UK) 2410 "Review of Interim Financial Information Performed by the Independent Auditor of the Entity" issued by the Financial Reporting Council for use in the United Kingdom (ISRE (UK) 2410). A review of interim financial information consists of making inquiries, primarily of persons responsible for financial and accounting matters, and applying analytical and other review procedures. A review is substantially less in scope than an audit conducted in accordance with International Standards on Auditing (UK) and consequently does not enable us to obtain assurance that we would become aware of all significant matters that might be identified in an audit. Accordingly, we do not express an audit opinion.
As disclosed in note 1, the annual financial statements of the group are prepared in accordance with United Kingdom adopted international accounting standards. The condensed set of financial statements included in this half-yearly financial report has been prepared in accordance with United Kingdom adopted International Accounting Standard 34, "Interim Financial Reporting".
Conclusion Relating to Going Concern
Based on our review procedures, which are less extensive than those performed in an audit as described in the Basis for Conclusion section of this report, nothing has come to our attention to suggest that the directors have inappropriately adopted the going concern basis of accounting or that the directors have identified material uncertainties relating to going concern that are not appropriately disclosed.
This Conclusion is based on the review procedures performed in accordance with ISRE (UK) 2410; however future events or conditions may cause the entity to cease to continue as a going concern.
Responsibilities of the directors
The directors are responsible for preparing the half-yearly financial report in accordance with the Disclosure Guidance and Transparency Rules of the United Kingdom's Financial Conduct Authority.
In preparing the half-yearly financial report, the directors are responsible for assessing the group's ability to continue as a going concern, disclosing as applicable, matters related to going concern and using the going concern basis of accounting unless the directors either intend to liquidate the company or to cease operations, or have no realistic alternative but to do so.
Auditor's Responsibilities for the review of the financial information
In reviewing the half-yearly financial report, we are responsible for expressing to the company a conclusion on the condensed set of financial statements in the half-yearly financial report. Our Conclusion, including our Conclusion Relating to Going Concern, are based on procedures that are less extensive than audit procedures, as described in the Basis for Conclusion paragraph of this report.
Use of our report
This report is made solely to the company in accordance with ISRE (UK) 2410. Our work has been undertaken so that we might state to the company those matters we are required to state to it in an independent review report and for no other purpose. To the fullest extent permitted by law, we do not accept or assume responsibility to anyone other than the company, for our review work, for this report, or for the conclusions we have formed.
Deloitte LLP
Statutory Auditor
Leeds, United Kingdom
14 September 2026
Consolidated Income Statement
|
|
Notes |
|
6 months to 30 June 2026 Unaudited |
6 months to 30 June 2025 Unaudited |
|
Continuing operations |
|
|
£m |
£m |
|
Revenue |
5 |
|
162.9 |
156.5 |
|
Cost of sales |
6 |
|
(83.4) |
(80.2) |
|
Gross profit |
|
|
79.5 |
76.3 |
|
Administrative costs |
6 |
|
(47.7) |
(47.6) |
|
Losses on trade receivables |
6 |
|
(0.7) |
(0.4) |
|
Share of results of associates |
13 |
|
(0.3) |
0.1 |
|
Other income |
|
|
0.1 |
0.1 |
|
Operating profit |
|
|
30.9 |
28.5 |
|
Net finance costs |
8 |
|
(7.7) |
(3.8) |
|
Profit before tax |
|
|
23.2 |
24.7 |
|
Income tax expense |
3 |
|
(9.1) |
(11.1) |
|
Profit for the period |
|
|
14.1 |
13.6 |
|
|
|
|
|
|
|
Attributable to: |
|
|
|
|
|
Equity holders of the parent |
|
|
8.3 |
5.8 |
|
Non-controlling interest |
|
|
5.8 |
7.8 |
|
|
|
|
|
|
|
Earnings per share attributable to equity holders of the parent: |
|
|
|
|
|
Basic earnings per share (pence) |
9 |
|
1.2 |
0.8 |
|
Diluted earnings per share (pence) |
9 |
|
1.2 |
0.8 |
|
|
|
|
|
|
The accompanying notes form an integral part of this financial report.
Consolidated Statement of Comprehensive Income
|
|
|
6 months to 30 June 2026 Unaudited |
6 months to 30 June 2025 Unaudited |
|
|
|
£m |
£m |
|
Profit for the period |
|
14.1 |
13.6 |
|
Other comprehensive income |
|
|
|
|
Items that will be classified subsequently to profit or loss when specific conditions are met: |
|
|
|
|
Net exchange gains/ (losses) on translation of foreign entities |
|
1.5 |
(3.3) |
|
Other comprehensive income/ (loss), net of tax |
|
1.5 |
(3.3) |
|
Total comprehensive income for the period |
|
15.6 |
10.3 |
|
Attributable to: |
|
|
|
|
Equity holders of the parent |
|
9.2 |
4.8 |
|
Non-controlling interest |
|
6.4 |
5.5 |
The accompanying notes form an integral part of this financial report.
Consolidated Statement of Financial Position
|
|
Notes |
|
30 June 2026 Unaudited |
31 December 2025 Audited |
|
|
|
|
£m |
£m |
|
Non-current assets |
|
|
|
|
|
Property, plant and equipment |
|
|
24.8 |
26.0 |
|
Goodwill |
10 |
|
397.2 |
384.6 |
|
Other intangible assets |
10 |
|
110.9 |
106.9 |
|
Investment in associate |
|
|
4.0 |
4.3 |
|
Deferred tax assets |
|
|
13.6 |
19.2 |
|
|
|
|
550.5 |
541.0 |
|
Current assets |
|
|
|
|
|
Trade and other receivables |
|
|
86.5 |
87.2 |
|
Current tax receivable |
|
|
8.7 |
9.7 |
|
Short-term derivative assets |
|
|
0.1 |
0.1 |
|
Cash and cash equivalents |
|
|
48.0 |
51.1 |
|
|
|
|
143.3 |
148.1 |
|
Total assets |
|
|
693.8 |
689.1 |
|
Current liabilities |
|
|
|
|
|
Trade and other payables |
|
|
(39.6) |
(43.1) |
|
Deferred revenue |
5 |
|
(122.7) |
(115.9) |
|
Short-term lease liabilities |
11 |
|
(4.6) |
(4.0) |
|
Current tax payable |
|
|
- |
(2.2) |
|
Short-term derivative liabilities |
|
|
(0.4) |
(0.2) |
|
Short-term provisions |
|
|
(1.5) |
- |
|
|
|
|
(168.8) |
(165.4) |
|
Net current liabilities |
|
|
(25.5) |
(17.3) |
|
Non-current liabilities |
|
|
|
|
|
Long-term trade and other payables |
|
|
- |
(2.4) |
|
Deferred revenue |
5 |
|
(3.0) |
(1.4) |
|
Long-term provisions |
|
|
(5.5) |
(1.9) |
|
Deferred tax liabilities |
|
|
(10.3) |
(6.2) |
|
Long-term lease liabilities |
11 |
|
(19.0) |
(20.5) |
|
Long-term borrowings |
11 |
|
(181.0) |
(165.3) |
|
|
|
|
(218.8) |
(197.7) |
|
Total liabilities |
|
|
(387.6) |
(363.1) |
|
Net assets |
|
|
306.2 |
326.0 |
|
Equity |
|
|
|
|
|
Share capital |
12 |
|
0.2 |
0.2 |
|
Treasury reserve |
12 |
|
(93.1) |
(93.7) |
|
Other reserve |
12 |
|
(44.3) |
(44.3) |
|
Foreign currency translation reserve |
12 |
|
(0.5) |
(1.4) |
|
Retained profit |
|
|
423.1 |
442.8 |
|
Equity attributable to equity holders of the parent |
|
|
285.4 |
303.6 |
|
Non-controlling interest |
12 |
|
20.8 |
22.4 |
|
Total equity |
|
|
306.2 |
326.0 |
The accompanying notes form an integral part of this financial report.
Consolidated Statement of Changes in Equity
|
|
Share capital |
Treasury reserve
|
Other reserve |
Foreign currency translation reserve |
Retained profit |
Equity attributable to equity holders of the parent |
Non-controlling interest |
Total equity |
|
|
£m |
£m |
£m |
£m |
£m |
£m |
£m |
£m |
|
Balance at 1 January 2025 |
0.2 |
(100.6) |
(44.3) |
(1.1) |
549.6 |
403.8 |
17.1 |
420.9 |
|
Profit for the six-month period ended 30 June 2025 |
- |
- |
- |
- |
5.8 |
5.8 |
7.8 |
13.6 |
|
Other comprehensive income: |
|
|
|
|
|
|
|
|
|
Net exchange loss on translation of foreign entities |
- |
- |
- |
(1.0) |
- |
(1.0) |
(2.3) |
(3.3) |
|
Total comprehensive income for the period |
- |
- |
- |
(1.0) |
5.8 |
4.8 |
5.5 |
10.3 |
|
Transactions with owners: |
|
|
|
|
|
|
|
|
|
Gain from completion of sale of 40% of Healthcare business |
- |
- |
- |
- |
7.8 |
7.8 |
(7.8) |
- |
|
Share buyback |
- |
(11.0) |
- |
- |
- |
(11.0) |
- |
(11.0) |
|
Share buyback and cancellation scheme |
- |
- |
- |
- |
(39.7) |
(39.7) |
- |
(39.7) |
|
Dividend |
- |
- |
- |
- |
(7.7) |
(7.7) |
- |
(7.7) |
|
Vesting of share options |
- |
16.9 |
- |
- |
(16.9) |
- |
- |
- |
|
Share-based payments charge |
- |
- |
- |
- |
6.3 |
6.3 |
0.5 |
6.8 |
|
Tax on share-based payments |
- |
- |
- |
- |
(1.6) |
(1.6) |
(0.2) |
(1.8) |
|
Balance at 30 June 2025 |
0.2 |
(94.7) |
(44.3) |
(2.1) |
503.6 |
362.7 |
15.1 |
377.8 |
|
Profit for the six-month period ended 31 December 2025 |
- |
- |
- |
- |
27.3 |
27.3 |
9.2 |
36.5 |
|
Other comprehensive income: |
|
|
|
|
|
|
|
|
|
Net exchange gain on translation of foreign entities |
- |
- |
- |
0.7 |
- |
0.7 |
0.7 |
1.4 |
|
Total comprehensive income for the period |
- |
- |
- |
0.7 |
27.3 |
28.0 |
9.9 |
37.9 |
|
Transactions with owners: |
|
|
|
|
|
|
|
|
|
Share buyback and cancellation scheme |
- |
- |
- |
- |
(62.0) |
(62.0) |
- |
(62.0) |
|
Dividend |
- |
- |
- |
- |
(2.2) |
(2.2) |
- |
(2.2) |
|
Vesting of share options |
- |
1.0 |
- |
- |
(1.0) |
- |
- |
- |
|
Share-based payments credit |
- |
- |
- |
- |
(22.4) |
(22.4) |
(2.4) |
(24.8) |
|
Tax on share-based payments |
- |
- |
- |
- |
(0.5) |
(0.5) |
(0.2) |
(0.7) |
|
Balance at 31 December 2025 |
0.2 |
(93.7) |
(44.3) |
(1.4) |
442.8 |
303.6 |
22.4 |
326.0 |
|
Profit for the six-month period ended 30 June 2026 |
- |
- |
- |
- |
8.3 |
8.3 |
5.8 |
14.1 |
|
Other comprehensive income: |
|
|
|
|
|
|
|
|
|
Net exchange gain on translation of foreign entities |
- |
- |
- |
0.9 |
- |
0.9 |
0.6 |
1.5 |
|
Total comprehensive income for the period |
- |
- |
- |
0.9 |
8.3 |
9.2 |
6.4 |
15.6 |
|
Transactions with owners: |
|
|
|
|
|
|
|
|
|
Share buyback and cancellation scheme |
- |
- |
- |
- |
(18.6) |
(18.6) |
- |
(18.6) |
|
Dividend |
- |
- |
- |
- |
(8.5) |
(8.5) |
- |
(8.5) |
|
Dividend to non-controlling interest |
- |
- |
- |
- |
- |
- |
(8.0) |
(8.0) |
|
Vesting of share options |
- |
0.6 |
- |
- |
(0.6) |
- |
- |
- |
|
Share-based payments credit |
- |
- |
- |
- |
(0.3) |
(0.3) |
- |
(0.3) |
|
Balance at 30 June 2026 |
0.2 |
(93.1) |
(44.3) |
(0.5) |
423.1 |
285.4 |
20.8 |
306.2 |
The accompanying notes form an integral part of this financial report.
Consolidated Statement of Cash Flows
|
Continuing operations
|
Notes |
6 months to 30 June 2026 Unaudited |
6 months to 30 June 2025 Unaudited |
|
Cash flows from operating activities |
|
£m |
£m |
|
Profit for the period |
|
14.1 |
13.6 |
|
Adjustments for: |
|
|
|
|
Depreciation |
|
3.3 |
3.2 |
|
Amortisation |
10 |
9.4 |
7.3 |
|
Impairment |
10 |
3.0 |
- |
|
Net exchange differences |
|
1.2 |
- |
|
Net finance costs |
|
7.7 |
3.8 |
|
Other losses/ (income) |
|
0.2 |
(0.2) |
|
Taxation recognised in profit or loss |
|
9.1 |
11.1 |
|
Share-based payments (credit)/ charge |
12 |
(0.3) |
6.8 |
|
Decrease in trade and other receivables |
|
6.7 |
12.3 |
|
(Decrease)/ increase in trade and other payables |
|
(4.3) |
9.3 |
|
Revaluation of short- and long-term derivatives |
|
0.4 |
(1.3) |
|
Movement in provisions |
|
0.3 |
0.2 |
|
Cash generated from continuing operations |
|
50.8 |
66.1 |
|
Interest paid |
|
(6.5) |
(3.2) |
|
Income taxes paid |
|
(3.6) |
(13.3) |
|
Contingent consideration paid |
|
(0.8) |
(0.3) |
|
Total cash flows generated from operating activities |
|
39.9 |
49.3 |
|
Cash flows from investing activities |
|
|
|
|
Acquisitions, net of cash acquired |
14 |
(22.1) |
(8.2) |
|
Purchase of property, plant and equipment |
|
(0.5) |
(1.6) |
|
Purchase of intangible assets |
10 |
(3.4) |
(2.3) |
|
Total cash flows used in investing activities |
|
(26.0) |
(12.1) |
|
Cash flows from financing activities |
|
|
|
|
Proceeds from borrowings |
11 |
15.0 |
37.0 |
|
Settlement of borrowings in relation to acquisitions |
14 |
(1.1) |
- |
|
Loan refinancing fee |
|
- |
(0.5) |
|
Settlement of hire purchase liability |
|
(0.1) |
- |
|
Settlement of related party liability |
13 |
(0.9) |
- |
|
Acquisition of own shares for cancellation |
12 |
(18.6) |
(39.7) |
|
Acquisition of own shares |
12 |
- |
(11.0) |
|
Principal elements of lease payments |
11 |
(3.2) |
(2.8) |
|
Dividends paid |
|
(8.5) |
(7.7) |
|
Total cash flows used in financing activities |
|
(17.4) |
(24.7) |
|
Net (decrease)/ increase in cash and cash equivalents |
|
(3.5) |
12.5 |
|
Cash and cash equivalents at beginning of period |
|
51.1 |
50.5 |
|
Effects of currency translation on cash and cash equivalents |
|
0.4 |
(3.0) |
|
Cash and cash equivalents at end of period |
|
48.0 |
60.0 |
The accompanying notes form an integral part of this financial report.
Notes to the Interim Financial Statements
1. General information
Nature of operations
The principal activity of GlobalData Plc and its subsidiaries (together 'the Group'), is to provide an intelligence and productivity platform that empowers leaders to act decisively in a world of complexity and change. By uniting proprietary data, human expertise, and purpose-built AI into a single, connected platform, we help organisations to see what's coming, move faster, and lead with confidence.
GlobalData Plc ('the Company') is a company incorporated in the United Kingdom (England & Wales) and trades on the main market for listed securities ("Main Market") of London Stock Exchange plc, therefore is publicly owned and limited by shares. The registered office of the Company is John Carpenter House, John Carpenter Street, London, EC4Y 0AN. The registered number of the Company is 03925319.
Basis of preparation
These interim financial statements are for the six months ended 30 June 2026. They have been prepared in accordance with United Kingdom adopted International Accounting Standard 34, "Interim Financial Reporting". They do not include all of the information required for full annual financial statements and should be read in conjunction with GlobalData Plc's audited financial statements for the year ended 31 December 2025.
The financial information for the year ended 31 December 2025 set out in this interim report does not constitute statutory accounts as defined in Section 434 of the Companies Act 2006. The Group's statutory financial statements for the year ended 31 December 2025 have been filed with the Registrar of Companies and can be found on the Group's website www.globaldata.com. The independent auditors' report on the full financial statements for the year ended 31 December 2025 was unqualified and did not contain an emphasis of matter paragraph or any statement under section 498 of the Companies Act 2006.
These interim financial statements have been prepared on the historical cost basis, except for derivative financial instruments, which are measured at fair value.
The interim financial statements are presented in Pounds Sterling (£), which is also the functional currency of the Company. These interim financial statements have been approved for issue by the Board of Directors.
Critical accounting estimates and judgements
In the application of the Group's accounting policies, which are described in the Annual Report and Accounts, the Group is required to make judgements, estimates and assumptions about the carrying amounts of assets and liabilities that are not readily apparent from other sources. The estimates and associated assumptions are based on historical experience and other factors that are considered to be relevant. Actual results may differ from these estimates. The same accounting policies and methods of computation are followed in the Consolidated Financial Statements for the six months ended 30 June 2026 as compared with the most recent Annual Report and Accounts. There are no critical accounting judgements or key sources of estimation uncertainty relating to climate-related risks.
Critical accounting judgements
As at 31 December 2025, Management identified a critical accounting judgement in relation to identification of cash-generating units. As at 30 June 2026, Management's assessment of this judgement remains unchanged from that which was disclosed in the most recent Annual Report and Accounts.
Key sources of estimation uncertainty
Management have assessed that there are no key sources of estimation uncertainty as at 30 June 2026.
Principal and emerging risks and uncertainties
The Directors consider that the principal and emerging risks and uncertainties facing the Group as at 30 June 2026, and looking forwards into H2 2026, are consistent with those reported within the Strategic Report of the annual financial statements for the year ended 31 December 2025. The key risks identified were as follows:
|
= |
Business and strategic risks: Product; Cyber and IT; People; Market (Competition and Clients); Economic and Geo-political; Acquisition and Integration. |
|
= |
Operational risks: Data Privacy; Regulatory Compliance and Artificial Intelligence. |
Climate change remains an emerging risk for the Group and one that the Board continues to monitor closely. However, as a data and analytics company in which our products are created and distributed digitally, our carbon footprint is considerably smaller than those of many other companies of our size. Therefore, we have concluded that climate change (including existing and emerging regulatory requirements related to climate change) does not represent a principal risk to our business.
Going concern
The Group meets its day-to-day working capital requirements through free cash flow. The Group has closing cash of £48.0m as at 30 June 2026 and net bank debt of £133.0m (31 December 2025: net bank debt of £114.2m), being cash and cash equivalents less short and long-term borrowings, excluding lease liabilities. During December 2024, the Group secured debt financing facilities which would mature in December 2027 (with an option to extend further by a year). The facilities comprised of a £200.0m facility for the Healthcare business ('Healthcare facility') and a separate £185.0m facility for the rest of the Group ('Non-Healthcare facility'). As at 30 June 2026, the Group had drawn £37.0m from the Healthcare facility and £146.0m from the Non-Healthcare facility. During July 2026, the Group secured further financing headroom, upsizing its Non-Healthcare facility by £60.0m to £245.0m (on a new three-year term ending in July 2029 with one year extension option) as well as extending the £200.0m Healthcare facility by a further year to December 2028. The Group drew down £30.0m from the Non-Healthcare facility during July 2026.
The finance facilities were issued with debt covenants which are measured on a quarterly basis. There have been no breaches of covenants in the period ended 30 June 2026. Management has reviewed forecast cash flows and there is no indication that there will be any breach in the next 12 months.
The Directors have a reasonable expectation that there are no material uncertainties that cast significant doubt about the Group's ability to continue in operation and meet its liabilities as they fall due for the foreseeable future, being a period of at least 12 months from the date of approval of the interim financial statements. To complete the going concern assessment the Directors have modelled a base case for each of the two Group segments through to December 2027 (aligned with the two separate facilities) and applied sensitivities to model a reasonable worst-case scenario for each, considering the mitigations available should the future financial performance of the business reflect the reasonable worse-case scenario. The base case models assume that the Group's financial performance is consistent with the full year forecast for 2026 followed by future year growth rates based on Management's expectation of future performance. Under the two base case models, the Group maintains a significant level of positive liquidity headroom. The Directors have applied reasonable downside sensitivities to each base case model, acknowledging that such risks and uncertainties exist. The downside scenarios modelled included the following assumptions:
|
= |
Healthcare: A combined scenario with revenue in 2026 being 2.0% lower than expectation and costs in 2026 being 1.0% higher than expectation, resulting in a net reduction to 2026 Adjusted EBITDA of 5.4%. The impact of this scenario on 2027 was revenue being 4.4% lower than expectation and costs being 0.1% higher than expectation, resulting in a net reduction to 2027 Adjusted EBITDA of 9.2%.
|
|
= |
Non-Healthcare: A combined scenario with revenue in 2026 being 1.1% lower than expectation and costs in 2026 being 2.0% higher than expectation, resulting in a net reduction to 2026 Adjusted EBITDA of 11.3%. The impact of this scenario on 2027 was revenue being 2.5% lower than expectation and costs being 0.3% higher than expectation, resulting in a net reduction to 2027 Adjusted EBITDA of 11.5%.
|
The Group maintains liquidity and there remains headroom on the covenants during the period running to December 2027 under each scenario modelled across the two segments. The available mitigations identified provided further liquidity and improved covenant headroom to those within the downside scenario models.
Through our normal business practices, we are in regular communication with our lenders and are satisfied they will be in a position to continue supporting us for the foreseeable future.
Although the statement of financial position shows net current liabilities (current assets less current liabilities), included in current liabilities is £122.7m of deferred revenue that represents future income earnings. Excluding deferred revenue held within current liabilities, the Group has net current assets of £97.2m (31 December 2025: £98.6m).
The Directors therefore consider the strong balance sheet, with good cash reserves and working capital along with financing arrangements, provides ample liquidity. Accordingly, the Directors have prepared the Interim results on a going concern basis.
2. Accounting policies
This interim report has been prepared based on the accounting policies detailed in the Group's financial statements for the year ended 31 December 2025, which have been applied consistently. The annual financial statements of the Group are prepared in accordance with United Kingdom adopted international accounting standards. The financial statements also comply with International Financial Reporting Standards (IFRSs) as issued by the IASB.
Presentation of non-statutory alternative performance measures
The Directors believe that Adjusted EBITDA, Adjusted EBITDA margin, Adjusted operating profit, Adjusted operating profit margin, Adjusted profit before tax, Adjusted profit after tax and Adjusted earnings per share provide additional useful information on the operational performance of the Group to shareholders, and we review the results of the Group using these measures internally. The term 'adjusted' is not a defined term under IFRS and may not therefore be comparable with similarly titled profit measures reported by other companies. It is not intended to be a substitute for, or superior to, IFRS measures of profit.
Adjustments are made to Adjusted EBITDA and Adjusted operating profits in respect of:
|
Restructuring and corporate projects |
The Group excludes these costs where the nature of the item, or its size, is not related to the operational performance of the Group and allows for comparability of underlying results.
|
|
Acquisition and integration costs (including contingent consideration) |
|
|
Amortisation and impairment of acquired intangible assets |
The amortisation charge for those intangible assets recognised on business combinations is excluded since they are non-cash charges arising from historical investment activities. Any impairment charges recognised in relation to these intangible assets are also excluded. This is a common adjustment made by acquisitive information service businesses and is therefore consistent with peers. Revenues associated with acquisitions, in the year of acquisition, are excluded from the calculation of underlying revenue. |
Adjustments are additionally made to Adjusted EBITDA in respect of:
|
Share-based payments and associated costs |
Share-based payment expenses are excluded from Adjusted EBITDA as they are a predominantly non-cash charge and the awards are equity-settled. |
|
Impairment |
The Group excludes these costs from Adjusted EBITDA where the nature of the item, or its size, is not related to the operational performance of the Group and allows for comparability of underlying results. |
|
Revaluation of short- and long-term derivatives |
Gains and losses are recognised within Adjusted EBITDA when they are realised in cash terms and therefore we exclude non-cash movements arising from fluctuations in exchange rates which better aligns Adjusted EBITDA with the cash performance of the business. |
|
Unrealised operating foreign exchange gain/loss |
3. Taxation
Income tax on the profit or loss for the period comprises current and deferred tax.
Current tax is the expected tax payable on the taxable income for the period, using rates enacted or substantively enacted at the reporting date, and any quantifiable adjustments to the tax payable in respect of previous years.
Deferred taxation is provided in full on temporary differences between the carrying amount of the assets and liabilities in the financial statements and the tax base. Deferred tax assets are recognised only to the extent that it is probable that future taxable profits will be available against which the temporary difference can be utilised. Deferred tax is determined using the tax rates that have been enacted or substantively enacted by the reporting date and are expected to apply when the deferred tax liability is settled or the deferred tax asset is realised.
Tax is recognised in the income statement for interim reporting purposes using the tax rate that would be applicable to expected total annual earnings, being the estimated average annual effective income tax rate applied to the pre-tax income of the interim period. To the extent practicable, a separate estimated average annual effective income tax rate is determined for each tax jurisdiction and applied individually to the interim period pre-tax income of each jurisdiction. Similarly, if different income tax rates apply to different categories of income (such as capital gains), to the extent practicable, a separate rate is applied to each individual category of interim period pre-tax income.
A standard rate of corporation tax is applied in each jurisdiction to interim items affecting net income that are unusual because of their nature, size or incidence.
The major components of income tax expense in the interim consolidated income statement are:
|
Income taxes |
|
6 months to 30 June 2026 Unaudited |
6 months to 30 June 2025 Unaudited |
|
|
|
£m |
£m |
|
Current income tax expense |
|
2.3 |
9.6 |
|
Deferred income tax expense relating to origination and reversal of temporary differences |
|
6.8 |
1.5 |
|
Income tax expense recognised in income statement |
|
9.1 |
11.1 |
4. Segment analysis
The principal activity of GlobalData Plc and its subsidiaries (together 'the Group'), a data, insight, and technology group, is to provide decision-makers across the world's most successful companies with the intelligence to act with conviction. Our connected platform uniquely integrates proprietary data, expert insight, and purpose-built AI into a unified operating system that powers the next generation of intelligence solutions.
IFRS8 "Operating Segments" requires the segment information presented in the financial statements to be that which is used internally by the Chief Operating Decision Maker (CODM) to evaluate the performance of the business and to decide how to allocate resources. The Group has identified the Chief Executive as its Chief Operating Decision Maker.
The fundamental principle of the GlobalData business model is to provide our clients with subscription access to our proprietary data, analytics, and insights platform, with the offering of ancillary services such as consulting, single copy reports and events. The Group's two reportable segments are 'Data, Analytics and Insights: Non-Healthcare' and 'Data, Analytics and Insights: Healthcare'. The results of the two segments are reported to the Group Chief Executive on a monthly basis.
There is no difference between the Group's operating segments and the Group's reportable segments.
Each segment generates revenue from services provided over a period of time such as recurring subscriptions and other services which are deliverable at a point in time such as reports, events and custom research. The services differ by subject matter which have been grouped into the categories of: Non-Healthcare and Healthcare. There is no material trade between segments.
The Group profit or loss along with Adjusted EBITDA by segment is reported to the Chief Executive on a monthly basis, the Chief Executive also monitors revenue within the operating segments.
The Group considers the use of two operating segments to be appropriate due to:
· The Chief Executive reviewing Adjusted EBITDA at the Group level and segment level on a monthly basis;
· Each segment engages in business activities from which it earns revenues and incurs expenses; and
· Discrete financial information is available for each segment.
Each operating segment is assessed by the Board on an Adjusted EBITDA basis. Reportable segment Adjusted EBITDA is used to measure performance as management believes that such information is most relevant in evaluating the results of the reportable segments.
A reconciliation of revenue to Profit after Tax on a reportable segment basis is set out below:
|
Period ended 30 June 2026 |
DA&I: Non-Healthcare Unaudited £m |
DA&I: Healthcare
Unaudited £m |
Corporate
Unaudited £m |
Total
Unaudited £m |
|
Revenue |
97.7 |
65.2 |
- |
162.9 |
|
Operating costs |
(73.6) |
(33.6) |
(0.9) |
(108.1) |
|
Adjusted EBITDA |
24.1 |
31.6 |
(0.9) |
54.8 |
|
Share-based payments charge |
(0.4) |
(0.1) |
- |
(0.5) |
|
Amortisation of acquired intangibles |
(5.1) |
(1.8) |
- |
(6.9) |
|
Restructuring and corporate projects |
(1.1) |
(0.9) |
(2.6) |
(4.6) |
|
Acquisition and integration costs |
(0.3) |
(1.0) |
- |
(1.3) |
|
Costs relating to share-based payments scheme |
(0.4) |
- |
- |
(0.4) |
|
Revaluation gain/ (loss) on short- and long-term derivatives |
0.1 |
(0.5) |
- |
(0.4) |
|
Unrealised operating foreign exchange gain/ (loss) |
0.1 |
(1.1) |
- |
(1.0) |
|
Impairment of acquired intangibles |
(0.9) |
(2.1) |
- |
(3.0) |
|
Depreciation |
(2.5) |
(0.8) |
- |
(3.3) |
|
Amortisation (excluding amortisation of acquired intangible assets) |
(2.4) |
(0.1) |
- |
(2.5) |
|
Finance costs |
(5.4) |
(2.3) |
- |
(7.7) |
|
Taxation |
(2.8) |
(6.3) |
- |
(9.1) |
|
Profit/ (loss) after tax |
3.0 |
14.6 |
(3.5) |
14.1 |
|
Period ended 30 June 2025 |
DA&I: Non-Healthcare Unaudited £m |
DA&I: Healthcare
Unaudited £m |
Corporate
Unaudited £m |
Total
Unaudited £m |
|
Revenue |
96.6 |
59.9 |
- |
156.5 |
|
Operating costs |
(72.4) |
(31.1) |
(0.9) |
(104.4) |
|
Adjusted EBITDA |
24.2 |
28.8 |
(0.9) |
52.1 |
|
Share-based payments charge |
(5.5) |
(1.3) |
- |
(6.8) |
|
Amortisation of acquired intangibles |
(4.7) |
(1.2) |
- |
(5.9) |
|
Restructuring and corporate projects |
(1.7) |
(1.2) |
(3.3) |
(6.2) |
|
Acquisition and integration costs |
(3.2) |
(0.2) |
- |
(3.4) |
|
Costs relating to share-based payments scheme |
(0.4) |
- |
- |
(0.4) |
|
Revaluation gain on short- and long-term derivatives |
0.7 |
0.6 |
- |
1.3 |
|
Unrealised operating foreign exchange gain/ (loss) |
(2.0) |
4.4 |
- |
2.4 |
|
Depreciation |
(2.3) |
(0.9) |
- |
(3.2) |
|
Amortisation (excluding amortisation of acquired intangible assets) |
(1.4) |
- |
- |
(1.4) |
|
Finance costs |
(1.5) |
(2.3) |
- |
(3.8) |
|
Taxation |
(4.0) |
(7.1) |
|
(11.1) |
|
Profit/ (loss) after tax |
(1.8) |
19.6 |
(4.2) |
13.6 |
Segment assets and liabilities
Segment assets and liabilities are reported to the CODM in accordance with the management approach defined in IFRS 8: Operating Segments. The Group identifies its reportable segments as Data, Analytics & Insights: Non-Healthcare and Data Analytics & Insights: Healthcare. For balance sheet review, the CODM monitors Data, Analytics & Insights: Healthcare by reviewing the total assets and liabilities held within the separately carved out Healthcare legal entities. All other assets and liabilities held by the Group, including the Data, Analytics & Insights: Non-Healthcare segment, are reported within the 'Remaining Group'. A summary is presented below which reconciles to the Consolidated Statement of Financial Position. Measurements are consistent with the Group's accounting policies. Comparative information has been provided below.
|
As at 30 June 2026 |
DA&I: Healthcare
£m |
Remaining Group
£m |
Total Reported to CODM £m |
Reclassifications*
£m |
Total
£m |
|
Non-current assets |
101.2 |
449.3 |
550.5 |
- |
550.5 |
|
Current assets |
68.3 |
75.0 |
143.3 |
- |
143.3 |
|
Total assets |
169.5 |
524.3 |
693.8 |
- |
693.8 |
|
|
|
|
|
|
|
|
Current liabilities |
(69.7) |
(100.9) |
(170.6) |
1.8 |
(168.8) |
|
Non-current liabilities |
(47.7) |
(169.3) |
(217.0) |
(1.8) |
(218.8) |
|
Total liabilities |
(117.4) |
(270.2) |
(387.6) |
- |
(387.6) |
* Certain balances reported to the CODM have been reclassified to conform with the presentation in the Consolidated Statement of Financial Position.
|
As at 31 December 2025 |
DA&I: Healthcare
£m |
Remaining Group
£m |
Total Reported to CODM £m |
Reclassifications*
£m |
Total
£m |
|
Non-current assets |
78.3 |
462.7 |
541.0 |
- |
541.0 |
|
Current assets |
73.8 |
74.3 |
148.1 |
- |
148.1 |
|
Total assets |
152.1 |
537.0 |
689.1 |
- |
689.1 |
|
|
|
|
|
|
|
|
Current liabilities |
(53.7) |
(115.5) |
(169.2) |
3.8 |
(165.4) |
|
Non-current liabilities |
(42.4) |
(151.5) |
(193.9) |
(3.8) |
(197.7) |
|
Total liabilities |
(96.1) |
(267.0) |
(363.1) |
- |
(363.1) |
* Certain balances reported to the CODM have been reclassified to conform with the presentation in the Consolidated Statement of Financial Position.
5. Revenue
The Group generates revenue from services provided over a period of time such as recurring subscriptions and other services which are deliverable at a point in time such as reports, events and custom research.
Subscription income for online services, data and analytics (typically 12 months) is normally invoiced at the beginning of the services and is therefore recognised as a contract liability, "deferred revenue", in the statement of financial position. Revenue is recognised evenly over the period of the contractual term as the performance obligations are satisfied evenly over the term of subscription.
The revenue on services delivered at a point in time is recognised when our contractual obligation is satisfied, such as delivery of a static report or delivery of an event. The obligation on these types of contracts is a discrete obligation, which once met satisfies the Group performance obligation under the terms of the contract.
Any invoiced contracted amounts which are still subject to performance obligations and where the payment has been received or is contractually due are recognised within deferred revenue at the statement of financial position date. Typically, the Group receives settlement of cash at the start of each contract and standard terms are zero days. Similarly, if the Group satisfies a performance obligation before it receives the consideration or is contractually due the Group recognises a contract asset within accrued income in the statement of financial position.
|
|
Revenue recognised in the Consolidated Income Statement |
Deferred Revenue recognised within the Consolidated Statement of Financial Position
|
||
|
|
Period ended 30 June 2026 Unaudited |
Period ended 30 June 2025 Unaudited |
As at 30 June 2026 Unaudited |
As at 31 December 2025 Audited |
|
|
£m |
£m |
£m |
£m |
|
Services transferred: |
|
|
|
|
|
Over a period of time |
123.3 |
116.0 |
99.8 |
89.6 |
|
At a point in time |
39.6 |
40.5 |
25.9 |
27.7 |
|
Total |
162.9 |
156.5 |
125.7 |
117.3 |
As subscriptions are typically for periods of 12 months the majority of deferred revenue held at the balance sheet date will be recognised in the income statement in the following 12 months. As at 30 June 2026, £3.0m (31 December 2025: £1.4m) of the deferred revenue balance will be recognised beyond the next 12 months and therefore has been presented within non-current liabilities within the consolidated statement of financial position.
In instances where the Group enters into transactions involving a range of the Group's services, for example a subscription and custom research, the total transaction price for a contract is allocated amongst the various performance obligations based on their relative stand-alone selling prices.
Geographical analysis
Our primary geographical markets are serviced by our global sales teams which are organised as Europe, US and Asia Pacific by virtue of the team location. The below disaggregated revenue is derived from the geographical location of our customers rather than the team structure the Group is organised by. The geographical analysis is calculated based on sales order data apportioned over the Group's revenue for each financial period.
From continuing operations
|
6 months to 30 June 2026 Unaudited |
UK |
Europe |
Americas |
Asia Pacific |
MENA1 |
Rest of World |
Total |
|
|
|
|
£m |
£m |
£m |
£m |
£m |
£m |
£m |
||
|
Revenue from external customers |
25.6 |
40.2 |
65.3 |
14.4 |
11.7 |
5.7 |
162.9 |
||
|
6 months to 30 June 2025 Unaudited |
UK |
Europe |
Americas |
Asia Pacific |
MENA1 |
Rest of World |
Total |
|
|
£m |
£m |
£m |
£m |
£m |
£m |
£m |
|
Revenue from external customers |
25.7 |
42.0 |
57.3 |
14.5 |
12.1 |
4.9 |
156.5 |
1. Middle East & North Africa
6. Operating profit
Operating profit is stated after the following expenses relating to continuing operations:
|
|
|
6 months to 30 June 2026 Unaudited |
6 months to 30 June 2025 Unaudited |
|
|
|
£m |
£m |
|
Cost of sales |
|
83.4 |
80.2 |
|
Administrative costs |
|
47.7 |
47.6 |
|
|
|
131.1 |
127.8 |
|
Losses on trade receivables |
|
0.7 |
0.4 |
|
Total operating expenses |
|
131.8 |
128.2 |
7. Adjusting items
|
|
6 months to 30 June 2026 Unaudited |
6 months to 30 June 2025 Unaudited |
|
|
£m |
£m |
|
Share-based payments charge |
0.5 |
6.8 |
|
Amortisation of acquired intangibles |
6.9 |
5.9 |
|
Restructuring and corporate projects |
4.6 |
6.2 |
|
Acquisition and integration costs |
1.3 |
3.4 |
|
Costs relating to share-based payments scheme |
0.4 |
0.4 |
|
Revaluation loss/ (gain) on short- and long-term derivatives |
0.4 |
(1.3) |
|
Unrealised operating foreign exchange loss/ (gain) |
1.0 |
(2.4) |
|
Impairment of acquired intangibles |
3.0 |
- |
|
Total adjusting items |
18.1 |
19.0 |
The adjustments made are as follows:
|
= |
The share-based payments charge is in relation to the share-based compensation plans (detailed in note 12) under which the entity receives services from employees as consideration for equity instruments (options) of the Group. The fair value of the employee services received in exchange for the grant of the options and awards is recognised as an expense in the income statement. The total amount to be expensed is determined by reference to the fair value of the options granted. The original fair value on grant date is charged to the income statement based upon the Monte-Carlo method. Following modification on 30 November 2022, an additional charge for the beneficial modification was determined by the Black-Scholes method. The options vest once certain financial targets have been achieved. The £0.5m charge for the period is a net of (i) a credit of £0.3m in relation to revaluation to fair value of options which currently have no set vesting target and (ii) a charge of £0.8m incurred on payout of the exceptional STIP awards disclosed in the Annual Report and Accounts for the year ended 31 December 2025. No charge has been accrued within the current period in relation to the future targets of Schemes 2 and 4 as it is Management's judgement that the targets are unlikely to be met. |
|
= |
The amortisation charge for those intangible assets recognised on business combinations. |
|
= |
Restructuring costs totalling £2.0m have been recognised within the Group (HY 2025: £2.9m), which have principally arisen as a result of exit costs linked to restructuring projects and rates costs linked to offices which the Group has exited. |
|
= |
Corporate projects costs of £2.6m (HY 2025: £3.3m) have been recognised which relate to costs associated with the AIM to Main Market movement. |
|
= |
Acquisition and integration costs includes legal and professional fees and integration related expenses incurred in relation to acquisitions made by the Group during the period (see note 14). Included within this category are contingent consideration amounts of £0.04m (HY 2025: £0.9) relating to payments due to the previous owners of Ai Palette. These have been treated as remuneration costs due to being contingent upon the former owners remaining as employees of the Group at the time of payment. |
|
= |
Costs relating to share-based payments scheme consist of professional fees incurred in advice obtained relating to the scheme and costs associated with a legal claim connected with the share-based payments scheme. |
|
= |
The revaluation of short and long-term derivatives relates to movement in the fair value of the short and long-term derivatives. |
|
= |
Unrealised operating foreign exchange gains and losses relate to non-cash exchange losses and gains made on operating items. |
|
= |
Impairment charges relate to impairment of customer relationship balances totalling £3.0m across the Group. |
8. Net finance costs
|
|
|
6 months to 30 June 2026 Unaudited |
6 months to 30 June 2025 Unaudited |
|
|
|
£m |
£m |
|
Loan interest cost |
|
7.2 |
3.2 |
|
Lease interest cost |
|
0.6 |
0.6 |
|
Other interest cost |
|
0.1 |
- |
|
Other interest income |
|
(0.2) |
- |
|
|
|
7.7 |
3.8 |
9. Earnings per share
The calculation of the basic earnings per share is based on the earnings attributable to ordinary shareholders of the parent company divided by the weighted average number of shares in issue during the period. The Group also has a share options scheme in place and therefore the Group has calculated the dilutive effect of these options.
|
|
6 months to 30 June 2026 Unaudited |
6 months to 30 June 2025 Unaudited |
|
Earnings per share attributable to equity holders from continuing operations: |
|
|
|
Basic |
|
|
|
Profit for the period attributable to equity shareholders (£m) |
14.1 |
13.6 |
|
Less: non-controlling interest (£m) |
(5.8) |
(7.8) |
|
Profit for the period attributable to ordinary shareholders of the parent company (£m) |
8.3 |
5.8 |
|
Weighted average number of shares (no' m) |
705.7 |
765.9 |
|
Basic earnings per share (pence) |
1.2 |
0.8 |
|
Diluted |
|
|
|
Profit for the period attributable to equity shareholders (£m) |
14.1 |
13.6 |
|
Less: non-controlling interest (£m) |
(5.8) |
(7.8) |
|
Profit for the period attributable to ordinary shareholders of the parent company (£m) |
8.3 |
5.8 |
|
Weighted average number of shares (no' m) |
706.4 |
767.1 |
|
Diluted earnings per share (pence) |
1.2 |
0.8 |
Reconciliation of basic weighted average number of shares to the diluted weighted average number of shares:
|
|
|
6 months to 30 June 2026 Unaudited No' m |
6 months to 30 June 2025 Unaudited No' m |
|
Basic weighted average number of shares, net of shares held in Treasury reserve |
|
705.7 |
765.9 |
|
Dilutive share options in issue - scheme 1 |
|
0.7 |
0.7 |
|
Dilutive share options in issue - scheme 2 |
|
- |
0.5 |
|
Dilutive share options in issue - scheme 4 |
|
- |
- |
|
Diluted weighted average number of shares |
|
706.4 |
767.1 |
The diluted earnings per share calculation does not include performance-related share options where the performance criteria had not been met in the period, in accordance with IAS 33. The table below shows the number of share options which could become dilutive should future performance criteria be met.
|
Potentially dilutive shares |
2026 |
2027 |
2028 |
2029 |
Total |
|
Schedule |
No. |
No. |
No. |
No. |
No. |
|
Scheme 2 |
- |
- |
2,517,859 |
2,517,859 |
5,035,718 |
|
Scheme 4 |
- |
- |
7,084,557 |
7,079,558 |
14,164,115 |
|
Total |
- |
- |
9,602,416 |
9,597,417 |
19,199,833 |
10. Intangible assets
|
|
AUC* |
Software |
Customer relationships |
Brands
|
IP rights and database |
Goodwill |
Total |
|
|
£m |
£m |
£m |
£m |
£m |
£m |
£m |
|
Cost |
|
|
|
|
|
|
|
|
As at 1 January 2026 |
2.8 |
31.2 |
97.3 |
37.7 |
94.0 |
395.5 |
658.5 |
|
Additions: Business combinations |
- |
0.3 |
11.6 |
1.2 |
- |
12.5 |
25.6 |
|
Additions: Internally developed |
3.1 |
0.3 |
- |
- |
- |
- |
3.4 |
|
Transfer AUC to software |
(1.2) |
1.2 |
- |
- |
- |
- |
- |
|
Fair value adjustments |
- |
- |
- |
- |
- |
0.1 |
0.1 |
|
As at 30 June 2026 |
4.7 |
33.0 |
108.9 |
38.9 |
94.0 |
408.1 |
687.6 |
|
|
|
|
|
|
|
|
|
|
Amortisation and Impairment |
|
|
|
|
|
|
|
|
As at 1 January 2026 |
- |
(23.2) |
(52.9) |
(16.7) |
(63.3) |
(10.9) |
(167.0) |
|
Additions: Business combinations |
- |
(0.1) |
- |
- |
- |
- |
(0.1) |
|
Charge for the period |
- |
(2.5) |
(3.6) |
(1.2) |
(2.1) |
- |
(9.4) |
|
Impairment |
- |
- |
(3.0) |
- |
- |
- |
(3.0) |
|
As at 30 June 2026 |
- |
(25.8) |
(59.5) |
(17.9) |
(65.4) |
(10.9) |
(179.5) |
|
|
|
|
|
|
|
|
|
|
Net book value |
|
|
|
|
|
|
|
|
As at 30 June 2026 |
4.7 |
7.2 |
49.4 |
21.0 |
28.6 |
397.2 |
508.1 |
|
As at 31 December 2025 |
2.8 |
8.0 |
44.4 |
21.0 |
30.7 |
384.6 |
491.5 |
*AUC: Assets under construction which will be transferred to software post development.
Impairment and review of useful lives
During the period, an indicator of impairment was identified regarding customer relationship assets acquired through business combinations, driven by lower renewal rates than originally forecasted at the acquisition dates. In accordance with IAS 36 'Impairment of Assets', Management performed a targeted impairment test on customer relationship assets.
Consequently, an impairment charge of £3.0 million was recognised to reduce the carrying value of these specific assets to their recoverable amount. The remaining useful economic lives of these specific customer relationship assets have also been shortened based on the current renewal rates.
No other impairment indicators were identified on other intangible assets and goodwill allocated to CGUs. Hence, their carrying values remain fully supported.
11. Borrowings and lease liabilities
|
|
|
30 June 2026 Unaudited £m |
31 December 2025 Audited £m |
|
Short-term lease liabilities |
|
4.6 |
4.0 |
|
Current liabilities |
|
4.6 |
4.0 |
|
|
|
30 June 2026 Unaudited £m |
31 December 2025 Audited £m |
|
Long-term lease liabilities |
|
19.0 |
20.5 |
|
Long-term borrowings |
|
181.0 |
165.3 |
|
Non-current liabilities |
|
200.0 |
185.8 |
Revolving Capital Facility ('RCF') and Acquisition and Capex Facility ('ACF')
On 18 December 2024, the Group completed on two new three-year debt financing facilities to give the Group additional funding to support the long-term growth of the business, including M&A. The details of the facilities are as follows:
|
|
Healthcare Facility |
Non-Healthcare Facility |
|
|
Date of agreement |
18 December 2024 |
||
|
Term of agreement |
3 years with 1 year extension option. |
||
|
Type of facility |
Multi-currency RCF and ACF. |
||
|
Lenders in syndicate |
8 lenders. |
||
|
Fixed repayments |
None, full drawn down balance repayable at date of termination of agreement. |
||
|
Available facility |
£130.0m RCF and £70.0m ACF. |
£135.0m RCF and £50.0m ACF. |
|
|
Interest payable on drawn element |
Agreed margin based upon covenant test result (currently 2.25% for the Healthcare facility and 3.0% for the Non-Healthcare facility at 30 June 2026) plus Sterling Overnight Index Average rate (SONIA), paid at the end of each calendar quarter. |
||
|
Interest payable on undrawn element |
0.35% of margin on drawn element. |
||
|
Total drawdown |
£37.0m as at 30 June 2026 (31 December 2025: £37.0m). |
£146.0m as at 30 June 2026 (31 December 2025: £131.0m). |
|
During July 2026, the Group secured further financing headroom, upsizing its Non-Healthcare facility by £60.0m to £245.0m (on a new three-year term with 1 year extension option) as well as extending the £200.0m Healthcare facility by a further year to December 2028. As part of the amendments, within both facilities, the ACF element has been transferred into RCF facilities. The Group drew down £30.0m from the Non-Healthcare facility during July 2026.
As of July 2026, the revised loan facilities can be summarised as follows:
|
|
Healthcare Facility |
Non-Healthcare Facility |
|
|
Date of agreement |
18 December 2024 |
22 July 2026 |
|
|
Term of agreement |
3 years with 1 year extension, which has been executed. |
3 years with 1 year extension option. |
|
|
Type of facility |
RCF |
RCF |
|
|
Lenders in syndicate |
8 lenders. |
8 lenders. |
|
|
Fixed repayments |
None, full drawn down balance repayable at date of termination of agreement. |
|
|
|
Available facility |
£200.0m |
£245.0m |
|
|
Interest payable on drawn element |
Agreed margin based upon covenant test result plus Sterling Overnight Index Average rate (SONIA), paid at the end of each calendar quarter. |
||
|
Interest payable on undrawn element |
0.35% of margin on drawn element. |
||
Lease payments not recognised as a liability
The Group has elected not to recognise a lease liability for short term leases (leases with an expected term of 12 months or less) or for leases of low value assets. Payments made under such leases are expensed on a straight-line basis. In addition, certain variable lease payments are not permitted to be recognised as lease liabilities and are expensed as incurred. The expense relating to payments not included in the measurement of a lease liability is £0.7m for the period ended 30 June 2026 (HY 2025: £0.2m).
The changes in the Group's borrowings can be classified as follows:
|
|
|
|
Long-term borrowings |
Short-term lease liabilities
|
Long-term lease liabilities
|
Total
|
|
|
|
|
£m |
£m |
£m |
£m |
|
As at 1 January 2026 |
|
|
165.3 |
4.0 |
20.5 |
189.8 |
|
Cash flows: |
|
|
|
|
|
|
|
- Drawdown of RCF |
|
|
15.0 |
- |
- |
15.0 |
|
- Repayment |
|
|
- |
(3.2) |
- |
(3.2) |
|
Non-cash: |
|
|
|
|
|
|
|
- Interest expense |
|
|
0.7 |
- |
- |
0.7 |
|
- Lease additions |
|
|
- |
1.3 |
- |
1.3 |
|
- Lease liabilities |
|
|
- |
1.0 |
- |
1.0 |
|
- Reclassification |
|
|
- |
1.5 |
(1.5) |
- |
|
As at 30 June 2026 |
|
|
181.0 |
4.6 |
19.0 |
204.6 |
12. Equity
Share capital
|
Allotted, called up and fully paid: |
|
|
|
|
|
|
|
|
30 June 2026 |
31 December 2025 |
||||
|
|
No'000s |
Percentage of Total Shares |
£000s |
No'000s |
Percentage of Total Shares |
£000s |
|
Ordinary shares at 1 January (£0.0001) |
764,741 |
|
76 |
830,895 |
|
83 |
|
Cancellation of shares: share buyback programme |
(17,810) |
|
(1) |
(66,154) |
|
(7) |
|
Ordinary shares at reporting period end (£0.0001) |
746,931 |
99.99 |
75 |
764,741 |
99.99 |
76 |
|
Deferred shares of £1.00 each |
100 |
0.01 |
100 |
100 |
0.01 |
100 |
|
Total authorised, allotted, called up and fully paid |
747,031 |
100 |
175 |
764,841 |
100 |
176 |
Share Purchases
During the period ended 30 June 2026, the Group's Employee Benefit Trust purchased an aggregate amount of nil shares (which represents 0.0% of the total share capital), each with a nominal value of £0.0001 per share, at a total market value of £nil. The purchased shares will be held for the purpose of satisfying the exercise of share options under the Company's Employee Share Option Plan.
During the period ended 30 June 2026, a total of 320,000 shares (which represents 0.0% of the total share capital), each with a nominal value of £0.0001 per share, which were held by the Group's Employee Benefit Trust, were utilised as a result of the vesting of share options. The weighted average price of the exercised options at the date of vesting was £1.84 per share.
The maximum number of shares held by the Employee Benefit Trust (at any time during the period ended 30 June 2026) was 50,779,215 (representing 6.8% of the total share capital).
The purchase of shares by the trust is to limit the eventual dilution to existing shareholders. As at 30 June 2026, the trust holds sufficient shares in respect of all share options currently in issue.
|
Vesting Schedule |
2026 No. |
2027 No. |
2028 No. |
2029 No. |
Total No. |
|
Scheme 1* |
656,537 |
- |
- |
- |
656,537 |
|
Scheme 2 |
- |
- |
2,517,859 |
2,517,859 |
5,035,718 |
|
Scheme 4 |
- |
- |
7,084,557 |
7,079,558 |
14,164,115 |
|
Total |
656,537 |
- |
9,602,416 |
9,597,417 |
19,856,370 |
|
Shares held in trust |
(656,537) |
- |
(9,602,416) |
(9,597,417) |
(19,856,370) |
|
Net dilution |
- |
- |
- |
- |
- |
*The remaining share options in Scheme 1 can be exercised anytime until August 2033 and therefore for the purposes of this analysis we have assumed they will be exercised during the second half of 2026.
Share Purchases for Cancellation
The Group has continued its share purchases for cancellation programmes during the period. The purpose of the share buyback programmes is to return surplus capital to shareholders and reduce the Group's share capital. As such, all ordinary shares repurchased by the Group under the share buyback programmes were cancelled.
Total purchases and cancellations during the period ended 30 June 2026 were £18.6m (HY 2025: £39.7m).
Capital management
The Group's capital management objectives are:
· To ensure the Group's ability to continue as a going concern; and
· To fund future growth and provide an adequate return to shareholders and, when appropriate, distribute dividends.
The capital structure of the Group typically consists of net bank debt, which includes borrowings (note 11) and cash and cash equivalents, and equity.
The Company has two classes of shares. The ordinary shares carry no right to fixed income and each share carries the right to one vote at general meetings of the Company.
The deferred shares do not confer upon the holders the right to receive any dividend, distribution or other participation in the profits of the Company. The deferred shares do not entitle the holders to receive notice of or to attend and speak or vote at any general meeting of the Company. On distribution of assets on liquidation or otherwise, the surplus assets of the Company remaining after payments of its liabilities shall be applied first in repaying to holders of the deferred shares the nominal amounts and any premiums paid up or credited as paid up on such shares, and second the balance of such assets shall belong to and be distributed among the holders of the ordinary shares in proportion to the nominal amounts paid up on the ordinary shares held by them respectively.
There are no specific restrictions on the size of a holding nor on the transfer of shares, which are both governed by the general provisions of the Articles of Association and prevailing legislation. The Directors are not aware of any agreements between holders of the Company's shares that may result in restrictions on the transfer of securities or on voting rights.
No person has any special rights of control over the Company's share capital and all its issued shares are fully paid.
With regard to the appointment and replacement of Directors, the Company is governed by its Articles of Association, the Companies Act and related legislation. The Articles themselves may be amended by special resolution of the shareholders. The powers of Directors are described in the Board Terms of Reference, copies of which are available on request.
Dividends
The final dividend for 2025 was 1.2 pence per ordinary share and was paid on 1 May 2026. The Board has announced an interim dividend of 0.3 pence per ordinary share. The interim dividend will be paid on 23 October 2026 to shareholders on the register at the close of business on 25 September 2026. The ex-dividend date will be on 24 September 2026.
Treasury reserve
The treasury reserve represents the cost of shares held in the Group's Employee Benefit Trust for the purpose of satisfying the exercise of share options under the Company's Employee Share Option Plan.
Other reserve
Other reserve consists of a reserve created upon the reverse acquisition of TMN Group Plc in 2009.
Non-controlling interest
The put option in relation to the sale of 40% of the Group's Healthcare business was exercised on 4 June 2024. At this point the sale had been committed to, and legal completion followed shortly afterwards on 28 June 2024, with the Group receiving gross cash proceeds of £451.4m, of which £8.0m was recognised as a related party loan due to Monument Bidco Limited (an Inflexion investment company) at the point of completion which was capitalised during December 2024. As a result of this sale, in line with the provisions of IFRS10: Consolidated Financial Statements, the Group recognised non-controlling interest (NCI) within equity which represents 40% of the Healthcare business sub-group's statement of financial position as at the date of recognition of NCI which was determined as 4 June 2024, being the date the put option was exercised.
Since initial recognition of NCI on 4 June 2024, the following has been allocated to NCI:
· 40% of the Healthcare business sub-group's profit after tax;
· 40% of the Healthcare business sub-group's tax entries which have been recognised directly in reserves;
· 40% of the movement on the Healthcare sub-group's share-based payment reserve; and
· 40% of the movement on the Healthcare sub-group's foreign currency translation reserve.
During June 2025, a completion accounts adjustment totalling £19.6m was recognised in respect of the sale of GD UK Healthcare Limited (and its subsidiaries) from GlobalData Plc to Washington Bidco Limited, resulting in an adjustment to NCI and Group retained profits of £7.8m.
Summarised financial information in respect of the Group's non-controlling interest is set out below, as at 30 June 2026 the non-controlling interest represents 40% non-controlling interest in the Group's Healthcare business:
|
|
30 June 2026 Unaudited £m |
31 December 2025 Audited £m |
|
Statement of Financial Position Summary: |
|
|
|
Non-current assets |
101.2 |
78.3 |
|
Current assets |
68.3 |
73.8 |
|
Current liabilities |
(69.7) |
(53.7) |
|
Non-current liabilities |
(47.7) |
(42.4) |
|
Equity attributable to owners of the Company |
52.1 |
56.0 |
|
|
|
|
|
Non-controlling interest |
20.8 |
22.4 |
|
|
Period ended 30 June 2026 Unaudited £m |
Period ended 30 June 2025 Unaudited £m |
|
Income Statement Summary: |
|
|
|
Revenue |
65.2 |
59.9 |
|
Profit after tax |
14.6 |
19.6 |
|
Other comprehensive income/ (expense) |
1.5 |
(5.8) |
|
Total comprehensive income |
16.1 |
13.8 |
|
Total comprehensive income - non-controlling interest |
6.4 |
5.5 |
|
|
|
|
|
Statement of Cash Flows Summary: |
|
|
|
Cash flows generated from operating activities |
28.0 |
32.8 |
|
Cash flows used in investing activities |
(21.3) |
(6.9) |
|
Cash flows used in financing activities |
(14.9) |
(1.1) |
|
Total cash flows |
(8.2) |
24.8 |
Foreign currency translation reserve
The foreign currency translation reserve contains the translation differences that arise upon translating the results of subsidiaries with a functional currency other than Sterling. Such exchange differences are recognised in the income statement in the period in which a foreign operation is disposed of.
Share-based payments
Scheme 1
The Group created a share option scheme during the year ended 31 December 2010 and granted the first options under the scheme on 1 January 2011 to certain senior employees. Each option granted converts to one ordinary share on exercise. A participant may exercise their options (subject to employment conditions) at any time during a prescribed period from the vesting date to the date the option lapses. For these options to be exercised the Group's earnings before interest, taxation, depreciation and amortisation, as adjusted by the Remuneration Committee for significant or one-off occurrences, needed to exceed certain targets. The final financial target for the colleague share option scheme (scheme 1) was met with the 2021 results. During the years ended 31 December 2022 to 31 December 2025, the majority of participants chose to exercise their options, with 0.7m options being deferred as at 31 December 2025, as allowable under the scheme rules. During the period ended 30 June 2026, there were no exercises of deferred options. The remaining 0.7m options can be exercised by participants at any point before August 2033, subject to compliance with the Company's Share Dealing Code. LTIP Scheme 1 is now closed.
Scheme 2
In October 2019 the Group created and announced a new share option scheme and granted the first options under the scheme on 31 October 2019 to certain senior employees. Each option granted converts to one ordinary share on exercise. A participant may exercise their options subject to employment conditions and performance targets being met. For these options to vest the Group's earnings before interest, taxation, depreciation and amortisation, as adjusted by the Remuneration Committee for significant or one-off occurrences, needs to exceed certain targets between 2023 to 2028. The EBITDA target for 2025 was not met, therefore no options vested within this scheme during the period ended 30 June 2026.
Scheme 4
In October 2021 the Group created the 2021 share option scheme (scheme 4). Scheme 4 is targeted at management and senior colleagues below the Executive Management Committee level. The EBITDA targets for Scheme 4 are aligned to Scheme 2, however different proportions of granted options will vest once each target is reached. As noted above, the EBITDA target for 2025 was not met, therefore only a small number of options which were not linked to set targets vested during the period ended 30 June 2026, totalling 0.3m.
The total charge recognised for these schemes during the six months to 30 June 2026 was £0.5m (30 June 2025: £6.8m). The £0.5m charge for the period is a net of (i) a credit of £0.3m in relation to revaluation to fair value of options which currently have no set vesting target and (ii) a charge of £0.8m incurred on payout of the exceptional STIP awards disclosed in the Annual Report and Accounts for the year ended 31 December 2025. No charge has been accrued within the current period in relation to the future targets of Schemes 2 and 4 as it is Management's judgement that the targets are unlikely to be met. The awards of the schemes are settled with ordinary shares of the Company.
13. Related party transactions
The Board has put in place an additional control framework to ensure related party transactions are well controlled and managed. Related party transactions are overseen by the Audit and Risk Committee which:
o Oversees all related party transactions;
o Ensures transactions are in the best interests of GlobalData and its wider stakeholders; and
o Ensures all transactions are recorded and disclosed on an arm's length basis.
The Group has taken advantage of the exemptions contained within IAS24: Related Party Disclosures from the requirement to disclose transactions between wholly owned Group companies as these have been eliminated on consolidation.
Related Party Transactions: Ultimate Controlling Party
Mike Danson, GlobalData's Chief Executive, owned 60.8% of the Company's ordinary shares as at 30 June 2026 and 61.4% as at 14 September 2026 and is therefore the Company's ultimate controlling party. Mike Danson owns a number of other businesses, a small number of which interact with GlobalData Plc.
During the six months to 30 June 2026, the following related party transactions were entered into by the Group:
Corporate support services
During the period ended 30 June 2026 net corporate support charges of £0.01m were charged to NS Media Group Limited ("NSMGL") and net corporate support charges of £0.03m were charged to Estel Property Investments No.3 Limited ("Estel"), both companies are related parties by virtue of common ownership (HY 2025: £0.01m charge from NSMGL and £0.04m charge to Estel). In both 2026 and 2025 the corporate support charges primarily consisted of a share of the India management team cost and recharged salary costs.
Business Trade Media International Limited ('BTMI')
The Group completed the acquisition of BTMI on 30 August 2024, which was a related party (by virtue of being indirectly owned by Mike Danson). During the period ended 30 June 2026, total recharges from NSMGL in relation to BTMI were £0.04m (HY 2025: £0.1m).
Sales distribution
NSMGL acted as a sales distributor for some GlobalData products. On these transactions they charged agent fees of £0.001m during the period ended 30 June 2026 (HY 2025: £0.03m).
Balances Outstanding
As at 30 June 2026, the total balance receivable from NSMGL was £nil (31 December 2025: £0.007m) and the total balance receivable from Estel was £0.03m (31 December 2025: £nil). There is no specific credit loss provision in place in relation to this receivable and the total expense recognised during the period in respect of bad or doubtful debts was £nil.
Related Party Transactions: Directors and Key Management Personnel
Investment in SIA - Strategy In Action Limited
On 4 June 2024, the Group made an investment of 16.95% in the ordinary share capital of SIA - Strategy in Action Limited ("SiA") for cash consideration of £4.0m. As a result of ordinary share issues made by the company since June 2024, the Group's shareholding as at 30 June 2026 was 16.29%. The Group has representation on the Board and Julien Decot is a common Non-Executive Director across both the Group and SiA. Management assessed that the Group exercises significant influence over SiA, therefore the investment is accounted for using the equity method. The carrying amount of the investment has been adjusted for the Group's share of the post-acquisition profits or losses of SiA (totalling £0.1m loss for the period ended 30 June 2026 (HY 2025: £0.1m profit), which has been recognised in the Group's profit or loss) plus the Group's share of the post-acquisition change in other comprehensive income of SiA (totalling £nil for the period ended 30 June 2026 (HY 2025: £nil), which has been recognised within other comprehensive income of the Group). In addition, the Group has recognised the impact of dilution of shareholding within profit or loss during the period, totalling a loss of £0.2m for the period ended 30 June 2026 (HY 2025: £nil). As a result of the shareholding, the Group is exposed to financial risks including potential funding requirements and exposure to potential future losses; however given the size of the shareholding these risks are not deemed significant to the Group.
Directors and Key Management Personnel Remuneration
The remuneration of Directors is disclosed within the Directors' Remuneration Report within the Group's Annual Report and Accounts for the year ended 31 December 2025.
Balances Outstanding
There were no balances outstanding in relation to Directors and Key Management Personnel as at 30 June 2026 (31 December 2025: £nil).
Related Party Transactions: Inflexion Private Equity Partners LLP
Management Fees
For the period ended 30 June 2026, management fees charged from the Inflexion group of companies to the Group totalled £0.2m (HY 2025: £0.2m).
Balances Outstanding
On 22 June 2026, Washington Topco Limited declared a dividend of £20.0m. £12.0m (representing 60%) of the dividend was cash settled to GlobalData Plc prior to 30 June 2026, however £8.0m (representing 40%) payable to Inflexion Private Equity Partners LLP was outstanding as at 30 June 2026. There were no other balances outstanding in relation to the Inflexion group of companies as at 30 June 2026 (31 December 2025: £nil).
Related Party Transactions: Non-wholly owned subsidiaries
Washington Topco Limited and its subsidiaries are 60% owned, as such, the exemption to disclose transactions between group companies in accordance with IAS 24 does not apply. Transactions entered into with a member of the group of companies owned by Washington Topco Limited, and outstanding balances between the parties as at the period end are presented below.
Balances Outstanding
|
Counterparty - Entity outside of Washington Topco Limited subgroup
|
Counterparty - Entity within Washington Topco Limited subgroup
|
Balance owed from/(to) as at 30 June 2026 £m |
Balance owed from/(to) as at 30 June 2025 £m |
|
GlobalData UK Limited |
GD UK Healthcare Limited |
0.5 |
1.1 |
|
GlobalData US, Inc |
Global Data Publications, Inc |
(0.5) |
- |
|
GlobalData Plc |
GD UK Healthcare Limited |
0.1 |
(0.6) |
|
GlobalData Plc |
Washington Bidco Limited |
- |
8.8 |
|
LMC Automotive US, Inc |
Global Data Publications, Inc |
- |
0.6 |
|
GlobalData Australia Pty Limited |
GD UK Healthcare Limited |
- |
0.3 |
|
GlobalData Australia Pty Limited |
GD Healthcare Australia Pty Limited |
- |
0.2 |
|
GlobalData UK Limited |
GD Healthcare Japan KK |
- |
0.1 |
|
GlobalData Plc |
Global Data Publications, Inc |
- |
(1.0) |
|
GlobalData UK Limited |
GlobalData Trading (Shanghai) Co Limited |
- |
(0.4) |
|
|
|
0.1 |
9.1 |
Transactions
|
Counterparty From - Entity outside of Washington Topco Limited subgroup
|
Counterparty To - Entity within Washington Topco Limited subgroup
|
Recharges during period ended 30 June 2026 £m |
Recharges during period ended 30 June 2025 £m |
|
GlobalData UK Limited |
GD UK Healthcare Limited |
2.8 |
4.0 |
|
GD Research Centre Private Limited |
Vatrix Healthcare Data India Private Limited |
0.2 |
- |
|
GlobalData Information Services (Shanghai) Co. Ltd |
GlobalData Trading (Shanghai) Co Limited |
0.1 |
- |
|
GlobalData US, Inc |
Global Data Publications, Inc |
- |
0.4 |
|
GlobalData Australia Pty Limited |
GD Healthcare Australia Pty Limited |
- |
0.1 |
|
GlobalData Japan KK |
GD Healthcare Japan KK |
- |
0.1 |
|
|
|
3.1 |
4.6 |
|
Counterparty From - Entity within Washington Topco Limited subgroup
|
Counterparty To - Entity outside of Washington Topco Limited subgroup
|
Recharges during period ended 30 June 2026 £m |
Recharges during period ended 30 June 2025 £m |
|
Global Data Publications, Inc |
GlobalData US, Inc |
0.9 |
0.3 |
|
GD UK Healthcare Limited |
GlobalData Plc |
0.1 |
0.5 |
|
Global Data Publications, Inc |
GlobalData Plc |
- |
1.0 |
|
GD Healthcare Canada Inc |
GlobalData Plc |
- |
0.1 |
|
|
|
1.0 |
1.9 |
Related Party Transactions: Other Related Parties
Balances Outstanding
As at 31 December 2024, there was an outstanding loan note due to the pre-existing management of the Deallus group of companies amounting to £1.0m, generated as a result of the Deallus acquisition which completed on 31 December 2024. This was initially repayable on 30 June 2025 and accrued interest at a semi-annual compounded rate of 12%. The repayment date for the loan note was formally extended to 28 February 2026, and interest has continued to accrue on the same basis. In February 2026, £0.8m of the original principle was settled on the exit of a former member of the Deallus management. In June 2026, £0.1m was settled and redeemed in full by a different former member of the Deallus management. No further extension has been formally signed on the remaining outstanding balance; however, interest has continued to accrue on the same basis to 30 June 2026.
Following the Cambridge Healthcare Research Limited acquisition on 1 April 2026, a further £0.7m of loan notes were issued to the pre-existing management on the same terms as the loan notes already in issue.
As of 30 June 2026, the total liability in respect of loan notes in issue is £0.8m, being the principle plus accrued unpaid interest.
14. Acquisitions
Cambridge Healthcare Research Limited
On 1 April 2026, the Group acquired the entire share capital of Cambridge Healthcare Research Limited and its non-trading wholly owned subsidiary for cash consideration of £21.3m plus issuance of a loan note of £0.7m which has been classified as an amount owed to related parties within the Consolidated Statement of Financial Position. Cambridge Healthcare Research is a market-leading competitive intelligence (CI) solutions provider focused on the global life sciences sector. The acquisition creates the opportunity for the Group to build deeper, more embedded relationships with major brands within the pharmaceutical sector and creates the potential for GlobalData to deliver more value to our clients.
The amounts recognised for each class of assets and liabilities at the acquisition date were as follows:
|
|
|
Carrying value |
Fair value adjustments |
Fair value |
|
|
|
£m |
£m |
£m |
|
Intangible assets consisting of: |
|
|
|
|
|
Customer relationships |
|
- |
11.6 |
11.6 |
|
Trade names |
|
- |
1.2 |
1.2 |
|
Net assets acquired consisting of: |
|
|
|
|
|
Property, plant and equipment |
|
0.5 |
- |
0.5 |
|
Intangible assets |
|
0.2 |
- |
0.2 |
|
Cash and cash equivalents |
|
0.7 |
- |
0.7 |
|
Trade and other receivables |
|
4.5 |
- |
4.5 |
|
Trade and other payables |
|
(4.6) |
0.1 |
(4.5) |
|
Short-term borrowings |
|
(1.5) |
- |
(1.5) |
|
Deferred tax |
|
- |
(3.2) |
(3.2) |
|
Fair value of net (liabilities)/ assets acquired |
|
(0.2) |
9.7 |
9.5 |
The goodwill recognised in relation to the acquisition is as follows:
|
Fair value |
||||
|
£m |
||||
|
Consideration paid in cash |
|
|
|
21.3 |
|
Consideration settled via issuance of related party loan note |
|
|
|
0.7 |
|
Less net assets acquired |
|
|
|
(9.5) |
|
Goodwill |
|
|
|
12.5 |
In line with the provision of IFRS3, fair value adjustments may be made within the 12-month period from the date of acquisition which would result in an adjustment to the goodwill balance reported above. The goodwill that arose on the combination can be attributed to the assembled workforce, know-how and research methodology. The fair values of the identified intangible assets were calculated in line with the policies detailed within the Group's Annual Report and Accounts for the year ended 31 December 2025. The amount of goodwill which is expected to be deductible for tax purposes is £nil.
The Group incurred legal and professional expenses of £0.4m in relation to the acquisition, of which £0.2m were recognised in adjusting items in the Consolidated Income Statement in the period ended 30 June 2026, with the balance of £0.2m being recognised in adjusting items in the prior financial year. In the period from the date of acquisition to 30 June 2026, the trade of Cambridge Healthcare Research generated revenues of £4.2m and profit before tax of £0.1m. If the acquisition had occurred on 1 January 2026, Group revenue would have been £166.8m and Group profit before tax would have been £22.5m.
Cash Cost of Acquisitions
The cash cost of acquisitions comprises:
|
|
Period to 30 June 2026 Unaudited |
Period to 30 June 2025 Unaudited |
|
|
£m |
£m |
|
Presented within Operating Activities |
|
|
|
Acquisition of Jobdig, Inc: |
|
|
|
Contingent consideration |
0.4 |
- |
|
Acquisition of Ai Palette: |
|
|
|
Contingent consideration |
0.4 |
- |
|
Acquisition of MBI: |
|
|
|
Contingent consideration |
- |
0.3 |
|
|
0.8 |
0.3 |
|
|
Period to 30 June 2026 Unaudited |
Period to 30 June 2025 Unaudited |
|
|
£m |
£m |
|
Presented within Investing Activities |
|
|
|
Acquisition of Cambridge Healthcare Research: |
|
|
|
Cash consideration |
21.3 |
- |
|
Cash acquired |
(0.7) |
- |
|
Acquisition of Jobdig, Inc: |
|
|
|
Contingent consideration |
1.5 |
- |
|
Working capital adjustment |
- |
0.1 |
|
Acquisition of Ai Palette: |
|
|
|
Cash consideration |
- |
6.0 |
|
Cash acquired |
- |
(1.0) |
|
Payment to Ai Palette Pte. Ltd to fund purchase of non-controlling interest in its subsidiary to bring ownership to 100% (not included within consideration) |
- |
1.8 |
|
Acquisition of Celent: |
|
|
|
Transaction bonuses settled |
- |
0.1 |
|
Acquisition of Deallus: |
|
|
|
Working capital adjustment |
- |
1.2 |
|
|
22.1 |
8.2 |
|
|
Period to 30 June 2026 Unaudited |
Period to 30 June 2025 Unaudited |
|
|
£m |
£m |
|
Presented within Financing Activities |
|
|
|
Acquisition of Cambridge Healthcare Research: Settlement of borrowings (not included within consideration) |
1.1 |
- |
|
|
1.1 |
- |
15. Subsequent events
As disclosed within note 11, during July 2026, the Group secured further financing headroom, upsizing its Non-Healthcare facility by £60.0m to £245.0m (on a new three-year term with 1 year extension option) as well as extending the £200.0m Healthcare facility by a further year to December 2028. As part of the amendments, within both facilities, the ACF element has been transferred into RCF facilities. The Group drew down £30.0m from the Non-Healthcare facility during July 2026.
On 13 August 2026, the Group completed a second Tender Offer, which resulted in the purchase and cancellation of shares with a total value of £30.0m.
Advisers
Company Secretary
Bob Hooper
Head Office and Registered Office
John Carpenter House
John Carpenter Street
London
EC4Y 0AN
Tel: + 44 (0) 20 7936 6400
Joint Broker
J.P. Morgan Cazenove
25 Bank Street
Canary Wharf
London
E14 5JP
Joint Broker
Panmure Gordon
One New Change
London
EC4M 9AF
Joint Broker
Numis Securities
45 Gresham Street
London
EC2V 7BF
Financial PR LLP
FTI Consulting
200 Aldersgate
Aldersgate Street
London
EC1A 4HD
Lawyers
Reed Smith
20 Primrose Street
London
EC2A 2RS
Auditor
Deloitte LLP
1 City Square
Leeds
LS1 2AL
Registrars
MUFG Corporate Markets
Central Square
29 Wellington Street
Leeds
LS1 4DL
Advisers (continued)
Bankers
NatWest Group
280 Bishopsgate
London
EC2M 4RB
Bankers
HSBC UK Bank Plc
1 Centenary Square
Birmingham
B1 1HQ
Registered number
Company No. 03925319
RNS may use your IP address to confirm compliance with the terms and conditions, to analyse how you engage with the information contained in this communication, and to share such analysis on an anonymised basis with others as part of our commercial services. For further information about how RNS and the London Stock Exchange use the personal data you provide us, please see our Privacy Policy.

Latest directors dealings
- 9 minutes ago Jardine Matheson Holdings Ltd (Singapore Reg)
- 30 minutes ago Mitchells & Butlers
- 46 minutes ago Prudential
- 1 hour ago Oxford Instruments
- 1 hour ago BHP Group Limited NPV (DI)