Full Year Results
Summary by AI BETAClose X
2 March 2026

GlobalData Plc
Full Year Results
31 December 2025
Resilient performance: Primed for Growth in AI Age
- A year of transformation - positive traction with solutions strategy
- AI is driving customer engagement with increased AI Hub adoption
- Strategic investment phase completed
- Enter 2026 with strong revenue visibility and a strengthened team focused on execution
GlobalData Plc (AIM: DATA, GlobalData, the Group), data, insight, and technology company, today publishes its results for the year ended 31 December 2025 (FY25).
· Total revenue growth of 13% to £322.1m (2024: £285.5m), underlying revenue growth1 of 1%.
· Adjusted EBITDA1 of £110.2m (2024: £116.8m) impacted by investment in cost base and M&A integration (-6%).
· Profit before tax for the year grew by £14.3m to £69.2m (2024: £54.9m), inclusive of a credit of £20.5m on share-based payments.
· Underlying Contracted Forward Revenue1 growth of 3% (reported growth of 5%), providing good visibility into 2026.
· Final dividend proposed at 1.2p (2024: 1.0p), an increase of 20%.
· Two further acquisitions during 2025, strengthening our Consumer and innovation offerings; revenue synergies remain a significant opportunity.
· Admission to the Main Market of the London Stock Exchange ("Main Market") expected at 8.00am on 5 March 2026.
Mike Danson, Chief Executive Officer of GlobalData Plc, commented:
"2025 has been a year of resilient performance for GlobalData, in a business environment that remains uncertain. We have continued to successfully embed our solutions-led sales model, and while the reorganisation is taking time to fully implement, it is already strengthening customer engagement, improving collaboration across teams, and building a quality pipeline. We are seeing the early benefits of that in forward revenue visibility and deeper, expanding client relationships.
Our vision is to transform the future of work and having invested over several years, we see AI as a key enabler for internal efficiencies and unlocking value for our customers. We have seen rapid adoption of our AI Hub by more than 90% of our customers, highlighting demand for our AI-enabled solutions. Our proprietary data and expert insights are mission-critical to our customers' decision-making in fast evolving marketplaces, reinforcing the need for real time, trusted intelligence.
We enter 2026 with c.80% of analyst revenue consensus already contracted, providing visibility with a strengthened platform and team focused on execution, innovation and long-term value creation."
Highlights
Financial results for the year ended 31 December 2025.
|
Key performance metrics |
2025 |
2024 |
Growth
|
Underlying growth1 |
|
Revenue |
£322.1m |
£285.5m |
+13% |
+1% |
|
Operating profit |
£81.2m |
£65.1m |
+25% |
|
|
Operating profit margin |
25% |
23% |
+2 pts |
|
|
Adjusted EBITDA1 |
£110.2m |
£116.8m |
-6% |
|
|
Adjusted EBITDA margin1 |
34% |
41% |
-7 pts |
|
|
Profit before tax (PBT) |
£69.2m |
£54.9m |
+26% |
|
|
Earnings per share (EPS) |
4.4p |
3.8p |
+16% |
|
|
Adjusted EPS (restated)1 |
7.3p |
5.1p |
+43% |
|
|
Total dividends |
1.5p |
2.5p |
-40% |
|
|
Contracted Forward Revenue1 |
£179.7m |
£171.4m |
+5% |
+3% |
|
Net (bank debt)/ cash1 |
(£114.2m) |
£10.1m |
-1231% |
|
FINANCIAL HIGHLIGHTS
Resilient growth despite market headwinds
|
· |
Delivered 13% revenue growth to £322.1m (2024: £285.5m) in a challenging environment, demonstrating the strength of our diversified platform and strategic M&A execution, whilst navigating currency headwinds.
|
|
· |
Underlying revenue growth of 1% (2024: 4%) underpinned by consistent volume renewal rates, reflecting the resilience and stickiness of our customer base.
|
Strategic investment phase with clear line of sight to margin recovery
|
· |
Adjusted EBITDA of £110.2m (2024: £116.8m) and margin of 34% (2024: 41%) reflect the impact of investments in Growth Transformation Plan initiatives, including sales expansion and senior leadership strengthening, alongside the short-term dilutive impact of six acquisitions during their initial integration phase.
|
|
· |
Operating profit grew 25% to £81.2m, reflecting the reduction in Adjusted EBITDA offset by a non-cash share-based payment credit of £20.5m.
|
|
· |
Profit before tax grew by £14.3m to £69.2m (2024: £54.9m), a 26% increase on prior year, albeit this includes a share-based payment credit of £20.5m.
|
Robust cash generation and capital discipline
|
· |
Operating cash flow of £83.3m (2024: £97.6m) remained robust despite cash costs of acquisitions, integration, restructuring and transformation, underscoring the cash-generative nature of the business model.
|
High revenue visibility underpins confidence
|
· |
Contracted Forward Revenue grew 5% to £179.7m (2024: £171.4m), with 3% underlying growth, and alongside our predictable renewal base provides approximately 80% visibility over company compiled analyst revenue consensus for 2026, a testament to the predictability and resilience of our recurring revenue model.
|
Progressive shareholder returns
|
· |
Proposed final dividend of 1.2p (2024: 1.0p), representing 20% growth and reflecting confidence in the business trajectory.
|
OPERATIONAL HIGHLIGHTS
Strengthened commercial infrastructure and market position
|
· |
Significant operational transformation and a challenging macro-economic environment have slowed our underlying growth for the year.
|
|
· |
Restructured go-to-market organisation with expanded sales capacity and new strategic account management framework, whilst successfully integrating six acquisitions into the business and platform.
|
|
· |
We exit the year with 3% underlying growth in Contracted Forward Revenue (reported growth 5%), which includes significant contract wins from 2025.
|
Enhanced platform capabilities through measured AI integration
|
· |
The foundation of our business model is a strong defensive moat around high quality and proprietary data and insights. Augmentation of AI gives us opportunity across internal efficiency, customer productivity and experience, as well as opening potential new revenue channels.
|
|
· |
We have launched several innovative AI-enabled solutions that are already creating value for clients, including digital workers, AVA (AI Research Assistant) and platform wide AI integration.
|
|
· |
Rapid adoption of our AI Hub, with usage increasing twofold during H1 to over 100,000 users. AI Hub is now embedded across the customer base with 90% of customers contracted to an AI Hub enabled product, resulting in a 3x increase in the number of active AI Hub users.
|
|
· |
AI and colleague collaboration has increased the number of users on our platform, enabled through our new licensing structure, and driven greater customer adoption and usage in terms of views, time on the site and downloads.
|
Disciplined capital allocation
|
· |
Returned over £100m in share buyback programmes, as well as £11m contribution into the Employee Benefit Trust to manage future dilution.
|
Move to Main Market progressing
|
· |
Admission to the Main Market of the London Stock Exchange expected at 8.00am on 5 March 2026.
|
NEW CHIEF FINANCIAL OFFICER APPOINTMENT
|
· |
Robert Kingston to join the Group as Chief Financial Officer as soon as he has served his six-month notice period with his current employer, Keywords Studios. It is expected that he will join the Group in Q3 2026.
|
|
· |
Graham Lilley has informed the Board of his intention to step down from his role as CFO later this year, in order to pursue other opportunities. The Board have mutually agreed with Graham that he will remain in role until after Rob has started, to provide an orderly handover and support a smooth and successful transition. A further update will be made in due course.
|
CURRENT TRADING AND OUTLOOK
We enter 2026 with strong revenue visibility for 2026, providing confidence for the year ahead. The strength of the revenue visibility reflects:
|
· |
Contracted Forward Revenue, booked as at 31 December 2025. |
|
· |
Consistent renewal rates across both Healthcare and Non-Healthcare divisions. |
|
· |
Growing strategic account momentum as our new sales approach drives deeper client relationships. |
|
· |
The benefit of acquisitions made in 2024 and 2025 now contributing to the base. |
|
· |
Resilient demand for business-critical data and insights despite macro headwinds.
|
We have a clear line of sight to margin expansion as integration activity completes and supported by a well invested cost allowing for strong incremental margins flowing from revenue growth.
Medium-term priorities (2026 and beyond):
|
· |
Accelerate Underlying Growth: Driving our underlying revenue growth to mid-single digits, whilst building the foundations to get back to mid-high-single digit growth and beyond as we look out to the longer term. |
|
· |
Margin Recovery and Expansion: Recover Adjusted EBITDA margins towards 40%, leading to high cash conversion and strong returns on invested capital. |
|
· |
AI Innovation: Expand the capabilities and adoption of our AI Hub, whilst launching new AI-powered products and solutions. |
|
· |
Strategic M&A Execution: Focus is to drive revenue synergies in the Non-Healthcare division from recent acquisitions, but will continue to pursue value-accretive M&A in our Healthcare division. |
|
· |
Continuing to deliver attractive Total Shareholder Returns: Progressive dividend policy and disciplined approach to capital allocation and share buybacks.
|
Note 1: Defined in the explanation of non-IFRS measures on page 26.
ENQUIRIES
|
GlobalData PLC |
|
|
Mike Danson, Chief Executive Officer Graham Lilley, Chief Financial Officer
|
0207 936 6400 |
|
J.P. Morgan Cazenove (Nomad, Joint Broker) |
|
|
Bill Hutchings Mose Adigun
|
0203 493 8000 |
|
Panmure Liberum (Joint Broker) |
|
|
Rupert Dearden James Sinclair-Ford
|
0203 100 2000 |
|
Investec Bank Plc (Joint Broker) |
|
|
Henry Reast Virginia Bull
|
0207 597 5970 |
|
FTI Consulting (Financial PR) |
|
|
Edward Bridges Dwight Burden Emma Hall |
0203 727 1000 globaldata@fticonsulting.com |
|
|
|
Notes to Editors
About GlobalData Plc
GlobalData Plc (AIM: DATA) is a company which provides an intelligence and productivity platform that empowers leaders to act decisively in a world of complexity and change. By uniting proprietary data, human expertise, and purpose-built AI into a single, connected platform, we help organisations to see what's coming, move faster, and lead with confidence. On 6 February 2025, GlobalData announced its intention to apply for its ordinary shares to be admitted to the Equity Shares (commercial company) listing segment of the Official List and to trading on the Main Market ("Admission"). It is expected that Admission will take place at 8.00am on 5 March 2026.
One Platform Model
GlobalData's One Platform model is the foundation of our business and is the result of years of continuous investment, targeted acquisitions, and organic development. This model governs everything we do, from how we develop and manage our products, to our approach to sales and customer success, and supporting business operations At its core, this approach integrates our proprietary data, human expertise, and purpose-built AI into an integrated suite of solutions, designed to serve a broad range of industry markets and customer needs on a global basis. The operational leverage this provides means we can respond rapidly to changing customer needs and market opportunities, and continuously manage and develop products quickly, at scale, with limited capital investment as well as providing unique integration opportunities for M&A.
Strategic Priorities
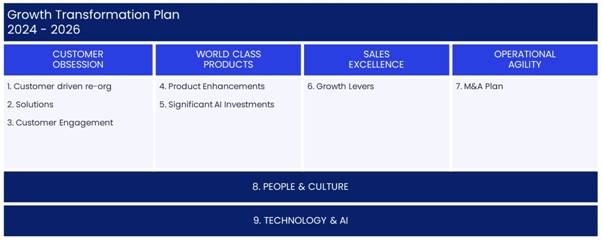
GlobalData's four strategic priorities are: Customer Obsession, World-Class Products, Sales Excellence and Operational Agility.
Cautionary Statement
This results announcement has been prepared solely to provide information to shareholders to assess how the directors have performed their duty to promote the success of the company.
The preliminary statement contains certain forward-looking statements. These statements are made by the directors in good faith based on the information available to them up to the time of their approval of this report and such statements should be treated with caution due to the inherent uncertainties, including both economic and business risk factors, underlying any such forward-looking information.
CHIEF EXECUTIVE'S REVIEW
Building momentum: transformation delivering results in a resilient business
2025 has been a transformational year for GlobalData, making progress in positioning the business for long-term sustainable growth. Despite continued macro-economic uncertainty, our resilient subscription-based business model has continued to deliver growth, whilst the strategic investments we have made are starting to translate into tangible outcomes across our product, people and key client wins.
We have made progress embedding the key initiatives from our Growth Transformation Plan, particularly our solutions strategy and AI innovation. We exited 2025 in a position of strength and while we expect our underlying revenue to grow steadily, reflecting our subscription deferred model and ongoing macro headwinds, I remain confident in our ability to deliver on our strategic objectives in 2026 and beyond, supporting a return to sustainable mid to high single digit growth over the longer term.
GlobalData operates in a growing market where the demand for high-quality, proprietary data, expert analysis, and actionable intelligence continues to accelerate. Our clients - which include over 5,000 of the world's largest corporations, financial institutions, and government organisations - increasingly recognise that trusted, proprietary data is a strategic asset that enables better, faster decision-making in an uncertain world.
Our Growth Transformation Plan is built around four strategic priorities: Customer Obsession, World-Class Products, Sales Excellence, and Operational Agility. I am pleased to report substantial progress across all four pillars during 2025.
Proprietary data and AI integration: a defensible competitive advantage
GlobalData's fundamental strength is, and has been since inception, its gold standard proprietary data which is fully integrated into our platform and not easily replicated. Our customers rely on our data to make timely and effective decisions, often in real time. We are observing that customer data delivery demands are changing, particularly through increased demand for direct data feeds and APIs. This further strengthens our proposition by embedding GlobalData further into our customers' workflows. The fundamental point remains unchanged: our clients rely on our data, and we retain a clear competitive moat through the breadth, quality and accessibility of our proprietary data.
AI is a positive theme for GlobalData. Building on a decade-long track record of investment in deploying purpose-built AI across the platform, AI is a key enabler, for internal productivity, and unlocking greater value for our customers as new AI-powered solutions transform customer experiences. Unlike many public AI tools that depend on open web data, GlobalData's AI products are grounded in a proprietary content ecosystem spanning a vast universe of proprietary data and verified analyst reports. GlobalData's purpose-built AI infrastructure integrates proprietary datasets, ensuring that every output is backed by evidence and customers can made decisions based on insights that are accurate, auditable, and strategically relevant.
As a result of this capability and differentiation, growing customer demand for GlobalData's AI products is resulting in increased platform usage, time spent, content consumption and downloads. Importantly, we know that our customers are more likely to renew with us and new customers are more likely to come on board, when AI solutions are offered as part of the service. Our proprietary data and expert insights are mission-critical to our customers' decision-making in fast evolving markets, reinforcing the need for real time, trusted intelligence.
Customer Obsession: Solutions-led Selling, Strategic Account Management and Customer Engagement
Our customer value proposition centres around high quality, proprietary data to make timely and effective decisions. During 2025, we fundamentally transformed our go-to-market approach, transitioning from a product-led sales model to a solutions-led approach with enhanced strategic account management.
Customer Driven Re-organisation
We successfully completed the restructure of our go-to-market organisation, investing significantly in:
|
· |
Expanding our sales teams with experienced enterprise sellers. |
|
· |
Implementing a new strategic account management team and framework. |
|
· |
Developing deeper collaboration with our vertical specialist analysts and consultants. |
This transition required substantial change management and took time to embed, particularly in Q1 2025. We still have work to do to ensure we fully realise the value of our investment and establish sustainable momentum in growing our customer relationships and revenues. However, we exited the year in a stronger position, having gone through the more difficult elements of the transformation.
In November 2025, we hosted an AI investor event where we showcased several innovative AI-enabled solutions that are already creating value for clients:
|
· |
Digital Workers: We have developed AI agents designed to transform the future of work through agentic AI. These digital workers can autonomously execute complex research tasks, analyse market trends, and generate strategic insights - effectively augmenting our clients' teams with AI-powered analysts. |
|
· |
AVA (AI Research Assistant): AVA is our AI research assistant that delivers personalised insights and automates workflows. Clients can interact with AVA using natural language to rapidly access the precise intelligence they need from our vast data universe. |
|
· |
Platform-Wide AI Integration: Beyond discrete AI products, we have embedded AI capabilities across our 'One Platform', enhancing everything from search and discovery to data visualisation and predictive analytics. |
These investments position us to continue leading in AI-enabled intelligence and to maximise the benefits of AI developments for our business and clients.
Customer Engagement
Our approach to customer engagement has been to combine our proprietary data, deep domain human expertise with AI and technology to drive better outcomes for our clients.
Our focus on team collaboration across our sales, strategic account managers, analysts and consultants has driven greater customer engagement across a broader set of users. Our AI enabled solutions and tools on the platform have gained more users on the platform, driving greater engagement and we are seeing usage stats increasing, including views, time on the site and downloads.
World-Class Products:
2025 has been a breakthrough year for our AI strategy. The investments we have made are delivering tangible value to clients and positioning GlobalData as a leader in AI-enabled intelligence solutions.
Full roll out of AI Hub
Our AI Hub has seen exceptional growth, with usage increasing twofold during the first half of the year to over 100,000 users. AI Hub is now embedded across the customer base with 90% of customers contracted to an AI Hub enabled product, with its ability to democratise access and increase utility for customers resulting in a 3x increase in the number of active AI Hub users.
Analysis has also shown that AI Hub is transforming user experience and resulting in significantly more engaged customers that log-in more frequently, spend more time on the platform, interact with more features, and download more information. This platform integrates our proprietary data with advanced AI capabilities, enabling clients to:
|
· |
Access personalised insights through natural language queries. |
|
· |
Automate routine research workflows. |
|
· |
Generate custom analysis and reports. |
|
· |
Identify patterns and connections across our data universe.
|
The adoption of the AI Hub validates our strategy and demonstrates clear client demand for AI-enabled solutions and now clearly positions GlobalData not only as a provider of premium proprietary data and insight, but also as a technology and AI enabled workflow and productivity tool for our clients
Platform Investments:
During 2025, we continued to invest in our technology infrastructure:
|
· |
Enhanced platform scalability and performance. |
|
· |
Improved user experience and interface design. |
|
· |
Expanded API and integration capabilities for enterprise clients. |
These investments support both organic growth and our ability to integrate acquisitions efficiently.
Sales Excellence: Building a High-Performance Sales Organisation:
Our Sales Excellence pillar focuses on creating a world-class sales organisation that can consistently deliver sustainable growth. The focus of sales organisation is on our growth bridge; reduction of churn/ down sell, price, new product, new license, new solutions and new client wins.
We have significantly expanded our sales capacity from 2024 and through 2025. As at 1 January 2025 we had sales headcount totalling 366, compared with 277 at the same point in 2024. Whilst the sales headcount as at 1 January 2026 is flat overall at 367, the mix has changed significantly. The focus has been on hiring enterprise sales professionals with substantial experience of managing and growing large accounts with the world's largest companies.
Beyond headcount expansion, we invested heavily in sales enablement, including comprehensive onboarding and training programmes, enhanced sales tools and CRM capabilities as well as the establishment of a Group revenue operations team to fully support the sales operation.
We have implemented active strategic account management across our key client relationships. Early indicators are encouraging:
· Deeper engagement with C-suite and strategic decision-makers, signing 3 seven figure GBP contracts in the second half.
· Expanding wallet share within existing accounts through cross-selling.
· Starting to see higher average contract values across our larger clients.
Whilst there is still work to do, the pipeline of strategic opportunities we are building gives me confidence that this approach will drive accelerating growth in 2026 and beyond.
Client Success and Retention
Our volume renewal rates remain consistent across both Healthcare and Non-Healthcare divisions. This demonstrates that despite the transition in our sales approach, we have maintained the client engagement and value delivery that underpins our subscription model.
Excluding our recent acquisitions, our volume renewal rate for the year was 83% for the Group overall (customers >£20k) (2024: 83%), with Healthcare at 78% (2024: 79%) and Non-Healthcare at 85% (2024: 85%) reflecting a strong base retention. A major part of the Growth Transformation Plan is to increase the Group's volume renewal rate, and whilst we have not seen material progression in this area in 2025, we have launched several engagement customer success initiatives as well as having a new dedicated inside sales team looking after the lower value clients. From these initiatives we have seen positive activity and engagement from our customer base and are confident that this will start to have a more meaningful impact on revenues and renewal rates.
Operational Agility: Platform Leverage and Integration Excellence:
Our Operational Agility pillar ensures we can scale efficiently and integrate acquisitions seamlessly into our 'One Platform'.
The acquisitions made during Q4 2024 and 2025 were:
Q4 2024:
|
· |
LinkUp (October 2024): A leading provider of global job market data. |
|
· |
Celent (December 2024): A leading research and advisory firm focused on helping technology and strategy leaders in the Financial Services market globally. |
|
· |
Deallus (December 2024): A market-leading competitive intelligence solutions provider focused on the global life sciences sector. |
2025:
|
· |
AI Palette (March 2025): Strengthens our Consumer Innovation Intelligence Solutions and AI capabilities, particularly in food and beverage sectors. |
|
· |
Stylus (July 2025): Expands our consumer trend forecasting capabilities and enhances our creative intelligence offering. |
During Q4 2024 and FY 2025 we completed five acquisitions, successfully integrating them into our platform and we are now realising the anticipated cost synergies. These acquisitions took longer than initially anticipated to integrate, because of the organic transformation activities that were running side by side as well as the increased focus on ensuring complex data sets are fully connected with existing data sets to ensure quality and realise the longer-term opportunities with AI and wider solutions offering. The 2025 results do not reflect any significant revenue synergies from these acquisitions and at this point in time, revenue synergies remain a significant opportunity for the Group.
Whilst our long-term M&A ambitions remain the same; our near-term focus, in the Non-Healthcare division, will be organic growth and realising revenue synergy opportunities across our recent acquisitions, which we have not realised as quickly as we would have liked. We have made significant investments in acquisitions, product, and solutions therefore the team is primarily focused on realising returns on these investments. Our Healthcare M&A strategy remains unchanged and will look to deliver bolt-on acquisitions in FY2026.
FINANCIAL PERFORMANCE
Revenue and Growth
For the year ended 31 December 2025, the Group delivered revenue of £322m, representing total reported growth of 13% and 1% on an underlying basis (2024: £286m). The business demonstrated consistent volume renewal rates throughout the year, with consistent performance across all major client verticals.
The underlying growth of 1%, whilst disappointing, reflects the investment phase and transformation disruption as we transitioned to our new sales model. Whilst this transition impacted growth as our new sales teams embedded new ways of working, we saw some improvement through the year as our solutions-led selling approach gained traction in some sectors. We expect a more consistent ramp up in 2026 now that we have established the new go-to-market structure, noting that macro-economic headwinds may temper some of this progression.
Our Contracted Forward Revenue strengthened to c£180m, representing growth of 5% year-on-year (3% on an underlying basis). This metric is critical to our business model, and alongside our predictable renewal base, provides us with approximately 80% visibility over analyst revenue consensus for 2026.
The strength of our Contracted Forward Revenue reflects:
· Consistent renewal rates across both Healthcare and Non-Healthcare divisions.
· Growing strategic account momentum as our new sales approach drives deeper client relationships.
· The benefit of acquisitions made in 2024 and 2025 now contributing to the base.
· Resilient demand for business-critical data and insights despite macro headwinds.
Profitability and Margins
Adjusted EBITDA for the year was £110m (2024: £117m), with margins of 34% (2024: 41%).
The reduced margin in 2025 reflects the significant investments we have made in three key areas:
· Sales Transformation: Expanding our sales organisation and investing in strategic account management and sales support and revenue operations.
· Corporate infrastructure and support: Investment in our People department, which supports our go-to-market and sales operation as well as the wider business, and a full year of duplicated corporate costs supporting the separate Healthcare division.
· M&A: Our acquisitions completed August 2024-July 2025 have been margin dilutive during 2025, mainly because of the timing of those acquisitions being at the end of 2024 and the time taken to realise the cost synergies as we integrated those businesses.
As anticipated and communicated to the market, these investments have compressed margins in the short term. However, the Board and I remain confident in our trajectory towards recovering margins to 40%:
· Acquisitions become fully integrated and deliver planned cost synergies, and the Group realises the impact of recent restructuring.
· We work towards a more balanced margin profile between the two divisions.
· Our enhanced sales organisation operates at full productivity.
· AI investments drive operational efficiencies and scale benefits.
· Platform leverage continues to improve with revenue growth.
Segmental Performance
Non-Healthcare Division
Our Non-Healthcare division contributed revenue of £199m, reflecting growth of 13% overall with 1% growth coming from underlying performance. Our Non-Healthcare division finished the year with 5% underlying growth in Contracted Forward Revenue, as we started to see some momentum reflecting that the division has increased its sales headcount by 61 people (31%) since early 2024.
This division serves clients across Technology, Consumer, Professional & Financial Services, Industrials, Automotive, and other sectors.
Key highlights from 2025 include:
· Strong growth in our Consumer Innovation Intelligence Solutions following the AI Palette and Stylus acquisitions.
· Roll out of Sales Intelligence solution, with notable wins across sector.
· Growing traction with our digital workers and AI-enabled solutions.
The Non-Healthcare division benefits from significant cross-selling opportunities because of the multiple use-cases we serve, across large and complex organisations. We believe the Total Addressable Market of this division is +£15bn, because of the breadth and depth our solutions offer.
Healthcare Division
The division serves pharmaceutical and life sciences organisations with mission-critical intelligence on drugs, devices, clinical trials and commercial Healthcare data, which also serves suppliers into these markets, such as Professional Services. One of the key focuses in the year was on the integration of Deallus and combining the acquired capability with existing data assets, in the development of a world-class Competitive Intelligence solution.
Our Healthcare division generated revenue of £123m, reflecting growth of 13%. The acquisition of Deallus contributed to the revenue growth, with the underlying business growing by 2%. The pharmaceuticals industry has seen some market headwinds in recent years, particularly within the biotech sector, as well as US drug pricing being a major theme across the major pharmaceuticals businesses which has negatively impacted growth.
As a consequence, within the GlobalData Plc Company only accounts, an impairment write down of £228.4m against the investment (recognised following the separation of the Group's Healthcare business into separate legal entities last year) has been recognised in the year reflecting a challenging environment in which the business is operating. This has no impact on the consolidated results, and we remain confident in the business fundamentals and growth opportunity going forwards. The business remains a highly cash generative and high margin business operating in an attractive sector.
CAPITAL ALLOCATION AND SHAREHOLDER RETURNS
We maintain a disciplined capital allocation framework that balances organic investment, strategic M&A, and shareholder returns. Because of the minority investment in the Healthcare division, we monitor the Group balance sheet and leverage for each division separately and look to deploy capital in the most efficient manner across M&A, share buy-backs and dividends.
Capital Allocation Priorities
Our capital allocation priorities remain:
|
· |
Organic Investment: Our cost base entering 2026 is well invested, with significant investments across our go-to-market, solutions and platform. Therefore, our focus through 2026 will be on realising return on these investments and driving revenue growth across the business.
|
|
· |
Strategic M&A: Our platform makes bolt-on M&A a valuable proposition to our shareholders. Whilst our focus across the business is on underlying growth and sales synergies from our recent cohort of acquisitions, we will de-prioritise M&A in our Non-Healthcare division. Our Healthcare segment remains focused on scaling through M&A in the short term.
|
|
· |
Shareholder Returns: Returning capital through share buybacks and dividends. |
Returns to Shareholders
During 2025, we have been active in returning capital to shareholders:
|
· |
Completion of £60m tender offer in September 2025. |
|
· |
Share buybacks totalling £39.7m in H1 2025. |
|
· |
Launch of additional £10m buyback programme in November 2025, which continued into 2026. |
|
· |
Proposed final dividend of 1.2 pence per share. |
These actions demonstrate our confidence in the medium and long-term prospects of the business and our commitment to delivering strong Total Shareholder Returns. Our revised dividend policy announced in 2024 provides flexibility to prioritise value-creating M&A whilst maintaining progressive ordinary dividends.
OUTLOOK AND PRIORITIES FOR 2026
As we enter 2026 - the final year of our Growth Transformation Plan - we are well-positioned to deliver on our strategic objectives and drive sustainable and scalable growth.
2026 Priorities
Medium-term priorities (2026 and beyond):
|
· |
Accelerate Underlying Growth: Driving our underlying revenue growth to mid-single digits, whilst building the foundations to get back to mid-high-single digit growth and beyond as we look more in the longer term. |
o Continue to embed and realise value from our strategic account programme and commercial excellence, expanding wallet share amongst our major clients.
o Continue the roll out and transition of clients to our new technology enabled Solutions, driving greater client engagement and return on investment, which ultimately creates more material customer relationships for the Group.
o Focus on sales and revenue synergies from our recent acquisitions, focusing heavily on introducing their clients to the wider GlobalData offering and bringing their products and solutions to our wider client base.
|
· |
Margin Recovery and Expansion: Recover Adjusted EBITDA margins towards 40%, leading to high cash conversion and strong returns on invested capital. |
o Realising full-year impact of cost synergies from 2024 and 2025 acquisitions.
o Operating leverage from revenue growth. Our cost investments are already reflected in the cost base and therefore we expect a significant incremental margin from revenue growth.
o Disciplined cost management whilst continuing to invest in growth, through reinvesting operational efficiency improvements enabled by AI and automation.
|
· |
AI Innovation: Expand the capabilities and adoption of our AI Hub, whilst launching new AI-powered products and solutions. |
o Expanding the capabilities and adoption of our AI Hub, helping clients engage with our mission-critical proprietary data in an efficient manner driving greater productivity.
o Launching new AI-powered products and solutions.
o Integrating AI across our entire platform to drive productivity and insights.
o Building our AI talent pool and capabilities.
|
· |
Strategic M&A Execution: Focus is to drive revenue synergies in the Non-Healthcare division from recent acquisitions, but will continue to pursue value-accretive M&A in our Healthcare division.
|
|
· |
Continuing to deliver attractive Total Shareholder Returns: Progressive dividend policy and disciplined approach to capital allocation and share buybacks. |
Main Market Listing
Subject to final approval from the Financial Conduct Authority, a prospectus in relation to the Company's move to the Main Market will be published on 2 March 2026. Admission to the Main Market is expected to be at 8.00am on 5 March 2026 with the last day of trading on AIM on 4 March 2026. I believe that our move to the Main Market will give the Company a wider access to international capital, enhancing future growth opportunities.
Board Changes
In accordance with the announcements of 19 January 2026 and 10 February 2026, Andrew Day and Annette Barnes are resigning from the Board on 1 March 2026 immediately following approval of the 2025 Annual Report and Accounts, and I would like to thank Annette and Andrew for their exceptional support and guidance over the last nine years. We have recently welcomed Rachel Higham and Toby Walter to the Board as non-executive directors.
Separately, the Company is pleased to announce that it has agreed terms with Robert Kingston to join the Group as Chief Financial Officer as soon as he has served his six-month notice period with his current employer. Robert is currently employed as the Chief Financial Officer of Keywords Studios and previously spent 25 years at Sky plc in progressively senior finance and operational roles including Finance Director of Sky's Content Business, Group Director of Investor Relations and latterly as an Executive Director to the Group CEO. Rob is a Fellow of the Chartered Institute of Management Accountants. It is expected that he will join the Group in Q3 2026.
Graham Lilley has informed the Board of his intention to step down from his role as CFO later this year, in order to pursue other opportunities. The Board have mutually agreed with Graham that he will remain in role until after Rob has started, to provide an orderly handover and support a smooth and successful transition.
Outlook
We enter 2026 with strong visibility, with approximately 80% of analyst revenue consensus for 2026 contracted through our Contracted Forward Revenue, as well as reasonable expectations for revenue from renewing customers, providing confidence in base business retention.
We have a clear line of sight to margin expansion as integration activity completes and a well invested cost allowing for strong incremental margins flowing from revenue growth.
The investment case for GlobalData remains compelling:
· Strong defensive moat around high quality and proprietary data and insights.
· Market-leading position in large, growing markets for data and analytics.
· Resilient subscription model with high visibility and predictable cash flows.
· Significant AI-enabled growth opportunities ahead of the curve.
· Proven M&A platform with capacity and pipeline for value creation.
· Clear pathway to margin expansion and accelerating growth.
· Strong management team with track record of value creation.
2025 has been a year of substantial progress in executing our Growth Transformation Plan. We have embedded our solutions-led selling approach, made breakthrough AI investments that are delivering client value, successfully integrated six acquisitions, and maintained a strong balance sheet with significant capacity for future value creation.
The macro-economic environment remains uncertain, but our business model has demonstrated its resilience. The demand for high-quality, proprietary data and expert analysis is robust, and our AI-first approach positions us to capitalise on one of the most significant technological shifts of our time.
As we enter 2026, I am confident that GlobalData is well-positioned to deliver on our strategic objectives. Our proprietary data assets, AI capabilities, and talented team create a sustainable competitive advantage. With our growth transformation initiatives now largely embedded and momentum building, we are focused on execution and driving accelerating growth.
I would like to thank our clients for their continued partnership and trust, our employees for their exceptional work during this period of transformation, and our shareholders for their ongoing support. We look forward to updating you on our progress throughout 2026.
Mike Danson
Chief Executive
1 March 2026
FINANCIAL REVIEW
|
ADJUSTED FIGURES |
|
|
|
|
|
For the Year Ended 31 December: |
2025 £m |
2024 £m |
Reported Growth |
Underlying Growth |
|
Revenue |
322.1 |
285.5 |
13% |
1% |
|
EBITDA1 |
110.2 |
116.8 |
-6% |
|
|
Operating profit1 |
111.6 |
83.3 |
34% |
|
|
Operating profit margin1 |
35% |
29% |
6% |
|
|
Profit before tax1 (restated) 2 |
99.6 |
70.3 |
42% |
|
|
Tax charge1 (restated) 2 |
(25.8) |
(21.6) |
19% |
|
|
Profit after tax1 (restated) 2 |
73.8 |
48.7 |
52% |
|
|
Free cash flow1 |
34.4 |
32.7 |
5% |
|
|
Basic earnings per share1 (pence) (restated) 2 |
7.3 |
5.1 |
43% |
|
|
|
|
|
|
|
|
REPORTED FIGURES |
|
|
|
|
|
For the Year Ended 31 December: |
2025 £m |
2024 £m |
Reported Growth |
Underlying Growth |
|
Revenue |
322.1 |
285.5 |
13% |
1% |
|
Operating profit |
81.2 |
65.1 |
25% |
|
|
Operating profit margin |
25% |
23% |
2% |
|
|
Profit before tax |
69.2 |
54.9 |
26% |
|
|
Tax charge |
(19.1) |
(18.4) |
4% |
|
|
Profit after tax |
50.1 |
36.5 |
37% |
|
|
Cash flow from operations |
83.3 |
97.6 |
-15% |
|
|
Net (bank debt)/ cash1 |
(114.2) |
10.1 |
-1231% |
|
|
Basic earnings per share (pence) |
4.4 |
3.8 |
16% |
|
1 Defined in the explanation of non-IFRS measures on page 26.
2 In prior years, the Group included share-based payments and associated costs, as well as unrealised foreign exchange costs/(gains) as an adjustment to operating profit. The Group has updated the classification of adjusting items within the adjusted profits calculation in 2025 with a view to provide more comparable performance metrics across its peers. As a result of the amended calculation method, prior year comparatives have been amended to report adjusted profits on a consistent basis.
Key Performance Indicators:
Financial Key Performance Indicators
The financial KPIs detailed below are used, in addition to statutory reporting measures, by the Executive Directors to monitor the Group's performance and progress.
|
|
Revenue
|
Contracted Forward Revenue |
Adjusted EBITDA
|
Adjusted EBITDA Margin
|
Net (Bank Debt)/ Cash
|
|
2025 |
£322.1m |
£179.7m |
£110.2m |
34% |
(£114.2m) |
|
2024 |
£285.5m |
£171.4m |
£116.8m |
41% |
£10.1m |
|
% reported growth |
+13% |
+5% |
-6% |
-7p.p. |
-1231% |
|
% underlying growth |
+1% |
+3% |
N/a |
N/a |
N/a |
Our significant transformation programme, alongside macro-economic headwinds, have meant that underlying growth was tempered at 1%. Although sales headcount was broadly flat year-on-year (32% up versus headcount as at January 2024), we changed a lot of personnel in the first quarter of 2025, re-focusing our go-to-market strategy on larger strategic accounts and building an inside sales team to look after the smaller accounts, at scale. The disruption and the longer customer decision making cycles impacted our revenue progression.
We saw some positive momentum in the second half of 2025, particularly in the Non-Healthcare segment. We finished the year with good visibility on future revenues. Contracted Forward Revenue grew to £179.7m as at 31 December 2025 (31 December 2024: £171.4m), which included 3% underlying growth.
Investing in our go-to-market strategy, AI and solutions impacted our organic Adjusted EBITDA margin, but the most material dilution of margin was from our recent cohort of acquisitions. Cost synergy programmes across our acquisitions were materially complete by 31 December 2025, therefore we expect margins to recover towards 40%.
Operational Key Performance Indicators
As at 31 December 2025, the total number of clients (>£5,000 spend) grew 3% to 5,112 (2024: 4,979) including the impact of the recent acquisitions.
|
|
Clients >£20,000 |
All Clients (above £5,000) |
||||
|
|
Value renewal rate |
Volume renewal rate |
Average client value (underlying) (£'000) |
Value renewal rate |
Volume renewal rate |
Average client value (underlying) (£'000) |
|
2025 |
89% |
83% |
£81.8 |
88% |
79% |
£50.0 |
|
2024 |
93% |
83% |
£79.1 |
92% |
79% |
£49.7 |
|
Movement |
-4pt |
- |
+3% |
-4pts |
- |
+1% |
Our volume renewal rates were materially consistent with the previous year. As part of the Growth Transformation Plan, a number of initiatives and strategic focus has been on Customer Obsession and we believe that these will drive towards our stated ambition of volume renewal rates of >90% over the longer term.
Our value renewal rate, which reflects the overall value returned from existing customers, including growth from increasing prices, products and licenses, has fallen by 4pts this year. Part of this fall is due to movements in foreign exchange, but also focussing on transitioning clients to team and enterprise-based contracts has meant a lower return from pricing and license upgrades. Longer term, we expect the new licensing approach to drive more usage and ultimately client value. This transition started from 1 January 2025.
|
Financial Review Notes
The financial position and performance of the business are reflective of the key financial elements of our business model: visible and recurring revenues, high incremental margins, scalable opportunity and strong cash flows. The Directors believe that Adjusted EBITDA, Adjusted EBITDA margin, Adjusted operating profit, Adjusted operating profit margin, Adjusted profit before tax, Adjusted profit after tax and Adjusted earnings per share provide additional useful information on the operational performance of the Group to shareholders, and internally we review the results of the Group using these measures. The term 'adjusted' is not a defined term under IFRS and may not therefore be comparable with similarly titled profit measures reported by other companies. It is not intended to be a substitute for, or superior to, IFRS measures of profit.
The Directors also believe that reviewing revenue growth on an 'underlying' basis gives a useful view on the performance of the business. By reviewing growth excluding the impact of currency and the impact of acquisitions, the Directors can review performance on a like-for-like basis. The term 'underlying' is not a defined term under IFRS and may not therefore be comparable with similarly titled measures reported by other companies.
Financial Key Performance Indicators ('KPIs') The financial KPIs on page 13 are used, in addition to statutory reporting measures, by the Executive Directors to monitor the Group's performance and progress. These key performance indicators are used to measure progress against strategy, the strength of the business and long-term prospects for our stakeholders.
Operational Key Performance Indicators The operational key performance indicators below are used by the Directors to monitor the quality of revenue growth and understand underlying performance. Our operational key performance indicators are:
Value Renewal Rate - this is calculated in reference to the total spend of existing clients with subscription contracts in the last twelve months, compared to the total spend of those same clients in the twelve months prior to that.
Volume Renewal Rate - this is calculated in reference to the number of existing clients with subscription contracts in the last twelve months, compared to the same number of clients in the twelve months prior to that.
Average Client Value - this is calculated using the total value of sales across our clients with subscription contracts and dividing by the number of clients with subscription contracts, which shows an average value.
Our operational KPIs reference sales orders rather than revenue and therefore impact revenue recognised in the year as well as Invoiced and Contracted Forward Revenue.
|
Reconciliation of statutory numbers to alternative performance measures:
|
For the Year Ended 31 December: |
2025 £m |
2024 £m |
Variance % |
|
Reconciliation: |
|
|
|
|
Operating profit |
81.2 |
65.1 |
25% |
|
Restructuring, corporate projects and refinancing costs |
11.2 |
5.3 |
111% |
|
Acquisition and integration costs |
7.1 |
4.0 |
78% |
|
Amortisation of acquired intangible assets |
12.1 |
8.9 |
36% |
|
Adjusted operating profit1 |
111.6 |
83.3 |
34% |
|
Depreciation |
6.6 |
5.8 |
14% |
|
Amortisation of software |
4.3 |
1.9 |
126% |
|
Impairment |
1.3 |
- |
100% |
|
India Wage Code liability true-up |
1.7 |
- |
100% |
|
Share-based payments (credit)/ charge |
(15.4) |
24.1 |
-164% |
|
Costs relating to share-based payments scheme |
1.7 |
0.3 |
467% |
|
Revaluation (gain)/ loss on short- and long-term derivatives |
(1.2) |
1.7 |
-171% |
|
Unrealised operating foreign exchange gain |
(0.4) |
(0.3) |
33% |
|
Adjusted EBITDA1 |
110.2 |
116.8 |
-6% |
|
Adjusted EBITDA margin1 |
34% |
41% |
-7p.p. |
1 Defined in the explanation of non-IFRS measures on page 26.
The Group's Performance This Year
1. Executive Summary
The Group's financial performance reflects the key transformational activities that the Group has prioritised in 2025, set against a challenging macro-economic environment. The Group has focused on:
· Investment in go-to-market, solutions and AI, which have all had a dilutive impact on Adjusted EBITDA margin, but with the associated revenue returns still to come.
· Our recent acquisitions have increased our overall Group revenue yet have had a dilutive impact on margins. Whilst now fully integrated, the full year effect of synergies will be realised in 2026 and beyond.
Overall, the Group performance has meant that the LTIP targets for 2025 have not been met, and management currently believe that the Adjusted EBITDA performance target for 2026 is unlikely to be met. Therefore, a non-cash credit of £20.5m has been added back to the consolidated income statement in 2025, reflecting previous charges that have been recognised on the basis that the targets would be met. The £20.5m credit was partially offset with £5.1m of share-based payment charges in relation to the remaining charges for 2024 LTIP targets and grants made in the year.
2. Revenue
Revenue grew by 13% to £322.1m (2024: £285.5m). The majority of the increase came from recent acquisitions. On an underlying basis, subscriptions grew by 1% underpinned by continued strong renewal rates, but currency headwinds reduced revenue (excluding acquisitions). As a result of the weighting of acquisitions, subscription revenue as a proportion of total revenue reduced slightly to 74% (2024: 75%).
|
£m |
£m |
|
Revenue as reported - 2025 |
322.1 |
|
Add back currency movements (from underlying business) |
4.2 |
|
Deduct post-acquisition revenue of acquired businesses |
(39.0) |
|
Revenue underlying - 2025 |
287.3 |
|
2024 |
285.5 |
|
Reported Growth |
+13% |
|
Underlying Growth |
+1% |
3. Profit before tax
Profit before tax for the year grew by £14.3m to £69.2m (2024: £54.9m). Operating profits increased by 25% in the year to £81.2m (2024: £65.1m), inclusive of a credit of £20.5m on share-based payments to reflect 2025's LTIP target not being met as well as it being deemed unlikely that the 2026 LTIP target of £153m Adjusted EBITDA will be met.
|
£m |
Year ended 31 December 2025 |
Year ended 31 December 2024 |
Change % |
|
Revenue |
322.1 |
285.5 |
+13% |
|
Operating costs (excluding adjusting items) |
(211.9) |
(168.7) |
+26% |
|
Adjusted EBITDA |
110.2 |
116.8 |
-6% |
|
Depreciation |
(6.6) |
(5.8) |
+14% |
|
Amortisation of acquired intangible assets |
(12.1) |
(8.9) |
+36% |
|
Amortisation of software |
(4.3) |
(1.9) |
+126% |
|
Impairment |
(1.3) |
- |
+100% |
|
Share-based payments credit/ (charge) |
15.4 |
(24.1) |
-164% |
|
Restructuring, corporate projects and refinancing costs |
(11.2) |
(5.3) |
+111% |
|
Acquisition and integration costs |
(7.1) |
(4.0) |
+78% |
|
Costs relating to share-based payment schemes |
(1.7) |
(0.3) |
+467% |
|
India Wage Code liability true-up |
(1.7) |
- |
+100% |
|
Revaluation gain/ (loss) on short- and long-term derivatives |
1.2 |
(1.7) |
-171% |
|
Unrealised operating foreign exchange gains |
0.4 |
0.3 |
+33% |
|
Finance costs |
(12.0) |
(10.2) |
+18% |
|
Profit before tax |
69.2 |
54.9 |
+26% |
Adjusted EBITDA
Adjusted EBITDA decreased by 6% to £110.2m (2024: £116.8m). The revenue growth of £36.6m was offset with cost increases of £43.2m (largely representing the full year impact of acquisitions which closed in the second half of 2024), meaning that the overall net decline to Adjusted EBITDA was £6.6m. Adjusted EBITDA margin decreased to 34% (2024: 41%).
The Group implemented a series of cost synergy and savings actions in the last quarter of 2025, meaning the cost base run rate has reduced going into 2026. This change, alongside expected organic revenue growth, gives us confidence of driving margins back towards 40%.
Segmental Performance
The Healthcare segment generated profit after tax during the year of £42.6m, of which 40% was allocated to Non-Controlling Interest ('NCI'), totalling £17.0m. In the comparative year, 40% of the Healthcare segment's profit after tax was allocated to NCI from 4 June 2024 onwards, with profit after tax for this period totalling £17.3m and allocation to NCI totalling £6.9m.
|
ADJUSTED FIGURES |
2025 |
Reported Growth |
Underlying Growth |
|||
|
£m |
GlobalData Non-Healthcare |
GlobalData Healthcare |
Corporate (unallocated) |
Group Total |
||
|
Revenue |
|
|
|
|
|
|
|
Services satisfied over a period of time |
142.5 |
94.5 |
- |
237.0 |
10% |
|
|
Services satisfied at a point time |
56.3 |
28.8 |
- |
85.1 |
21% |
|
|
Total revenue |
198.8 |
123.3 |
- |
322.1 |
13% |
1% |
|
|
|
|
|
|
|
|
|
Adjusted EBITDA |
50.2 |
61.8 |
(1.8) |
110.2 |
-6% |
|
|
Adjusted EBITDA margin |
25% |
50% |
|
34% |
|
|
|
Adjusted operating profit |
46.3 |
67.1 |
(1.8) |
111.6 |
|
|
|
Adjusted operating profit margin |
23% |
54% |
|
35% |
|
|
|
|
|
|
|
|
|
|
|
Reconciliation: |
|
|
|
|
|
|
|
Operating profit |
25.2 |
61.8 |
(5.8) |
81.2 |
|
|
|
Restructuring, corporate projects and refinancing costs |
5.7 |
1.5 |
4.0 |
11.2 |
|
|
|
Acquisition and integration costs |
5.8 |
1.3 |
- |
7.1 |
|
|
|
Amortisation of acquired intangibles |
9.6 |
2.5 |
- |
12.1 |
|
|
|
Adjusted operating profit |
46.3 |
67.1 |
(1.8) |
111.6 |
|
|
|
Amortisation (excluding amortisation of acquired intangibles) |
4.2 |
0.1 |
- |
4.3 |
|
|
|
Depreciation |
4.9 |
1.7 |
- |
6.6 |
|
|
|
Share-based payments credit |
(10.7) |
(4.7) |
- |
(15.4) |
|
|
|
Costs related to share-based payment schemes |
1.5 |
0.2 |
- |
1.7 |
|
|
|
India Wage Code liability true-up |
1.3 |
0.4 |
- |
1.7 |
|
|
|
Impairment |
1.3 |
- |
- |
1.3 |
|
|
|
Movement in unrealised operating and derivative foreign exchange |
1.4 |
(3.0) |
- |
(1.6) |
|
|
|
Adjusted EBITDA |
50.2 |
61.8 |
(1.8) |
110.2 |
|
|
|
ADJUSTED FIGURES |
2024 |
|||
|
£m |
GlobalData Non-Healthcare |
GlobalData Healthcare |
Corporate (unallocated) |
Group Total |
|
Revenue |
|
|
|
|
|
Services satisfied over a period of time |
126.8 |
88.4 |
- |
215.2 |
|
Services satisfied at a point time |
49.3 |
21.0 |
- |
70.3 |
|
|
176.1 |
109.4 |
- |
285.5 |
|
|
|
|
|
|
|
Adjusted EBITDA |
58.2 |
60.9 |
(2.3) |
116.8 |
|
Adjusted EBITDA margin |
33% |
56% |
N/a |
41% |
Adjusting items
Adjusting items declined by £25.9m in total, with some significant individual movements of note:
· The share-based payments charge has decreased from £24.1m to a credit of £15.4m, driven by the Adjusted EBITDA target not being hit for 2025 and management currently forecasts that the Adjusted EBITDA performance target for 2026 is unlikely to be met. This led to a £20.5m credit to the consolidated income statement.
· Acquisition and integration costs increased year on year, from £4.0m to £7.1m, reflective of additional M&A activity during the latter part of 2024 and completing on the Stylus and AI Palette acquisitions during 2025. Further information is disclosed in note 13.
· Restructuring, corporate projects and refinancing costs totalling £11.2m have been recognised within the Group, which have principally arisen as a result of the transformation restructuring initiatives, coupled with costs associated with the proposed move to the Main Market and defence costs for the Private Equity approaches in the first half of 2025.
· Unrealised foreign exchange gains of £1.6m were recognised during the year, in comparison with a total loss in 2024 of £1.4m.
Finance costs
Finance costs have increased by 18% to £12.0m (2024: £10.2m) which is inclusive of a non-cash interest charge of £1.9m relating to financial liabilities measured at amortised cost (2024: £1.4m), revaluation gain on the terminated interest rate swap of £nil (2024: gain of £2.8m) and IFRS16 leases interest of £1.2m (2024: £1.1m). The cash paid in interest in 2025 was £8.8m (2024: £10.9m).
Finance costs in relation to the banking facilities are calculated on drawn debt based upon a margin range of 225-325bps, dependent on adjusted leverage, plus SONIA (Sterling Overnight Index Average rate). Undrawn debt carries interest at one third of the prevailing margin.
Leases
Within our operating costs, depreciation in relation to right-of-use assets was £4.8m (2024: £4.6m). Our net finance costs include interest of £1.2m in relation to lease liabilities (2024: £1.1m).
4. Foreign exchange impact on results
The Group derives around 60% of revenues in currencies other than Sterling, compared with around 40% of its cost base. The impact of currency movements in the year reduced revenue by £4.4m, which mainly reflected volatility of Sterling against US Dollar (average rate 2025: 1.32, 2024: 1.28).
|
£m |
Revenue |
Operating costs1 |
Adjusted EBITDA |
Adjusted EBITDA margin
|
Contracted Forward Revenue |
|
As reported |
322.1 |
(211.9) |
110.2 |
34% |
179.7 |
|
Add back currency movements |
|
|
|
|
|
|
US Dollar |
3.6 |
(1.8) |
1.8 |
|
4.3 |
|
Euro |
0.2 |
- |
0.2 |
|
0.2 |
|
Other |
0.6 |
(1.8) |
(1.2) |
|
0.2 |
|
Constant currency |
326.5 |
(215.5) |
111.0 |
34% |
184.4 |
|
2024 - as reported |
285.5 |
(168.7) |
116.8 |
41% |
171.4 |
|
Constant currency growth |
+14% |
+28% |
-5% |
-7p.p. |
+8% |
1Operating costs excluding adjusting items.
5. Taxation
The Group's effective income tax rate (ETR) for the reporting period is 27.6%, compared to the UK statutory rate of 25.0%. While several items impacted the ETR during the period, their net effect was broadly neutral, and the primary driver of the increase above the statutory rate was expenses that are non-deductible for tax purposes.
Key factors that may impact the Group's future tax charge as a percentage of underlying profits are the mix of profits and losses between the jurisdictions in which the Group operates and the corresponding tax rates in those territories, the impact of non-deductible expenditure and non-taxable income and the utilisation (with a corresponding reduction in cash tax payments) of previously unrecognised deferred tax assets.
The ETR for the prior reporting period was elevated due to the separation of the Healthcare business and the subsequent investment by Inflexion. The tax rate for the current period has returned to expected levels.
Reconciliation of statutory income tax charge to adjusted income tax charge is presented below:
|
£m |
Year ended 31 December 2025 |
Year ended 31 December 2024 Restated |
|
Statutory income tax charge |
19.1 |
18.4 |
|
Amortisation of acquired intangible assets |
3.0 |
2.3 |
|
Restructuring, corporate projects and refinancing costs |
1.2 |
1.3 |
|
Revaluation of interest rate swap |
- |
(0.7) |
|
Corporate tax rate change |
- |
(0.1) |
|
Movement in unrecognised deferred tax |
2.5 |
0.4 |
|
Adjusted income tax charge |
25.8 |
21.6 |
The adjusted tax charge for 2024 has been restated due to the calculation of adjusted profits being amended during the year ended 31 December 2025, which has been further discussed within the earnings per share section of this report.
6. Earnings per share
|
£m |
Year ended 31 December 2025 |
Year ended 31 December 2024 |
Change % |
|
Earnings attributable to equity holders: |
|
|
|
|
Basic earnings per share (pence) |
4.4 |
3.8 |
+16% |
|
Diluted earnings per share (pence) |
4.4 |
3.7 |
+19% |
|
Adjusted basic earnings per share (pence) (restated) |
7.3 |
5.1 |
+43% |
|
Adjusted diluted earnings per share (pence) (restated) |
7.3 |
5.1 |
+43% |
|
£m |
Year ended 31 December 2025
|
Year ended 31 December 2024 Restated |
|
Profit before tax |
69.2 |
54.9 |
|
Restructuring, corporate projects and refinancing costs |
11.2 |
5.3 |
|
Acquisition and integration costs |
7.1 |
4.0 |
|
Amortisation of acquired intangible assets |
12.1 |
8.9 |
|
Revaluation of interest rate swap |
- |
(2.8) |
|
Adjusted profit before tax1 |
99.6 |
70.3 |
|
Adjusted income tax expense1 |
(25.8) |
(21.6) |
|
Adjusted profit after tax1 |
73.8 |
48.7 |
|
Allocated to equity holders of the parent |
55.0 |
40.5 |
|
Allocated to non-controlling interest |
18.8 |
8.2 |
1 Defined in the explanation of non-IFRS measures on page 26.
In prior years, the Group included share-based payments and associated costs, as well as unrealised foreign exchange costs/(gains) as an adjustment to operating profit. The Group has updated the classification of adjusting items in 2025 with a view to provide more comparable performance metrics across its peers. As a result of the amended calculation method, prior year comparatives have been amended to report adjusted profits on a consistent basis.
Basic EPS was 4.4 pence per share (2024: 3.8 pence per share). Fully diluted profit per share was 4.4 pence per share (2024: 3.7 pence per share). Adjusted basic earnings per share grew from 5.1 pence per share (restated) to 7.3 pence per share, representing 43% growth, and driven in large part by the share-based payment credit.
7. Share count
Reconciliation of basic weighted average number of shares to the diluted weighted average number of shares:
|
|
Year ended 31 December 2025 No' m |
Year ended 31 December 2024 No' m |
|
Basic weighted average number of shares, net of shares held in treasury reserve |
748.6 |
789.1 |
|
Dilutive share options in issue - scheme 1 |
0.7 |
1.2 |
|
Dilutive share options in issue - scheme 2 |
- |
6.5 |
|
Dilutive share options in issue - scheme 4 |
0.3 |
2.6 |
|
Diluted weighted average number of shares |
749.6 |
799.4 |
Reconciliation of basic number of shares to the diluted number of shares as at the balance sheet date of 31 December 2025:
|
|
Year ended 31 December 2025 No' m |
Year ended 31 December 2024 No' m |
|
Basic number of shares |
764.7 |
830.9 |
|
Shares held in treasury reserve |
(50.8) |
(52.9) |
|
Dilutive share options in issue - scheme 1 |
0.7 |
1.2 |
|
Dilutive share options in issue - scheme 2 |
- |
6.5 |
|
Dilutive share options in issue - scheme 4 |
0.3 |
2.6 |
|
Diluted number of shares |
714.9 |
788.3 |
8. Dividends
As noted in our half year results statement (published 31 July 2024), following on from the completion of the Healthcare transaction and the strategy to focus more capital towards M&A, we have rebased the dividend for the period from 1 July 2024.
We are proposing a final dividend of 1.2 pence per share (2024: 1.0 pence), to be paid on 1 May 2026 to shareholders on the register at the close of business on 27 March 2026. The ex-dividend date will be on 26 March 2026. The proposed final dividend increases the total dividend for the year to 1.5 pence per share (2024: 2.5 pence). The decrease of 40% is reflective of the dividend being rebased from 1 July 2024.
9. Cash generation
|
£m |
Year Ended 31 December 2025 |
Year Ended 31 December 2024 |
Change % |
|
Cash flow generated from operations |
83.3 |
97.6 |
-15% |
|
Interest paid |
(8.8) |
(10.9) |
-19% |
|
Income taxes paid |
(24.1) |
(40.7) |
-41% |
|
Contingent consideration paid |
(2.5) |
(0.5) |
+400% |
|
Principal elements of lease payments |
(5.6) |
(5.6) |
- |
|
Purchase of intangible and tangible assets |
(7.9) |
(7.2) |
+10% |
|
Free cash flow1 |
34.4 |
32.7 |
+5% |
|
Operating cash flow conversion %1 |
76% |
84% |
-8pts |
|
Free cash flow conversion %1 (restated)2 |
35% |
47% |
-12pts |
1 Defined in the explanation of non-IFRS measures on page 26.
2 Free cash flow conversion for 2024 has been restated due to the calculation of adjusted profits being amended during the year ended 31 December 2025, which has been further discussed within the earnings per share section of this report.
Cash generated from operations was £83.3m (2024: £97.6m), a 15% decrease, representing 76% of Adjusted EBITDA (2024: 84%). The reduced conversion from EBITDA was driven by the increased number of adjusting items which impacted operating cash flow, driven largely by M&A. Total adjusting items in 2025 impacting operating cashflow was £18.6m (2024: £10.1m). Excluding the adjusting items, operating cash flow conversion as a percentage of Adjusted EBITDA was 92% (2024: 92%).
Capital expenditure was £7.9m in 2025 (2024: £7.2m), including £5.1m on software including assets under construction (2024: £5.3m). Capital expenditure represented 2.5% of revenue (2024: 2.5%).
Total cash flows from operating activities were £47.9m (increase of £2.4m from 2024), which represented 59% of operating profit (2024: 70%). During the year, the Group paid out £9.9m in dividends (2024: £37.5m).
Short- and long-term borrowings increased by £124.9m to £165.3m as at 31 December 2025 (2024: £40.4m). Loan drawdowns during the year were used to fund M&A activity and acquisitions of own shares for cancellation.
10. Net (bank debt)/ cash
Net bank debt as at 31 December 2025 was £114.2m (2024: net cash of £10.1m).
The Group defines net bank debt as short- and long-term borrowings (note 10) less cash and cash equivalents. The amount excludes items related to leases.
|
£m |
2025 |
2024 |
|
|
|
|
|
Short- and long-term borrowings (note 10) |
(165.3) |
(40.4) |
|
Cash |
51.1 |
50.5 |
|
Net (bank debt)/ cash |
(114.2) |
10.1 |
A reconciliation of cash generated from operations, free cash flow and opening and closing net bank debt is set out below.
|
£m |
Year ended 31 December 2025 |
Year ended 31 December 2024 |
Growth |
|
Cash flow generated from operations |
83.3 |
97.6 |
-15% |
|
Interest paid |
(8.8) |
(10.9) |
-19% |
|
Income taxes paid |
(24.1) |
(40.7) |
-41% |
|
Contingent consideration paid |
(2.5) |
(0.5) |
+400% |
|
Principal elements of lease payments |
(5.6) |
(5.6) |
- |
|
Purchase of intangible and tangible assets |
(7.9) |
(7.2) |
+10% |
|
Free cash flow |
34.4 |
32.7 |
+5% |
|
Dividends paid |
(9.9) |
(37.5) |
-74% |
|
Net M&A1 |
(33.7) |
(79.4) |
-58% |
|
Proceeds from disposal of subsidiary |
0.8 |
- |
+100% |
|
Acquisition of own shares |
(11.0) |
(52.5) |
-79% |
|
Acquisition of own shares for cancellation |
(101.5) |
(29.3) |
+246% |
|
Proceeds from sale of 40% of Healthcare business to non-controlling interest |
- |
443.4 |
-100% |
|
Transaction costs relating to sale of 40% of Healthcare business to non-controlling interest |
- |
(30.6) |
-100% |
|
Receipt of loan from related party |
- |
8.0 |
-100% |
|
Net cash flow |
(120.9) |
254.8 |
-147% |
|
Opening net bank debt |
10.1 |
(243.9) |
-104% |
|
Non-cash movement in borrowings |
(1.9) |
(1.4) |
+36% |
|
Currency translation |
(1.5) |
0.6 |
-350% |
|
Closing (bank debt)/ net cash |
(114.2) |
10.1 |
-1231% |
|
Last 12 months Adjusted EBITDA2 |
110.2 |
116.8 |
-6% |
|
Net bank debt leverage |
(1.0x) |
0.1x |
-1.1x |
1Cash cost relating to acquisitions included in the Consolidated Statement of Cash Flows within investing activities (£27.0m (2024: £68.7m)) and financing activities (£6.7m (2024: £10.7m)).
2Reflects 12 month rolling Adjusted EBITDA results, which for the 12 months ending 31 December 2025 and 31 December 2024 respectively, directly agrees to Adjusted EBITDA reported for each financial year.
11. M&A transactions
During the year the Group invested £33.7m of equity value (headline purchase price) across two acquisitions (2024: £88.0m across four acquisitions).
12. Contracted Forward Revenue
|
£m |
2025 |
2024 |
|
|
|
|
|
Deferred revenue |
117.3 |
114.6 |
|
Amounts not due/subscription not started at 31 December |
30.1 |
30.7 |
|
Invoiced Forward Revenue |
147.4 |
145.3 |
|
Contracted not yet invoiced |
32.3 |
26.1 |
|
Contracted Forward Revenue |
179.7 |
171.4 |
|
£m |
GlobalData Non-Healthcare |
GlobalData Healthcare |
Total Group |
|
Contracted Forward Revenue as reported - 2025 |
110.5 |
69.2 |
179.7 |
|
Add back currency movements (from underlying business) |
2.2 |
1.4 |
3.6 |
|
Deduct Contracted Forward Revenue of acquisitions completed during 2025* |
(6.3) |
- |
(6.3) |
|
Contracted Forward Revenue underlying - 2025 |
106.4 |
70.6 |
177.0 |
|
2024 |
101.2 |
70.2 |
171.4 |
|
Reported growth |
+9% |
-1% |
+5% |
|
Underlying growth |
+5% |
+1% |
+3% |
*Acquisitions completed in 2025 are Stylus and AI Palette.
13. Intangible assets
Intangible assets (excluding goodwill) have increased by £5.2m during the year, from £101.7m as at 31 December 2024 to £106.9m as at 31 December 2025. This movement is driven by an amortisation charge for the year of £16.4m offset by additions of £21.8m, which predominantly relate to intangibles identified in relation to acquisitions made in the year as detailed in note 13.
14. Trade receivables
Net trade receivables as at 31 December 2025 were £71.0m, representing a 4% reduction compared with the 31 December 2024 balance of £74.0m.
Financial Risk Management
The Group's primary objective in managing foreign currency risk is to protect against the risk that the eventual Sterling net cash flows will be affected by changes in foreign currency exchange rates. To do this, the Group enters into foreign exchange contracts that limit the risk from movements in US Dollar and Euro exchange rates with Sterling. Due to the Group's operations in India, the Group also enters into foreign exchange contracts that limit the risk from movements in US Dollars with the Indian Rupee exchange rate. While commercially and from a cash flow perspective this hedges the Group's currency exposures, the Group elects not to apply hedge accounting and accordingly any movements in the fair value of the foreign exchange contracts are recognised in the income statement.
On 23 May 2023, the International Accounting Standards Board issued amendments to IAS 12 (International Tax Reform - Pillar Two Model Rules), confirming that IAS 12 applies to income taxes arising from tax law enacted or substantively enacted to implement the OECD Pillar Two model rules, including Qualified Domestic Minimum Top-up Taxes. The Group has adopted these amendments. However, they are not applicable to the current reporting year as the Group's consolidated revenue is below the application threshold of €750m.
Interest Rate Risk
Interest rate risk is the impact that fluctuations in market interest rates can have on the value of the Group's interest-bearing assets and liabilities and on the interest charge recognised in the income statement. The Group does not currently manage this risk with the use of derivatives. The Group entered into an interest rate swap arrangement in relation to the previously held loan facilities, which were settled in full during June 2024, at which point the swap arrangement was terminated.
Credit Risk
In the normal course of its business, the Group is exposed to credit risk from cash and trade and other receivables. Credit risk refers to the risk that a counterparty will default on its contractual obligations resulting in financial loss to the Group. Trade receivables consist of a large number of customers, spread across diverse industries and geographic markets, and the Group's exposure to credit risk is influenced mainly by the individual characteristics of each customer. The Group has adopted an approach of assessing factors such as counterparty size, location and payment history as a means of mitigating the risk of financial loss from defaults. The Group defines default as the debt being deemed completely unrecoverable.
Liquidity Risk and Going Concern
The Group's approach to managing liquidity risk is to ensure, as far as possible, that it has sufficient liquidity to meet its liabilities as they fall due, with surplus facilities to cope with any unexpected variances in timing of cash flows. The Group meets its day-to-day working capital requirements through free cash flow, being operations-generated cash (with no external financing required). Although the statement of financial position shows net current liabilities (current assets less current liabilities), included in current liabilities is £115.9m of deferred revenue that represents future income earnings. Excluding deferred revenue held within current liabilities, the Group has net current assets of £98.6m (2024: £89.2m).
Based on cash flow projections, the Group considers the existing financing facilities to be adequate to meet short-term commitments. The Directors have a reasonable expectation that there are no material uncertainties that cast significant doubt about the Group's ability to continue in operation and meet its liabilities as they fall due for the foreseeable future, being a period of at least 12 months from the date of approval of the financial statements. Accordingly, the Group has prepared the Annual Report and Accounts on a going concern basis. The Directors have prepared a Going Concern and Long-Term Viability statement within the Group's Annual Report and Accounts for the year ended 31 December 2025, within the Strategic Report.
Explanation of non-IFRS Measures
|
Financial measure |
How we define it |
Why we use it |
|
Adjusted diluted EPS |
Adjusted profit after tax per diluted share (reconciliation between statutory profit and adjusted profit shown on page 21). Diluted share defined as total of basic weighted average number of shares (net of shares held in treasury reserve) and share options in issue at end of period (reconciliation between basic weighted average number of shares and diluted weighted average number of shares in note 8). |
In order to provide additional useful information to assess the year-on-year operational business performance. Use of these measures aids comparability to the prior year given the variability of the adjusting items size from one year to the next. |
|
Adjusted EBITDA |
Earnings before interest, tax, depreciation and amortisation, adjusted to exclude costs associated with acquisitions, restructuring of the Group, share-based payments, impairment, unrealised operating exchange rate movements and the impact of foreign exchange contracts. This is reconciled to the statutory operating profit on page 15. |
|
|
Adjusted operating profit |
Operating profit adjusted to exclude costs associated with acquisitions, restructuring of the Group and amortisation of acquired intangible assets. This is reconciled to the statutory operating profit on page 15. |
|
|
Adjusted operating profit margin |
Adjusted operating profit as a percentage of revenue. This is calculated on page 18. |
|
|
Last 12 months Adjusted EBITDA |
Earnings before interest, tax, depreciation and amortisation, adjusted to exclude costs associated with acquisitions, restructuring of the Group, share-based payments, impairment, unrealised operating exchange rate movements and the impact of foreign exchange contracts in the 12 months preceding the period end date. This is reconciled on page 23. |
|
|
Adjusted EBITDA margin |
Adjusted EBITDA as a percentage of revenue. This is calculated on page 15. |
|
|
Adjusted EPS |
Adjusted profit after tax per share (reconciliation between statutory profit and adjusted profit shown on page 21). |
|
|
Adjusted income tax expense |
Represents the statutory income tax expense adjusted for the tax effect on adjusting items. In addition, the adjusted income tax expense includes the effect of any tax rate changes. This is reconciled to the statutory income tax charge on page 20. |
|
|
Adjusted profit before tax |
Profit before tax adjusted to exclude amortisation of acquired intangible assets, costs associated with acquisitions, restructuring of the Group and revaluation of the interest rate swap. This is reconciled to the profit before tax on page 21. |
|
|
Adjusted profit after tax |
The sum of adjusted profit before tax and adjusted income tax expense. This is calculated on page 21. |
|
|
Constant currency growth |
Underlying growth is calculated by excluding the impact of movement in exchange rates. Constant currency growth is reconciled to reported growth on page 19 for revenue, operating costs, Adjusted EBITDA, Adjusted EBITDA margin and Contracted Forward Revenue. |
To give the reader an idea of the growth of the business without the impact of foreign exchange fluctuations, which may add to the transparency and understanding of the results. |
|
Free cash flow |
Cash flow generated from operations less interest paid, income taxes paid, contingent consideration paid, principal elements of lease payments and purchase of intangible and tangible assets. This is calculated on page 22. |
Indicates the extent to which the Group generates discretionary funds for reinvesting in growth, paying dividends or reducing debt. |
|
Free cash flow conversion |
Free cash flow divided by Adjusted profit before tax. This is calculated on page 22. |
|
|
Invoiced Forward Revenue |
Invoiced Forward Revenue relates to amounts that are invoiced to clients at the statement of financial position date, which relate to future revenue to be recognised. This is reconciled to deferred revenue on page 24. |
Acts as an indication of revenue visibility for the forthcoming period. |
|
Contracted Forward Revenue |
Defined as Invoiced Forward Revenue (as defined above) plus contracted revenue that has not yet been invoiced as at the statement of financial position date. This is reconciled to deferred revenue on page 24. |
|
|
Revenue Visibility |
Defined as Contracted Forward Revenue plus expected revenue from in year renewals, based upon a consistent renewal rate. |
|
|
Net cash/ (bank debt) |
Short and long-term borrowings (excluding lease liabilities) less cash and cash equivalents. This is reconciled on page 23. |
Provides an insight into the debt position of the Group, taking into account current cash resources. |
|
Net bank debt leverage |
Net bank debt calculated as a multiple of the last 12 months Adjusted EBITDA. Detailed calculation is provided on page 23. |
|
|
Net cash flow |
Free cash flow less dividends paid, net M&A costs, acquisition of own shares, cash received on drawdown of loans and cash paid on repayment of loans. This is calculated on page 23. |
Indicates the extent to which the Group generates cash from Adjusted profits. |
|
Operating cash flow conversion |
Cash flow generated from operations divided by Adjusted EBITDA. This is calculated on page 22. |
Indicates the extent to which the Group generates cash from Adjusted EBITDA. |
|
Organic growth |
Organic growth is calculated by excluding the results of acquired businesses. |
The reason we use organic and underlying growth as a metric is to give the reader an idea of the growth of the business without the impact of acquisitions and foreign exchange fluctuations, which may add to the transparency and understanding of the results. This also aids the Directors to review performance on a like-for-like basis. |
|
Underlying growth |
Underlying growth is calculated by excluding the impact of movement in exchange rates and the results of acquired businesses. Underlying revenue is reconciled to reported revenue on page 16. Underlying Contracted Forward Revenue is reconciled to reported Contracted Forward Revenue on page 24. |
Consolidated Income Statement
|
|
Notes |
Year ended 31 December 2025
|
Year ended 31 December 2024
|
|
Continuing operations |
|
£m |
£m |
|
Revenue |
4 |
322.1 |
285.5 |
|
Cost of sales |
5 |
(161.7) |
(136.6) |
|
Gross profit |
|
160.4 |
148.9 |
|
Administrative costs |
5 |
(77.9) |
(83.4) |
|
Losses on trade receivables |
5 |
(1.7) |
(1.0) |
|
Share of results of associates |
14 |
0.2 |
- |
|
Other income |
|
0.2 |
0.6 |
|
Operating profit |
|
81.2 |
65.1 |
|
Net finance costs |
7 |
(12.0) |
(10.2) |
|
Profit before tax |
|
69.2 |
54.9 |
|
Income tax expense |
|
(19.1) |
(18.4) |
|
Profit for the year |
|
50.1 |
36.5 |
|
|
|
|
|
|
Attributable to: |
|
|
|
|
Equity holders of the parent |
|
33.1 |
29.6 |
|
Non-controlling interest |
|
17.0 |
6.9 |
|
|
|
|
|
|
Earnings per share attributable to equity holders: |
|
|
|
|
Basic earnings per share (pence) |
8 |
4.4 |
3.8 |
|
Diluted earnings per share (pence) |
8 |
4.4 |
3.7 |
|
|
|
|
|
The accompanying notes form an integral part of this financial report.
Consolidated Statement of Comprehensive Income
|
|
Notes |
Year ended 31 December 2025
|
Year ended 31 December 2024
|
|
|
|
£m |
£m |
|
Profit for the year |
|
50.1 |
36.5 |
|
Other comprehensive income |
|
|
|
|
Items that will be classified subsequently to profit or loss when specific conditions are met: |
|
|
|
|
Net exchange (loss)/ gain on translation of foreign entities |
11 |
(1.9) |
0.6 |
|
Other comprehensive (loss)/ income, net of tax |
|
(1.9) |
0.6 |
|
Total comprehensive income for the year |
|
48.2 |
37.1 |
|
Attributable to: |
|
|
|
|
Equity holders of the parent |
|
32.8 |
29.4 |
|
Non-controlling interest |
|
15.4 |
7.7 |
The accompanying notes form an integral part of this financial report.
Consolidated Statement of Financial Position
|
|
Notes |
31 December 2025
£m |
31 December 2024
£m |
|
Non-current assets |
|
|
|
|
Property, plant and equipment |
|
26.0 |
28.1 |
|
Goodwill |
9 |
384.6 |
357.2 |
|
Other intangible assets |
9 |
106.9 |
101.7 |
|
Investment in associate |
14 |
4.3 |
4.0 |
|
Deferred tax assets |
|
19.2 |
22.0 |
|
|
|
541.0 |
513.0 |
|
Current assets |
|
|
|
|
Trade and other receivables |
|
87.2 |
89.9 |
|
Current tax receivable |
|
9.7 |
2.4 |
|
Short-term derivative assets |
|
0.1 |
- |
|
Cash and cash equivalents |
|
51.1 |
50.5 |
|
|
|
148.1 |
142.8 |
|
Total assets |
|
689.1 |
655.8 |
|
Current liabilities |
|
|
|
|
Trade and other payables |
|
(43.1) |
(43.2) |
|
Deferred revenue |
4 |
(115.9) |
(112.9) |
|
Short-term lease liabilities |
10 |
(4.0) |
(4.0) |
|
Current tax payable |
|
(2.2) |
(4.9) |
|
Short-term derivative liabilities |
|
(0.2) |
(1.3) |
|
Short-term provisions |
|
- |
(0.2) |
|
|
|
(165.4) |
(166.5) |
|
Net current liabilities |
|
(17.3) |
(23.7) |
|
Non-current liabilities |
|
|
|
|
Long-term trade and other payables |
|
(2.4) |
(2.7) |
|
Deferred revenue |
4 |
(1.4) |
(1.7) |
|
Long-term provisions |
|
(1.9) |
(1.5) |
|
Deferred tax liabilities |
|
(6.2) |
- |
|
Long-term lease liabilities |
10 |
(20.5) |
(22.1) |
|
Long-term borrowings |
10 |
(165.3) |
(40.4) |
|
|
|
(197.7) |
(68.4) |
|
Total liabilities |
|
(363.1) |
(234.9) |
|
Net assets |
|
326.0 |
420.9 |
|
Equity |
|
|
|
|
Share capital |
11 |
0.2 |
0.2 |
|
Treasury reserve |
11 |
(93.7) |
(100.6) |
|
Other reserve |
11 |
(44.3) |
(44.3) |
|
Foreign currency translation reserve |
11 |
(1.4) |
(1.1) |
|
Retained profit |
|
442.8 |
549.6 |
|
Equity attributable to equity holders of the parent |
|
303.6 |
403.8 |
|
Non-controlling interest |
11 |
22.4 |
17.1 |
|
Total equity |
|
326.0 |
420.9 |
The accompanying notes form an integral part of this financial report.
Consolidated Statement of Changes in Equity
|
|
Notes |
Share capital |
Treasury reserve |
Other reserve |
Foreign currency translation reserve |
Retained profit |
Equity attributable to equity holders of the parent |
Non-controlling interest |
Total equity |
|
|
|
£m |
£m |
£m |
£m |
£m |
£m |
£m |
£m |
|
Balance at 1 January 2024 |
|
0.2 |
(65.4) |
(44.3) |
(2.0) |
169.3 |
57.8 |
- |
57.8 |
|
Profit for the year |
|
- |
- |
- |
- |
29.6 |
29.6 |
6.9 |
36.5 |
|
Other comprehensive income: |
|
|
|
|
|
|
|
|
|
|
Net exchange (loss)/ gain on translation of foreign entities |
11 |
- |
- |
- |
(0.2) |
- |
(0.2) |
0.8 |
0.6 |
|
Total comprehensive income for the year |
|
- |
- |
- |
(0.2) |
29.6 |
29.4 |
7.7 |
37.1 |
|
Transactions with owners: |
|
|
|
|
|
|
|
|
|
|
Share buyback |
11 |
- |
(52.5) |
- |
- |
- |
(52.5) |
- |
(52.5) |
|
Dividends |
11 |
- |
- |
- |
- |
(37.5) |
(37.5) |
- |
(37.5) |
|
Vesting of share options |
12 |
- |
17.3 |
- |
- |
(17.3) |
- |
- |
- |
|
Gain from sale of 40% of Healthcare business, net of transaction costs incurred |
11 |
- |
- |
- |
1.1 |
412.0 |
413.1 |
(0.3) |
412.8 |
|
Equity issued to holders of non-controlling interest |
11 |
- |
- |
- |
- |
- |
- |
8.0 |
8.0 |
|
Share buyback and cancellation scheme |
11 |
- |
- |
- |
- |
(29.3) |
(29.3) |
- |
(29.3) |
|
Share-based payments charge |
12 |
- |
- |
- |
- |
22.7 |
22.7 |
1.4 |
24.1 |
|
Tax on share-based payments |
|
- |
- |
- |
- |
0.1 |
0.1 |
0.3 |
0.4 |
|
Balance at 31 December 2024 |
|
0.2 |
(100.6) |
(44.3) |
(1.1) |
549.6 |
403.8 |
17.1 |
420.9 |
|
Profit for the year |
|
- |
- |
- |
- |
33.1 |
33.1 |
17.0 |
50.1 |
|
Other comprehensive income: |
|
|
|
|
|
|
|
|
|
|
Net exchange loss on translation of foreign entities |
11 |
- |
- |
- |
(0.3) |
- |
(0.3) |
(1.6) |
(1.9) |
|
Total comprehensive income for the year |
|
- |
- |
- |
(0.3) |
33.1 |
32.8 |
15.4 |
48.2 |
|
Transactions with owners: |
|
|
|
|
|
|
|
|
|
|
Share buyback |
11 |
- |
(11.0) |
- |
- |
- |
(11.0) |
- |
(11.0) |
|
Dividends |
11 |
- |
- |
- |
- |
(9.9) |
(9.9) |
- |
(9.9) |
|
Vesting of share options |
12 |
- |
17.9 |
- |
- |
(17.9) |
- |
- |
- |
|
Gain from completion of sale of 40% of Healthcare business |
11 |
- |
- |
- |
- |
7.8 |
7.8 |
(7.8) |
- |
|
Share buyback and cancellation scheme |
11 |
- |
- |
- |
- |
(101.7) |
(101.7) |
- |
(101.7) |
|
Share-based payments credit |
12 |
- |
- |
- |
- |
(16.1) |
(16.1) |
(1.9) |
(18.0) |
|
Tax on share-based payments |
|
- |
- |
- |
- |
(2.1) |
(2.1) |
(0.4) |
(2.5) |
|
Balance at 31 December 2025 |
|
0.2 |
(93.7) |
(44.3) |
(1.4) |
442.8 |
303.6 |
22.4 |
326.0 |
The accompanying notes form an integral part of this financial report.
Consolidated Statement of Cash Flows
|
|
|
Year ended 31 December 2025 |
Year ended 31 December 2024 |
|
Cash flows from operating activities |
Notes |
£m |
£m |
|
Profit for the year |
|
50.1 |
36.5 |
|
Adjustments for: |
|
|
|
|
Depreciation |
|
6.6 |
5.8 |
|
Amortisation |
9 |
16.4 |
10.8 |
|
Other income |
|
(0.7) |
(0.6) |
|
Net exchange differences |
|
(2.3) |
- |
|
Impairment |
|
1.3 |
- |
|
Net finance costs |
7 |
12.0 |
10.2 |
|
Taxation recognised in profit or loss |
|
19.1 |
18.4 |
|
Share-based payments (credit)/ charge |
12 |
(15.4) |
24.1 |
|
Decrease/ (increase) in trade and other receivables |
|
0.1 |
(14.0) |
|
(Decrease)/ increase in trade and other payables |
|
(2.9) |
4.7 |
|
Revaluation of short- and long-term derivatives |
|
(1.2) |
1.7 |
|
Increase in provisions |
|
0.2 |
- |
|
Cash generated from operations |
|
83.3 |
97.6 |
|
Interest paid |
|
(8.8) |
(10.9) |
|
Income taxes paid |
|
(24.1) |
(40.7) |
|
Contingent consideration paid |
13 |
(2.5) |
(0.5) |
|
Total cash flows from operating activities |
|
47.9 |
45.5 |
|
Cash flows from investing activities |
|
|
|
|
Acquisitions |
13 |
(27.0) |
(68.7) |
|
Proceeds from disposal of subsidiary |
|
0.8 |
- |
|
Purchase of property, plant and equipment |
|
(2.6) |
(1.7) |
|
Purchase of intangible assets |
9 |
(5.3) |
(5.5) |
|
Total cash flows used in investing activities |
|
(34.1) |
(75.9) |
|
Cash flows from financing activities |
|
|
|
|
Settlement of borrowings in relation to acquisitions |
13 |
(6.7) |
(10.7) |
|
Proceeds from borrowings |
10 |
123.5 |
82.7 |
|
Repayment of borrowings |
10 |
- |
(305.0) |
|
Loan refinancing fee |
10 |
(0.5) |
(2.4) |
|
Acquisition of own shares |
11 |
(11.0) |
(52.5) |
|
Acquisition of own shares for cancellation |
11 |
(101.5) |
(29.3) |
|
Principal elements of lease payments |
10 |
(5.6) |
(5.6) |
|
Dividends paid |
11 |
(9.9) |
(37.5) |
|
Proceeds from sale of 40% of Healthcare business to non-controlling interest |
11 |
- |
443.4 |
|
Receipt of loan from related party |
11 |
- |
8.0 |
|
Transaction costs relating to sale of 40% of Healthcare business to non-controlling interest |
11 |
- |
(30.6) |
|
Total cash flows (used in)/ from financing activities |
|
(11.7) |
60.5 |
|
Net increase in cash and cash equivalents |
|
2.1 |
30.1 |
|
Cash and cash equivalents at beginning of year |
|
50.5 |
19.8 |
|
Effects of currency translation on cash and cash equivalents |
|
(1.5) |
0.6 |
|
Cash and cash equivalents at end of year |
|
51.1 |
50.5 |
The accompanying notes form an integral part of this financial report.
Notes to the Consolidated Financial Statements
1. General information
Nature of operations
The principal activity of GlobalData Plc and its subsidiaries (together 'the Group'), is to provide an intelligence and productivity platform that empowers leaders to act decisively in a world of complexity and change. By uniting proprietary data, human expertise, and purpose-built AI into a single, connected platform, we help organisations to see what's coming, move faster, and lead with confidence.
GlobalData Plc ('the Company') is a company incorporated in the United Kingdom (England & Wales) and listed on the Alternative Investment Market (AIM), therefore is publicly owned and limited by shares. The registered office of the Company is John Carpenter House, John Carpenter Street, London, EC4Y 0AN. The registered number of the Company is 03925319.
Basis of preparation
The condensed financial statements have been prepared on the historical cost basis, except for derivative financial instruments, which are measured at fair value. While the information included in the condensed financial statements has been prepared in accordance with United Kingdom adopted international accounting standards and in conformity with the requirements of the Companies Act 2006 and International Financial Reporting Standards as issued by the IASB, this announcement does not itself contain sufficient information to comply with United Kingdom adopted International Accounting Standards. The condensed financial statements for the year ended 31 December 2025 have been prepared on a consistent basis with the financial accounting policies set out in the Accounting Policies section of GlobalData Plc's Annual Report and Accounts for the year ended 31 December 2025. These condensed financial statements are presented in Pounds Sterling (£).
The financial information for the year ended 31 December 2025 does not constitute statutory accounts as defined in section 434 of the Companies Act 2006. A copy of the statutory accounts for the year ended 31 December 2025 will be delivered to the Registrar of Companies in due course. The independent auditors' report on the full financial statements for the year ended 31 December 2025 was unqualified and did not contain an emphasis of matter paragraph or any statement under section 498 of the Companies Act 2006.
Consideration of climate change
In preparing the financial statements, management have considered the impact of climate change, particularly in the context of the risks identified in the Non-Financial and Sustainability Information Statement within the Group's Annual Report and Accounts for the year ended 31 December 2025. In particular, management considered the impact of climate change in respect of the following areas of accounting judgement or estimate:
· the assessment of goodwill, other intangibles and tangible fixed assets;
· the assessment of impairment of financial assets;
· our consideration of going concern and viability;
· the useful economic lives of assets; and
· the preparation of budgets and forecasts.
As a result of these considerations, no material climate change related impact was identified. Management are however aware of the changing nature of the risks associated with climate change and will regularly reassess these against the judgements and estimates made in preparing the Group's financial statements.
Critical accounting estimates and judgements
The Group makes estimates and assumptions regarding the future. Estimates and judgements are continually evaluated based on historical experience and other factors, including expectations of future events that are believed to be reasonable under the circumstances.
In the future, actual experience may deviate from these estimates and assumptions. The estimates and assumptions that have a significant risk of causing a material adjustment to the carrying amounts of assets and liabilities within the next financial year are discussed in detail below. Climate-related risks did not have a material impact on the financial statements.
Key sources of estimation uncertainty
Management have assessed that there are no key sources of estimation uncertainty.
Critical accounting judgements
Identification of Cash-Generating Units
IAS36: Impairment of Assets requires that assets be carried on the statement of financial position at no more than their recoverable amount. An asset or cash-generating unit (CGU) is the smallest identifiable group of assets that generates cash inflows and is impaired when its carrying amount exceeds its recoverable amount. As at the date of the impairment review (31 December 2025), Management has made the judgement that the Group had three CGUs, being DA&I Healthcare; DA&I Non-Healthcare and MBI, this judgement has remained unchanged from the prior year.
There has been no change to Management's assessment that MBI is its own CGU, on the basis that there have been no significant changes made to the operation of this business within the financial year, the product is inherently different to the Groups' main offering, and the brand, strategy and management of the business is separate from the rest of the Group and the business operates within separate legal entities generating independent cash flows.
Management have assessed the new acquisitions in the year (Ai Palette and Stylus) and have concluded that both form part of the DA&I Non-Healthcare CGU on the basis that the cash flows which the acquired assets generate are co-mingled with the DA&I Non-Healthcare CGU due to the cross-sell activities sitting within the GlobalData entities and the combined product offering.
As a result of these conclusions, as at the reporting date (31 December 2025), the Group had three CGUs.
Going concern
The Group meets its day-to-day working capital requirements through free cash flow. The Group has closing cash of £51.1m as at 31 December 2025 and net bank debt of £114.2m (31 December 2024: cash of £50.5m and net cash of £10.1m), being cash and cash equivalents less short and long-term borrowings, excluding lease liabilities. During December 2024, the Group secured debt financing facilities which mature in December 2027 (with an option to extend further by a year, subject to agreement by both parties). The facilities comprise of a £200.0m facility for the Healthcare business as well as a separate £185.0m facility for the rest of the Group ('Non-Healthcare'). The facilities include a general-purpose Revolving Capital Facility 'RCF' (Healthcare: £130.0m; Non-Healthcare: £135.0m) and an Acquisition and Capex Facility 'ACF', which can only be used for the purpose of making acquisitions (Healthcare: £70m; Non-Healthcare: £50m). As at 31 December 2025, the Group had drawn £37.0m from the Healthcare facility and £131.0m from the Non-Healthcare facility. Further details of the Group's loan facilities are provided in note 10.
The finance facilities were issued with debt covenants which are measured on a quarterly basis. There have been no breaches of covenants in the year ended 31 December 2025. Management has reviewed forecast cash flows and there is no indication that there will be any breach in the next 12 months.
The Directors have a reasonable expectation that there are no material uncertainties that cast significant doubt about the Group and Parent company's ability to continue in operation and meet its liabilities as they fall due for the foreseeable future, being a period of at least 12 months from the date of approval of the financial statements. To complete the going concern assessment the Directors have modelled for each of the two Group segments (aligned with the two separate facilities) a base case, applied sensitivities to the base case and modelled a reverse stress test for the period to September 2027. The base case models assume that the Group's financial performance is consistent with the budget for 2026 followed by growth rates based on Management's expectation of future performance. Under the two base case models, the Group maintains a significant level of positive liquidity headroom. The Directors have applied reasonable downside sensitivities to each base case model, acknowledging that such risks and uncertainties exist. The downside scenarios modelled included the following assumptions:
· Healthcare: A combined scenario with revenue in 2026 being 4.5% lower than expectation and costs in 2026 being 2.4% higher than expectation, resulting in a net reduction to 2026 Adjusted EBITDA of 10.7%.
· Non-Healthcare: A combined scenario with revenue in 2026 being 5.4% lower than expectation and costs in 2026 being 1.6% higher than expectation, resulting in a net reduction to 2026 Adjusted EBITDA of 20.6%.
The Group maintains liquidity and there remains headroom on the covenants during the period running to September 2027 under each scenario modelled across the two segments.
In addition to performing scenario planning, the Directors have also conducted a reverse stress test which shows that the Group can afford to lose 47.8% of its budgeted 2026 sales across the Healthcare segment and 12.5% of its budgeted 2026 sales across the Non-Healthcare segment and maintain compliance with debt covenants for the period running to September 2027; this extremely remote scenario assumes no cost mitigation actions are taken.
Through our normal business practices, we are in regular communication with our lenders and are satisfied they will be in a position to continue supporting us for the foreseeable future.
Although the statement of financial position shows net current liabilities (current assets less current liabilities), included in current liabilities is £115.9m of deferred revenue that represents future income earnings. Excluding deferred revenue held within current liabilities, the Group has net current assets of £98.6m (2024: £89.2m).
The Directors therefore consider the strong balance sheet, with good cash reserves and working capital along with financing arrangements, provide ample liquidity. Accordingly, the Directors have prepared the financial statements on a going concern basis.
2. Accounting policies
These condensed financial statements have been prepared based on the accounting policies detailed in the Group's financial statements for the year ended 31 December 2025 and is consistent with the policies applied in the previous year, except for the following new standards The new standard which was effective during the year (and has not had any material impact on the disclosures or on the amounts reported in these financial statements) is:
· Amendments to IAS 21: Lack of exchangeability (effective date: 1 January 2025).
Presentation of non-statutory alternative performance measures
The Directors believe that Adjusted EBITDA, Adjusted EBITDA margin, Adjusted operating profit, Adjusted operating profit margin, Adjusted profit before tax, Adjusted profit after tax and Adjusted earnings per share provide additional useful information on the operational performance of the Group to shareholders, and we review the results of the Group using these measures internally. The term 'adjusted' is not a defined term under IFRS and may not therefore be comparable with similarly titled profit measures reported by other companies. It is not intended to be a substitute for, or superior to, IFRS measures of profit.
Adjustments are made to Adjusted EBITDA and Adjusted operating profits (which is a new alternative performance measure reported by the Group this year) in respect of:
|
Restructuring, corporate projects and refinancing costs |
The Group excludes these costs where the nature of the item, or its size, is not related to the operational performance of the Group and allows for comparability of underlying results. |
|
Acquisition and integration costs (including contingent consideration) |
|
|
Amortisation and impairment of acquired intangible assets |
The amortisation charge for those intangible assets recognised on business combinations is excluded since they are non-cash charges arising from historical investment activities. Any impairment charges recognised in relation to these intangible assets are also excluded. This is a common adjustment made by acquisitive information service businesses and is therefore consistent with peers. Revenues associated with acquisitions, in the year of acquisition, are excluded from the calculation of underlying revenue. |
Adjustments are additionally made to Adjusted EBITDA in respect of:
|
Share-based payments and associated costs |
Share-based payment expenses are excluded from Adjusted EBITDA as they are a predominantly non-cash charge and the awards are equity-settled. |
|
Impairment |
The Group excludes these costs from Adjusted EBITDA where the nature of the item, or its size, is not related to the operational performance of the Group and allows for comparability of underlying results. |
|
Revaluation of short- and long-term derivatives |
Gains and losses are recognised within Adjusted EBITDA when they are realised in cash terms and therefore we exclude non-cash movements arising from fluctuations in exchange rates which better aligns Adjusted EBITDA with the cash performance of the business. |
|
Unrealised operating foreign exchange gain/loss |
3. Segmental analysis
The principal activity of GlobalData Plc and its subsidiaries (together 'the Group'), is to provide an intelligence and productivity platform that empowers leaders to act decisively in a world of complexity and change. By uniting proprietary data, human expertise, and purpose-built AI into a single, connected platform, we help organisations to see what's coming, move faster, and lead with confidence.
IFRS8: Operating Segments requires the segment information presented in the financial statements to be that which is used internally by the Chief Operating Decision Maker (CODM) to evaluate the performance of the business and to decide how to allocate resources. The Group has identified the Chief Executive as its Chief Operating Decision Maker.
The fundamental principle of the GlobalData business model is to provide our clients with subscription access to our proprietary data, analytics, and insights platform, with the offering of ancillary services such as consulting, single copy reports and events. The Group's two reportable segments are 'Data, Analytics and Insights: Healthcare' and 'Data, Analytics and Insights: Non-Healthcare'. The results of the two segments are reported to the Chief Executive on a monthly basis.
There is no difference between the Group's operating segments and the Group's reportable segments.
Each segment generates revenue from services provided over a period of time such as recurring subscriptions and other services which are deliverable at a point in time such as reports, events and custom research. The services differ by subject matter which have been grouped into the categories of Healthcare and Non-Healthcare. There is no material trade between segments.
The Group profit or loss by segment is reported to the Chief Executive on a monthly basis, the Chief Executive also monitors revenue within the operating segments.
The Group considers the use of two operating segments to be appropriate due to:
· The Chief Executive reviewing financials at the Group level and segment level on a monthly basis;
· Each segment engages in business activities from which it earns revenues and incurs expenses;
· Discrete financial information is available for each segment.
Each operating segment is assessed by the Board on an Adjusted EBITDA basis. Reportable segment Adjusted EBITDA is used to measure performance as management believes that such information is most relevant in evaluating the results of the reportable segments.
Following the separation of the Group's Healthcare business into separate legal entities during 2024, the Group can now allocate adjusting items, depreciation, amortisation, finance income and cost between segments. However, restatement of comparative information was determined to be impracticable due to unavailability of historical information under the new cost allocation structure.
A reconciliation of revenue to Profit after Tax on a reportable segment basis is set out below:
|
Year ended 31 December 2025 |
DA&I: Non- Healthcare £m |
DA&I: Healthcare
£m |
Corporate
£m |
Total
£m |
|
Revenue |
198.8 |
123.3 |
- |
322.1 |
|
Operating costs |
(148.6) |
(61.5) |
(1.8) |
(211.9) |
|
Adjusted EBITDA |
50.2 |
61.8 |
(1.8) |
110.2 |
|
Share-based payments credit |
10.7 |
4.7 |
- |
15.4 |
|
Restructuring, corporate projects and refinancing costs |
(5.7) |
(1.5) |
(4.0) |
(11.2) |
|
Acquisition and integration costs |
(5.8) |
(1.3) |
- |
(7.1) |
|
Costs relating to share-based payment schemes |
(1.5) |
(0.2) |
- |
(1.7) |
|
Revaluation gain on short- and long-term derivatives |
0.6 |
0.6 |
- |
1.2 |
|
Unrealised operating foreign exchange (loss)/gain |
(2.0) |
2.4 |
- |
0.4 |
|
India Wage Code liability true-up |
(1.3) |
(0.4) |
- |
(1.7) |
|
Amortisation of acquired intangibles |
(9.6) |
(2.5) |
- |
(12.1) |
|
Amortisation (excluding amortisation of acquired intangible assets) |
(4.2) |
(0.1) |
- |
(4.3) |
|
Depreciation |
(4.9) |
(1.7) |
- |
(6.6) |
|
Impairment |
(1.3) |
- |
- |
(1.3) |
|
Finance costs |
(7.2) |
(4.8) |
- |
(12.0) |
|
Taxation |
(4.7) |
(14.4) |
- |
(19.1) |
|
Profit after tax |
13.3 |
42.6 |
(5.8) |
50.1 |
A reconciliation of revenue to Adjusted EBITDA on a reportable segment and at a Group level to Profit after Tax for the comparative period is set out below:
|
Year ended 31 December 2024 |
DA&I: Non- Healthcare £m |
DA&I: Healthcare
£m |
Corporate
£m |
Total
£m |
|
Revenue |
176.1 |
109.4 |
- |
285.5 |
|
Operating costs |
(117.9) |
(48.5) |
(2.3) |
(168.7) |
|
Adjusted EBITDA |
58.2 |
60.9 |
(2.3) |
116.8 |
|
Unallocated group costs: |
|
|
|
|
|
Share-based payments charge |
|
|
|
(24.1) |
|
Restructuring, corporate projects and refinancing costs |
|
|
|
(5.3) |
|
Acquisition and integration costs |
|
|
|
(4.0) |
|
Costs relating to share-based payment schemes |
|
|
|
(0.3) |
|
Revaluation loss on short- and long-term derivatives |
|
|
|
(1.7) |
|
Unrealised operating foreign exchange gain |
|
|
|
0.3 |
|
Amortisation of acquired intangibles |
|
|
|
(8.9) |
|
Amortisation (excluding amortisation of acquired intangible assets) |
|
|
|
(1.9) |
|
Depreciation |
|
|
|
(5.8) |
|
Finance costs |
|
|
|
(10.2) |
|
Taxation |
|
|
|
(18.4) |
|
Profit after tax |
|
|
|
36.5 |
Segment assets and liabilities
Segment assets and liabilities are reported to the CODM in accordance with the management approach defined in IFRS 8: Operating Segments. Following the separation of the Group's Healthcare business into separate legal entities during 2024, the Group identifies its reportable segments as Data, Analytics & Insights: Healthcare and Data Analytics & Insights: Non-Healthcare. For balance sheet review, the CODM monitors Data Analytics & Insights: Healthcare by reviewing the total assets and liabilities held within the separately carved out Healthcare legal entities. All other assets and liabilities held by the Group, including the Data Analytics & Insights: Non-Healthcare segment, are reported within the 'Remaining Group'. A summary is presented below which reconciles to the Consolidated Statement of Financial Position. Measurements are consistent with the Group's accounting policies. Comparative information has been provided below.
|
As at 31 December 2025 |
DA&I: Healthcare
£m |
Remaining Group
£m |
Total Reported to CODM £m |
Reclassifications*
£m |
Total
£m |
|
Non-current assets |
78.3 |
462.7 |
541.0 |
- |
541.0 |
|
Current assets |
73.8 |
74.3 |
148.1 |
- |
148.1 |
|
Total assets |
152.1 |
537.0 |
689.1 |
- |
689.1 |
|
|
|
|
|
|
|
|
Current liabilities |
(53.7) |
(115.5) |
(169.2) |
3.8 |
(165.4) |
|
Non-current liabilities |
(42.4) |
(151.5) |
(193.9) |
(3.8) |
(197.7) |
|
Total liabilities |
(96.1) |
(267.0) |
(363.1) |
- |
(363.1) |
* Certain balances reported to the CODM have been reclassified to conform with the presentation in the Consolidated Statement of Financial Position.
|
As at 31 December 2024 |
DA&I: Healthcare
£m |
Remaining Group
£m |
Total Reported to CODM £m |
Reclassifications*
£m |
Total
£m |
|
Non-current assets |
77.1 |
435.9 |
513.0 |
- |
513.0 |
|
Current assets |
61.7 |
81.1 |
142.8 |
- |
142.8 |
|
Total assets |
138.8 |
517.0 |
655.8 |
- |
655.8 |
|
|
|
|
|
|
|
|
Current liabilities |
(59.9) |
(111.0) |
(170.9) |
4.4 |
(166.5) |
|
Non-current liabilities |
(36.1) |
(27.9) |
(64.0) |
(4.4) |
(68.4) |
|
Total liabilities |
(96.0) |
(138.9) |
(234.9) |
- |
(234.9) |
* Certain balances reported to the CODM have been reclassified to conform with the presentation in the Consolidated Statement of Financial Position.
Geographical analysis
Our primary geographical markets are serviced by our global sales teams which are organised as Europe, US and Asia Pacific by virtue of the team location. The below disaggregated revenue is derived from the geographical location of our customers rather than the team structure the Group is organised by. The geographical analysis is calculated based on sales order data apportioned over the Group's revenue for each financial period.
From continuing operations
|
Year ended 31 December 2025 |
UK |
Europe |
Americas1 |
Asia Pacific |
MENA2 |
Rest of World |
Total |
|
|
£m |
£m |
£m |
£m |
£m |
£m |
£m |
|
Revenue from external customers |
48.8 |
85.1 |
126.8 |
28.6 |
22.9 |
9.9 |
322.1 |
|
Year ended 31 December 2024 |
UK |
Europe |
Americas1 |
Asia Pacific |
MENA2 |
Rest of World |
Total |
|
|
£m |
£m |
£m |
£m |
£m |
£m |
£m |
|
Revenue from external customers |
44.3 |
78.2 |
104.0 |
27.7 |
22.2 |
9.1 |
285.5 |
1. Americas includes revenue from the United States of America of £121.3m (2024: £98.9m)
2. Middle East & North Africa
Intangible assets held in the US and Canada were £64.8m (2024: £67.6m), of which £46.9m related to goodwill (2024: £46.7m). Intangible assets held in the UAE were £11.4m (2024: £11.4m) of which £11.4m related to goodwill (2024: £11.4m). All other non-current assets are held in the UK. The largest customer represented less than 1% of the Group's consolidated revenue.
4. Revenue
The Group generates revenue from services provided over a period of time such as recurring subscriptions and other services which are deliverable at a point in time such as reports, events and custom research.
Subscription income for online services, data and analytics (typically 12 months) is normally invoiced at the beginning of the services and is therefore recognised as a contract liability, "deferred revenue", in the statement of financial position. Revenue is recognised evenly over the period of the contractual term as the performance obligations are satisfied evenly over the term of subscription.
The revenue on services delivered at a point in time is recognised when our contractual obligation is satisfied, such as delivery of a static report, delivery of a milestone within a consultancy project or delivery of an event. The obligation on these types of contracts is a discrete obligation, which once met satisfies the Group performance obligation under the terms of the contract.
Any invoiced contracted amounts which are still subject to performance obligations and where the payment has been received or is contractually due are recognised within deferred revenue at the statement of financial position date. Typically, the Group receives settlement of cash at the start of each contract and standard terms are zero days. Similarly, if the Group satisfies a performance obligation before it receives the consideration or is contractually due the Group recognises a contract asset within accrued income in the statement of financial position.
|
|
Revenue recognised in the Consolidated Income Statement |
Deferred Revenue recognised within the Consolidated Statement of Financial Position |
||
|
|
Year ended 31 December 2025 |
Year ended 31 December 2024 |
As at 31 December 2025 |
As at 31 December 2024 Restated* |
|
|
£m |
£m |
£m |
£m |
|
Services transferred: |
|
|
|
|
|
Over a period of time |
237.0 |
215.2 |
89.6 |
89.0 |
|
At a point in time |
85.1 |
70.3 |
27.7 |
25.6 |
|
Total |
322.1 |
285.5 |
117.3 |
114.6 |
*Management have identified that £12.6m of deferred revenue previously classified as services transferred over a period of time, should have been reported as services transferred at a point in time, as such, whilst this is not material, the prior period comparatives have been restated to reflect this change.
As subscriptions are typically for periods of 12 months the majority of deferred revenue held at 31 December will be recognised in the income statement in the following year. As at 31 December 2025, £1.4m (2024: £1.7m) of the deferred revenue balance will be recognised beyond the next 12 months and therefore has been presented within non-current liabilities within the Consolidated Statement of Financial Position as at 31 December 2025. In the year ended 31 December 2025 the Group recognised revenue of £112.9m (2024: £102.6m) that was included in the deferred revenue balance at the beginning of the period. The opening deferred revenue balance as at 1 January 2024 was £104.6m.
As at 31 December 2025, the total non-cancellable obligations within deferred revenue to fulfil revenue amounted to £117.3m (2024: £114.6m). As at the same date, the total non-cancellable obligations within Invoiced Forward Revenue to fulfil revenue amounted to £147.4m (2024: £145.3m). Movement in the deferred revenue balance within the year relates to releases of revenue to the consolidated income statement due to contractual obligations being satisfied, offset by new customer invoices raised in the year where the performance obligations are yet to be satisfied.
In instances where the Group enters into transactions involving a range of the Group's services, for example a subscription and custom research, the total transaction price for a contract is allocated amongst the various performance obligations based on their relative stand-alone selling prices.
5. Operating profit
Operating profit is stated after the following expenses relating to continuing operations.
|
|
|
Year ended 31 December 2025 |
Year ended 31 December 2024 |
|
|
|
£m |
£m |
|
Cost of sales |
|
161.7 |
136.6 |
|
Administrative costs |
|
77.9 |
83.4 |
|
|
|
239.6 |
220.0 |
|
Losses on trade receivables |
|
1.7 |
1.0 |
|
Total operating expenses |
|
241.3 |
221.0 |
Cost of sales includes all directly attributable costs of sale including product, consulting and sales costs. Administrative costs includes all other costs of operations.
6. Adjusting items
|
|
Year ended 31 December 2025 |
Year ended 31 December 2024 |
|
|
£m |
£m |
|
Share-based payments (credit)/ charge |
(15.4) |
24.1 |
|
Amortisation of acquired intangibles |
12.1 |
8.9 |
|
Restructuring, corporate projects and refinancing costs |
11.2 |
5.3 |
|
Acquisition and integration costs |
7.1 |
4.0 |
|
India Wage Code liability true-up |
1.7 |
- |
|
Costs relating to share-based payments scheme |
1.7 |
0.3 |
|
Revaluation (gain)/ loss on short- and long-term derivatives |
(1.2) |
1.7 |
|
Unrealised operating foreign exchange gain |
(0.4) |
(0.3) |
|
Impairment |
1.3 |
- |
|
Total adjusting items |
18.1 |
44.0 |
The adjustments made are as follows:
· The share-based payments (credit)/ charge is in relation to the share-based compensation plans (detailed in note 12) under which the entity receives services from employees as consideration for equity instruments (options) of the Group. The fair value of the employee services received in exchange for the grant of the options and awards is recognised as an expense in the income statement. The total amount to be expensed is determined by reference to the fair value of the options granted. The original fair value on grant date is charged to the income statement based upon the Monte-Carlo method. Following modification on 30 November 2022, an additional charge for the beneficial modification was determined by the Black-Scholes method. The options vest once certain financial targets have been achieved. A credit has been recognised in relation to the share-based payment schemes this year due to the EBITDA target for financial year ended 31 December 2025 not being met, and the expectation that the EBITDA target for the financial year ending 31 December 2026 is unlikely to be met. This has resulted in share-based payments charges recognised in prior years being reversed in the current year.
· The amortisation charge for those intangible assets recognised on business combinations.
· Restructuring and corporate project costs totalling £11.1m have been recognised within the Group, which have principally arisen as a result of exit costs linked to restructuring projects and legal fees relating to the share tender performed during the year. This category also contains corporate project costs associated with the proposed AIM to Main Market movement and defence costs for the Private Equity approaches in the first half of 2025. Refinancing costs totalling £0.1m have also been recognised within the Group.
· On 31 October 2025, the Group completed the sale of 100% of the share capital of Internet Business Group Limited, for cash consideration of £1.3m. Net of cash held by the entity at the date of disposal, the net cash proceeds to the Group from the disposal were £0.8m. Upon disposal of the subsidiary entity, the Group made a net gain of £0.2m including legal fees incurred in relation to the sale, which is included within restructuring costs.
· Acquisition and integration costs includes legal and professional fees and integration related expenses incurred in relation to recent acquisitions made by the Group (see note 13). Included within this category are contingent consideration amounts relating to payments due to the previous owners of LinkUp and Ai Palette and retention bonuses due to employees of Celent between 2025 and 2026. These have been treated as remuneration costs due to being contingent upon the former owners remaining as employees of the Group at the time of payment.
· India Wage Code liability true-up costs of £1.7m which relate to prior years have been recognised in relation to increased gratuity and leave encashment provisions required as a result of changes in the Wage code in India which was enacted during the year.
· Costs relating to share-based payments scheme consist of professional fees incurred in advice obtained relating to the scheme. Additionally included is the anticipated cost associated with a legal claim connected with the share-based payments scheme.
· The revaluation of short- and long-term derivatives relates to movement in the fair value of the short- and long-term derivatives.
· Unrealised operating foreign exchange gains and losses relate to non-cash exchange gains and losses made on operating items.
· Impairment charges of £1.3m have been recognised of which £1.2m relates to a leasehold property.
7. Net finance costs
|
|
Year ended 31 December 2025 |
Year ended 31 December 2024 |
|
|
£m |
£m |
|
Loan interest cost |
10.8 |
13.6 |
|
Lease interest cost |
1.2 |
1.1 |
|
Revaluation of interest rate swap |
- |
(2.8) |
|
Other interest cost |
0.2 |
- |
|
Other interest income |
(0.2) |
(1.7) |
|
|
12.0 |
10.2 |
Loan interest cost includes non-cash interest relating to financial liabilities measured at amortised cost of £1.9m (2024: £1.4m).
The Group discontinued hedge accounting for the previously held interest rate swap during the year ended 31 December 2023 as the hedged items (future interest repayments) were no longer probable or expected to occur; therefore all gains and losses in relation to the swap were recognised within the income statement during the year ended 31 December 2024.
8. Earnings per share
The calculation of the basic earnings per share is based on the earnings attributable to ordinary shareholders of the parent company divided by the weighted average number of shares in issue during the period. The Group also has a share options scheme in place and therefore the Group has calculated the dilutive effect of these options.
|
|
Year ended 31 December 2025 |
Year ended 31 December 2024 |
|
|
Earnings per share attributable to equity holders from continuing operations: |
|
|
|
|
Basic |
|
|
|
|
Profit for the period attributable to equity shareholders (£m) |
50.1 |
36.5 |
|
|
Less: non-controlling interest (£m) |
(17.0) |
(6.9) |
|
|
Profit for the period attributable to ordinary shareholders of the parent company (£m) |
33.1 |
29.6 |
|
|
Weighted average number of shares (no' m) |
748.6 |
789.1 |
|
|
Basic earnings per share (pence) |
4.4 |
3.8 |
|
|
Diluted |
|
|
|
|
Profit for the period attributable to equity shareholders (£m) |
50.1 |
36.5 |
|
|
Less: non-controlling interest (£m) |
(17.0) |
(6.9) |
|
|
Profit for the period attributable to ordinary shareholders of the parent company (£m) |
33.1 |
29.6 |
|
|
Weighted average number of shares (no' m) |
749.6 |
799.4 |
|
|
Diluted earnings per share (pence) |
4.4 |
3.7 |
Reconciliation of basic weighted average number of shares to the diluted weighted average number of shares:
|
|
|
Year ended 31 December 2025 No' m |
Year ended 31 December 2024 No' m |
|
|
|
||
|
Basic weighted average number of shares, net of shares held in treasury reserve |
|
748.6 |
789.1 |
|
Dilutive share options in issue - scheme 1 |
|
0.7 |
1.2 |
|
Dilutive share options in issue - scheme 2 |
|
- |
6.5 |
|
Dilutive share options in issue - scheme 4 |
|
0.3 |
2.6 |
|
Diluted weighted average number of shares |
|
749.6 |
799.4 |
The diluted earnings per share calculation does not include performance-related share options where the performance criteria had not been met in the period, in accordance with IAS 33. The table below shows the number of share options which could become dilutive should future performance criteria be met. It excludes 320,000 options which are anticipated to vest in the year ended 31 December 2026 as these are included in the diluted weighted average number of shares calculation above given the performance criteria for these options has been met.
Also excluded from the below table are shares which will be sold by the Group's EBT during 2026 in order to satisfy the cash-settled exceptional STIP awards, on the basis that these are not share options in issue.
|
Potentially dilutive shares |
Total |
|
Schedule |
No. |
|
Scheme 2 |
- |
|
Scheme 4 |
1,900,000 |
|
Total |
1,900,000 |
9. Intangible assets
|
|
AUC* |
Software |
Customer relationships |
Brands |
IP rights and database |
Goodwill |
Total |
|
||||||
|
|
£m |
£m |
£m |
£m |
£m |
£m |
£m |
|
||||||
|
Cost |
|
|
|
|
|
|
|
|
||||||
|
As at 1 January 2024 |
0.2 |
18.4 |
65.3 |
26.3 |
77.9 |
322.0 |
510.1 |
|||||||
|
Additions: Business combinations |
- |
1.7 |
26.3 |
9.4 |
8.9 |
46.1 |
92.4 |
|||||||
|
Additions: Internally developed |
4.9 |
- |
- |
- |
- |
- |
4.9 |
|||||||
|
Additions: Separately acquired |
- |
0.4 |
- |
0.2 |
- |
- |
0.6 |
|||||||
|
Transfer AUC to software |
(0.5) |
0.5 |
- |
- |
- |
- |
- |
|||||||
|
Foreign currency retranslation |
- |
0.1 |
- |
- |
- |
- |
0.1 |
|||||||
|
Disposals |
- |
(0.1) |
- |
- |
- |
- |
(0.1) |
|||||||
|
As at 31 December 2024 |
4.6 |
21.0 |
91.6 |
35.9 |
86.8 |
368.1 |
608.0 |
|||||||
|
Additions: Business combinations |
- |
3.7 |
5.7 |
1.6 |
7.2 |
26.2 |
44.4 |
|||||||
|
Additions: Internally developed |
3.9 |
0.5 |
- |
- |
- |
- |
4.4 |
|||||||
|
Additions: Separately acquired |
0.4 |
0.3 |
- |
0.2 |
- |
- |
0.9 |
|||||||
|
Transfer AUC to software |
(6.1) |
6.1 |
- |
- |
- |
- |
- |
|||||||
|
Fair value adjustment |
- |
- |
- |
- |
- |
1.2 |
1.2 |
|||||||
|
Foreign currency retranslation |
- |
(0.4) |
- |
- |
- |
- |
(0.4) |
|||||||
|
As at 31 December 2025 |
2.8 |
31.2 |
97.3 |
37.7 |
94.0 |
395.5 |
658.5 |
|||||||
|
|
|
|
|
|
|
|
|
|
||||||
|
Amortisation |
|
|
|
|
|
|
|
|
||||||
|
As at 1 January 2024 |
- |
(14.5) |
(42.5) |
(13.4) |
(56.0) |
(10.9) |
(137.3) |
|||||||
|
Additions: Business combinations |
- |
(1.1) |
- |
- |
- |
- |
(1.1) |
|||||||
|
Charge for the year |
- |
(1.9) |
(4.4) |
(1.3) |
(3.2) |
- |
(10.8) |
|||||||
|
Disposals |
- |
0.1 |
- |
- |
- |
- |
0.1 |
|||||||
|
As at 31 December 2024 |
- |
(17.4) |
(46.9) |
(14.7) |
(59.2) |
(10.9) |
(149.1) |
|||||||
|
Additions: Business combinations |
- |
(1.7) |
- |
- |
- |
- |
(1.7) |
|||||||
|
Charge for the year |
- |
(4.4) |
(5.9) |
(2.0) |
(4.1) |
- |
(16.4) |
|||||||
|
Impairment |
- |
- |
(0.1) |
- |
- |
- |
(0.1) |
|||||||
|
Foreign currency retranslation |
- |
0.3 |
- |
- |
- |
- |
0.3 |
|||||||
|
As at 31 December 2025 |
- |
(23.2) |
(52.9) |
(16.7) |
(63.3) |
(10.9) |
(167.0) |
|||||||
|
|
|
|
|
|
|
|
|
|||||||
|
Net book value |
|
|
|
|
|
|
|
|||||||
|
As at 31 December 2025 |
2.8 |
8.0 |
44.4 |
21.0 |
30.7 |
384.6 |
491.5 |
|||||||
|
As at 31 December 2024 |
4.6 |
3.6 |
44.7 |
21.2 |
27.6 |
357.2 |
458.9 |
|||||||
*AUC: Assets under construction which will be transferred to software post development.
10. Borrowings
|
|
|
31 December 2025 £m |
31 December 2024 £m |
|
Short-term lease liabilities |
|
4.0 |
4.0 |
|
Current liabilities |
|
4.0 |
4.0 |
|
|
|
|
|
|
Long-term lease liabilities |
|
20.5 |
22.1 |
|
Long-term borrowings |
|
165.3 |
40.4 |
|
Non-current liabilities |
|
185.8 |
62.5 |
The changes in the Group's borrowings can be classified as follows:
|
|
|
Long-term borrowings |
Short-term lease liabilities1
|
Long-term lease liabilities1
|
Total
|
|
|
|
£m |
£m |
£m |
£m |
|
As at 1 January 2024 |
|
263.7 |
4.3 |
21.4 |
289.4 |
|
Cash flows: |
|
|
|
|
|
|
- Repayment |
|
- |
(5.6) |
- |
(5.6) |
|
- Drawdown of RCF (previously held facility) |
|
40.0 |
- |
- |
40.0 |
|
- Settlement of loan |
|
(305.0) |
- |
- |
(305.0) |
|
- Drawdown of RCF (new facility) |
|
42.7 |
- |
- |
42.7 |
|
- Loan fees paid |
|
(2.4) |
- |
- |
(2.4) |
|
Non-cash: |
|
|
|
|
|
|
- Interest expense |
|
1.4 |
- |
- |
1.4 |
|
- Lease additions |
|
- |
5.5 |
- |
5.5 |
|
- Lease liabilities2 |
|
- |
0.5 |
- |
0.5 |
|
- Reclassification |
|
- |
(0.7) |
0.7 |
- |
|
As at 31 December 2024 |
|
40.4 |
4.0 |
22.1 |
66.5 |
|
Cash flows: |
|
|
|
|
|
|
- Repayment |
|
- |
(5.6) |
- |
(5.6) |
|
- Drawdown of RCF / ACF (new facility) |
|
123.5 |
- |
- |
123.5 |
|
- Loan fees paid |
|
(0.5) |
- |
- |
(0.5) |
|
Non-cash: |
|
|
|
|
|
|
- Interest expense |
|
1.9 |
- |
- |
1.9 |
|
- Lease additions |
|
- |
3.5 |
- |
3.5 |
|
- Lease liabilities2 |
|
- |
0.8 |
(0.3) |
0.5 |
|
- Reclassification |
|
- |
1.3 |
(1.3) |
- |
|
As at 31 December 2025 |
|
165.3 |
4.0 |
20.5 |
189.8 |
1 Amounts are net of rental prepayments and accruals
2 Represents lease interest, dilapidations and movement on lease liability accruals and prepayments
Revolving Capital Facility ('RCF') and Acquisition and Capex Facility ('ACF')
On 18 December 2024, the Group completed on two new three-year debt financing facilities to give the Group additional funding to support the long-term growth of the business, including M&A. The details of the facilities are as follows:
|
|
Healthcare Facility |
Non-Healthcare Facility |
|
Date of agreement |
18 December 2024 |
|
|
Term of agreement |
3 years with 1 year extension option. |
|
|
Type of facility |
Multi-currency RCF and ACF. |
|
|
Lenders in syndicate |
8 lenders. |
|
|
Fixed repayments |
None, full drawn down balance repayable at date of termination of agreement. |
|
|
Available facility |
£130.0m RCF and £70.0m ACF. As at 31 December 2024, one member of the syndicate was outstanding to commit to the facility, resulting in the total available from the committed 7 lenders as at 31 December 2024 being £114.8m RCF and £61.8m ACF, totalling £176.6m. The final syndicate member joined the facility on 31 January 2025 therefore the full facility of £130.0m RCF and £70.0m ACF became available to draw down upon on this date. |
£135.0m RCF and £50.0m ACF. As at 31 December 2024, one member of the syndicate was outstanding to commit to the facility, with the total available from the committed 7 lenders as at 31 December 2024 being £119.2m RCF and £44.2m ACF, totalling £163.4m. The final syndicate member joined the facility on 31 January 2025 therefore the full facility of £135.0m RCF and £50.0m ACF became available to draw down upon on this date. |
|
Interest payable on drawn element |
Agreed margin based upon covenant test result (currently 2.25% for the Healthcare facility and 3.0% for the Non-Healthcare facility as at 31 December 2025) plus Sterling Overnight Index Average rate (SONIA), paid at the end of each calendar quarter. |
|
|
Interest payable on undrawn element |
0.35% of margin on drawn element. |
|
|
Total drawdown |
£37.0m (31 December 2024: £37.0m). |
£131.0m (31 December 2024: £7.5m).
|
11. Equity
Share capital
Authorised, allotted, called up and fully paid:
|
|
31 December 2025 |
31 December 2024 |
||||
|
|
No'000s |
Percentage of Total Shares |
£000s |
No'000s |
Percentage of Total Shares |
£000s |
|
Ordinary shares at 1 January (£0.0001) |
830,895 |
|
83 |
845,028 |
|
84 |
|
Cancellation of shares: share buyback programme |
(66,154) |
|
(7) |
(14,133) |
|
(1) |
|
Ordinary shares at 31 December (£0.0001) |
764,741 |
99.99 |
76 |
830,895 |
99.99 |
83 |
|
Deferred shares of £1.00 each |
100 |
0.01 |
100 |
100 |
0.01 |
100 |
|
Total authorised, allotted, called up and fully paid |
764,841 |
100 |
176 |
830,995 |
100 |
183 |
Share Purchases
During the year the Group's Employee Benefit Trust purchased an aggregate amount of 7,349,865 shares (representing 1.0% of the total share capital), each with a nominal value of 1/100th pence, at a total market value of £11.0m. The purchased shares will be held for the purpose of satisfying the exercise of share options under the Company's Employee Share Option Plan.
During the year, a total of 9,453,109 shares (representing 1.2% of the total share capital), each with a nominal value of 1/100th pence, which were held by the Group's Employee Benefit Trust were utilised as a result of the vesting of share options (at a total market value of £14.1m), as disclosed in note 12.
The maximum number of shares (each with a nominal value of 1/100th pence) held by the Employee Benefit Trust (at any time during the year ended 31 December 2025) was 53,055,983 (representing 6.9% of the total share capital). The purchase of shares by the trust is to limit the eventual dilution to existing shareholders. As at 31 December 2025, no dilution is currently forecast.
Share Purchases for Cancellation
On 31 July 2024, the Group announced a return of surplus capital of £10.0m to shareholders, implemented through a share buyback programme of the Group's ordinary shares, which was completed on 5 September 2024. On 23 September 2024, the Group announced an additional return of surplus capital of £20.0m to shareholders, which was implemented in the same way as the initial £10.0m. As at 31 December 2024, the total value of shares bought back and cancelled was £29.3m. The final £0.7m was purchased and cancelled in January 2025, thereby completing the second tranche of the buyback programmes.
On 6 February 2025, the Group announced a third share buyback programme totalling £50.0m. This programme was suspended on 2 May 2025, at this date total purchases and cancellations within the scheme were £39.0m.
On 10 September 2025, the Group completed a Tender Offer, which resulted in the purchase and cancellation of shares with a total value of £60.0m.
On 24 November 2025, the Group announced a fourth share buyback programme totalling £10.0m. As at 31 December 2025, total purchases and cancellations within this scheme were £2.0m.
The purpose of the share buyback programmes was to return surplus capital to shareholders and reduce the Group's share capital. As such, all ordinary shares repurchased by the Group under the share buyback programmes were cancelled.
Capital management
The Group's capital management objectives are:
· To ensure the Group's ability to continue as a going concern; and
· To fund future growth and provide an adequate return to shareholders and, when appropriate, distribute dividends.
The capital structure of the Group consists of net bank debt, which includes borrowings (note 10) and cash and cash equivalents, and equity.
The Company has two classes of shares. The ordinary shares carry no right to fixed income and each share carries the right to one vote at general meetings of the Company.
The deferred shares do not confer upon the holders the right to receive any dividend, distribution or other participation in the profits of the Company. The deferred shares do not entitle the holders to receive notice of or to attend and speak or vote at any general meeting of the Company. On distribution of assets on liquidation or otherwise, the surplus assets of the Company remaining after payments of its liabilities shall be applied first in repaying to holders of the deferred shares the nominal amounts and any premiums paid up or credited as paid up on such shares, and second the balance of such assets shall belong to and be distributed among the holders of the ordinary shares in proportion to the nominal amounts paid up on the ordinary shares held by them respectively.
There are no specific restrictions on the size of a holding nor on the transfer of shares, which are both governed by the general provisions of the Articles of Association and prevailing legislation. The Directors are not aware of any agreements between holders of the Company's shares that may result in restrictions on the transfer of securities or on voting rights.
No person has any special rights of control over the Company's share capital and all its issued shares are fully paid.
With regard to the appointment and replacement of Directors, the Company is governed by its Articles of Association, the Companies Act and related legislation. The Articles themselves may be amended by special resolution of the shareholders. The powers of Directors are described in the Board Terms of Reference, copies of which are available on request.
Dividends
The final dividend for 2024 was 1.0 pence per share and was paid in May 2025. The total dividend for the current year is 1.5 pence per share, with an interim dividend of 0.3 pence per share paid on 3 October 2025 to shareholders on the register at the close of business on 5 September 2025, and a final dividend of 1.2 pence per share will be paid on 1 May 2026 to shareholders on the register at the close of business on 27 March 2026. The ex-dividend date will be on 26 March 2026.
Treasury reserve
The treasury reserve represents the cost of shares held in the Group's Employee Benefit Trust for the purpose of satisfying the exercise of share options under the Company's Employee Share Option Plan.
The disclosures above are for both the Group and the Company.
Non-controlling interest
The put option in relation to the sale of 40% of the Group's Healthcare business was exercised on 4 June 2024. At this point the sale had been committed to, and legal completion followed shortly afterwards on 28 June 2024, with the Group receiving gross cash proceeds of £451.4m, of which £8.0m was recognised as a related party loan due to Monument Bidco Limited (an Inflexion investment company) at the point of completion which was capitalised during December 2024. As a result of this sale, in line with the provisions of IFRS 10: Consolidated Financial Statements, the Group recognised non-controlling interest (NCI) within equity which represents 40% of the Healthcare business sub-group's statement of financial position as at the date of recognition of NCI which has been determined as 4 June 2024, being the date the put option was exercised.
Since initial recognition of NCI on 4 June 2024, the following has been allocated to NCI:
· 40% of the Healthcare business sub-group's profit after tax;
· 40% of the Healthcare business sub-group's tax entries which have been recognised directly in reserves;
· 40% of the movement on the Healthcare sub-group's share-based payment reserve; and
· 40% of the movement on the Healthcare sub-group's foreign currency translation reserve.
Legal and professional transaction fees incurred by the Group in relation to this sale of NCI have been recognised directly in equity within the Group's Statement of Changes in Equity given they are linked to an equity transaction. For the year ended 31 December 2024 these fees totalled £30.6m.
During June 2025, a completion accounts adjustment totalling £19.6m was recognised in respect of the sale of GD UK Healthcare Limited (and its subsidiaries) from GlobalData Plc to Washington Bidco Limited, resulting in an adjustment to NCI and Group retained profits of £7.8m.
Summarised financial information in respect of the Group's non-controlling interest is set out below, as at 31 December 2025 the non-controlling interest represents 40% non-controlling interest in the Group's Healthcare business:
|
|
31 December 2025 £m |
31 December 2024 £m |
|
Statement of Financial Position Summary: |
|
|
|
Non-current assets |
78.3 |
76.1 |
|
Current assets |
73.8 |
62.7 |
|
Current liabilities |
(53.7) |
(59.9) |
|
Non-current liabilities |
(42.4) |
(36.1) |
|
Equity attributable to owners of the Company |
56.0 |
42.8 |
|
|
|
|
|
Non-controlling interest |
22.4 |
17.1 |
|
|
Year ended 31 December 2025 £m |
Year ended 31 December 2024 £m |
|
Income Statement Summary: |
|
|
|
Revenue |
123.3 |
63.3 |
|
Profit after tax |
42.6 |
17.3 |
|
Other comprehensive (loss)/ income |
(4.1) |
2.0 |
|
Total comprehensive income |
38.5 |
19.3 |
|
Total comprehensive income - non-controlling interest |
15.4 |
7.7 |
|
|
Year ended 31 December 2025 £m |
Year ended 31 December 2024 £m |
|
Statement of Cash Flows Summary: |
|
|
|
Cash flows from/ (used in) operating activities |
48.8 |
(10.5) |
|
Cash flows used in investing activities |
(22.4) |
(18.7) |
|
Cash flows (used in)/ from financing activities |
(1.9) |
27.3 |
|
Total cash flows |
24.5 |
(1.9) |
Other reserve
Other reserve consists of a reserve created upon the reverse acquisition of TMN Group Plc in 2009.
Foreign currency translation reserve
The foreign currency translation reserve contains the translation differences that arise upon translating the results of subsidiaries with a functional currency other than Sterling. Such exchange differences are recognised in the income statement in the period in which a foreign operation is disposed of.
12. Share-based payments
The Group operates a number of share option schemes, which are summarised below:
· Scheme 1 - this scheme was created in 2010, and is fully vested and closed to new participants. There are a number of outstanding options in issue where option holders have chosen to continue to defer exercise. All options must be exercised by option holders by August 2033.
· Scheme 2 - this scheme was created in 2019. The scheme covers a 4-year period, with vesting of options being linked to EBITDA targets within the financial years 2023 - 2026.
· Scheme 4 - this scheme was created in 2021. The scheme covers a 3-year period, with vesting of options being linked to EBITDA targets within the financial years 2024 - 2026. During financial year ended 31 December 2025, certain option holders were granted additional options within this scheme which have later year EBITDA vesting targets.
The EBITDA target relating to the financial year ending 31 December 2025 was not achieved, therefore these options will not vest. In addition, it is Managements' current expectation that the EBITDA target relating to the financial year ending 31 December 2026 is unlikely to be met. Exceptional STIP awards, to be cash settled via sale of shares held by the Group's Employee Benefit Trust, have been awarded to certain employees in lieu of the options which will not vest in relation to the year ending 31 December 2025. The total charge recognised in the consolidated income statement in relation to this bonus is £2.6m (2024: nil).
The total amounts recognised in adjusting items within the consolidated income statement are as follows:
|
|
Year ended 31 December 2025 £m |
Year ended 31 December 2024 £m |
|
(Credit)/ charge for scheme 2 |
(6.7) |
12.6 |
|
(Credit)/ charge for scheme 4 |
(11.3) |
11.5 |
|
Charge for exceptional STIP awards |
2.6 |
- |
|
Total (credit)/ charge |
(15.4) |
24.1 |
An accrual for the exceptional STIP awards has been recognised within the consolidated statement of financial position as at 31 December 2025.
Scheme 1 - fully vested and closed to new participants
The Group created a share option scheme during the year ended 31 December 2010 and granted the first options under the scheme on 1 January 2011 to certain senior employees. Each option granted converts to one ordinary share on exercise. A participant may exercise their options subject to employment conditions and Adjusted EBITDA targets being met. For these options to be exercised the Group's earnings before interest, taxation, depreciation and amortisation, as adjusted by the Remuneration Committee for significant or one-off occurrences, must exceed certain targets. The fair values of options granted were determined using the Black-Scholes model. The inputs used in the model were:
· share price at date of grant;
· exercise price;
· time to maturity;
· annual risk-free interest rate; and
· annualised volatility.
Each of the awards were subject to vesting criteria set by the Remuneration Committee. As disclosed in the 2021 Annual Report and Accounts, the final vesting target of £52m Adjusted EBITDA (excluding the impact of IFRS16) was met in the financial year ending 31 December 2021 and therefore the final tranche of Scheme 1 options vested during 2022. Scheme 1 is now therefore closed.
The total charge recognised for the scheme during the 12 months to 31 December 2025 was £nil (2024: £nil).
The Remuneration Committee approved the vesting of the final tranche of Scheme 1 on 11 August 2022. The awards of the scheme were settled with ordinary shares of the Company. During the years ended 31 December 2022 to 31 December 2024, the majority of participants chose to exercise their options, with 1.2m options being deferred as at 31 December 2024, as allowable under the scheme rules. During the year ended 31 December 2025, 0.6m of these options were exercised, resulting in 0.7m deferred options as at 31 December 2025.
Reconciliation of movement in the number of options is provided below. No new grants were awarded during 2025.
|
|
Option exercise price (pence) |
Weighted average remaining life (years) |
Number of options |
|
31 December 2024 |
1/100th |
0.0 |
1,207,250 |
|
Exercised |
1/100th |
N/A |
(550,713) |
|
31 December 2025 |
1/100th |
0.0 |
656,537 |
The options carried forward as at 31 December 2025 are both outstanding and exercisable. The maximum term of the remaining options outstanding is 8 years, ending in August 2033.
Scheme 2 - 2019 scheme
The following assumptions were used in the valuation:
|
Award tranche |
Award 1 |
Award 2 |
Award 3 |
Award 5 |
Award 7 |
Award 8 |
Award 9 |
|
Grant date |
31/10/19 |
07/05/20 |
25/05/20 |
22/09/20 |
23/03/21 |
31/01/23 |
22/01/24 |
|
Expected dividend yield |
3.06% |
3.06% |
3.06% |
3.06% |
3.06% |
3.57% |
Note 1 |
|
Volatility |
26.87% |
26.87% |
26.87% |
26.87% |
26.87% |
28.62% |
Note 1 |
|
Initial share price (pre capital reorganisation) |
£12.25 |
£12.25 |
£12.25 |
£12.25 |
£12.25 |
£12.55 |
Note 1 |
|
Initial share price (post capital reorganisation) |
£1.72 |
£1.72 |
£1.72 |
£1.72 |
£1.72 |
£1.76 |
Note 1 |
|
Group achieves £100m EBITDA by 1 March 2024 |
25% vest |
25% vest |
25% vest |
25% vest |
25% vest |
25% vest |
100% vest |
|
Fair value (pre capital reorganisation) |
£11.79 |
£11.79 |
£11.79 |
£11.79 |
£11.79 |
£12.07 |
£14.00 |
|
Fair value (post capital reorganisation) |
£1.65 |
£1.65 |
£1.65 |
£1.65 |
£1.65 |
£1.69 |
£1.96 |
|
Risk-free interest rate |
3.17% |
3.17% |
3.17% |
3.17% |
3.17% |
3.24% |
Note 1 |
|
Estimated forfeiture rate |
0% |
0% |
0% |
0% |
0% |
0% |
0% |
|
Remaining contractual life |
N/A |
N/A |
N/A |
N/A |
N/A |
N/A |
N/A |
|
Group achieves £110m EBITDA by 1 March 2025 |
25% vest |
25% vest |
25% vest |
25% vest |
25% vest |
25% vest |
N/A |
|
Fair value (pre capital reorganisation) |
£11.43 |
£11.43 |
£11.43 |
£11.43 |
£11.43 |
£11.65 |
N/A |
|
Fair value (post capital reorganisation) |
£1.60 |
£1.60 |
£1.60 |
£1.60 |
£1.60 |
£1.63 |
N/A |
|
Risk-free interest rate |
3.24% |
3.24% |
3.24% |
3.24% |
3.24% |
3.32% |
N/A |
|
Estimated forfeiture rate |
0% |
0% |
0% |
0% |
0% |
0% |
N/A |
|
Remaining contractual life |
N/A |
N/A |
N/A |
N/A |
N/A |
N/A |
N/A |
|
Group achieves £131m EBITDA by 1 March 2026 |
25% vest |
25% vest |
25% vest |
25% vest |
25% vest |
25% vest |
N/A |
|
Fair value (pre capital reorganisation) |
£11.09 |
£11.09 |
£11.09 |
£11.09 |
£11.09 |
£11.24 |
N/A |
|
Fair value (post capital reorganisation) |
£1.55 |
£1.55 |
£1.55 |
£1.55 |
£1.55 |
£1.57 |
N/A |
|
Risk-free interest rate |
3.20% |
3.20% |
3.20% |
3.20% |
3.20% |
3.12% |
N/A |
|
Estimated forfeiture rate |
5% |
5% |
5% |
5% |
5% |
4% |
N/A |
|
Remaining contractual life |
0.17 |
0.17 |
0.17 |
0.17 |
0.17 |
0.17 |
N/A |
|
Group achieves £153m EBITDA by 1 March 2027 |
25% vest |
25% vest |
25% vest |
25% vest |
25% vest |
25% vest |
N/A |
|
Fair value (pre capital reorganisation) |
£10.76 |
£10.76 |
£10.76 |
£10.76 |
£10.76 |
£10.85 |
N/A |
|
Fair value (post capital reorganisation) |
£1.51 |
£1.51 |
£1.51 |
£1.51 |
£1.51 |
£1.52 |
N/A |
|
Risk-free interest rate |
3.24% |
3.24% |
3.24% |
3.24% |
3.24% |
3.21% |
N/A |
|
Estimated forfeiture rate |
9% |
9% |
9% |
9% |
9% |
4% |
N/A |
|
Remaining contractual life |
1.17 |
1.17 |
1.17 |
1.17 |
1.17 |
1.17 |
N/A |
Note 1: Award 9 was granted and exercised almost immediately therefore the fair value at grant date was calculated as being equal to the share price at the date of award.
Awards 4 and 6 have been fully forfeited. Award 9 was granted with 100% of the options vesting in 2024. For all options noted within the table above, the exercise price per option is £0.0001 (equivalent to 1/100th pence) and the expected dividend yield has been assumed to be paid throughout the performance period. The volatility used within the calculations was determined by calculating the Group's observed historical volatility over a period equal to the time until the end of the assumed maturity date.
The estimated forfeiture rate assumption is based upon Management's expectation of the number of options that will lapse over the vesting period and are reviewed annually. Management believes the current assumptions to be reasonable.
The total amount recognised in the consolidated income statement for the scheme during the 12 months to 31 December 2025 was a credit of £6.7m (2024: charge of £12.6m). The awards of the scheme will be settled with ordinary shares of the Company.
Reconciliation of movement in the number of options in Scheme 2 is provided below.
|
|
Option exercise price (pence) |
Weighted average remaining life (years) |
Number of options |
|
31 December 2024 |
1/100th |
1.2 |
19,000,711 |
|
Exercised |
1/100th |
N/A |
(6,500,702) |
|
Forfeited |
1/100th |
N/A |
(1,999,996) |
|
31 December 2025 |
1/100th |
0.7 |
10,500,013 |
The options carried forward as at 31 December 2025 are both outstanding and exercisable.
Scheme 4 - 2021 scheme
The following assumptions were used in the valuation:
|
Award tranche |
Award 1 |
Award 2 |
Award 3 |
Award 4 |
Award 5 |
|
Grant date |
07/03/22 |
31/01/23 |
23/05/23 |
22/01/2024 |
21/05/2024 |
|
Expected dividend yield |
3.06% |
3.57% |
3.34% |
1.60% |
1.04% |
|
Volatility |
26.87% |
28.62% |
29.40% |
28.25% |
29.14% |
|
Initial share price (pre capital reorganisation) |
£12.25 |
£12.55 |
£13.10 |
£13.93 |
£16.14 |
|
Initial share price (post capital reorganisation) |
£1.72 |
£1.76 |
£1.83 |
£1.95 |
£2.26 |
|
Group achieves £110m EBITDA by 1 March 2025 |
10% vest |
10% vest |
10% vest |
10% vest |
10% vest |
|
Fair value (pre capital reorganisation) |
£11.43 |
£11.65 |
£12.35 |
£13.68 |
£16.01 |
|
Fair value (post capital reorganisation) |
£1.60 |
£1.63 |
£1.73 |
£1.92 |
£2.24 |
|
Risk-free interest rate |
3.24% |
3.32% |
4.10% |
4.72% |
4.74% |
|
Estimated forfeiture rate |
0% |
0% |
0% |
0% |
0% |
|
Remaining contractual life |
N/A |
N/A |
N/A |
N/A |
N/A |
|
Group achieves £131m EBITDA by 1 March 2026 |
20% vest |
20% vest |
20% vest |
20% vest |
20% vest |
|
Fair value (pre capital reorganisation) |
£11.09 |
£11.24 |
£11.94 |
£11.94 |
£11.94 |
|
Fair value (post capital reorganisation) |
£1.55 |
£1.57 |
£1.67 |
£1.67 |
£1.67 |
|
Risk-free interest rate |
3.20% |
3.12% |
4.02% |
4.17% |
4.27% |
|
Estimated forfeiture rate |
9% |
8% |
8% |
8% |
8% |
|
Remaining contractual life |
0.17 |
0.17 |
0.17 |
0.17 |
0.17 |
|
Group achieves £153m EBITDA by 1 March 2027 |
70% vest |
70% vest |
70% vest |
70% vest |
70% vest |
|
Fair value (pre capital reorganisation) |
£10.76 |
£10.85 |
£11.55 |
£11.55 |
£11.55 |
|
Fair value (post capital reorganisation) |
£1.51 |
£1.52 |
£1.62 |
£1.62 |
£1.62 |
|
Risk-free interest rate |
3.24% |
3.21% |
3.97% |
3.87% |
4.07% |
|
Estimated forfeiture rate |
16% |
8% |
8% |
8% |
8% |
|
Remaining contractual life |
1.17 |
1.17 |
1.17 |
1.17 |
1.17 |
|
Award tranche |
Award 6 |
Award 7 |
Award 8 |
Award 9 |
|
Grant date |
23/01/25 |
11/02/25 |
20/05/25 |
20/05/25 |
|
Expected dividend yield |
0.81% |
0.74% |
0.59% |
0.20% |
|
Volatility |
30.19% |
30.07% |
36.07% |
45.98% |
|
Initial share price |
£1.82 |
£2.01 |
£1.92 |
£1.92 |
|
Group achieves a currently undetermined EBITDA target by 1 March 2026 |
N/A |
N/A |
N/A |
100% |
|
Fair value |
N/A |
N/A |
N/A |
£1.92 |
|
Risk-free interest rate |
N/A |
N/A |
N/A |
3.92% |
|
Estimated forfeiture rate |
N/A |
N/A |
N/A |
0% |
|
Remaining contractual life |
N/A |
N/A |
N/A |
0.17 |
|
Group achieves a currently undetermined EBITDA target by 1 March 2028 |
10% |
10% |
100% |
N/A |
|
Fair value |
£1.77 |
£1.97 |
£1.89 |
N/A |
|
Risk-free interest rate |
4.07% |
3.89% |
3.96% |
N/A |
|
Estimated forfeiture rate |
0% |
0% |
0% |
N/A |
|
Remaining contractual life |
2.17 |
2.17 |
2.17 |
N/A |
|
Group achieves a currently undetermined EBITDA target by 1 March 2029 |
20% |
20% |
N/A |
N/A |
|
Fair value |
£1.76 |
£1.95 |
N/A |
N/A |
|
Risk-free interest rate |
4.12% |
3.96% |
N/A |
N/A |
|
Estimated forfeiture rate |
0% |
0% |
N/A |
N/A |
|
Remaining contractual life |
3.17 |
3.17 |
N/A |
N/A |
|
Group achieves a currently undetermined EBITDA target by 1 March 2030 |
70% |
70% |
N/A |
N/A |
|
Fair value |
£1.74 |
£1.94 |
N/A |
N/A |
|
Risk-free interest rate |
4.24% |
4.12% |
N/A |
N/A |
|
Estimated forfeiture rate |
0% |
0% |
N/A |
N/A |
|
Remaining contractual life |
4.17 |
4.17 |
N/A |
N/A |
For all options noted within the Scheme 4 tables above, the exercise price per option is £0.0001 (equivalent to 1/100th pence) and the expected dividend yield has been assumed to be paid throughout the performance period. The volatility used within the calculations was determined by calculating the Group's observed historical volatility over a period equal to the time until the end of the assumed maturity date.
The estimated forfeiture rate assumption is based upon management's expectation of the number of options that will lapse over the vesting period and are reviewed annually. Management believes the current assumptions to be reasonable.
The total amount recognised in the consolidated income statement for the scheme during the 12 months to 31 December 2025 was a credit of £11.3m (2024: charge of £11.5m). The awards of the scheme will be settled with ordinary shares of the Company.
Reconciliation of movement in the number of options in Scheme 4 is provided below.
|
|
Option exercise price (pence) |
Weighted average remaining life (years) |
Number of options |
|
31 December 2024 |
1/100th |
1.8 |
25,204,362 |
|
Granted |
1/100th |
N/A |
2,685,000 |
|
Exercised |
1/100th |
N/A |
(2,401,694) |
|
Forfeited |
1/100th |
N/A |
(4,275,666) |
|
31 December 2025 |
1/100th |
1.1 |
21,212,002 |
The options carried forward as at 31 December 2025 are both outstanding and exercisable.
Vesting of options
As a result of options from Schemes 1, 2 and 4 vesting during the year, £17.9m was transferred from the Group's treasury reserve to retained earnings of which £14.8m is distributable. The weighted average price of the exercised options across all schemes at the date of exercise was £1.49 per share.
13. Acquisitions
Ai Palette
On 7 March 2025, the Group acquired 99.5% of the share capital of Ai Palette Pte. Ltd and its subsidiary for cash consideration of £9.6m, of which £1.8m was yet to be cash settled as at 31 December 2025. Ai Palette is an AI Powered consumer insights platform offering an Innovation Intelligence solution to the Consumer-packaged goods sector, which is an excellent strategic fit for the Group.
The amounts recognised for each class of assets and liabilities at the acquisition date were as follows:
|
|
|
Carrying value |
Fair value adjustments |
Fair value |
|
|
|
£m |
£m |
£m |
|
Intangible assets consisting of: |
|
|
|
|
|
Customer relationships |
|
- |
0.4 |
0.4 |
|
Database |
|
- |
1.3 |
1.3 |
|
Trade names |
|
- |
0.4 |
0.4 |
|
Net assets acquired consisting of: |
|
|
|
|
|
Intangible assets |
|
1.8 |
(0.2) |
1.6 |
|
Cash and cash equivalents |
|
1.0 |
- |
1.0 |
|
Trade and other receivables |
|
0.5 |
- |
0.5 |
|
Trade and other payables |
|
(1.2) |
0.1 |
(1.1) |
|
Deferred tax |
|
- |
(0.4) |
(0.4) |
|
Fair value of net assets acquired |
|
2.1 |
1.6 |
3.7 |
The goodwill recognised in relation to the acquisition is as follows:
|
Fair value |
|
|
£m |
|
|
Consideration paid in cash |
7.8 |
|
ESCROW payments yet to be cash settled as at 31 December 2025 |
1.8 |
|
Less net assets acquired |
(3.7) |
|
Goodwill |
5.9 |
In line with the provision of IFRS 3, fair value adjustments may be made within the 12-month period from the date of acquisition which would result in an adjustment to the goodwill balance reported above. The goodwill that arose on the combination can be attributed to the assembled workforce, know-how and research methodology. The fair values of the identified intangible assets were calculated in line with the policies detailed within the Group's Annual Report and Accounts for the year ended 31 December 2025. The amount of goodwill which is expected to be deductible for tax purposes is £nil.
The Group incurred legal and professional expenses of £0.2m in relation to the acquisition, which were recognised in adjusting items in the consolidated income statement. In the period from the date of acquisition to 31 December 2025, the trade of Ai Palette generated revenues of £1.5m and Adjusted EBITDA loss of £0.2m.
Stylus
The Group completed the acquisition of the entire share capital of Stylus Media Group Limited 'Stylus', and its subsidiaries, on 8 July 2025 for consideration of £19.4m, of which £0.5m will be settled 12 months post-completion. In addition, the Group cash settled pre-existing debts of the acquiree totalling £6.7m on the date of acquisition. Post-acquisition, the Group have cash settled £0.4m of transaction bonuses on behalf of the acquiree.
Stylus is a consumer trends intelligence business. The addition of Stylus represents a strengthening of our consumer innovation intelligence solution, which will combine the strength of the Group's proprietary data and AI platform with Stylus' leading insights on consumer trends and the technology capability of our recent Ai Palette acquisition.
The amounts recognised for each class of assets and liabilities at the acquisition date were as follows:
|
|
|
Carrying value |
Fair value adjustments |
Fair value |
|
|
|
£m |
£m |
£m |
|
Intangible assets consisting of: |
|
|
|
|
|
Customer relationships |
|
- |
5.4 |
5.4 |
|
Database |
|
- |
5.9 |
5.9 |
|
Trade names |
|
- |
1.2 |
1.2 |
|
Net assets acquired consisting of: |
|
|
|
|
|
Intangible assets |
|
0.4 |
- |
0.4 |
|
Cash and cash equivalents |
|
0.2 |
- |
0.2 |
|
Trade and other receivables |
|
2.2 |
(0.8) |
1.4 |
|
Trade and other payables |
|
(13.4) |
1.5 |
(11.9) |
|
Deferred tax |
|
- |
(3.5) |
(3.5) |
|
Fair value of net (liabilities)/ assets acquired |
|
(10.6) |
9.7 |
(0.9) |
The goodwill recognised in relation to the acquisition is as follows:
|
Fair value |
||||
|
£m |
||||
|
Consideration paid in cash |
|
|
|
18.9 |
|
Consideration to be paid 1-year post-completion |
|
|
|
0.5 |
|
Plus net liabilities acquired |
|
|
|
0.9 |
|
Goodwill |
|
|
|
20.3 |
At the time of acquisition, the Group settled £6.7m of the acquiree's pre-existing borrowings and £0.4m of accrued transaction costs, both of which have become inter-company payables due back to the Group within the statement of financial position of the acquiree. These payments have not been treated as part of the acquisition consideration.
In line with the provision of IFRS 3, fair value adjustments may be made within the 12-month period from the date of acquisition which would result in an adjustment to the goodwill balance reported above. The goodwill that arose on the combination can be attributed to the assembled workforce, know-how and research methodology. The fair values of the identified intangible assets were calculated in line with the policies detailed within the Group's Annual Report and Accounts for the year ended 31 December 2025. The amount of goodwill which is expected to be deductible for tax purposes is £nil.
The Group incurred legal and professional expenses of £0.6m in relation to the acquisition, which were recognised in adjusting items in the consolidated income statement. In the period from the date of acquisition to 31 December 2025, the trade of Stylus generated revenues of £4.5m and Adjusted EBITDA of £0.6m.
Impact of Acquisitions
If both of the Group's acquisitions made during the year ended 31 December 2025 had occurred on 1 January 2025, Group revenue would have been £327.1m and Group Adjusted EBITDA would have been at £110.4m.
Cash Cost of Acquisitions
The cash cost of acquisitions in 2025 comprises:
|
|
|
31 December 2025 |
|
|
|
£m |
|
Presented within Operating Activities |
|
|
|
Acquisition of MBI: |
|
|
|
Contingent consideration |
|
0.3 |
|
Acquisition of Ai Palette: |
|
|
|
Contingent consideration |
|
0.4 |
|
Acquisition of Jobdig, Inc: |
|
|
|
Contingent consideration |
|
1.8 |
|
|
|
2.5 |
|
|
|
31 December 2025 |
|
|
|
£m |
|
Presented within Investing Activities |
|
|
|
Acquisition of Ai Palette: |
|
|
|
Cash consideration |
|
7.8 |
|
Cash acquired |
|
(1.0) |
|
Acquisition of Stylus: |
|
|
|
Cash consideration |
|
18.9 |
|
Cash acquired |
|
(0.2) |
|
Settlement of transaction costs (not included within consideration) |
|
0.4 |
|
Acquisition of Jobdig, Inc: |
|
|
|
Working capital adjustment |
|
0.1 |
|
Acquisition of Celent: |
|
|
|
Working capital adjustment |
|
(0.3) |
|
Transaction bonuses settled |
|
0.1 |
|
Acquisition of Deallus: |
|
|
|
Working capital adjustment |
|
1.2 |
|
|
|
27.0 |
|
|
|
31 December 2025 |
|
|
|
£m |
|
Presented within Financing Activities |
|
|
|
Acquisition of Stylus: |
|
|
|
Settlement of borrowings (not included within consideration) |
|
6.7 |
|
|
|
6.7 |
The cash cost of acquisitions in 2024 comprised:
|
|
|
31 December 2024 |
|
|
|
£m |
|
Presented within Operating Activities |
|
|
|
Acquisition of TS Lombard: |
|
|
|
Contingent consideration |
|
0.5 |
|
|
|
0.5 |
|
|
|
31 December 2024 |
|
|
|
£m |
|
Presented within Investing Activities |
|
|
|
Acquisition of BTMI: |
|
|
|
Cash consideration |
|
6.3 |
|
Working capital adjustment |
|
(0.1) |
|
Acquisition of Jobdig, Inc: |
|
|
|
Cash consideration |
|
18.4 |
|
Cash acquired |
|
(1.6) |
|
Settlement of transaction costs (not included within consideration) |
|
3.8 |
|
Acquisition of Celent: |
|
|
|
Cash consideration |
|
19.2 |
|
Acquisition of Deallus: |
|
|
|
Cash consideration |
|
20.8 |
|
Cash acquired |
|
(7.3) |
|
Settlement of transaction costs (not included within consideration) |
|
5.2 |
|
SIA - Strategy in Action Limited |
|
|
|
Cash consideration |
|
4.0 |
|
|
|
68.7 |
|
|
|
31 December 2024 |
|
|
|
£m |
|
Presented within Financing Activities |
|
|
|
Acquisition of BTMI: Settlement of borrowings (not included within consideration) |
|
3.7 |
|
Acquisition of Deallus: Settlement of borrowings (not included within consideration) |
|
7.0 |
|
|
|
10.7 |
14. Related party transactions
The Board has put in place an additional control framework to ensure related party transactions are well controlled and managed. Related party transactions are overseen by a subcommittee of the Board. The Related Party Transactions Committee, consisting of 4 Non-Executive Directors and chaired by Murray Legg meets to:
o Oversee all related party transactions.
o Ensure transactions are in the best interests of GlobalData and its wider stakeholders; and
o Ensure all transactions are recorded and disclosed on an arm's length basis.
As part of the proposed move to the Main Market during 2026, the Board has determined that the functions of the Related Party Transactions Committee should be transferred to the Audit and Risk Committee, and as such this Committee will cease to exist.
The Group has taken advantage of the exemptions contained within IAS24: Related Party Disclosures from the requirement to disclose transactions between wholly owned Group companies as these have been eliminated on consolidation.
Related Party Transactions: Ultimate Controlling Party
Mike Danson, GlobalData's Chief Executive, owned 59.4% of the Company's ordinary shares as at 31 December 2025 and 60.0% as at 1 March 2026 and is therefore the Company's ultimate controlling party. Mike Danson owns a number of other businesses, a small number of which interact with GlobalData Plc.
During the year, the following related party transactions were entered into by the Group:
Accommodation
During the year ended 31 December 2025, related party charges to the Group in respect of accommodation totalled £nil (2024: £0.1m).
Corporate support services
In 2025 net corporate support charges of £0.1m were charged from NS Media Group Limited ("NSMGL") and net corporate support charges of £0.02m were charged to Estel Property Investments No.3 Limited ("Estel"), both companies are related parties by virtue of common ownership (2024: £0.1m charge from NSMGL and £0.1m charge to Estel). In both 2025 and 2024 the corporate support charges consisted of a share of the India management team cost, shared software costs and recharged salary costs.
Sales distribution
NSMGL acted as a sales distributor for some GlobalData products. On these transactions they charged agent fees of £0.03m (2024: £0.02m).
Balances Outstanding
As at 31 December 2025, the total balance receivable from NSMGL was £0.007m (2024: £0.002m). There is no specific credit loss provision in place in relation to this receivable and the total expense recognised during the period in respect of bad or doubtful debts was £nil.
Related Party Transactions: Directors and Key Management Personnel
Investment in SIA - Strategy In Action Limited
On 4 June 2024, the Group made an investment of 16.95% in the share capital of SIA - Strategy in Action Limited ("SiA") for cash consideration of £4.0m. The Group has representation on the Board and Julien Decot is a common Non-Executive Director across both the Group and SiA. Management assessed that the Group exercises significant influence over SiA, therefore the investment is accounted for using the equity method. The carrying amount of the investment has been adjusted for the Group's share of the post-acquisition profits or losses of SiA (totalling £0.2m profit for the year ended 31 December 2025 (2024: profit of £0.04m), which has been recognised in the Group's consolidated income statement) plus the Group's share of the post-acquisition change in other comprehensive income of SiA (totalling £nil for the year ended 31 December 2025 (2024: £nil), which has been recognised within other comprehensive income of the Group). As a result of the shareholding, the Group is exposed to financial risks including potential funding requirements and exposure to potential future losses; however given the size of the shareholding these risks are not deemed significant to the Group.
Directors and Key Management Personnel Remuneration
The remuneration of Directors is disclosed within the Directors' Remuneration Report within the Group's Annual Report and Accounts for the year ended 31 December 2025.
Balances Outstanding
There were no balances outstanding in relation to Directors and Key Management Personnel as at 31 December 2025 (2024: £nil).
Related Party Transactions: Inflexion Private Equity Partners LLP
Sale of 40% of Healthcare Business
Completion of the sale of 40% of the Group's Healthcare business resulted in the Group receiving gross cash proceeds of £451.4m, of which £8.0m was recognised as a related party loan due to Monument Bidco Limited (an Inflexion investment company) at the point of completion which was then capitalised during December 2024. As such, as at 31 December 2024, there were no outstanding balances due to Monument Bidco Limited. As at 31 December 2025, the total balance outstanding to Monument Bidco Limited was £nil.
In relation to completion of the transaction, the Group settled fees to the Inflexion group of companies totalling £11.4m, these have been included within the transaction costs recognised directly in equity within the Group's Consolidated Statement of Changes in Equity for the year ended 31 December 2024.
For the year ended 31 December 2025, management fees charged from the Inflexion group of companies to the Group totalled £0.4m (2024: £0.2m).
Balances Outstanding
There were no balances outstanding in relation to the Inflexion group of companies as at 31 December 2025 (2024: £nil).
Related Party Transactions: Non-wholly owned subsidiaries
Washington Topco Limited and its subsidiaries are 60% owned, as such, the exemption to disclose transactions between group companies in accordance with IAS 24 does not apply. Transactions entered into with a member of the group of companies owned by Washington Topco Limited, and outstanding balances between the parties as at the year end are presented below.
|
£m
|
Year ended 31 December 2025 |
Year ended 31 December 2024 |
|
Recharges to Washington Topco Limited and its subsidiaries |
7.3 |
6.1 |
|
Recharges from Washington Topco Limited and its subsidiaries |
3.0 |
7.2 |
|
£m
|
31 December 2025 |
31 December 2024 |
|
Balance owed from/ (to) Washington Topco Limited and its subsidiaries |
0.4 |
(9.1) |
Related Party Transactions: Other Related Parties
Balances Outstanding
As at 31 December 2024, there was an outstanding loan note due to the pre-existing management of the Deallus group of companies amounting to £1.0m, generated as a result of the Deallus acquisition which completed on 31 December 2024. This was initially repayable on 30 June 2025 and accrued interest at a semi-annual compounded rate of 12%. The repayment date for the loan note has been extended to 28 February 2026, and interest has continued to accrue on the same basis. The total balance outstanding as at 31 December 2025 in relation to this loan note, including accrued interest, was £1.1m.
RNS may use your IP address to confirm compliance with the terms and conditions, to analyse how you engage with the information contained in this communication, and to share such analysis on an anonymised basis with others as part of our commercial services. For further information about how RNS and the London Stock Exchange use the personal data you provide us, please see our Privacy Policy.

Latest directors dealings
- 6 hours ago Molten Ventures
- 6 hours ago National Grid
- 7 hours ago Origin Enterprises (CDI)
- 7 hours ago Computacenter
- 7 hours ago Norcros