
Half-year Report
Summary by AI BETAClose X

7 September 2026

Gamma Communications plc
Unaudited results for the six months ended 30 June 2026
Robust first half performance, with strong German growth and high cash conversion.
Gamma Communications plc ("Gamma" or "the Group" or "the Company"), a leading European provider of business-critical communications technology, today announces its unaudited results for the six months ended 30 June 2026.
|
|
Six months ended 30 June |
|
|
|
|
2026 |
2025 |
Change (%) |
|
Revenue |
£330.0m |
£316.6m |
4% |
|
Gross Profit |
£178.1m |
£172.0m |
4% |
|
Gross Margin |
54% |
54% |
|
|
Adjusted EBITDA1 |
£72.5m |
£70.9m |
2% |
|
Profit before tax ("PBT") |
£50.1m |
£43.5m |
15% |
|
Adjusted PBT1 |
£59.2m |
£61.0m |
(3%) |
|
Earnings Per Share ("EPS") (fully diluted) |
40.2p |
34.1p |
18% |
|
Adjusted EPS (fully diluted)1 |
47.7p |
47.9p |
(0%) |
|
Adjusted cash generated by operations1 |
£70.3m |
£63.7m |
10% |
|
Adjusted cash conversion1 |
97% |
90% |
|
|
Net debt1 |
(£3.8m) |
(£21.6m) |
|
Key highlights
|
Growth across key financial performance metrics |
|||
|
· |
Group results were underpinned by strong growth in our German businesses and improved momentum in Service Provider, and were delivered despite the continued challenging UK SME macroeconomic backdrop. |
||
|
· |
Recurring revenue2 remains high at 90% (H1 2025: 90%). |
||
|
· |
Return on capital employed ("ROCE")1 was healthy at 30% (2025: 28%). |
||
|
· |
Gross profit up 4% (flat on an organic basis); Adjusted EBITDA increased by 2%. |
||
|
|
• |
Germany SME increased gross profit by 30% to £44.8m (H1 2025: £34.4m) with 11% organic growth1. Strong demand for cloud communications solutions continued to accelerate in both our channel and digital direct businesses. |
|
|
|
• |
UK SME gross profit declined by 7% to £69.3m (H1 2025: £74.3m3) reflecting ongoing market headwinds and continuing pricing pressure, as well as some non-recurring credits in H1 2025. Absolute gross profit was consistent with H2 2025. The year-on-year decline was despite strong volume growth in cloud and connectivity propositions, with sustained demand for "Webex for Gamma", "PhoneLine+" and full fibre connectivity ("FTTP"). Gross profit from PSTN related products was consistent with H1 2025, due to price rises and lower than expected churn. |
|
|
|
• |
Service Provider increased gross profit by 6% to £23.1m (H1 2025: £21.7m3), driven by increased traffic volume in the UK. Our partnerships with major global technology vendors continued to expand with new contracts to carry European and UK voice traffic. The APAC expansion continued to progress well, with local customers now established in Australia and Singapore, and the licence obtained in the Philippines. |
|
|
|
• |
Enterprise gross profit declined by 2% to £31.5m (H1 2025: £32.3m3) due to the expected annualised impact of 2025 ethernet pricing pressure. These pressures were partly offset by equipment sales in the period resulting in 1% gross profit growth since H2 2025. There were significant wins and notable contract extensions across key markets, including pan-European customers, and continued momentum in the UK. |
|
|
· |
Adjusted PBT was down 3% driven by higher depreciation and amortisation (excluding business combinations) and lower interest income. Adjusted EPS (fully diluted) was flat (0%) with decline in Adjusted PBT offset by a lower share count following our buyback activity. |
||
|
Strong balance sheet |
|||
|
· |
Underlying cashflow remains healthy with adjusted cash generated by operations increasing 10% to £70.3m (H1 2025: £63.7m) and adjusted cash conversion of 97% (H1 2025: 90%). Net debt as at 30 June 2026 was £3.8m (31 December 2025: £9.3m). The Group has deleveraged rapidly since its £152.2m acquisition of Starface in February 2025 while also completing share buybacks of £45.1m in H1 2025 and £21.1m as at the end of June 2026. A payment of £13.4m for the 2025 final dividend was also made in the period. |
||
Progress delivering strategic priorities |
|||
|
· |
Cisco's "Webex for Gamma" will be available shortly across all of Gamma's markets - the UK, Germany, Spain and the Netherlands - supported by our Cisco top-tier Preferred Partner status. The number of "Webex for Gamma" seats has now grown to c.90k (31 December 2025: 56k), representing one of the largest installed bases of Webex Calling Wholesale seats globally. |
||
|
· |
Continued focus on operational efficiency and disciplined cost management. |
||
|
· |
Adoption of AI solutions accelerated across our portfolio, with AI-enabled capabilities improving customer service, security and data use for customers and partners. This included integrating leading hyperscaler capabilities and targeted standalone products. |
||
Recommended cash offer
On 1 September 2026, a recommended cash offer from Epiris (Bradbury Bidco Ltd) for the entire issued and to be issued ordinary share capital of Gamma was announced.
The Gamma Board, having carefully considered Epiris' offer with its advisers, took into account Gamma's market valuation before the Offer Period, its strengths and prospects as an independent listed company, the risks associated with delivering its standalone strategy, the value and certainty of the all-cash offer, the outcome of discussions following inbound interest, and Epiris' intentions for Gamma and its stakeholders. These include increased investment and a renewed strategic focus on innovation and AI to accelerate growth, strengthen Gamma's competitive position and unlock its long-term potential. The Board concluded that the Acquisition provides Gamma Shareholders with an opportunity to realise their investment in cash at a value which may not otherwise be achievable in the foreseeable future and with certainty, and represents a superior outcome to pursuing Gamma's standalone strategy.
Capital Returns
As a result of the announcement of the proposed acquisition of the Group, the Group does not intend to declare or pay any further dividends prior to the effective date. The share buyback programme announced on 13 January 2026 is currently suspended, as the current share price is not within certain pre-set parameters agreed with Investec Bank plc, which was appointed to manage the share buyback programme.
Notes:
1. See section "Alternative Performance Measures"
2. Recurring revenue being revenue which is recognised "over time" as per note 3 to the interim financial statements.
3. Cost recharges between the Group's operating segments have been revised during the period with comparatives restated, see note 3.
Enquiries:
|
Gamma Communications plc Andrew Belshaw, Chief Executive Officer Damien Maltarp, Chief Financial Officer Rachael Matzopoulos, Company Secretary
|
Tel: +44 (0)333 006 5972
|
|
Investec (Joint Broker) Patrick Robb / Virginia Bull
|
Tel: +44 (0)207 597 5970 |
|
Peel Hunt (Joint Broker) Neil Patel / Alice Lane / Benjamin Cryer
|
Tel: +44 (0)207 418 8900
|
|
Teneo (Financial PR Adviser) James Macey White / Daniel Rowland |
Tel: +44 (0)207 260 2700
|
About Gamma
Gamma is a leading European provider of business-critical communications technology. Our extensive channel partner network connects major technology vendors with hundreds of thousands of SMEs, and we deal directly with large corporates and the public sector. Gamma combines its proprietary solutions with leading third-party cloud platforms, its own telecoms network and a high quality of service, to help customers communicate and collaborate more effectively.
Our broad and expanding portfolio - including cloud communications software (telephony, messaging, video, AI-driven customer experience), calling and network connectivity (including security) - enables customers of any size to deploy end-to-end communications and IT solutions via a single provider.
In mainland Europe, Gamma has its largest presence in Germany, delivering services to SMEs through both partners and its own self-service digital platform, and is recognised as one of the country's leading cloud communications providers.
Gamma Business serves UK SMEs via an extensive network of over 1,500 channel partners and its Service Provider business provides international calling capabilities for global communications platform and service providers.
For larger corporate and public sector organisations, Gamma Enterprise engages directly to design and support complex, integrated communications solutions.
With over 2,000 employees, Gamma is a FTSE 250 company listed on the London Stock Exchange (ticker: GAMA). More information can be found at: gammagroup.co
Cautionary Statement
This Interim Management Report (IMR) has been prepared solely to provide additional information to shareholders to assess the Group's strategies and the potential for those strategies to succeed. The IMR should not be relied on by any other party or for any other purpose.
Certain statements in this results announcement for the six months ended 30 June 2026 are forward-looking. Although Gamma believes that the expectations reflected in these forward-looking statements are reasonable, we can give no assurance that these expectations will prove to have been correct. Because these statements contain risks and uncertainties, actual results may differ materially from those expressed or implied by these forward-looking statements. We undertake no obligation to update any forward-looking statements whether as a result of new information, future events or otherwise.
Management and Financial Overview
Gamma delivered a robust first half performance. The Group again demonstrated the resilience of our business model, and the benefits of our increasing geographic and product diversification. This was achieved despite ongoing uncertainty in the UK economic environment and reflects the Group's disciplined approach to operational efficiency and execution.
Germany delivered strong growth as demand for cloud communications solutions accelerated across both our channel and digital direct businesses. Service Provider continued to expand internationally, including across APAC, and through partnerships with leading global technology providers. Enterprise saw significant contract wins across continental Europe and the UK, as well as notable contract extensions. UK SME continued to experience challenging market conditions and pricing pressure, although demand for cloud and connectivity solutions remained strong and PSTN churn was lower than expected. While UK SME gross profit declined on a year-on-year basis, it was consistent with H2 2025.
The Group's balance sheet remains strong, with minimal leverage, and is underpinned by high levels of recurring revenue and 97% cash conversion. During the period, we returned cash to shareholders while maintaining investment in new product development.
Revenue increased by 4% to £330.0m (H1 2025: £316.6m) and gross profit by 4% to £178.1m (H1 2025: £172.0m). This growth was driven by our German business, where revenue grew by 21% and gross profit grew 30%, reflecting the continued acceleration in cloud communication solutions and the benefit from the full period contribution of Starface (acquired mid-February 2025). Our UK performance was resilient despite the challenging UK business environment. UK SME revenue was flat but gross profit declined by 7% reflecting ongoing market headwinds and pricing pressure, as well as some non-recurring credits in H1 2025. This was despite strong volume growth in cloud and connectivity propositions. Enterprise revenue and gross profit declined 2% due to the expected annualised impact of 2025 ethernet pricing pressures. Service Provider grew revenue by 7% and gross profit by 6% driven by increased volume traffic in the UK and European expansion. On an organic basis, Group revenue grew 2%, with gross profit flat.
Adjusted EBITDA grew by 2% from £70.9m to £72.5m. It grew at a lower rate than gross profit due to a limited amount of additional central costs in the period. It declined 1% on an organic basis.
Adjusted PBT decreased by 3% from £61.0m to £59.2m. This reflects a £1.7m increase in depreciation and amortisation (excluding business combinations) and a £1.7m reduction in interest income due to lower levels of cash holdings following the Starface acquisition in 2025.
Profit before tax increased by 15% from £43.5m to £50.1m primarily because no exceptional items (H1 2025: £7.3m) were incurred in the period.
Adjusted EPS (fully diluted) was broadly unchanged at 47.7p (H1 2025: 47.9p). This reflects the Adjusted PBT decline as above, offset by a 3% benefit from the reduced share count following the share buybacks in 2026 and 2025. EPS (fully diluted) increased by 18% from 34.1p to 40.2p, reflecting the increase in profit before tax of 15% supplemented by the 3% benefit from share buybacks.
Our portfolio and approach to market
Gamma provides essential business communications technology across Western Europe, helping organisations of all sizes to connect and collaborate effectively. Our portfolio supports businesses as they modernise their communications infrastructure, from cloud communications for SMEs to secure, complex networking solutions for larger enterprises, providing reliable, flexible platforms for today's digital environment.
Our solutions cover three core categories:
|
· |
Calling: Our telecoms network enables businesses to make and receive external voice phone calls, including the ability to voice-enable third-party collaboration platforms such as Zoom and Microsoft Teams. For businesses with international operations, Gamma operates as a global service provider, supplying phone numbers in 28 countries to support reliable, compliant global calling. |
|
· |
Cloud Communications: Cloud communication solutions bring voice calling, video, messaging and customer contact tools together in one easy-to-use platform, accessible from anywhere. We provide our own technology (such as PhoneLine+ and Starface) for the SME market as well as leading enterprise platforms from partners like Cisco, Ericsson-LG and Amazon. |
|
· |
Connectivity: Modern voice and cloud services depend on strong, secure data connections. Through partnerships with major network operators, we deliver the broadband, ethernet and mobile access that businesses rely on. |
Business Unit Performance
Business unit share of Group gross profit
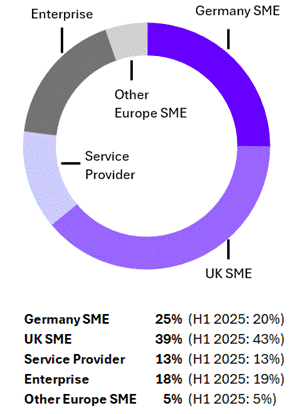
In 2026, the Gamma Business segment has been changed to report in two separate segments: UK SME and Service Provider. Certain costs previously recognised within UK SME and Central functions have been reallocated to the remaining segments. We have restated comparative values for revenue, gross profit and operating expenses. All restated amounts are indicated with an *.
An analysis of Germany SME and UK SME gross profit by product is included in the supplementary information.
Germany SME
Germany, accounting for 25% (H1 2025: 20%) of Group gross profit, serves c.80,000 SME customers with a comprehensive portfolio of cloud communications platforms, on-premise calling, connectivity and IoT products. These solutions are delivered through multiple routes to market, including a network of c.4,500 partners and our digital channel in Placetel.
|
|
Six months ended 30 June 2026 |
Six months ended 30 June 2025 |
Change (%) |
|
|
|
||
|
|
£m |
£m |
|
|
Revenue |
59.2 |
49.1 |
21% |
|
Gross Profit |
44.8 |
34.4 |
30% |
|
Gross Margin |
75.7% |
70.1% |
|
Germany delivered material growth, with gross profit increasing by 30%, reflecting both strong underlying performance and the full period contribution from Starface compared with the prior period (acquired in mid-February 2025). Gross margin also increased, supported by the contribution from Starface, which generates higher margins than the legacy German business, as it does not incur significant third-party licensing costs for its products and currently does not sell mobile through its channels which is at a lower margin.
Organic gross profit grew by 11% on a constant currency basis. Within this, organic cloud gross profit increased by 16%, driven by continued strong growth in cloud services across both our digital and channel businesses as German companies continue to migrate from on-premise, licence-based systems to modern, subscription-based communications platforms. As expected, licence revenue therefore declined slightly, 4% on an organic basis in the period.
Starface integration continued to progress well. A single sales organisation for the German channel was established and is operating effectively. This integrated commercial approach is creating new cross-selling and upselling opportunities, and enables partners to address a broader range of customer communication needs. A unified channel customer care function is also in place, driving further improvements in service quality for partners.
Placetel AI, a new product launched in 2026, saw growing adoption, with traffic volumes increasing significantly as adoption accelerates.
UK SME
UK SME, accounting for 39% (H1 2025: 43%) of Group gross profit, sells a broad range of Calling, Cloud Communications and Connectivity products that support small UK businesses through our channel partner network. End customers typically have fewer than 250 employees.
|
|
Six months ended 30 June 2026 |
Six months ended 30 June 2025* |
Change (%) |
|
|
£m |
£m |
|
|
Revenue |
141.7 |
141.0 |
0% |
|
Gross Profit |
69.3 |
74.3 |
(7%) |
|
Gross Margin |
48.9% |
52.7% |
|
UK SME gross profit declined by 7% to £69.3m (H1 2025: £74.3m) although gross profit was consistent with H2 2025. Demand for cloud and connectivity solutions remained strong, with continued growth in Webex for Gamma, PhoneLine+ and full fibre connectivity ("FTTP") volumes. However, competitive market conditions continued to generate pricing pressure, with new customers typically being won on lower-margin solutions and renewals won at lower-margins, which more than offset volume growth. In addition, H1 2025 benefitted from some non-recurring credits.
As previously highlighted, the Group faces an expected one-off headwind ahead of the PSTN switch-off on 31 January 2027. In H1 2026, line churn was lower than expected and we also saw the benefit of price increases. As a result, PSTN gross profit was flat year on year.
The launch of FibreXchange strengthened our connectivity proposition by giving partners a simpler way to source fibre connectivity from multiple suppliers. With around 1,500 partners already using Gamma's portal, we have a ready-made route to support customers through the copper-to-fibre migration.
Calling gross profit decreased due to the continued rationalisation of our legacy SIP PBX customer base (on-premise phone system), which resulted in lower usage volumes and reduced margins.
Gamma's Webex proposition has continued to gain traction in the UK, with the user base reaching c.35k since launch in Q4 2025.
We launched GammaPlus into the UK Channel, which enables us to rapidly onboard a range of additional products and services to up- and cross-sell. The expanded portfolio includes AI concierge (an AI virtual assistant to answer routine calls and enquiries, improving CX), Webex CRM integration, Webex call analytics and reporting, and cybersecurity capabilities.
Service Provider
Service Provider, accounting for 13% (H1 2025 13%) of Group gross profit, provides Calling products (regulated voice, numbering, porting and SMS services) in 28 countries for large, global communications platform providers, network operators and Mobile Virtual Network Operators ("MVNOs") who do not have their own telephone networks.
|
|
Six months ended 30 June 2026 |
Six months ended 30 June 2025* |
Change (%) |
|
|
|
||
|
|
£m |
£m |
|
|
Revenue |
48.2 |
45.0 |
7% |
|
Gross Profit |
23.1 |
21.7 |
6% |
|
Gross Margin |
47.9% |
48.2% |
|
Service Provider gross profit increased by 6% to £23.1m (H1 2025: £21.7m), driven by higher voice traffic volumes in its core UK market. Performance benefited from continued growth in partnerships with major global technology vendors, including contracts to carry European and UK voice. These contracts reinforce the confidence that larger providers place in Gamma's reliability, scale, operational delivery and quality of service.
International expansion in the APAC region progressed well, with Australia, New Zealand and Singapore now fully operational. Initial sales were generated in Australia. Licensing was obtained in the Philippines.
Enterprise
Enterprise sells cloud communications platforms (including contact centre solutions), connectivity, mobile, security and complex managed networks to mainly large corporate and public sector organisations. It accounted for 18% (H1 2025: 19%) of Group gross profit.
|
|
Six months ended 30 June 2026 |
Six months ended 30 June 2025* |
Change (%) |
|
|
|
||
|
|
£m |
£m |
|
|
Revenue |
65.5 |
66.5 |
(2%) |
|
Gross Profit |
31.5 |
32.3 |
(2%) |
|
Gross Margin |
48.1% |
48.6% |
|
Enterprise gross profit declined by 2% to £31.5m (H1 2025: £32.3m) and increased 1% on H2 2025. The year-on-year decline primarily reflected the expected full-year impact of pricing pressure on ethernet connectivity contracts renewed during 2025, partially offset by the roll out of some of our key wins made late last year as previously highlighted.
Enterprise's pan-European capabilities remain an important differentiator, enabling the delivery of multi-country solutions for large corporate customers and supporting success in larger and more complex opportunities. This resulted in a number of significant customer wins and contract extensions across key markets, including European contracts with German fintech company N26 for customer experience, and David Lloyd to extend its managed network across Germany, Spain and the Benelux region. In the UK, the business secured new opportunities including an AI-led customer experience solution for JD Sports and a cloud contact centre deployment for the Student Loans Company, alongside notable contract extensions with Central England Co-op and the RAC.
Financial Review
Operating expenses
Operating expenses declined from £127.6m in H1 2025 to £126.1m. This is broken down as follows:
|
|
Six months ended 30 June 2026 |
Six months ended 30 June 2025* |
Change (%) |
|
|
|
||
|
|
£m |
£m |
|
|
Operating expenses excluding research and development costs, depreciation and amortisation and exceptional items: |
96.6 |
90.4 |
7% |
|
-- Germany SME |
31.3 |
24.4 |
28% |
|
-- UK SME, Service provider and Enterprise |
54.5 |
57.3 |
(5%) |
|
-- Other Europe SME |
6.7 |
6.8 |
(1%) |
|
-- Central |
4.1 |
1.9 |
116% |
|
Research and development costs |
9.0 |
10.1 |
(11%) |
|
Depreciation & amortisation (excluding business combinations) |
11.9 |
10.2 |
17% |
|
Amortisation of intangibles arising due to business combinations |
8.6 |
9.6 |
(10%) |
|
Exceptional items |
- |
7.3 |
n/m |
|
Total operating expenses |
126.1 |
127.6 |
(1%) |
Operating expenses excluding research and development costs, depreciation and amortisation and exceptional items increased by 7% (compared to gross profit growth of 4%) comprising the following:
|
· |
German SME operating expenses increased by £6.9m (28%) to £31.3m (H1 2025: £24.4m), primarily reflecting the full period of ownership of Starface (acquired in mid-February 2025). This compares to gross profit growth of £10.4m (30%). On an organic constant currency basis, operating expenses increased by 8%, reflecting continued investment in growth initiatives, including sales and marketing activities, which supported organic constant currency gross profit growth of 11%. |
|
· |
UK SME, Service provider and Enterprise operating expenses cumulatively decreased by £2.8m (5%), despite inflationary pressure and continued investment in a number of growth initiatives, including the expansion of Service Provider into APAC and the delivery of significant Enterprise contracts secured in late 2025 and during the period. This reduction was ahead of the 3% aggregate gross profit decline, reflecting improved operating efficiency across these businesses. The improvement was driven by specific actions taken during the half, together with the execution of the 2025 restructuring programme. |
|
· |
Central costs increased by £2.2m to £4.1m (H1 2025: £1.9m), primarily as the prior period benefited from a net gain on foreign exchange related items of £1.4m (H1 2026: £Nil), which was treated as an other adjusting item. In addition, a limited amount of additional costs was incurred in the period. Contingent consideration of £1.3m was released in the period (H1 2025: £1.5m net release). |
Research and development costs decreased by £1.1m (11%) to £9.0m.
Depreciation and amortisation of tangible and intangible assets (excluding business combinations) increased to £11.9m (H1 2025: £10.2m), reflecting the increased level of capitalisation of development costs during 2025 and the additional contribution from Starface.
Amortisation arising from business combinations decreased to £8.6m (H1 2025: £9.6m), as certain acquired intangible assets became fully amortised. This was partially offset by an additional 1.5 months of amortisation relating to the Starface acquisition.
Exceptional Items
There were no exceptional items in the period (H1 2025: £7.3m expense).
Adjusted EBITDA and EBITDA
Adjusted EBITDA grew from £70.9m to £72.5m (2%), driven by the inorganic contribution from Starface (acquired mid-February 2025). It grew at a lower rate than gross profit, due to the increased central costs, discussed above. Excluding the impact of acquisitions, Adjusted EBITDA decreased by 1% on an organic constant currency basis.
In addition to the inorganic Starface contribution, the absence of exceptional items (H1 2025: £7.3m expense) or other adjusting items (H1 2025: £0.6m gain) boosted the year on year EBITDA which grew from £64.2m to £72.5m.
Profit before tax and Adjusted PBT
Profit before tax grew from £43.5m to £50.1m (15%) while Adjusted PBT decreased from £61.0m to £59.2m (3%).
Adjusted PBT decreased as depreciation & amortisation (excluding business combinations) increased by £1.7m, as described above, and net finance costs (excluding the impact of unwinding of discounting on acquisition-related liabilities) increased to a net expense of £1.4m (H1 2025: £0.3m net income). This move to a net finance expense was due to a £1.7m reduction in interest income as the prior period benefited from higher cash balances before the acquisition of Starface in February 2025.
Profit before tax benefited from no exceptional costs being incurred in the current period (H1 25: £7.3m) and from a £1.0m reduction in amortisation of intangibles arising due to business combinations, as previously described.
Taxation
The effective tax rate was 26% (H1 2025: 26%) based on applying the expected full year effective rate.
Net debt, financing and cash flows
As at 30 June 2026 the Group had Net debt of £3.8m (H1 2025: Net debt £21.6m). Net debt comprises borrowings of £25.6m (H1 2025: £46.8m) less cash and cash equivalents of £21.8m (H1 2025: £25.2m).
Cash generated by operations was £69.2m (H1 2025: £53.1m) and adjusted cash generated by operations was £70.3m (H1 2025: £63.7m) with £1.1m cash outflow relating to 2025 exceptional costs. Adjusted cash conversion was 97% (H1 2025: 90%), which compares to 93% for the year ended 31 December 2025. The increase primarily relates to a lower working capital outflow.
Net tax paid decreased to £9.8m (H1 2025: £13.7m), reflecting a refund received during the period in the UK and lower taxes paid in Germany primarily as the prior period included a £1.9m partial payment of the tax liabilities acquired with Starface.
The primary cash items which are not directly related to trading were:
|
· |
£34.5m cash returned to shareholders (H1 2025: £47.0m). This comprises £21.1m of own shares repurchased as part of the share buyback programme (H1 2025: £34.9m) and £13.4m paid as dividends (H1 2025: £12.1m). |
|
· |
Capital spend was £11.9m, which is an increase from £9.6m in H1 2025. This is discussed below. |
|
· |
£7.5m of borrowing repayments, net of drawdowns (H1 2025: £47.0m net borrowings). |
|
· |
£4.3m paid for acquisitions net of cash acquired (H1 2025: £157.4m). This comprises deferred consideration for Placetel of £1.9m and £2.4m of contingent consideration (mainly Pragma). |
|
· |
£2.6m of lease liability repayments (H1 2025: £2.1m). |
|
· |
£1.1m of interest paid on borrowings offset by £0.5m of interest income on cash and cash equivalents (H1 2025: £0.3m net interest received). |
Capital spend
Capital spend in H1 2026 was £11.9m (H1 2025: £9.6m), broken down as follows:
|
· |
£10.1m on the capitalisation of development costs incurred during the period (H1 2025: £8.5m). The increase primarily reflects investment in internal systems designed to drive operational efficiencies and generate cost savings. It also includes investment in new products, such as AI-concierge, FibreXchange, Gamma Mobile and Voice Enablement enhancements, together with a higher contribution from Starface compared with the prior period. |
|
· |
£1.5m for the core network and computer equipment (H1 2025: £1.1m). |
|
· |
£0.3m with third-party software vendors for the software which underpins our Cloud products (H1 2025: £Nil). |
Adjusted EPS (fully diluted) and EPS (fully diluted)
Adjusted EPS (fully diluted) was broadly unchanged at 47.7p (H1 2025: 47.9p). This was a result of a 3% decline in Adjusted PBT, offset by the benefit from the share buybacks in 2026 and 2025 which reduced our share count. EPS (fully diluted) grew from 34.1p to 40.2p (18%), reflecting the increase in profit before tax of 15% and the benefit from share buybacks.
Return on capital employed ("ROCE")
ROCE measures the efficiency of the Group's profit generation from the capital we deploy. It is an important measure of efficiency. ROCE for the twelve months ending June 2026 was healthy at 30% (31 December 2025: 28%).
Capital allocation
As a result of the proposed acquisition of the Group, announced on 1 September, Gamma does not intend to declare or pay any further interim dividends prior to the effective date (H1 2025: 7.4p).
At 30 June 2026, a total of 2,412,201 Ordinary Shares, at a value of £21.1m, had been purchased and cancelled out of the share buyback programme announced on 13 January 2026. £21.5m of the programme had yet to be completed, including £0.1m commission, and is included in other payables at 30 June 2026. The shares purchased and the remaining liability resulted in a £42.6m reduction in retained earnings, including commissions.
Since 30 June, a further 703,820 shares have been acquired taking the total value in 2026 to £28.1m. The share buyback programme is currently suspended, as the current share price is not within certain pre-set parameters agreed with Investec Bank plc, which was appointed to manage the share buyback programme.
Principal risks and uncertainties
The principal risks faced by the Group, which are expected to remain relevant for the rest of 2026, continue to include the risks set out in the Annual Report for the year ended 31 December 2025. These are: that product development becomes misaligned with market needs; unplanned service disruption; data loss and cyber-attacks; over-reliance on key suppliers; inability to attract and retain top talent; failure to adapt and develop new routes to market; uncertain competitive landscape causes loss of market share; organisational transformation and integration risk; and legal and regulatory non-compliance. Further details can be found in the Annual Report for the year ended 31 December 2025.
The impact of the proposed acquisition has been considered by the Board, and as there are no immediate changes planned to the strategic and operational function of the Group, we do not believe there are any changes required to the identified risks at the current time.
Going Concern
The Group's business activities, together with the factors likely to affect its future development, performance and position, are consistent with those set out in the Annual Report for the year ended 31 December 2025. In assessing going concern management and the Board have considered:
|
· |
The principal risks faced by the Group as set out above. These are consistent with those found in the Annual Report for the year ended 31 December 2025. |
|
· |
The strong liquidity position - at 30 June 2026 the Group had cash and cash equivalents of £21.8m and £104.5m of the revolving credit facility undrawn providing total liquidity of £126.3m (31 December 2025: £120.5m). |
|
· |
Budgets, financial plans and associated future cash flows (including the availability of liquidity and borrowings). |
|
· |
Sensitivity analysis assessing the impact of severe but plausible scenarios on the going concern assessment period and which confirms that projected cash flows and current borrowing arrangements should provide the Group with significant liquidity over the going concern period. |
|
· |
The offer made by Epiris (Bradbury Bidco Ltd) to acquire the Group, which is subject to shareholder and regulatory approval. Based on the stated intentions of the acquiring party and our understanding of the financial support that would be made available, if needed, the Directors believe that the going concern basis is still appropriate. |
The Directors are satisfied that the Group has adequate financial resources to continue in operational existence for the foreseeable future, being a period of at least twelve months from the date of this report. Accordingly, the going concern basis of accounting continues to be used in the preparation of these condensed consolidated financial statements.
Board changes
As previously announced, Gamma was pleased to welcome Damien Maltarp to the Board as Chief Financial Officer on 10 August 2026.
|
Andrew Belshaw |
Damien Maltarp |
|
Chief Executive Officer |
Chief Financial Officer |
Statement of Directors' responsibilities
The Directors confirm that to the best of their knowledge:
|
· |
the condensed set of interim financial statements has been prepared in accordance with IAS 34 "Interim Financial Reporting"; |
|
· |
the Interim Management Report includes a fair review of the information required by DTR 4.2.7R (indication of important events and their impact on the financial statements during the first six months of the year and description of principal risks and uncertainties for the remaining six months of the year); and |
|
· |
the Interim Management Report includes a fair review of the information required by DTR 4.2.8R (disclosure of related party transactions and any material changes therein during the first six months of the year). |
By order of the Board
6 September 2026
Supplementary information on Gross Profit by segment and product
The table below sets out gross profit by segment and reflects how the Group operates the business and monitors financial performance. As this information has not been previously presented we have included H2 2025 to provide a full year 2025 comparative.
|
Gross Profit |
|
|
||
|
Split by segment and product |
Six months ended 30 June 2026 |
Six months ended 31 December 2025 |
Six months ended 30 June 2025 |
|
|
|
£m |
£m |
£m |
|
|
Germany SME |
44.8 |
44.0 |
34.4 |
|
|
Cloud |
23.9 |
22.0 |
17.9 |
|
|
On premise licences & maintenance |
9.7 |
10.5 |
6.6 |
|
|
Calling |
7.0 |
6.8 |
6.0 |
|
|
Connectivity |
3.8 |
4.2 |
3.4 |
|
|
Other |
0.4 |
0.5 |
0.5 |
|
|
UK SME excl. PSTN |
62.7 |
63.6 |
67.7 |
|
|
Cloud |
28.3 |
28.9 |
29.1 |
|
|
Calling |
23.1 |
23.4 |
24.6 |
|
|
Connectivity |
11.8 |
11.4 |
11.4 |
|
|
Other |
(0.5) |
(0.1) |
2.6 |
|
|
Service provider excl. PSTN |
22.3 |
21.8 |
20.9 |
|
|
PSTN affected* |
7.4 |
6.2 |
7.4 |
|
|
Enterprise |
31.5 |
31.2 |
32.3 |
|
|
Other Europe SME |
9.4 |
9.4 |
9.3 |
|
|
Total |
178.1 |
176.2 |
172.0 |
|
*PSTN affected in H1 2026 comprises £6.6m related to UK SME and £0.8m to Service Provider (H1 2025: £6.6m and £0.8m, H2 2025 £5.5m and £0.7m).
Independent Review Report to Gamma Communications plc
Conclusion
We have been engaged by Gamma Communications plc ("the Company") and its subsidiaries (together "the Group") to review the condensed set of financial statements in the half-yearly financial report for the six months ended 30 June 2026 which comprises the condensed consolidated statement of profit or loss, the condensed consolidated statement of comprehensive income, the condensed consolidated statement of financial position, the condensed consolidated statement of cash flows, the condensed consolidated statement of changes in equity and related notes 1 to 13.
Based on our review, nothing has come to our attention that causes us to believe that the condensed set of financial statements in the half-yearly financial report for the six months ended 30 June 2026 is not prepared, in all material respects, in accordance with United Kingdom adopted International Accounting Standard 34 and the Disclosure Guidance and Transparency Rules of the United Kingdom's Financial Conduct Authority.
Basis for Conclusion
We conducted our review in accordance with International Standard on Review Engagements (UK) 2410 "Review of Interim Financial Information Performed by the Independent Auditor of the Entity" issued by the Financial Reporting Council for use in the United Kingdom (ISRE (UK) 2410). A review of interim financial information consists of making inquiries, primarily of persons responsible for financial and accounting matters, and applying analytical and other review procedures. A review is substantially less in scope than an audit conducted in accordance with International Standards on Auditing (UK) and consequently does not enable us to obtain assurance that we would become aware of all significant matters that might be identified in an audit. Accordingly, we do not express an audit opinion.
As disclosed in note 1, the annual financial statements of the Group are prepared in accordance with United Kingdom adopted international accounting standards. The condensed set of financial statements included in this half-yearly financial report has been prepared in accordance with United Kingdom adopted International Accounting Standard 34, "Interim Financial Reporting".
Conclusion Relating to Going Concern
Based on our review procedures, which are less extensive than those performed in an audit as described in the Basis for Conclusion section of this report, nothing has come to our attention to suggest that the directors have inappropriately adopted the going concern basis of accounting or that the directors have identified material uncertainties relating to going concern that are not appropriately disclosed.
This Conclusion is based on the review procedures performed in accordance with ISRE (UK) 2410; however future events or conditions may cause the entity to cease to continue as a going concern.
Responsibilities of the directors
The directors are responsible for preparing the half-yearly financial report in accordance with the Disclosure Guidance and Transparency Rules of the United Kingdom's Financial Conduct Authority.
In preparing the half-yearly financial report, the directors are responsible for assessing the Group's ability to continue as a going concern, disclosing as applicable, matters related to going concern and using the going concern basis of accounting unless the directors either intend to liquidate the Company or to cease operations, or have no realistic alternative but to do so.
Auditor's Responsibilities for the review of the financial information
In reviewing the half-yearly financial report, we are responsible for expressing to the Company a conclusion on the condensed set of financial statements in the half-yearly financial report. Our Conclusion, including our Conclusion Relating to Going Concern, are based on procedures that are less extensive than audit procedures, as described in the Basis for Conclusion paragraph of this report.
Use of our report
This report is made solely to the Company in accordance with ISRE (UK) 2410. Our work has been undertaken so that we might state to the Company those matters we are required to state to it in an independent review report and for no other purpose. To the fullest extent permitted by law, we do not accept or assume responsibility to anyone other than the Company, for our review work, for this report, or for the conclusions we have formed.
Deloitte LLP
Statutory Auditor
Reading, United Kingdom
6 September 2026
Condensed consolidated statement of profit or loss
For the six months ended 30 June 2026
|
|
|
30 June 2026 |
30 June 2025 |
|
|
Note |
£m Unaudited |
£m Unaudited |
|
|
|
|
|
|
Revenue |
3 |
330.0 |
316.6 |
|
Cost of sales |
|
(151.9) |
(144.6) |
|
Gross Profit |
|
178.1 |
172.0 |
|
Operating Expenses |
|
(126.1) |
(127.6) |
|
Of which exceptional items |
|
- |
(7.3) |
|
Profit from operations |
|
52.0 |
44.4 |
|
Finance income |
|
0.3 |
2.0 |
|
Finance expense |
|
(2.2) |
(2.9) |
|
Profit before tax |
|
50.1 |
43.5 |
|
Tax expense |
5 |
(13.3) |
(11.1) |
|
Profit after tax |
|
36.8 |
32.4 |
|
|
|
|
|
|
Attributable to: |
|
|
|
|
Equity holders of Gamma Communications plc |
|
36.7 |
32.4 |
|
Non-controlling interest |
|
0.1 |
- |
|
|
|
36.8 |
32.4 |
|
|
|
|
|
|
Earnings per share attributable to the equity holders of the Company: |
|
|
|
|
Basic per Ordinary Share (pence) |
6 |
40.2p |
34.2p |
|
Diluted per Ordinary Share (pence) |
6 |
40.2p |
34.1p |
All results recognised during the period were generated from continuing operations.
Condensed consolidated statement of comprehensive income
For the six months ended 30 June 2026
|
|
30 June 2026 |
30 June 2025 |
|
|
£m Unaudited |
£m Unaudited |
|
Profit after tax for the period |
36.8 |
32.4 |
|
Other comprehensive (expense)/ income |
|
|
|
Items that may be reclassified subsequently to the statement of profit or loss: |
|
|
|
Exchange differences on translation of foreign operations before tax |
(2.4) |
6.7 |
|
Tax effect of exchange differences on translation of foreign operations |
0.2 |
(0.6) |
|
Total other comprehensive (expense)/ income |
(2.2) |
6.1 |
|
|
|
|
|
Total comprehensive income |
34.6 |
38.5 |
|
|
|
|
|
Total comprehensive income for the period attributable to: |
|
|
|
Equity holders of Gamma Communications plc |
34.5 |
38.5 |
|
Non-controlling interest |
0.1 |
- |
|
|
34.6 |
38.5 |
Condensed consolidated statement of financial position
As at 30 June 2026
|
|
|
30 June 2026 |
30 June 2025 |
31 December 2025 |
|
|
||||
|
|
Note |
£m Unaudited |
£m Unaudited |
£m Audited |
|
Assets |
|
|
|
|
|
Non-current assets |
|
|
|
|
|
Property, plant and equipment |
8 |
36.2 |
40.8 |
40.0 |
|
Intangible assets |
9 |
389.7 |
394.1 |
396.8 |
|
Deferred tax asset |
|
5.3 |
7.9 |
6.9 |
|
Trade and other receivables |
|
19.8 |
10.6 |
10.8 |
|
Contract assets |
|
12.2 |
12.6 |
12.7 |
|
|
|
463.2 |
466.0 |
467.2 |
|
Current assets |
|
|
|
|
|
Inventories |
|
12.7 |
8.4 |
7.5 |
|
Trade and other receivables |
|
84.1 |
86.6 |
78.4 |
|
Contract assets |
|
42.1 |
40.0 |
41.8 |
|
Cash and cash equivalents |
|
21.8 |
25.2 |
23.7 |
|
Current tax asset |
|
2.6 |
2.0 |
2.7 |
|
|
|
163.3 |
162.2 |
154.1 |
|
Total assets |
|
626.5 |
628.2 |
621.3 |
|
|
|
|
|
|
|
Liabilities |
|
|
|
|
|
Non-current liabilities |
|
|
|
|
|
Other payables |
|
1.9 |
0.1 |
- |
|
Other financial liabilities |
10 |
37.3 |
60.6 |
45.6 |
|
Provisions |
|
1.4 |
1.4 |
1.4 |
|
Contract liabilities |
|
19.7 |
13.7 |
15.0 |
|
Acquisition-related liabilities |
10 |
8.0 |
13.0 |
15.8 |
|
Deferred tax liability |
|
48.1 |
50.3 |
48.8 |
|
|
|
116.4 |
139.1 |
126.6 |
|
Current liabilities |
|
|
|
|
|
Trade and other payables |
|
99.2 |
90.7 |
70.3 |
|
Other financial liabilities |
10 |
4.7 |
3.1 |
5.2 |
|
Provisions |
|
1.2 |
0.8 |
2.1 |
|
Contract liabilities |
|
24.9 |
24.5 |
20.2 |
|
Acquisition-related liabilities |
10 |
10.0 |
10.3 |
7.2 |
|
Current tax liability |
|
5.5 |
3.9 |
4.7 |
|
|
|
145.5 |
133.3 |
109.7 |
|
Total liabilities |
|
261.9 |
272.4 |
236.3 |
|
Net assets |
|
364.6 |
355.8 |
385.0 |
|
|
|
|
|
|
|
Equity |
|
|
|
|
|
Share capital |
11 |
0.2 |
0.2 |
0.2 |
|
Share premium reserve |
|
23.3 |
23.3 |
23.3 |
|
Other reserves |
12 |
(7.7) |
(10.4) |
(6.3) |
|
Retained earnings |
|
349.5 |
343.6 |
368.6 |
|
Equity attributable to owners of Gamma Communications plc |
|
365.3 |
356.7 |
385.8 |
|
Non-controlling interest |
|
0.4 |
0.2 |
0.3 |
|
Written put options over non-controlling interest |
|
(1.1) |
(1.1) |
(1.1) |
|
Total equity |
|
364.6 |
355.8 |
385.0 |
Condensed consolidated statement of cash flows
For the six months ended 30 June 2026
|
|
|
30 June 2026 |
30 June 2025 |
|
|
Note |
£m Unaudited |
£m Unaudited |
|
Cash flows from operating activities |
|
|
|
|
Profit for the period before tax |
|
50.1 |
43.5 |
|
Adjustments for: |
|
|
|
|
Depreciation of property, plant and equipment |
|
4.0 |
4.2 |
|
Depreciation of right-of-use assets |
|
2.4 |
1.4 |
|
Amortisation of intangible assets |
9 |
14.1 |
14.2 |
|
Change in fair value of contingent consideration |
10 |
(1.3) |
(1.5) |
|
Share-based payment expense |
|
1.0 |
1.6 |
|
Finance income |
|
(0.3) |
(2.0) |
|
Finance expense |
|
2.2 |
2.9 |
|
Other non-cash movements* |
|
- |
(1.3) |
|
|
|
72.2 |
63.0 |
|
|
|
|
|
|
Increase in trade and other receivables and contract assets |
|
(14.7) |
(15.5) |
|
(Increase)/decrease in inventories |
|
(5.1) |
2.6 |
|
Increase in trade and other payables |
|
8.3 |
6.4 |
|
Increase/(decrease) in contract liabilities |
|
9.4 |
(3.0) |
|
Decrease in provisions |
|
(0.9) |
(0.4) |
|
Cash generated by operations |
|
69.2 |
53.1 |
|
Taxes paid |
|
(9.8) |
(13.7) |
|
Net cash flows from operating activities |
|
59.4 |
39.4 |
|
|
|
|
|
|
Investing activities |
|
|
|
|
Purchase of property, plant and equipment |
|
(1.5) |
(1.1) |
|
Purchase of intangible assets |
9 |
(10.4) |
(8.5) |
|
Interest received |
|
0.5 |
1.8 |
|
Acquisition of subsidiaries net of cash acquired |
10 |
(4.3) |
(142.8) |
|
Net cash flows used in investing activities |
|
(15.7) |
(150.6) |
|
|
|
|
|
|
Financing activities |
|
|
|
|
Lease liability repayments |
|
(2.6) |
(2.1) |
|
Proceeds from borrowings |
|
10.5 |
89.0 |
|
Repayment of borrowings |
|
(18.0) |
(42.0) |
|
Repayment of borrowings acquired with acquisitions |
|
- |
(14.6) |
|
Interest paid |
|
(1.1) |
(1.5) |
|
Share issues/ reissued |
|
0.2 |
0.2 |
|
Dividends |
|
(13.4) |
(12.1) |
|
Repurchase of own shares |
|
(21.1) |
(34.9) |
|
Net cash flows used in financing activities |
|
(45.5) |
(18.0) |
|
|
|
|
|
|
Net decrease in cash and cash equivalents |
|
(1.8) |
(129.2) |
|
Cash and cash equivalents at beginning of period |
|
23.7 |
153.7 |
|
Effects of exchange rate changes on cash and cash equivalents |
|
(0.1) |
0.7 |
|
Cash and cash equivalents at end of period |
|
21.8 |
25.2 |
*Primarily relating to foreign exchange movements on deferred consideration
Condensed consolidated statement of changes in equity
For the six months ended 30 June 2026
|
|
Share capital |
Share premium reserve |
Other reserves |
Retained earnings |
Total |
Non-controlling interest |
Written put options over non-controlling interest |
Total Equity |
|
|
|
|||||||
|
|
£m |
£m |
£m |
£m |
£m |
£m |
£m |
£m |
|
1 January 2025 |
0.2 |
23.3 |
(18.2) |
368.3 |
373.6 |
0.2 |
(1.1) |
372.7 |
|
Issue or reissue of shares |
- |
- |
(0.7) |
0.7 |
- |
- |
- |
- |
|
Share-based payment expense |
- |
- |
1.6 |
- |
1.6 |
- |
- |
1.6 |
|
Share buyback1 |
- |
- |
- |
(45.1) |
(45.1) |
- |
- |
(45.1) |
|
Treasury share allocations2 |
- |
- |
0.8 |
(0.6) |
0.2 |
- |
- |
0.2 |
|
Dividends paid |
- |
- |
- |
(12.1) |
(12.1) |
- |
- |
(12.1) |
|
Transactions with owners |
- |
- |
1.7 |
(57.1) |
(55.4) |
- |
- |
(55.4) |
|
Profit for the period |
- |
- |
- |
32.4 |
32.4 |
- |
- |
32.4 |
|
Other comprehensive income |
- |
- |
6.1 |
- |
6.1 |
- |
- |
6.1 |
|
Total comprehensive income |
- |
- |
6.1 |
32.4 |
38.5 |
- |
- |
38.5 |
|
30 June 2025 |
0.2 |
23.3 |
(10.4) |
343.6 |
356.7 |
0.2 |
(1.1) |
355.8 |
|
|
|
|
|
|
|
|
|
|
|
1 January 2026 |
0.2 |
23.3 |
(6.3) |
368.6 |
385.8 |
0.3 |
(1.1) |
385.0 |
|
Issue or reissue of shares |
- |
- |
(1.2) |
1.2 |
- |
- |
- |
- |
|
Share-based payment expense |
- |
- |
1.0 |
- |
1.0 |
- |
- |
1.0 |
|
Deferred tax on share based payment expense |
- |
- |
- |
(0.2) |
(0.2) |
- |
- |
(0.2) |
|
Share buyback1 |
- |
- |
- |
(42.6) |
(42.6) |
- |
- |
(42.6) |
|
Treasury share allocations2 |
- |
- |
1.0 |
(0.8) |
0.2 |
- |
- |
0.2 |
|
Dividends paid |
- |
- |
- |
(13.4) |
(13.4) |
- |
- |
(13.4) |
|
Transactions with owners |
- |
- |
0.8 |
(55.8) |
(55.0) |
- |
- |
(55.0) |
|
Profit for the period |
- |
- |
- |
36.7 |
36.7 |
0.1 |
- |
36.8 |
|
Other comprehensive expense |
- |
- |
(2.2) |
- |
(2.2) |
- |
- |
(2.2) |
|
Total comprehensive (expense)/ income |
- |
- |
(2.2) |
36.7 |
34.5 |
0.1 |
- |
34.6 |
|
30 June 2026 |
0.2 |
23.3 |
(7.7) |
349.5 |
365.3 |
0.4 |
(1.1) |
364.6 |
1 Represents shares purchased under the share buyback programmes. Shares purchased under the programmes were immediately cancelled. In H1 2026, £21.1m has been paid in cash and £21.5m was recognised as a liability within other payables.
2 Treasury share allocations relate to treasury shares which have been used to satisfy share options and other employee share plans.
Notes to the interim financial information
For the six months ended 30 June 2026
1. Basis of preparation
The condensed consolidated interim financial information (interim financial information) included in this half‑yearly financial report has been prepared in accordance with International Accounting Standard 34 'Interim Financial Reporting', as adopted by the United Kingdom. The interim financial statements do not constitute statutory accounts within the meaning of the Companies Act 2006 and should be read in conjunction with the Group's Annual Report and Accounts for the year ended 31 December 2025, which was prepared in accordance with IFRS as adopted by the United Kingdom.
Two new amendments, Amendment to IFRS 9 and IFRS 7 - Amendments to the Classification and Measurement of Financial Instruments and Amendments to IFRS 9 and IFRS 7 - Amendments to Contracts Referencing Nature-dependent Electricity, were applied for the first time in the period. These amendments had no material impact on the condensed consolidated interim financial statements.
2. Accounting policies, judgements and estimates
Accounting policies
The accounting policies adopted are consistent with those followed in the preparation of the audited statutory financial statements for the year ended 31 December 2025 other than for the new amendments applied for the first time as outlined in note 1, which did not have a material impact on the condensed consolidated interim financial statements.
Judgements and estimates
Preparation of the condensed consolidated interim financial information requires the Group to make certain estimations, assumptions and judgements regarding the future. Estimates and judgements are continually evaluated based on historical experience and other factors, including best estimates of future events. In the future, actual experience may differ from these estimates and assumptions. The critical accounting judgements and key sources of estimation uncertainty reported in the financial statements for the year ended 31 December 2025 are still relevant. No new items have been identified in the six months ended 30 June 2026.
3. Segment information
The Group's main operating segments are outlined below:
|
· |
Germany SME - Germany SME serves over 80,000 SME customers with a comprehensive product portfolio of cloud communications platforms, on-premise calling, connectivity and IoT products. Delivered through multiple routes to market, including a partner network of c.4,500 partners and our digital channel in Placetel. It contributed 25% (H1 2025: 20%) of the Group's gross profit. |
|
· |
UK SME - This segment sells a broad range of Calling, Cloud Communications and Connectivity products that support small UK businesses through our channel partner network. End customers typically have fewer than 250 employees. It contributed 39% (H1 2025: 43%) of the Group's gross profit. |
|
· |
Service Provider - This segment provides Calling products (voice services, numbering and SMS capabilities) in 28 countries for large, global communications platform providers, network operators and mobile virtual network operators who do not have their own telephone networks. It contributed 13% (H1 2025: 13%) of the Group's gross profit. |
|
· |
Enterprise - Enterprise sells cloud communications platforms (including contact centre solutions), connectivity, mobile, security and complex managed networks to mainly large corporate and public sector organisations. It contributed 18% (H1 2025: 19%) of the Group's gross profit. |
|
· |
Other Europe SME - This segment consists of sales made in the remainder of Europe through Gamma's Spanish and Dutch businesses. It contributed 5% (H1 2025: 5%) of the Group's gross profit. |
|
· |
Central functions - Comprises the central management team and wider Group costs. |
Change in segmental reporting
To align with internal management reporting, which is reported to the Board and Executive Committee used for decision-making, we have split out our Gamma Business segment into two segments: UK SME and Service Provider.
In the current period, certain costs previously recognised within UK SME and Central functions have been reallocated to the remaining segments to reflect changes in internal reporting and accountability.
These changes in segments and cost reporting have no impact on the Group's consolidated results. Comparative segment disclosures have been re-presented on a consistent basis.
In addition, we have updated the segment names with Gamma Enterprise now Enterprise, Gamma Germany now Germany SME and Other Europe now Other Europe SME.
Measurement of operating segment profit or loss, assets and liabilities
The accounting policies of the reporting segments are the same as those described in the summary of significant accounting policies. The Board and Executive Committee evaluate performance on the basis of earnings before interest, tax, depreciation, amortisation, exceptional items and other adjusting items ("Adjusted EBITDA"). Inter-segment sales are priced in line with sales to external customers, with an appropriate discount being applied to encourage use of Group resources at a rate acceptable to local tax authorities. This policy was applied consistently throughout the current and prior period.
|
|
Germany SME |
UK SME |
Service Provider |
Enterprise |
Other Europe SME |
Central functions |
Total |
|
Period to 30 June 2026 |
£m |
£m |
£m |
£m |
£m |
£m |
£m |
|
|
|
|
|
|
|
|
|
|
Segment revenue |
59.4 |
151.9 |
48.2 |
65.9 |
15.6 |
- |
341.0 |
|
Inter-segment revenue |
(0.2) |
(10.2) |
- |
(0.4) |
(0.2) |
- |
(11.0) |
|
Revenue from external customers |
59.2 |
141.7 |
48.2 |
65.5 |
15.4 |
- |
330.0 |
|
|
|
|
|
|
|
|
|
|
Timing of revenue recognition |
|
|
|
|
|
|
|
|
At a point in time |
13.9 |
10.0 |
3.9 |
4.6 |
1.0 |
- |
33.4 |
|
Over time (recurring) |
45.3 |
131.7 |
44.3 |
60.9 |
14.4 |
- |
296.6 |
|
|
59.2 |
141.7 |
48.2 |
65.5 |
15.4 |
- |
330.0 |
|
|
|
|
|
|
|
|
|
|
Gross profit |
44.8 |
69.3 |
23.1 |
31.5 |
9.4 |
- |
178.1 |
|
|
|
|
|
|
|
|
|
|
Adjusted EBITDA |
13.2 |
34.1 |
15.4 |
11.5 |
2.4 |
(4.1) |
72.5 |
|
Exceptional items |
- |
- |
- |
- |
- |
- |
- |
|
Other adjusting items |
- |
- |
- |
- |
- |
- |
- |
|
EBITDA |
13.2 |
34.1 |
15.4 |
11.5 |
2.4 |
(4.1) |
72.5 |
External customer revenue has been derived principally in the geographical area of the operating segment and no single customer contributes more than 10% of revenue.
|
|
Germany SME |
UK SME* |
Service Provider* |
Enterprise |
Other Europe SME |
Central functions |
Total |
|
Period to 30 June 2025 |
£m |
£m |
£m |
£m |
£m |
£m |
£m |
|
|
|
|
|
|
|
|
|
|
Segment revenue |
49.1 |
150.2 |
45.1 |
67.1 |
15.2 |
- |
326.7 |
|
Inter-segment revenue |
- |
(9.2) |
(0.1) |
(0.6) |
(0.2) |
- |
(10.1) |
|
Revenue from external customers |
49.1 |
141.0 |
45.0 |
66.5 |
15.0 |
- |
316.6 |
|
|
|
|
|
|
|
|
|
|
Timing of revenue recognition |
|
|
|
|
|
|
|
|
At a point in time |
15.0 |
6.2 |
2.4 |
7.0 |
0.7 |
- |
31.3 |
|
Over time (recurring) |
34.1 |
134.8 |
42.6 |
59.5 |
14.3 |
- |
285.3 |
|
|
49.1 |
141.0 |
45.0 |
66.5 |
15.0 |
- |
316.6 |
|
|
|
|
|
|
|
|
|
|
Gross profit* |
34.4 |
74.3 |
21.7 |
32.3 |
9.3 |
- |
172.0 |
|
|
|
|
|
|
|
|
|
|
Adjusted EBITDA* |
9.1 |
35.5 |
14.9 |
12.4 |
2.3 |
(3.3) |
70.9 |
|
Exceptional items |
- |
- |
- |
- |
- |
(7.3) |
(7.3) |
|
Other adjusting items |
- |
(0.8) |
- |
- |
- |
1.4 |
0.6 |
|
EBITDA* |
9.1 |
34.7 |
14.9 |
12.4 |
2.3 |
(9.2) |
64.2 |
* In 2025 a single Gamma Business segment was presented. To align with management reporting this has been split into two segments: UK SME and Service Provider. In addition, certain costs previously recognised within UK SME and Central functions have been reallocated to the remaining segments to reflect changes in internal reporting and accountability. Comparative segment disclosures have been re-presented on a consistent basis with the following impacts: Gross profit in Enterprise increased by £1.4m from £30.9m, Adjusted EBITDA decreased in Germany SME by £0.3m from £9.4m, Enterprise by £3.4m from £15.8m, Other Europe by £0.1m from £2.4m and increased in Central functions by £0.6m from (£3.9)m. These changes were offset with changes in the former Gamma Business Segment which is now split between UK SME and Service Provider therefore the aggregate impact is not given.
A reconciliation of Adjusted EBITDA, the Group's measure of Segment profit, to the Group's profit before tax for the period is included below.
|
|
Six months ended 30 June 2026 |
Six months ended 30 June 2025 |
|
|
£m |
£m |
|
Profit before tax |
50.1 |
43.5 |
|
Finance income |
(0.3) |
(2.0) |
|
Finance expense |
2.2 |
2.9 |
|
Profit from operations |
52.0 |
44.4 |
|
Depreciation of property, plant and equipment and right-of-use assets |
6.4 |
5.6 |
|
Amortisation of intangible assets excluding business combinations |
5.5 |
4.6 |
|
Amortisation of intangible assets arising due to business combinations |
8.6 |
9.6 |
|
EBITDA |
72.5 |
64.2 |
|
Exceptional items |
- |
7.3 |
|
Other adjusting items |
- |
(0.6) |
|
Adjusted EBITDA |
72.5 |
70.9 |
Further details on the definition and calculation of Adjusted EBITDA are included in the APM section.
Geographic segmentation
The UK is the Group's country of domicile and is where most revenue is generated, which is from external UK customers. The geographic analysis of revenue presented below is based on the country in which the customer is invoiced.
The Group's revenue from external customers by geographical location is detailed below:
|
|
Six months ended 30 June 2026 |
Six months ended 30 June 2025 |
|
|
£m |
£m |
|
UK |
230.9 |
235.1 |
|
Germany |
63.7 |
53.6 |
|
Rest of Europe |
29.6 |
24.5 |
|
Rest of World |
5.8 |
3.4 |
|
Total |
330.0 |
316.6 |
The Group's non-current assets, which exclude deferred tax assets and financial instruments, by geographical location of the assets, are detailed below:
|
|
30 June 2026 |
30 June 2025* |
|
|
£m |
£m |
|
UK |
186.1 |
175.7 |
|
Germany |
235.1 |
241.3 |
|
Rest of Europe |
23.2 |
27.1 |
|
Total |
444.4 |
444.1 |
*The prior period has been restated to correct the allocation of amount previously reported.
Product segmentation
|
|
Six months ended 30 June 2026 |
Six months ended 30 June 2025 |
|
|
£m |
£m |
|
Revenue recognised over time (recurring) |
|
|
|
Voice and data traffic |
56.8 |
53.8 |
|
Subscriptions and rentals |
231.5 |
219.8 |
|
Installation fees and other (Over time) |
8.3 |
11.7 |
|
Total recognised over time (recurring) |
296.6 |
285.3 |
|
Revenue recognised at a point in time |
|
|
|
Equipment sales |
12.9 |
15.5 |
|
Commissions |
9.6 |
11.0 |
|
Installation fees and other (At a point in time) |
10.9 |
4.8 |
|
Total revenue recognised at a point in time |
33.4 |
31.3 |
|
Total Revenue |
330.0 |
316.6 |
Recurring revenue includes revenue we have a reasonable expectation to recur. This includes committed revenues, including those under rolling terms and subscriptions. Recurring revenue included £13.2m related to PSTN (H1 2025: £14.8m).
4. Exceptional items
|
|
Six months ended 30 June 2026 |
Six months ended 30 June 2025 |
|
|
£m |
£m |
|
Acquisition costs |
- |
5.1 |
|
Listing costs |
- |
2.2 |
|
Total exceptional items |
- |
7.3 |
There were no exceptional items in the period. The exceptional costs incurred in the prior period were acquisition costs related to the Group's acquisition of Starface in February 2025 and costs incurred in relation to its transition from AIM to the Main Market of the London Stock Exchange.
The total cash cost of exceptional items in the six months ended 30 June 2026 was £1.1m, relating to the 2025 restructuring costs (six months ended 30 June 2025: £6.5m).
5. Taxation on profit on ordinary activities
Tax expense is recognised based on management's best estimate of the weighted average effective annual tax rate for the full financial year. The estimated average annual tax rate used for the period to 30 June 2026 is 26%, compared to 26% for the six months ended 30 June 2025.
6. Earnings per share
|
|
Six months ended 30 June 2026 |
Six months ended 30 June 2025 |
|
Earnings per Ordinary Share - basic (pence) |
40.2 |
34.2 |
|
Earnings per Ordinary Share - diluted (pence) |
40.2 |
34.1 |
The calculation of the basic and diluted earnings per share is based on the following data:
|
|
Six months ended 30 June 2026 |
Six months ended 30 June 2025 |
|
|
£m |
£m |
|
Profit attributable to the ordinary equity holders of the Company |
36.7 |
32.4 |
|
|
|
|
|
Shares |
No. |
No. |
|
Basic weighted average number of Ordinary Shares |
91,195,888 |
94,600,378 |
|
Effect of dilution resulting from share options |
151,608 |
325,139 |
|
Diluted weighted average number of Ordinary Shares |
91,347,496 |
94,925,517 |
7. Dividends
A final dividend of 14.8p per share (2025: 13.0p) was paid on 18 June 2026. Following the announcement on 1 September 2026, on the proposed acquisition of the Group, Gamma does not intend to declare or pay any further interim dividends prior to the effective date (H1 2025: 7.4p).
8. Property, plant and equipment
|
|
30 June 2026 |
31 December 2025 |
|
|
||
|
|
£m |
£m |
|
Owned property, plant and equipment |
22.4 |
24.8 |
|
Leased right-of-use assets |
13.8 |
15.2 |
|
Total Property, plant and equipment |
36.2 |
40.0 |
Intangible assets
|
|
Intangible assets acquired through business combinations |
Internally generated development costs |
Purchased technology |
Total |
||||
|
|
Goodwill |
Customer contracts |
Brand |
Acquired technology |
|
|
|
|
|
|
£m |
£m |
£m |
£m |
£m |
£m |
£m |
|
|
Cost |
|
|
|
|
|
|
|
|
|
At 1 January 2026 |
234.6 |
173.7 |
13.1 |
31.2 |
64.2 |
30.5 |
547.3 |
|
|
Additions |
- |
- |
- |
- |
10.1 |
0.3 |
10.4 |
|
|
Disposals |
- |
- |
- |
- |
(0.3) |
- |
(0.3) |
|
|
Exchange difference |
(1.8) |
(1.8) |
(0.1) |
(0.4) |
(0.3) |
- |
(4.4) |
|
|
At 30 June 2026 |
232.8 |
171.9 |
13.0 |
30.8 |
73.7 |
30.8 |
553.0 |
|
|
|
|
|
|
|
|
|
|
|
|
Amortisation and impairment |
|
|
|
|
|
|
|
|
|
At 1 January 2026 |
20.6 |
60.3 |
3.4 |
10.0 |
31.3 |
24.9 |
150.5 |
|
|
Charge for the period |
- |
5.1 |
0.8 |
2.7 |
4.7 |
0.8 |
14.1 |
|
|
Disposals |
- |
- |
- |
- |
(0.3) |
- |
(0.3) |
|
|
Exchange difference |
(0.2) |
(0.6) |
- |
(0.1) |
(0.1) |
- |
(1.0) |
|
|
At 30 June 2026 |
20.4 |
64.8 |
4.2 |
12.6 |
35.6 |
25.7 |
163.3 |
|
|
|
|
|
|
|
|
|
|
|
|
Carrying value |
|
|
|
|
|
|
|
|
|
At 1 January 2026 |
214.0 |
113.4 |
9.7 |
21.2 |
32.9 |
5.6 |
396.8 |
|
|
At 30 June 2026 |
212.4 |
107.1 |
8.8 |
18.2 |
38.1 |
5.1 |
389.7 |
|
|
|
Intangible assets acquired through business combinations |
Internally generated development costs1 |
Purchased technology1 |
Total |
||||
|
|
Goodwill |
Customer contracts |
Brand |
Acquired technology1 |
||||
|
|
£m |
£m |
£m |
£m |
£m |
£m |
£m |
|
|
Cost |
|
|
|
|
|
|
|
|
|
At 1 January 2025 |
135.0 |
78.6 |
5.9 |
14.9 |
58.7 |
29.7 |
322.8 |
|
|
Additions |
- |
- |
- |
- |
8.5 |
- |
8.5 |
|
|
Acquisition of subsidiaries |
91.8 |
88.3 |
6.8 |
13.5 |
1.4 |
- |
201.8 |
|
|
Exchange difference |
4.8 |
4.5 |
0.3 |
0.8 |
0.2 |
- |
10.6 |
|
|
At 30 June 2025 |
231.6 |
171.4 |
13.0 |
29.2 |
68.8 |
29.7 |
543.7 |
|
|
|
|
|
|
|
|
|
|
|
|
Amortisation and impairment |
|
|
|
|
|
|
|
|
|
At 1 January 2025 |
19.8 |
46.3 |
1.8 |
5.0 |
37.2 |
23.4 |
133.5 |
|
|
Charge for the period |
- |
6.6 |
0.8 |
2.2 |
3.8 |
0.8 |
14.2 |
|
|
Exchange difference |
0.5 |
1.3 |
- |
0.1 |
- |
- |
1.9 |
|
|
At 30 June 2025 |
20.3 |
54.2 |
2.6 |
7.3 |
41.0 |
24.2 |
149.6 |
|
|
|
|
|
|
|
|
|
|
|
|
Carrying value |
|
|
|
|
|
|
|
|
|
At 1 January 2025 |
115.2 |
32.3 |
4.1 |
9.9 |
21.5 |
6.3 |
189.3 |
|
|
At 30 June 2025 |
211.3 |
117.2 |
10.4 |
21.9 |
27.8 |
5.5 |
394.1 |
|
1 At the prior year end we revised the presentation of the development costs and technology intangible asset categories to exclude "acquired technology arising from business combinations" and present it separately, with development costs renamed as "internally generated development costs" and technology renamed "purchased technology".
Amortisation of intangible assets is charged to the consolidated statement of profit or loss and included in operating expenses.
9. Financial Instruments
The tables below set out the measurement categories and carrying values of financial assets and liabilities with fair value inputs where relevant.
|
|
Measurement category |
Carrying value 30 June 2026 |
Fair value basis of measurement |
Fair value hierarchy |
Carrying value 31 December 2025 |
|
|
|||||
|
|
|
||||
|
|
|
£m |
|
|
£m |
|
Financial assets |
|
|
|
|
|
|
Non-current |
|
|
|
|
|
|
Contract assets |
Amortised Cost |
12.2 |
|
|
12.7 |
|
Other receivables |
Amortised Cost |
1.2 |
|
|
1.4 |
|
Derivative assets |
Fair value through P&L |
0.1 |
Fair value based on market inputs |
Level 2 |
- |
|
Current |
|
|
|
|
|
|
Cash and cash equivalents |
Amortised Cost |
21.8 |
|
|
23.7 |
|
Trade receivables - net |
Amortised Cost |
51.6 |
|
|
52.0 |
|
Contract assets |
Amortised Cost |
42.1 |
|
|
41.8 |
|
Other receivables |
Amortised Cost |
2.7 |
|
|
3.4 |
|
Derivative assets |
Fair value through P&L |
0.1 |
Fair value based on market inputs |
Level 2 |
- |
|
|
|
131.8 |
|
|
135.0 |
|
Financial Liabilities |
|
|
|
|
|
|
Non-current |
|
|
|
|
|
|
Other payables |
Amortised cost |
1.9 |
|
|
- |
|
Other financial liabilities: |
|
|
|
|
|
|
Borrowings |
Amortised cost |
25.3 |
|
|
32.7 |
|
Lease Liabilities |
Amortised cost |
12.0 |
|
|
12.8 |
|
Derivative liabilities |
Fair value through P&L |
- |
Fair value based on market inputs |
Level 2 |
0.1 |
|
Acquisition-related liabilities: |
|
|
|
|
|
|
Deferred Consideration |
Amortised cost |
8.0 |
|
|
9.6 |
|
Contingent consideration |
Fair value through P&L |
- |
Fair value weighted expected returns methodology |
Level 3 |
4.7 |
|
Put option liability |
Fair value through P&L |
- |
Fair value weighted expected returns methodology |
Level 3 |
1.5 |
|
Current |
|
|
|
|
|
|
Trade and other payables |
Amortised cost |
68.4 |
|
|
66.0 |
|
Share buy back |
Amortised cost |
21.5 |
|
|
- |
|
Other financial liabilities: |
|
|
|
|
|
|
Borrowings |
Amortised cost |
0.3 |
|
|
0.3 |
|
Lease liabilities |
Amortised cost |
4.4 |
|
|
4.8 |
|
Derivative liabilities |
Fair value through P&L |
- |
Fair value based on market inputs |
Level 2 |
0.1 |
|
Acquisition-related liabilities: |
|
|
|
|
|
|
Deferred Consideration |
Amortised cost |
4.2 |
|
|
4.0 |
|
Contingent consideration |
Fair value through P&L |
4.2 |
Fair value weighted expected returns methodology |
Level 3 |
3.2 |
|
Put option liability |
Fair value through P&L |
1.6 |
Fair value weighted expected returns methodology |
Level 3 |
- |
|
|
|
151.8 |
|
|
139.8 |
The carrying value of trade and other receivables, contract assets, cash and cash equivalents, and trade and other payables is considered to be approximately equal to their fair value.
The fair value of borrowings is not materially different from its carrying amount, due to the floating interest rate, linked to SONIA, aligning with the current market level.
Derivative assets and liabilities relate to foreign currency forwards. At 30 June 2026 derivative assets have a nominal value of $18.0m (£13.3m) (31 December 2025: $18.3m (£13.6m)), measured at fair value which are classed as level 2 in the fair value measurement hierarchy.
Share buyback represents the remaining purchase liability. As the Group was in a close period at 30 June 2026 in connection with the review of its ownership structure, the full remaining commitment under the programme was deemed uncancellable and so is recognised as a liability.
Borrowings
Borrowings consist of our Revolving Credit Facility ("RCF") of which £Nil is current (31 December 2025: £Nil) and £25.5m is non-current (31 December 2025: £33.0m). None of the RCF (31 December 2025: £Nil) is secured on the Group's land and buildings.
The £130m multicurrency RCF matures in January 2028 and includes a one-year extension option to January 2029, exercisable in November 2026.
The RCF is stated net of unamortised transaction costs of £0.2m (31 December 2025: £0.3m) and interest payable of £0.3m (31 December 2025: £0.3m). The deferred transaction costs have been capitalised and are being amortised over the expected life of the facility. The accrued interest is current, which is payable within 3 months.
The RCF incurs interest on drawn balances at a margin between 1.5% and 2.25% above SONIA, dependant on leverage, and between 0.5% and 0.8% on undrawn balances.
Loan covenants
The following covenants relate to the RCF, and are tested on a 12-month rolling basis:
- Leverage, defined as total net debt to EBITDA, not to exceed 3.0x; and
- Interest cover, defined as EBITDA to net finance charges, not to be less than 4.0x.
The Group remained in compliance with all facility covenants and had sufficient covenant headroom throughout the going concern assessment period.
Acquisition-related liabilities
Deferred consideration (amortised cost)
|
|
30 June 2026 |
31 December 2025 |
|
|
£m |
£m |
|
Current |
4.2 |
4.0 |
|
Non-current |
8.0 |
9.6 |
|
|
12.2 |
13.6 |
Deferred consideration relates to fixed amounts payable with regard to acquisitions. The reconciliation of the carrying amounts is as follows:
|
|
Placetel |
Other |
Total |
|
|
£m |
£m |
£m |
|
At 1 January 2026 |
13.1 |
0.5 |
13.6 |
|
Deferred consideration settled |
(1.9) |
- |
(1.9) |
|
Unwinding of discount |
0.4 |
- |
0.4 |
|
Foreign exchange movements |
0.1 |
- |
0.1 |
|
At 30 June 2026 |
11.7 |
0.5 |
12.2 |
Contingent consideration (Level 3)
|
|
30 June 2026 |
31 December 2025 |
|
|
£m |
£m |
|
Current |
4.2 |
3.2 |
|
Non-current |
- |
4.7 |
|
|
4.2 |
7.9 |
The reconciliation of the carrying amounts of contingent consideration is as follows:
|
|
Pragma |
Other |
Total |
|
|
£m |
£m |
£m |
|
At 1 January 2026 |
6.4 |
1.5 |
7.9 |
|
Contingent consideration settled |
(1.9) |
(0.5) |
(2.4) |
|
Change in fair value of contingent consideration: |
|
|
|
|
Other change in fair value |
(1.3) |
- |
(1.3) |
|
At 30 June 2026 |
3.2 |
1.0 |
4.2 |
The contingent consideration for Pragma was part settled in the period with £1.9m paid. The remaining portion is based on EBITDA performance for the financial year ending 31 December 2026, with a £0.3m fixed payment due in 2027. Consideration of up to £7.4m may be payable. The fair value of £3.2m at 30 June 2026, which takes into account the weighted probability of payout, is based on a payout of £3.2m, including the fixed amount of £0.3m, (31 December 2025: £6.4m) all of which is current. A decrease of £1.3m was required, which has been recorded within operating expenses.
Other contingent consideration relates to other historic acquisitions which is current and is based on a payout of £1.0m which is the maximum amount payable. Amounts due of £0.5m in relation to Allnet and Vio:networks (acquired by Starface prior to its acquisition by the Group) were settled in the period.
The changes in fair value of contingent consideration have resulted in a £1.3m net gain within operating expenses in H1 2026 (H1 2025: £1.5m net gain).
Put option liability (level 3)
|
|
30 June 2026 |
31 December 2025 |
|
|
£m |
£m |
|
Current |
1.6 |
- |
|
Non-current |
- |
1.5 |
|
|
1.6 |
1.5 |
The put option liability is an option for the previous owners to sell, or for the Group to acquire, the remaining 5% of the shares in Pragma. At 30 June 2026, the fair value of put option liabilities amounted to £1.6m (31 December 2025: £1.5m) with the £0.1m movement arising from the unwinding of the discount. The fair value of £1.6m at 30 June 2026 is based on a payout of £1.8m (31 December 2025: £1.8m) which takes into account the weighted probability of payout. The potential undiscounted amount of future payments that could be required under the put option liability range from £0.5m to £2.9m (31 December 2025: £Nil to £2.9m).
Financial instruments measured at fair value
Financial (assets)/ liabilities measured at fair value are remeasured at each reporting date and their values are illustrated in the table below:
|
|
30 June 2026 |
31 December 2025 |
|
|
£m |
£m |
|
Level 2 |
|
|
|
Forward exchange contracts |
(0.2) |
0.2 |
|
Level 3 |
|
|
|
Contingent consideration |
4.2 |
7.9 |
|
Put option liability |
1.6 |
1.5 |
|
Total |
5.6 |
9.6 |
The Group held mark to market forward exchange contracts with a nominal value of $18.0m (£13.3m) at 30 June 2026 (31 December 2025: $18.3m (£13.6m)), to limit potential foreign exchange exposure that could arise on the Group's USD commitments, including up to the next two year's Placetel deferred consideration payments which are denominated in USD.
The Group performs valuations of financial items for financial reporting purposes and in consultation with third-party valuation specialists for complex valuations. Valuation techniques are selected based on the characteristics of each instrument, with the overall objective of maximising the use of market-based information.
10. Share capital
|
1 January 2026 |
Number |
£m |
|
Ordinary Shares of £0.0025 each |
93,764,351 |
0.2 |
|
|
|
|
|
Movement |
|
|
|
January* |
(273,254) |
|
|
February* |
(415,833) |
|
|
March* |
(459,052) |
|
|
April* |
(334,203) |
|
|
May* |
(395,757) |
|
|
June* |
(534,102) |
|
|
30 June 2026 |
|
|
|
Ordinary Shares of £0.0025 each |
91,352,150 |
0.2 |
|
|
||
* Ordinary shares purchased and cancelled under the share buyback programme.
In the period ended 30 June 2026, 2,412,201 Ordinary Shares of 0.25 pence each were acquired by the Company and cancelled (H1 2025: 3,725,038 Ordinary Shares of 0.25 pence each were acquired by the Company and held in treasury). 68,185 (H1 2025: 57,527) were transferred from treasury to settle exercised share options.
At 30 June 2026 1,524,392 shares were held in treasury (30 June 2025: 1,666,123), representing 1.7% (30 June 2025: 1.8%) of issued share capital. The shares held in treasury do not have voting rights. The number of Ordinary Shares with voting rights was 89,827,758 (30 June 2025: 92,098,228), therefore the total issued share capital at 30 June 2026 was 91,352,150 Ordinary Shares (30 June 2025: 93,764,351 Ordinary Shares).
11. Other reserves
|
|
Merger reserve |
Share option reserve |
Foreign exchange reserve |
Share reserve |
Total other reserves |
|
|
|
||||
|
|
£m |
£m |
£m |
£m |
£m |
|
At 1 January 2025 |
2.3 |
7.4 |
(3.2) |
(24.7) |
(18.2) |
|
Issue or reissue of shares |
- |
(0.7) |
- |
- |
(0.7) |
|
Share-based payment expense |
- |
1.6 |
- |
- |
1.6 |
|
Treasury share allocations1 |
- |
- |
- |
0.8 |
0.8 |
|
Other comprehensive income |
- |
- |
6.1 |
- |
6.1 |
|
At 30 June 2025 |
2.3 |
8.3 |
2.9 |
(23.9) |
(10.4) |
|
|
|
|
|
|
|
|
At 1 January 2026 |
2.3 |
8.4 |
5.8 |
(22.8) |
(6.3) |
|
Issue or reissue of shares |
- |
(1.2) |
- |
- |
(1.2) |
|
Share-based payment expense |
- |
1.0 |
- |
- |
1.0 |
|
Treasury share allocations1 |
- |
- |
- |
1.0 |
1.0 |
|
Other comprehensive expense |
- |
- |
(2.2) |
- |
(2.2) |
|
At 30 June 2026 |
2.3 |
8.2 |
3.6 |
(21.8) |
(7.7) |
1 Treasury share allocations are treasury shares which have been used to satisfy share options and other employee share plans.
12. Events after the reporting date
Share buyback
Since 30 June, a further 703,820 Ordinary Shares have been acquired and cancelled taking the total value to £28.1m over the course of the buyback to 4 September 2026, out of the announced 2026 programme of up to £42.5m. The share buyback programme is currently suspended, as the current share price is not within certain pre-set parameters agreed with Investec Bank plc, which was appointed to manage the share buyback programme.
Recommended cash offer by Epiris (Bradbury Bidco Ltd)
On 1 September, a recommended cash offer from Epiris (Bradbury Bidco Ltd) for the entire issued and to be issued ordinary share capital of Gamma was announced. As set out in the announcement the acquisition is subject to conditions, including the receipt of certain regulatory approvals and shareholder approval.
There are costs associated with the proposed transaction including professional adviser fees, for which the Group would be liable. Most are contingent on the successful completion of the transaction. We have not been able to estimate the potential cost as these are dependent on the agreement of the acquirer.
Finally, the RCF has a change of control clause which allows the lenders to request repayment of the outstanding balance upon a change of control.
Alternative Performance Measures (APMs)
The Group uses certain non-GAAP measures, called APMs, to measure financial performance, financial position or cash flow. The Group's APMs may not be calculated in the same way as similarly titled measures reported by other companies. They should not be considered in isolation or as a substitute for analysis of the Group's results reported under IFRS.
The APMs used in this report are listed below and defined in this section.
|
Alternative performance measure |
Closest IFRS measure |
Reconciled, presented or defined |
|
Performance metrics |
|
|
|
Adjusted EBITDA |
Profit before tax |
Note 3 |
|
Adjusted profit from operations |
Profit from operations |
Performance metrics |
|
Adjusted profit before tax ("Adjusted PBT") |
Profit before tax |
Performance metrics |
|
Adjusted earnings per share ("Adjusted EPS") |
Earnings per share |
Performance metrics |
|
Return on capital employed ("ROCE") |
N/A |
Performance metrics |
|
Organic growth |
N/A |
Performance metrics |
|
Cash flow metrics |
|
|
|
Net debt |
Borrowings less cash and cash equivalents |
Cash flow metrics |
|
Adjusted cash generated by operations |
Cash generated by operations |
Cash flow metrics |
|
Adjusted Cash conversion |
N/A |
Cash flow metrics |
|
Adjusted free cash flow |
Net cash flows from operating activities |
Cash flow metrics |
APMs are calculated and prepared on a consistent basis with the year ended 31 December 2025.
All APMs which have the prefix 'Adjusted' exclude the impact of exceptional items (by virtue of their size, nature or incidence) and other adjusting items, to show the Group's core performance. Any additional adjustments are described in the relevant sections below. The Group has no exceptional or other adjusting items in the period, other than the cash flow impact of items from 2025.
Performance metrics
We use 'adjusted' measures including adjusted EBITDA to assess the profitability and performance of our business. These are not measures of performance under IFRS but provide supplemental data that helps convey an understanding of the Group's financial performance when read together with the statutory results.
Adjusted PBT
Adjusted PBT is profit before tax adjusted for exceptional items and other adjusting items, the amortisation of intangibles arising due to business combinations and the unwinding of discounting on acquisition-related liabilities. These additional items are individually material items and/or are not considered to be representative of the trading performance of the Group. Adjusted PBT is the primary profit measure used internally to reward employees.
|
|
Six months ended 30 June 2026 |
Six months ended 30 June 2025 |
|
|
£m |
£m |
|
Profit before tax |
50.1 |
43.5 |
|
Amortisation of intangibles arising due to business combinations |
8.6 |
9.6 |
|
Unwinding of discounting on acquisition-related liabilities |
0.5 |
1.2 |
|
Exceptional items |
- |
7.3 |
|
Other adjusting items |
- |
(0.6) |
|
Adjusting items |
9.1 |
17.5 |
|
Adjusted profit before tax |
59.2 |
61.0 |
Adjusted EPS (fully diluted)
Adjusted EPS (fully diluted) is defined as Diluted EPS where the profit after tax attributable to ordinary shareholders is adjusted for the same items as Adjusted PBT, described above, and the tax on all of these items.
|
|
Six months ended 30 June 2026 |
Six months ended 30 June 2025 |
|
Earnings per Ordinary Share - diluted (pence) |
40.2 |
34.1 |
|
Adjusted earnings per Ordinary Share - diluted (pence) |
47.7 |
47.9 |
|
|
Six months ended 30 June 2026 |
Six months ended 30 June 2025 |
|
|
£m |
£m |
|
Profit after tax attributable to the ordinary equity holders of the Company |
36.7 |
32.4 |
|
Adjusting items: |
|
|
|
Amortisation of intangibles arising due to business combinations |
8.6 |
9.6 |
|
Unwinding of discounting on acquisition-related liabilities |
0.5 |
1.2 |
|
Exceptional items |
- |
7.3 |
|
Other adjusting items |
- |
(0.6) |
|
Patent box |
- |
(1.9) |
|
Adjusting items |
9.1 |
15.6 |
|
Tax relating to adjusting items |
(2.2) |
(2.5) |
|
Adjusted profit after tax attributable to the ordinary equity holders |
43.6 |
45.5 |
|
|
H1 2026 |
H1 2025 |
|
|
No: |
No: |
|
Diluted weighted average number of Ordinary Shares |
91,347,496 |
94,925,517 |
Return on capital employed ("ROCE")
ROCE is presented as it measures the efficiency of the Group's profit generation from capital deployed. It is defined as profit from operations for the 12 months ended at the reporting date before exceptional items, other adjusting items and amortisation arising from business combinations, divided by Capital employed at the reporting date. Capital employed is defined as net debt plus lease liabilities (excluding leases in a finance sub-lease), acquisition-related liabilities and equity.
|
|
Twelve months ended 30 June 2026 |
Twelve months ended 31 December 2025 |
|
|
£m |
£m |
|
Net debt |
3.8 |
9.3 |
|
Lease liabilities |
14.7 |
15.7 |
|
Acquisition-related liabilities |
18.0 |
23.0 |
|
Equity |
364.6 |
385.0 |
|
Capital employed |
401.1 |
433.0 |
|
|
|
|
|
Profit before tax |
94.3 |
87.7 |
|
Finance income |
(1.2) |
(2.9) |
|
Finance expense |
5.4 |
6.1 |
|
Profit from operations |
98.5 |
90.9 |
|
Exceptional items |
3.3 |
10.6 |
|
Other adjusting items |
0.8 |
0.2 |
|
Amortisation of intangibles arising due to business combinations |
17.6 |
18.6 |
|
Adjusted profit from operations |
120.2 |
120.3 |
|
|
|
|
|
ROCE |
30.0% |
27.8% |
2025 includes Starface from acquisition (19 February 2025) to 31 December 2025. The twelve months ended 30 June 2026 includes a full 12 months of Starface. The additional contribution from Starface increased ROCE by 0.7%.
Equity at 30 June 2026 includes a deduction for the recognition of the liability of £21.5m for the incomplete portion of the 2026 share buyback programme which increases ROCE by 1.6%.
Organic growth
Organic growth is presented as management believes it is important to understand performance on a comparable basis. It is defined as growth excluding the contribution of material acquisitions for the first 12 months of ownership ("Inorganic growth") and excluding the impact of material disposals for the last 12 months of ownership ("disposals"), and the impact of foreign exchange movements on the consolidation of our international operations (calculated by taking the current period local currency results translated into Pounds Sterling at the preceding period's foreign exchange rate (1.195:1 Euros to Pound Sterling) and defined as "constant currency"). It is used for internal performance analysis as it aids comparison of the current period to prior period without being affected by factors which were not present in both periods. It is calculated at an operating segment level and Group level for revenue and gross profit. It is also calculated for Adjusted EBITDA at a Group level.
Current period
|
|
Six months |
Components of growth |
Total reported growth |
Six months |
||||||
|
Organic growth |
Inorganic growth |
Constant currency |
||||||||
|
Revenue |
£m |
£m |
% |
£m |
% |
£m |
% |
£m |
% |
£m |
|
Germany SME |
49.1 |
2.5 |
5% |
5.6 |
11% |
2.0 |
4% |
10.1 |
21% |
59.2 |
|
UK SME |
141.0 |
0.7 |
0% |
- |
- |
- |
- |
0.7 |
0% |
141.7 |
|
Service Provider |
45.0 |
3.2 |
7% |
- |
- |
- |
- |
3.2 |
7% |
48.2 |
|
Enterprise |
66.5 |
(1.0) |
(2%) |
- |
- |
- |
- |
(1.0) |
(2%) |
65.5 |
|
Other Europe SME |
15.0 |
(0.1) |
(1%) |
- |
- |
0.5 |
3% |
0.4 |
3% |
15.4 |
|
Group Revenue |
316.6 |
5.3 |
2% |
5.6 |
2% |
2.5 |
1% |
13.4 |
4% |
330.0 |
Prior period
|
|
Six months |
Components of growth |
Total reported growth |
Six months |
||||||
|
Organic growth |
Inorganic growth |
Constant currency |
||||||||
|
Revenue |
£m |
£m |
% |
£m |
% |
£m |
% |
£m |
% |
£m |
|
Germany SME |
21.8 |
- |
- |
28.4 |
130% |
(1.1) |
(5%) |
27.3 |
125% |
49.1 |
|
UK SME* |
137.9 |
3.1 |
2% |
- |
- |
- |
- |
3.1 |
2% |
141.0 |
|
Service Provider* |
46.2 |
(1.6) |
(3%) |
0.4 |
1% |
- |
- |
(1.2) |
(3%) |
45.0 |
|
Enterprise |
61.0 |
1.9 |
3% |
3.6 |
6% |
- |
- |
5.5 |
9% |
66.5 |
|
Other Europe SME |
15.6 |
(0.3) |
(2%) |
- |
- |
(0.3) |
(2%) |
(0.6) |
(4%) |
15.0 |
|
Group Revenue |
282.5 |
3.1 |
1% |
32.4 |
11% |
(1.4) |
0% |
34.1 |
12% |
316.6 |
* In 2025 a single Gamma Business segment was presented. To align with management reporting this has been split into two segments: UK SME and Service Provider, for further details see note 3 segment information.
Current period
|
|
Six months |
Components of growth |
Total reported growth |
Six months |
||||||
|
Organic growth |
Inorganic growth |
Constant currency |
||||||||
|
Gross profit |
£m |
£m |
% |
£m |
% |
£m |
% |
£m |
% |
£m |
|
Germany SME |
34.4 |
3.8 |
11% |
5.1 |
15% |
1.5 |
4% |
10.4 |
30% |
44.8 |
|
UK SME |
74.3 |
(5.0) |
(7%) |
- |
- |
- |
- |
(5.0) |
(7%) |
69.3 |
|
Service Provider |
21.7 |
1.4 |
6% |
- |
- |
- |
- |
1.4 |
6% |
23.1 |
|
Enterprise |
32.3 |
(0.8) |
(2%) |
- |
- |
- |
- |
(0.8) |
(2%) |
31.5 |
|
Other Europe SME |
9.3 |
(0.2) |
(2%) |
- |
- |
0.3 |
3% |
0.1 |
1% |
9.4 |
|
Group gross profit |
172.0 |
(0.8) |
0% |
5.1 |
3% |
1.8 |
1% |
6.1 |
4% |
178.1 |
Prior period
|
|
Six months |
Components of growth |
Total reported growth |
Six months |
|
||||||
|
Organic growth |
Inorganic growth |
Constant currency |
|
||||||||
|
Gross profit |
£m |
£m |
% |
£m |
% |
£m |
% |
£m |
% |
£m |
|
|
Germany SME |
9.8 |
0.4 |
4% |
24.9 |
254% |
(0.7) |
(7%) |
24.6 |
251% |
34.4 |
|
|
UK SME* |
73.7 |
0.6 |
1% |
- |
- |
- |
- |
0.6 |
1% |
74.3 |
|
|
Service Provider* |
21.8 |
(0.3) |
(1%) |
0.2 |
1% |
- |
- |
(0.1) |
(0%) |
21.7 |
|
|
Enterprise* |
30.5 |
(0.2) |
(1%) |
2.0 |
7% |
- |
- |
1.8 |
6% |
32.3 |
|
|
Other Europe SME |
10.0 |
(0.5) |
(5%) |
- |
- |
(0.2) |
(2%) |
(0.7) |
(7%) |
9.3 |
|
|
Group gross profit |
145.8 |
- |
0% |
27.1 |
19% |
(0.9) |
(1%) |
26.2 |
18% |
172.0 |
|
* In 2025 a single Gamma Business segment was presented. To align with management reporting this has been split into two segments: UK SME and Service Provider. In addition, certain costs have been reallocated across segments, for further details see note 3 segment information.
Current period
|
|
Six months |
Components of growth |
Total reported growth |
Six months |
||||||
|
Organic growth |
Inorganic growth |
Constant currency |
||||||||
|
|
£m |
£m |
% |
£m |
% |
£m |
% |
£m |
% |
£m |
|
Group Adjusted EBITDA |
70.9 |
(0.8) |
(1%) |
2.0 |
3% |
0.4 |
1% |
1.6 |
2% |
72.5 |
Prior period
|
|
Six months |
Components of growth |
Total reported growth |
Six months |
||||||
|
Organic growth |
Inorganic growth |
Constant currency |
||||||||
|
|
£m |
£m |
% |
£m |
% |
£m |
% |
£m |
% |
£m |
|
Group Adjusted EBITDA |
62.2 |
2.0 |
3% |
6.9 |
11% |
(0.2) |
(0%) |
8.7 |
14% |
70.9 |
Cash flow metrics
Net debt
Net debt is presented as it is an important liquidity measure used by management and the Board. Net debt is defined as borrowings less cash and cash equivalents. IFRS 16 lease liabilities and contingent consideration are not considered as debt for the purpose of quoting Net debt.
|
|
30 June 2026 |
31 December 2025 |
|
|
£m |
£m |
|
Cash and cash equivalents |
21.8 |
23.7 |
|
Borrowings |
(25.6) |
(33.0) |
|
Net debt |
(3.8) |
(9.3) |
The following table is a reconciliation of the movements in Net (debt)/ cash from previously reported periods:
|
|
Cash and Cash equivalents |
Borrowings |
Net (debt)/ cash |
|
|
|
||
|
|
£m |
£m |
£m |
|
At 1 January 2026 |
23.7 |
(33.0) |
(9.3) |
|
Drawdown of borrowings |
10.5 |
(10.5) |
- |
|
Repayment of borrowings |
(18.0) |
18.0 |
- |
|
Interest paid |
(1.1) |
1.1 |
- |
|
Interest costs |
- |
(1.1) |
(1.1) |
|
Amortisation of deferred finance fees |
- |
(0.1) |
(0.1) |
|
Other non-borrowing related movements in cash and cash equivalents |
6.8 |
- |
6.8 |
|
Net movement before the effect of foreign exchange rate changes |
(1.8) 1 |
7.4 |
5.6 |
|
Effects of foreign exchange rate changes |
(0.1) |
- |
(0.1) |
|
At 30 June 2026 |
21.8 |
(25.6) |
(3.8) |
1 Net decrease in cash and cash equivalents per the Consolidated statement of cash flows.
Adjusted cash conversion
Adjusted cash conversion is presented as management believes it is important to understand the Group's conversion of Adjusted EBITDA to cash. The Group's Adjusted cash conversion is defined as cash generated by operations excluding the cash impact of exceptional items, other adjusting items and, in the prior period, non-recurring acquisition-related timing differences, divided by Adjusted EBITDA, so as to exclude the impact of significant or one-off transactions outside the normal course of trading. There were no acquisition-related timing differences in H1 2026.
Adjusted cash conversion is used to track and measure timing differences between profitability and cash generation through working capital management, including seasonality or one-offs.
|
|
Six months ended 30 June 2026 |
Six months ended 30 June 2025 |
|
|
£m |
£m |
|
Cash generated by operations |
69.2 |
53.1 |
|
Cash impact of exceptional items |
1.1 |
6.5 |
|
Cash impact of other adjusting items |
- |
0.8 |
|
Acquisition related timing difference |
- |
3.3 |
|
Adjusted cash generated by operations |
70.3 |
63.7 |
|
Adjusted EBITDA |
72.5 |
70.9 |
|
Adjusted cash conversion |
97% |
90% |
Adjusted free cash flow
Adjusted free cash flow is presented as management believes it important to understand the Group's ability to fund its development, selective M&A or returns to shareholders from its trading cash flows. Adjusted free cash flow is defined as Adjusted cash generated by operations less taxes paid and the purchases of property, plant and equipment and intangible assets.
|
|
Six months ended 30 June 2026 |
Six months ended 30 June 2025 |
|
|
£m |
£m |
|
Adjusted cash generated by operations |
70.3 |
63.7 |
|
Taxes paid |
(9.8) |
(13.7) |
|
Purchases of property, plant and equipment |
(1.5) |
(1.1) |
|
Purchases of intangible assets |
(10.4) |
(8.5) |
|
Adjusted free cash flow |
48.6 |
40.4 |
RNS may use your IP address to confirm compliance with the terms and conditions, to analyse how you engage with the information contained in this communication, and to share such analysis on an anonymised basis with others as part of our commercial services. For further information about how RNS and the London Stock Exchange use the personal data you provide us, please see our Privacy Policy.

Latest directors dealings
- 1 hour ago FRP Advisory Group
- 1 hour ago Close Brothers Group
- 2 hours ago Barclays
- 2 hours ago PZ Cussons
- 2 hours ago Senior