Preliminary Results
Summary by AI BETAClose X
Fresnillo plc
Financial results for the year ended 31 December 2025
Fresnillo plc today announced its financial results for the full year ended 31 December 2025.
Octavio Alvídrez, CEO said:
"I am pleased to report a record financial performance in 2025, as Fresnillo continued to benefit from a high precious metals price environment, combined with our ongoing focus on operational consistency. These results demonstrate our ability to leverage our high-quality asset base while managing costs carefully to expand margins, resulting in significant cash generation and returns to our shareholders. I would like to thank our teams for their focus and execution throughout the period.
"We are today reporting a 27.6% increase in Adjusted Revenues to US$4.6 billion and an 80.7% rise in EBITDA to US$2.8 billion. In line with this robust performance, we are proposing a final ordinary dividend above the traditional policy of paying 50% of the adjusted profit, bringing total shareholder distributions for 2025 to US$950.0 million, or 128.92 US cents per share, our highest to date as a listed company.
"Operationally, silver production was in line with guidance and gold production exceeded expectations. We continued to implement structural improvements across our mines to support future production and effectively manage the cost base, while also laying the foundations for future growth by advancing our exploration projects and enhancing our pipeline through the announcement of the acquisition of Probe Gold.
"Looking ahead, we remain committed to responsible growth, with the safety of our people as our top priority. We will continue to monitor and manage costs, while advancing our exploration pipeline to support long-term value creation. Our financial position remains solid, with a net cash position of US$1,916.6 million, enabling us to invest in future growth while maintaining attractive returns to shareholders."
Financial Highlights - 12 months to 31 December 2025
|
$ million unless stated |
2025 |
2024 |
% change |
|
Silver Production1 (kOz) |
48,723 |
56,307 |
(13.5) |
|
Gold Production (Oz) |
600,287 |
631,573 |
(5.0) |
|
Total Revenue |
4,561.2 |
3,496.4 |
30.5 |
|
Adjusted Revenue2 |
4,645.3 |
3,639.9 |
27.6 |
|
Gross Profit |
2,664.1 |
1,246.3 |
113.8 |
|
EBITDA3 |
2,796.2 |
1,547.3 |
80.7 |
|
Profit Before Income Tax |
2,082.0 |
743.9 |
179.9 |
|
Profit for the year |
1,573.8 |
226.7 |
594.3 |
|
Basic and Diluted EPS excluding post-tax Silverstream effects (USD)4
|
2.058 |
0.364 |
465.4 |
|
|
|
|
|
1 Fresnillo attributable production, plus ounces registered in production through the Silverstream Contract.
2 Adjusted Revenue is revenue as disclosed in the income statement adjusted to exclude treatment and refining charges.
3 Earnings before interest, taxes, depreciation and amortisation (EBITDA) is calculated as gross profit plus depreciation less administrative, selling and exploration expenses. The reconciliation of EBITDA to amounts determined in accordance with IFRS can be found in the Financial Review.
4. The weighted average number of ordinary shares was 736,893,589 for 2025 and 2024 See note 18 in the consolidated financial statements.
2025 Highlights
Significantly increased profit margins and strong financial position underpinned by higher precious metal prices, operational discipline, and a continued focus on costs.
· Adjusted revenue of US$4,645.3 million, up 27.6% vs 2024 primarily due to the higher precious metals prices, mitigated by the lower volumes of all metals sold.
· Revenue of US$4,561.2 million, up 30.5% vs 2024 driven by the increase in adjusted revenue and lower treatment and refining charges.
· Adjusted production costs1 of US$1,406.7 million, down 11.1% vs 2024 primarily driven by the lower volumes processed at Herradura, Fresnillo, Ciénega and Saucito; the favourable effect of the devaluation of the average Mexican peso vs. US dollar exchange rate; the cessation of mining activities at San Julián DOB; and net efficiencies achieved, principally at Herradura.
· Gross profit of US$2,664.1 million, up 113.8%; EBITDA2 of US$2,796.2 million, up 80.7%.
· Exploration expenses of US$173.5 million, up 6.4%.
· Profit from continuing operations of US$2,292.5 million, up 142.4%. as a result of higher gross profit.
· Non-cash Silverstream loss, net of taxes, of US$132.4 million following the decision to end the Silverstream Contract in light of operational and financial difficulties impacting the long-term viability of the Sabinas mine.
· Income tax expense of US$315.0 million down 19.3% vs 2024, primarily as a result of the 11.4% revaluation of the spot Mexican peso vs. US dollar exchange rate on the tax value of assets and liabilities, the special mining rights deductible for corporate income tax.
· Mining rights of US$193.2 million, up 52.1% vs. 2024 due to the increase in the profit base used in the calculation along with the increase in the mining rights from 7.5% to 8.5% in 2025.
· Profit for the year attributable to equity shareholders of the Group of US$1,384.0 million vs US$140.9 million in 2024.
· US$2,756.5 million in cash and other liquid funds as of 31 December 2025. Net cash position of US$1,916.6 million as of 31 December 2025, compared with US$458.3 million as of 31 December 2024.
1 Adjusted production costs are calculated as cost of sales less depreciation, profit sharing, change in inventories and unproductive costs. The Company considers this a useful additional measure to help understand underlying factors driving production costs in terms of the different stages involved in the mining and plant processes, including efficiencies and inefficiencies as the case may be and other factors outside the Company's control such as cost inflation or changes in accounting criteria.
2 Earnings before interest, taxes, depreciation and amortisation (EBITDA) is calculated as profit for the year from continuing operations before income tax, less finance income, plus finance costs, less foreign exchange gain/(loss), less revaluation effects of the Silverstream contract and other operating income plus other operating expenses and depreciation.
Total 2025 dividend payment of US$950 million, or 128.92 US cents per share
· Total ordinary dividend for the year amounting to US$950.0 million, or 128.92 US cents per share, comprised of:
- The 2025 interim ordinary dividend of US$153.3 million, or 20.8 US cents per share, which was paid in September 2025, and
- The 2025 final ordinary dividend of 108.12 US cents per share, totalling US$796.7million.
· This is above the Group's traditional dividend policy to pay out 50% of the profit attributable to equity shareholders of the company after making certain customary adjustments to exclude extraordinary non-cash effects in the income statement, and was permitted by strong cash generation throughout the year, which resulted in a high cash balance at year end. The company continues to maintain a healthy cash balance to invest in growth focused projects, along with an additional buffer for any M&A opportunities that may present themselves in the future. The dividend policy remains unchanged.
Consistent operating performance with silver in line and gold ahead of guidance
· Full year attributable silver production of 48.7 moz in line with guidance (including Silverstream) decreased 13.5% vs. 2024, mainly due to the cessation of mining activities at San Julián DOB, the lower ore grade, decrease in volume of ore processed, and lower recovery rate at Ciénega, and the lower contribution from the Silverstream.
· Full year attributable gold production of 600.3 koz exceeded guidance, down 5.0% vs. 2024 primarily due to the lower ore grades and decreased volumes of ore processed at Saucito, Fresnillo and Herradura, and the lower contribution from Noche Buena.
· Full year attributable by-product lead and zinc production decreased vs. 2024, mainly due to: i) the lower ore grade and decreased volumes of ore processed at Fresnillo; ii) the cessation of mining activities at San Julián DOB; and iii) the discontinuation of zinc production at Ciénega from August 2025 onwards.
Continued focus on operational optimisation and efficiency-enhancing projects
· Significant efficiencies and cost reductions achieved at Herradura, and to a lesser extent at Ciénega, partly offset by an increase in cost at the Fresnillo district. The net operating efficiencies achieved in 2025 totalled US$13.8 million.
· Operational optimisation initiatives continued to progress at Fresnillo, including dilution control, improved mine planning and contractor rationalisation, with early benefits achieved. However, higher maintenance costs due to lower equipment availability, and increased consumption of explosives and milling balls more than offset the positive impact.
· Construction of supporting infrastructure and equipment placement at the Jarillas shaft in Saucito continued during the year. The shaft connection was deferred to 2026 to minimise disruption, it remains on track to be completed by 2027.
· Implementation of the San Julián optimisation plan, including cost-containment measures, continued.
· Efficient cost control, optimised drilling patterns, and improved mine cycles delivered a good performance at Herradura.
· Construction of the Carbon in Column facility continued with full operational capacity expected to be achieved in 2Q26, while the analysis for a new sulphide crushing circuit was completed, and detailed engineering for this facility and the Adsorption, Desorption and Recovery (ADR) plant is now underway.
Laying the foundations for future growth through our commitment to exploration and a disciplined approach to evaluate M&A opportunities
· Silver resources decreased 8.5% vs 2024 to 2.06bn oz, primarily driven by the implementation of the Reasonable Prospects for Eventual Economic Extraction (RPEEE) principle, in line with industry best practice, to classify mineral resources based on their expected future economic extraction.
· Gold resources increased 14.3% vs 2024 to 44.0 moz, primarily driven by the favourable impact of the higher price of gold at Herradura and the Lucerito exploration project.
· Proven reserves were reported at all mines.
· Silver reserves increased 9.4% to 362.6 million ounces, mainly due to higher metals prices and a lower cut-off grade together with the addition of ounces through the infill campaign, primarily at the Fresnillo district.
· Gold reserves increased 7.4% to 7.8 million ounces vs 2024, as a result of the higher gold price, principally at Herradura.
· Positive drilling results and higher gold prices increased mineral resources to 2.3 million ounces of gold at Rodeo. Ongoing drilling and metallurgical testwork continue to deliver a Preliminary Economic Assessment in 2H26.
· Several opportunities identified to optimise capex and operating costs at Orisyvo.
· An intensive core drilling programme was completed at Guanajuato, while land acquisition, and mine development and mineral processing evaluations continued. Total resources at our Guanajuato project amount to approximately three million ounces of gold, and 388 million ounces of silver.
· Acquisition of Probe Gold was successfully completed in 1Q26, providing immediate access to the prolific Val d'Or district in Quebec, with established infrastructure and a skilled workforce, and adding 10 million gold ounces to our resource base.
Safety remains our top priority as we further enhance the sustainability of our operations
· Improved TRIFR from 7.59 to 6.26 and decreased Fatality Frequency Rate to 0.046. However, the two fatalities recorded during the year underscore that further improvements are required.
· Consumed 77.8% of electricity from renewable sources (2024: 80.6%).
· Generated a positive economic impact[1] of US$2,173.8 million in 2025.
2026 outlook and longer term prospects
· Attributable silver production expected to be in the range of 42.0 to 46.5 moz.
· Attributable gold production expected to be in the range of 500 to 550 koz.
· Expressed in silver equivalent ounces2, production is expected to be 82-91 million ounces.
· Capex for 2026 is anticipated to be approximately US$765 million and will continue to be primarily focused on mining works, sustaining capex, optimisation projects at Herradura, the deepening of the Jarillas shaft at Saucito, a haulage conveyor at Juanicipio, and tailings dams.
· Exploration expenses are expected to be c.US$260 million, supporting intensified drilling at our operating mines, continued de-risking our advance exploration projects, and starting drilling at Probe Gold.
· Continue to monitor costs closely and capture further efficiencies where possible.
· Continue working towards reducing our TRIFR to the ICMM range and achieve zero fatal accidents.
Board Committee changes
Fresnillo plc announces that its Board of Directors, on the recommendation of the Nominations Committee has approved a change to the composition of the Health, Safety, Environment and Community Relations (HSECR) Committee effective as at 2 March 2026.
Ms Luz Adriana Ramírez has been appointed as an additional member of the HSECR Committee. She currently is an Independent Non-Executive Director.
Ms Ramírez has experience in health, safety, environment and community relations issues at an executive level as well as being a member of related committees in other relevant companies and the Board believes that she brings valuable insight to the work of the HSECR Committee.
Analyst Presentation
Fresnillo plc will be hosting a webcast presentation for analysts and investors today at 9:00am (GMT). A link to the webcast will be made available on Fresnillo's homepage: www.fresnilloplc.com or can be accessed directly here: https://brrmedia.news/FRESFY25
To dial in via a phone line, please use the below dial-in details:
|
Conference call dial-in numbers: |
UK-Wide: +44 (0) 33 0551 0200 UK Toll Free: 0808 109 0700 USA Local: +1 786 697 3501 USA Toll Free: 866 580 3963 Gabriela Mayor, Head of Investor |
|
Password (if prompted): |
Please quote 'Fresnillo FY25 Results' when prompted by the operator
|
For further information, please visit our website: www.fresnilloplc.com or contact:
|
Fresnillo plc |
|
|
London Office Gabriela Mayor, Head of Investor Relations Mark Mochalski
|
Tel: +44(0)20 7339 2470
|
|
Mexico City Office Ana Belém Zárate |
Tel: +52 55 52 79 3206
|
|
|
|
|
Sodali Peter Ogden |
Tel: +44(0)7793 858 211 |
About Fresnillo plc
Fresnillo plc is the world's largest primary silver producer and Mexico's largest gold producer, listed on the London and Mexican Stock Exchanges under the symbol FRES.
Fresnillo plc has eight operating mines, all of them in Mexico - Fresnillo, Saucito, Juanicipio, Ciénega, Herradura, Soledad-Dipolos1, Noche Buena and San Julián Veins and five advanced exploration projects - Orisyvo, Rodeo, Guanajuato, Tajitos, and Novador, as well as a number of other long term exploration prospects.
Fresnillo plc has mining concessions and exploration projects in Mexico, Peru and Chile.
Fresnillo plc's goal is to maintain the Group's position as the world's largest primary silver company and Mexico's largest gold producer.
1 Operations at Soledad-Dipolos are currently suspended
Chairman's statement
Alejandro Baillères
Capitalising on today's opportunities, focusing on the future
This was an exceptional year for Fresnillo. Our efforts to boost performance and reduce costs bore fruit and enabled us to achieve production and efficiency targets, while a positive price environment drove a significant increase in revenue.
When we first looked ahead to 2025, our initial thoughts were that it could be challenging to surpass the achievements of 2024. However, a number of key factors came together during the year to generate one of the most rewarding periods in Fresnillo's history.
Our teams worked hard to address factors within our control, improving performance, reducing costs and achieving production goals. Meanwhile, external factors led to significant increases in the prices of precious metals - and we have been able to capitalise on this positive tailwind.
However, there is no room for complacency. Towards the end of the year we announced an important acquisition which has expanded our presence into an exciting new territory and bolstered our already promising pipeline. In addition, our performance and cost reduction initiatives continue at pace - and these will help to underpin future performance regardless of external factors.
Strong operational performance
Production of silver and gold were again in line with guidance. In fact we exceeded our target for gold - with the team at Herradura continuing to execute our plans consistently and with great expertise. Silver production was towards the lower end of guidance, with performances above expectations at Juanicipio and San Julián Veins and the recovery that began at Saucito in 2024 beginning to show positive signs.
We achieved US$4,645.3 million in Adjusted revenue during the year. This represented an increase of 27.6%, primarily due to the increase in silver and gold prices. Gross profit increased 113.8% year-on-year to US$2,664.1 million, mainly driven by higher adjusted revenue and decreased costs, the latter primarily due to lower volumes processed at some of our operations, including at San Julián DOB following its closure, the devaluation of the average exchange rate between the Mexican peso and US dollar, and cost reduction initiatives and efficiencies.
These factors partially offset inflationary headwinds during the year. Cash and other liquid funds increased from US$1,297.8 million to US$2,756.5 million primarily driven by cash generated from our mining operations, which more than offset the use of funds in capital expenditure, dividend payments, taxes and mining rights.
Through the good times as well as those that prove more difficult our dividend policy has remained stable and well-respected. It is the basis for continued shareholder returns while also supporting the growth of the company. We aim to pay out 33-50% of profit after tax each year, while making certain adjustments to exclude non-cash effects in the income statement. Dividends are paid in the approximate ratio of one-third as an interim dividend and two-thirds as a final dividend. Before declaring a dividend, the Board carries out a detailed analysis of the profitability of the business, underlying earnings, capital requirements and cash flow. Our goal is to maintain enough flexibility to be able to react to movements in precious metals prices and seize attractive business opportunities. During 2025, for example, our strong balance sheet and healthy cash position facilitated the proposal to acquire Probe Gold Inc.
The Board also considers paying special dividends in cases where we build up a large cash balance, considering any extraordinary needs for cash, such as the aforementioned acquisition, along with the outlook for metals prices and expected cash generation in future periods.
For 2025, we declared an interim ordinary dividend of 20.8 US cents per share, with a final ordinary dividend of 108.12 US cents per share, bringing the total for the year to 128.92 US cents per share.
Making the most of today's opportunities…
In my statement last year, I reported that cost reduction and operational initiatives had already had a beneficial impact, and I am pleased to say that this continued through 2025, and we have again succeeded in managing our costs while improving productivity.
Our efforts were significantly strengthened by a very positive price environment, which was a major factor in the year's financial performance. The price of gold hit all-time highs, while that for silver more than doubled, following an increase of 21 per cent in 2024.
However, while we met our production objectives during the year, we failed to succeed on the one measure that is unquestionably our most important: safety. Despite achieving our lowest TRIFR (total recordable injury frequency rate) and LTIFR (lost time injury frequency rate) since 2018, it is with great sadness that I must report two fatalities in 2025, one unionised employee and one contractor. Everybody at Fresnillo recognises that we can - and indeed we must - do better.
…while focusing on the future
As expected, the political climate in Mexico has moved into more positive territory following the appointment of the government led by President Claudia Sheinbaum. Although clear direction is still required in some areas, such as permitting for mining activities, the new administration is proving to be broadly receptive to the business community. We are cautiously confident that this new mood will continue into 2026 and beyond, underpinning our continued commitment to the environment and supporting the development of the communities in which we operate.
Our future focus includes further cost reduction initiatives and operational efficiencies across the business, and these will be complemented by an exploration pipeline that is expected to yield at least one and possibly more projects that can move into our development portfolio within the next two to three years.
The pipeline was enhanced during 2025 by our move to acquire of Probe Gold Inc., a leading Canadian exploration company focused on the acquisition, exploration, and development of highly prospective gold properties. Following extensive due diligence to ensure it had the potential to add considerable long-term value for our shareholders, we concluded the deal in January 2026 for an all-cash consideration of CAD$3.65 per share. The total equity value of the transaction was approximately CAD$770 million, (approx. US$555 million) on a fully diluted basis.
The acquisition of Probe is consistent with the disciplined approach to M&As that we have consistently set out over time - including in my statement last year - and meets our strict criteria of having a sizeable resource base with upside optionality in a mining-friendly region with mining history, skilled personnel, and existing infrastructure. Exploration is in the DNA of both companies and we look forward to working closely together as we advance the exciting Novador project. The Fresnillo team has visited the Probe site on several occasions and has met directly with stakeholders including employees, First Nations representatives and local, provincial and federal authorities.
Board activities
Our regular Board meetings provide the opportunity for members to explore and discuss a wide range of issues that impact the business. These include operational matters and the prevailing political landscape at home and abroad, amongst others. Key decisions this year have included the special dividend, the decision to end the Silverstream Agreement, and the agreement to acquire Probe. There was also considerable focus on safety, culture, the ERP system, cyber security and cost reduction.
As in previous years, one of the highlights of 2025 was the three-day Working Meeting in Mexico, which was held in July and provided a significant opportunity for the Board to engage with longer-term strategic and stakeholder issues. The meeting included a visit to Herradura, where we were able to see for ourselves the tremendous improvements that the local team has been implementing.
Changes to the Board
There were no Board changes during the year. A number of significant developments for which the Audit Committee is responsible remain ongoing. The Nomination Committee has therefore proposed that at the 2026 AGM, Alberto Tiburcio (who was appointed to the Board in May 2016 and has chaired the Audit Committee since 2018) should again stand for re-election as an Independent Non-Executive Director for one further year.
In addition, the Board is recommending the re-election of Dame Judith Macgregor as an Independent Non-Executive Director at the 2026 AGM, notwithstanding that she will reach the ninth anniversary of her appointment to the Board soon after that AGM. In view of the other Board changes being made this year, we consider that it will be highly beneficial to the Company for her to serve one further year in her role as Senior Independent Director.
We will be consulting with shareholders concerning the proposed re-election of both Alberto and Dame Judith before publication of the notice of meeting for the 2026 AGM.
Outlook
Uncertainty will in all likelihood continue to be the watchword regarding global geopolitics, with ongoing conflicts such as the wars in Ukraine and the Middle East being exacerbated by heightened tensions between the US, China and Russia, along with developments in Venezuela that will have important implications for the whole region. We expect tariffs to remain a key issue for international trade, although these may evolve to become more negotiated and targeted.
The acquisition of Probe Gold Inc. has expanded our presence into Canada and the broader Western Hemisphere through our activities in Peru and Chile. However, Mexico remains central to our operations, and we will continue to engage proactively with the Government.
The new administration's more business-friendly approach has already had a positive impact on our industry, and we anticipate that this might further strengthen in the coming months.
In terms of our operations, our teams will again work hard to maintain and enhance the initiatives that have driven stable production and cost efficiencies in recent months. We will also focus on moving the most promising advanced exploration projects further along our pipeline.
We expect the high price environment for silver and gold to be maintained following the structural shift in prices seen in 2025. Advanced technologies, notably those around the energy transition, are underpinning sustained strength in silver prices. At the same time, ongoing global uncertainty is leading many investors to seek safe haven assets, offering further support to both gold and silver prices. Looking ahead, demand is forecasted to continue to exceed supply.
I am confident that we have the people, the strategy and the determination to capitalise on the many opportunities that will be presented in the months and years to come. Following a year when Fresnillo recorded a set of exceptional results, our ambitions to continue to deliver on our promises - to meet expectations and where possible go beyond them - burn as brightly as ever.
I would like to end by putting on record my gratitude to all our stakeholders - including those working in the supply chain and in government, as well as local communities, investors and, of course, our talented workforce - for their support over the past 12 months.
Alejandro Baillères
Chairman
Chief Executive's statement
Octavio Alvídrez
Exceptional performance in a positive price environment
I am delighted to report on what was an outstanding year for Fresnillo, as we continued to execute our long-term strategy. The tremendous efforts of our teams were complemented by sustained high prices for precious metals, with gold in particular reaching all-time highs.
2025 saw our Company deliver strong operating and financial results. Profitability increased on the back of our unrelenting focus on operational efficiencies supported by rigorous cost discipline and given added momentum by very favourable prices for precious metals. The outcome was the generation of substantial free cash flow and a robust balance sheet with ample liquidity.
Our people again demonstrated their deep-seated commitment to the Company's Purpose to contribute to the wellbeing of people through the sustainable mining of silver and gold. Their continuing dedication and expertise will be crucial in the years ahead, as a number of projects in our exciting pipeline move towards becoming operational mines.
At the same time, we must strengthen our safety performance. While most of our indicators continued to improve, two fatalities overshadowed that progress. These incidents are painful reminders that zero fatalities is the only acceptable outcome, and that our first and most important responsibility is to ensure the safety of our colleagues.
Production highlights and price review
Total gold production was 600.3 koz, above our guidance range and, as expected, down by 5.0% from 631.6 koz in the previous year. This was primarily due to the lower ore grade and decreased ore throughput at Saucito and Fresnillo, as well as at Herradura, where performance nevertheless exceeded original plans.
Total silver production of 48.7 moz was towards the lower end of the guidance range, down by 13.5% from 56.3 moz in 2024. While the ongoing turnaround at Saucito has started to deliver the anticipated outcomes, there remain significant opportunities for further
improvement. However, both production and ore grades were above plan at Juanicipio and San Julián Veins, helping to offset challenges elsewhere, including at Ciénega and Fresnillo.
Attributable by-product lead and zinc production decreased year-on-year, mainly due to the lower ore grade and volumes of ore processed at Fresnillo and the cessation of mining activities at San Julián DOB.
During 2025, silver and gold prices increased markedly for the third consecutive year. The average realised silver price was US$43.6 per ounce, up by 51.4%, while the price of gold hit record highs, rising by 44.0% to US$3,532.7 per ounce during the year. Average prices for zinc increased by 3.2% while those for lead decreased by 5.3%.
Demand for silver and gold is continuing to outstrip supply, with the key drivers of demand indicating good levels of support for prices in the medium term. The world's increasing reliance on advanced technologies, particularly those associated with the energy transition, is a major factor in demand for both silver and gold. Silver is essential to a wide range of applications from electric vehicle batteries and solar panels to 5G telecommunications, and also in the food, medical and electronics sectors. Towards the end of 2025, the importance of silver was underlined when the US and Chinese governments officially categorised it as one of the world's essential metals.
Gold is a key component in consumer electronics as well as in rapidly growing areas such as the automotive, aerospace and high-speed computing industries. In addition, demand for gold - and increasingly also for silver - as a safe haven has remained robust, among central banks as well as individual investors.
Executing our strategy
Our strategy has been well defined and consistently applied for many years. It is based on four strategic pillars that together enable us to maintain and, where possible, enhance our track record of seizing the opportunities of today while also preparing for the future.
Maximising the potential of existing operations
Improving the productivity and efficiency of our operational mines has been the subject of great focus over the last two to three years. While some of our operations are yet to fully achieve their targets, the trend is positive.
In last year's report, our Chief Operating Officers outlined a number of specific plans to deliver greater efficiency and cost control in their respective regions. In the Central Region, for example, a key task was to consolidate operations at Juanicipio, confirm the turnaround at Saucito and focus on greater control of the factors affecting ore grades at Fresnillo. Successful actions against the first and second of these priorities formed the basis for the region's silver production in 2025, with Juanicipio performing above plan. MAG Silver, our joint venture partner at Juanicipio, was acquired by Pan American during the year, and we have already started to work closely with them to ensure that Juanicipio continues to fulfil its outstanding potential.
At the Fresnillo mine, challenges are proving more complex to overcome. Although ore grades improved, we processed a lower volume of mineral during the year due to reduced contributions from deeper, narrower and more distant veins. However, the San Carlos shaft is now beginning to reduce haulage costs for the substantial amounts of ore we expect to mine from these areas in the coming years.
At our operations in the Northern Region of Mexico, several improvement initiatives have already paid dividends. Gold production at San Julián Veins increased due to a greater volume of ore processed, driven by the disciplined execution of plans to optimise plant operation . At Herradura, we have continued the transformation that began in 2024, controlling costs and focusing on planning and execution, including the recovery of gold content from the oxidised high-grade ore deposited at the leaching pads. Our plans to commence underground activities at Herradura have progressed well, with mining works expected to commence in 2026 and production set to follow early in 2027. We experienced challenges at Ciénega, where production decreased compared to 2024. Nevertheless, we remain confident in the mine's future, and expect cost control measures, operational efficiencies and a renewed exploration programme to successfully extend Ciénega's life beyond 2028.
Delivering growth through development projects
Although none of the projects discussed in the following section are yet quite ready to move out of the exploration phase and become standalone development projects, I look forward to reporting further progress in next year's Annual Report.
Extending the growth pipeline
We currently have six advanced exploration projects in our pipeline, an increase of two compared to this time last year.
A historic, world-class gold and silver epithermal vein field, our Guanajuato project stretches more than 40 kilometres along the central Mexican state from which it takes its name and is expected to make an important contribution to the Group's future silver production. During 2025, exploration concentrated on the southern part of the district where we drilled 107,759 metres. We continued to carry out scoping level studies as well as community engagement programmes which have already delivered access to key sections of land required for the project.
We remain moderately confident in the potential of our underground gold project at Orisyvo, despite the significant capital expenditure on infrastructure - including roads, tailings storage facilities, accommodation camps and land access - required to bring it to fruition. Following a review at the end of 2025 into the results of pre-feasibility studies, we are identifying possibilities to improve the project's cost-effectiveness and anticipate presenting next stage proposals to the Board for approval in the second half of 2026.
At Rodeo, an open pit, heap leaching gold project in central Durango state, we aim to finalise exploration activities in the first half of 2026. Over 5,000 metres have now been collared, proving good continuity of the ore bodies. Results of a preliminary economic assessment are expected in mid-2026, giving us greater visibility of considerations including development layout, water and energy supply as well as key technical issues.
Exploration continued progressing at the Tajitos gold project. In 2025 the Mexican government began to grant permits for open pit mining, and this has removed a degree of uncertainty for the project, paving the way for the new preliminary economic assessment that we expect to conclude early in 2026.
We also made encouraging progress with our project at Lucerito during 2025, and this has now joined Guanajuato, Orisyvo, Rodeo and Tajitos in the advanced exploration project pipeline. More than 9,100 metres of drilling were carried out at Lucerito over the last 12 months, and we have good grounds to believe that the ore body there includes extensive resources with a positive combination of gold, silver and zinc.
Our pipeline has been further enhanced by the acquisition, after the year end, of Probe Gold Inc. Probe's assets include the Novador Gold Project, as well as the early-stage Detour Gold project, both located in Quebec, Canada. In addition to providing us with strategic entry into a world class Tier 1 mining jurisdiction, Probe adds a large resource base of 10 million ounces of gold. Novador alone has the potential to produce over 200,000 ounces per annum over 10+ years, and we are confident that this project, together with our advanced exploration projects in Mexico, will underpin Fresnillo's long-term future, further positioning us as one of the leading precious metals companies in the world.
Exploration continued across the portfolio during the year, with positive results yielded by brownfield exploration around the Fresnillo and San Julián districts and by greenfield drilling at Candameña, in addition to activities at those projects already mentioned. We also continued to make progress at our mining concessions in South America. In Chile, we completed 1,654 metres of drilling at Capricornio, a joint-venture project with SQM, while in Peru we drilled 2,058 metres at the Chiclayo project, with modest results, and strengthened our community relations plan.
At the end of the year, silver in consolidated overall mineral resources decreased by 8.5% vs 2024 to 2.06bn oz. This was mainly due to
the application of a new approach, in line with industry best practice, to classify mineral resources based on their expected future economic extraction, which, although initially reduces the reported resource base, enhances transparency and strengthens long-term confidence in the estimates. Gold in consolidated overall mineral resources increased by 14.3% vs 2024 to 44.0 moz, primarily driven by the favourable impact of the higher price of gold at Herradura and the Lucerito exploration project.
Silver in consolidated overall ore reserves increased by 9.4% to 362.6 moz, mainly due to higher metals prices and a lower cut-off grade together with the addition of ounces through the infill campaign, primarily at the Fresnillo district. Gold in consolidated overall ore reserves increased by 7.4% to 7.8 moz as a result of the higher gold price, principally at Herradura.
Advancing and enhancing the sustainability of our operations
Thanks to the commitment of our teams, we have achieved steady progress in our safety journey since 2018, with a 69% decrease in TRIFR (total recordable injury frequency rate) and 51% in LTIFR (lost time injury frequency rate). The last year alone saw those indices decrease by 17.6% and 13.7%, respectively. However, such progress cannot outweigh the loss of life. The two fatal accidents we experienced during the year-one involving a unionised employee and one a contractor-completely eclipse the gains. Our thoughts are with their families, friends and colleagues. These tragedies underline the fact that our work is far from finished: we can never be complacent about safety.
We have examined both incidents thoroughly and have begun to implement the appropriate corrective actions to support our goal of zero fatalities. Although mining carries intrinsic risks, we have the systems, the training and the leadership to manage and mitigate them. Ultimately, however, safety requires every person to fully embrace their responsibility-taking ownership not only of their own wellbeing, but also that of their colleagues. This principle is the foundation of our 'I Care, We Care' strategy.
As I reported last year, the new government administration has shown a greater openness to dialogue with the mining industry. These exchanges have reinforced that sustainability-related issues, including those most critical to local communities, are central in advancing Mexico's environmental and social policy agenda-from implementing the National Agreement for Forests, Jungles and Mangroves to reducing GHG emissions by 35% by 2030 and safeguarding the fundamental right of access to water. On key sustainability matters such as these, Fresnillo has been - and will continue to be - a strategic partner.
On the decarbonisation front, we remain focused on sourcing 75% of our energy consumption from renewables. While we have consistently surpassed this target in recent years - including in 2025 - we recognise that it will become increasingly challenging as exploration projects transition into operation and demand more energy. We remain committed to ensuring that our environmental ambition keeps pace with our business growth and that our energy supply remains reliable, competitive and grounded in clean sources.
We have decided to pause the dual fuel project at Herradura, which introduced several LPG-diesel trucks into the haulage fleet. Shifts in price and performance dynamics mean that, unless conditions change significantly, we will retire these units at the end of their operational life and either revert to a diesel fleet or explore other technologies, such as electric trucks.
Mining operations not only require large quantities of water but are also frequently situated in arid locations where the population is already experiencing a high degree of water stress. Over the years we have advanced a range of initiatives to reduce our water footprint and support infrastructure and sanitation for local communities. For example, in 2025 the Proaño Potabilisation Water Plant was inaugurated in partnership with the municipal government of Fresnillo. This project diverts and treats mine water from the Fresnillo mine to supplement the local potable water system.
Having exceeded our 2025 targets for the representation of women in both our total workforce and managerial positions a year ahead of schedule, we have now begun defining the next stage of our ambition. Inclusion is a great source of strength and essential for attracting and developing the best talent at a time when we are preparing for a new phase of growth-both within Mexico and beyond.
Looking ahead
We have indicated that production of silver and gold from our current operations is expected to reduce in 2026, largely due to geological factors at our operating assets. The goal is to improve the quality of the ounces we produce by continuing to implement the wide range of initiatives introduced by Tomás Iturriaga and Daniel Diez, our Chief Operating Officers, to increase efficiency and reduce costs. At the same time, we will aim to move all five of the advanced exploration projects further along our pipeline. We believe that all of these projects show good potential - the goal now is to identify and promote those that are best suited to the current economic and operational situation, and I anticipate being able to provide a positive update in next year's Annual Report.
More generally, cost control will continue to be a focus in 2026, given cost pressures globally and the strength of the Mexican peso. On the other hand, we anticipate that our operational performance will be enhanced by the continuation of a high price environment for silver and gold, with global production failing to meet the steady increase in demand for both metals.
Our optimism is based on experience and an understanding of both known and unforeseen challenges, which we address through careful planning, precise execution, and risk mitigation.
Finally, I would like to pay tribute to the fine work of our teams, who worked with great skill and determination to execute our strategy over the last 12 months. I thank them unreservedly. The exceptional results we have posted this year would not have been possible without them.
Octavio Alvídrez
Chief Executive
FINANCIAL REVIEW
"The Group's financial performance in 2025 reflects the positive impact of higher precious metals prices together with a more stable operational performance."
The consolidated financial statements of Fresnillo plc are prepared in accordance with UK-adopted international accounting standards. This financial review intends to explain the main factors affecting performance as well as provide a detailed analysis of the financial results in order to enhance the understanding of the Group's financial statements. All comparisons refer to 2025 figures compared to 2024, unless otherwise noted. The financial information and year-on-year variations are presented in US dollars, except where otherwise indicated.
The following report presents how we have managed our financial resources.
Commentary on financial performance
The Group's financial performance in 2025 reflects the positive impact of higher precious metals prices coupled with a more stable operational performance, which was achieved despite a number of challenges.
Adjusted revenue1 increased 27.6% vs 2024 to US$4,645.3 million. This was primarily due to higher gold and silver prices. Revenue increased 30.5% year-on-year to US$4,561.2 million, principally due to the same factors as the increase in Adjusted revenue and lower treatment and refining charges.
Adjusted production costs 2 decreased 11.1% vs 2024. This was mainly due to the cessation of mining activities at San Julián DOB; the lower volumes processed at Herradura, Fresnillo, Ciénega and Saucito; the favourable effect of the devaluation of the average Mexican peso vs. US dollar exchange rate; and net efficiencies achieved, principally at Herradura. These factors were partly offset by cost inflation of 3.2%, excluding the exchange rate devaluation.
As a result, gross profit more than doubled to US$2,664.1 million, while EBITDA3 increased by 80.7% to US$2,796.2 million in 2025.
We maintained our strong financial position, with US$2,756.5 million in cash and other liquid funds as of 31 December 2025, a net increase of US$1,458.7 million over the period, having paid dividends of US$654.3 million: US$346.3 million in accordance with our policy (adjusted for extraordinary, non-cash items, in particular the revaluation of the Silverstream contract and the effect of the exchange rate on deferred taxes), in addition to US$308.0 million in extraordinary dividends. We also invested US$400.1 million in capex, spent US$173.5 million on exploration expenses, and paid US$369.5 million in taxes, special mining rights, and profit sharing.
FINANCIAL REVIEW CONTINUED
Income statement highlights
|
|
2025 US$ million |
2024 US$ million |
Amount change US$ million |
Change % |
|
Adjusted revenue1 |
4,645.3 |
3,639.9 |
1,005.4 |
27.6 |
|
Total revenue |
4,561.2 |
3,496.4 |
1,064.8 |
30.5 |
|
Cost of sales |
(1,897.1) |
(2,250.1) |
353.0 |
(15.7) |
|
Gross profit |
2,664.1 |
1,246.3 |
1,417.8 |
113.8 |
|
Exploration expenses |
173.5 |
163.0 |
10.5 |
6.4 |
|
Operating profit |
2,292.5 |
945.8 |
1,346.7 |
142.4 |
|
EBITDA3 |
2,796.2 |
1,547.3 |
1,248.9 |
80.7 |
|
Special mining rights |
193.2 |
127.0 |
66.2 |
52.1 |
|
Income tax (Tax income) |
315.0 |
390.2 |
(75.2) |
(19.3) |
|
Profit for the period |
1,573.8 |
226.7 |
1,347.1 |
594.2 |
|
Profit for the period, excluding post-tax Silverstream effects |
1,706.3 |
354.3 |
1,352.0 |
381.6 |
|
Basic and diluted earnings per share (US$/share)4 |
1.878 |
0.191 |
1.687 |
883.2 |
|
Basic and diluted earnings per share, excluding post-tax Silverstream effects (US$/share) |
2.058 |
0.364 |
1.694 |
465.4 |
1 Adjusted revenue is revenue as disclosed in the income statement adjusted to exclude treatment and refining charges.
2 Adjusted production costs are calculated as cost of sales less depreciation, profit sharing, change in inventories and unproductive costs. The Company considers this a useful additional measure to help understand underlying factors driving production costs in terms of the different stages involved in the mining and plant processes, including efficiencies and inefficiencies, as the case may be, and other factors outside the Company's control such as cost inflation or changes in accounting criteria.
3 Earnings before interest, taxes, depreciation and amortisation (EBITDA) is calculated as profit for the year from continuing operations before income tax, less finance income, plus finance costs, less foreign exchange gain/(loss), less revaluation effects of the Silverstream contract and other operating income plus other operating expenses and depreciation.
4 The weighted average number of Ordinary Shares was 736,893,589 for 2025 and 2024. See Note 18 to the consolidated financial statements.
The Group's financial results are largely determined by the performance of our operations. However, other factors beyond our control, including a number of macroeconomic variables, also affect our financial results. These include:
Metals prices
The average realised silver price increased 51.4% from US$28.8 per ounce in 2024 to US$43.6 per ounce in 2025, while the average realised gold price rose 44.0% to US$3,532.7 per ounce. The average realised zinc by-product price increased 1.6% to US$1.30 per pound, with the lead by-product price decreasing 4.6% vs 2024 to US$0.88 per pound.
MX$/US$ exchange rate
|
Spot exchange rate at 31 December 2025 |
Spot exchange rate at 31 December 2024 |
Impact |
|
$18.00 per US dollar |
$20.27 per US dollar |
The 11.4% spot revaluation had a favourable effect on deferred taxes and special mining rights |
|
Average Mexican peso/US dollar exchange rate 2025 |
Average Mexican peso/US dollar exchange rate 2024 |
Impact |
|
$19.22 per US dollar |
$18.30 per US dollar |
The 5.1% devaluation had a positive effect of US$51.6 million on the Group's costs denominated in Mexican pesos (approximately 45% of total costs) when converted to US dollars. |
Cost inflation
The Mexican Consumer Price Index for 2025 calculated cost inflation at 3.9%. However, to evaluate the Group's cost inflation for the year, we calculate the unit price increase for each component of adjusted production costs and take into consideration their weighted average within the Group's basket. The resulting cost deflation estimate for 2025 was 0.2%, which included the favourable effect of the 5.1% average devaluation of the Mexican peso against the US dollar. Underlying cost inflation (cost inflation excluding the devaluation of the Mexican peso vs. US dollar) was 3.2%. We conduct the same exercise for each individual mine operation, whose basket components may carry different weightings.
The main components driving our cost inflation are listed below:
Labour
Unionised workers received on average a 7% increase in wages in Mexican pesos, while non-unionised employees received on average a 6% increase in wages in Mexican pesos; when converted to US dollars this resulted in a weighted average labour inflation of 1.5%.
Energy
Electricity
The weighted average cost of electricity in US dollars remained broadly stable at US$8.18 cents per kW in 2025.
Diesel
The weighted average cost of diesel decreased 4.0% in US dollars to 107.4 US cents per litre in 2025, compared to 111.9 US cents per litre in 2024.
Operating materials
|
|
Year-on-year change in unit price % |
|
Steel balls for milling |
4.3 |
|
Sodium cyanide |
4.1 |
|
Explosives |
3.3 |
|
Tyres |
1.7 |
|
Other reagents |
1.3 |
|
Steel for drilling |
(2.6) |
|
Lubricants |
(7.6) |
|
Weighted average of all operating materials |
2.2 |
The weighted average unit prices of all operating materials increased by 2.2% over the year as the unit prices of steel balls for milling, explosives and reagents, including sodium cyanide, continued to increase in US dollar terms, reflecting global inflationary pressures. This was partly offset by the decrease in the unit price of lubricants. There has been no significant impact on the unit cost of operating materials from the devaluation of the Mexican peso/US dollar exchange rate as the majority of these items are dollar-denominated.
Contractors
Agreements are signed with each individual contractor company and include specific terms and conditions that cover not only labour, but also operating materials, equipment and maintenance, among others. Contractor costs are mainly denominated in Mexican pesos and are an important component of our total production costs. In 2025, increases per unit (i.e. per metre developed/per tonne hauled) granted to contractors whose agreements were due for review during the period, resulted in a weighted average decrease of approximately 1.3% in US dollars, after considering the devaluation of the Mexican peso vs the US dollar.
The effects of the above external factors, combined with the Group's internal variables, are further described below through the main line items of the income statement.
Revenue
Consolidated revenue
|
|
2025 US$ million |
2024 US$ million |
Amount US$ million |
Change % |
|
Adjusted revenue1 |
4,645.3 |
3,639.9 |
1,005.40 |
27.6 |
|
Treatment and refining charges |
(84.1) |
(143.6) |
59.50 |
(41.4) |
|
Total revenue |
4,561.2 |
3,496.4 |
1,064.80 |
30.5 |
1 Adjusted revenue is revenue as disclosed in the income statement adjusted to exclude treatment and refining charges and metals prices hedging.
Adjusted revenue increased by US$1,005.4 million, driven by the higher gold and silver prices, partly offset by the lower volumes of all metals sold. Changes in the contribution by metal were the result of the relative changes in metals prices and volumes produced. The effect by metal, both in terms of volume and price, is shown in the table below.
Adjusted revenue1 by metal
|
|
2025 |
2024 |
||||||
|
|
US$ million |
% contribution |
US$ million |
% contribution |
Volume variance US$ million |
Price variance US$ million |
Total net changeUS$ million |
Change % |
|
Gold |
2,071.2 |
44.6 |
1,514.7 |
41.6 |
(93.0) |
649.4 |
556.5 |
36.7 |
|
Silver |
2,161.9 |
46.5 |
1,673.9 |
46.0 |
(309.9) |
797.9 |
488.0 |
29.2 |
|
Lead |
124.6 |
2.7 |
139.8 |
3.8 |
(9.0) |
(6.2) |
(15.2) |
(10.9) |
|
Zinc |
287.6 |
6.2 |
311.5 |
8.6 |
28.8 |
4.9 |
(23.9) |
(7.7) |
|
Total Adjusted revenue |
4,645.3 |
100.0 |
3,639.9 |
100.0 |
(440.8) |
1,446.1 |
1,005.4 |
27.6 |
1 Adjusted revenue is revenue as disclosed in the income statement adjusted to exclude treatment and refining charges and metals prices hedging.
Adjusted revenue by mine
The contribution by mine to Adjusted revenues is outlined in the table below. This is expected to change further in the future, as new projects are incorporated into the Group's operations and as precious metals prices fluctuate.
|
|
2025 |
2024 |
|||
|
|
(US$ million) |
% contribution |
(US$ million) |
% contribution |
Change % |
|
Herradura |
1,241.2 |
26.7 |
884.7 |
24.3 |
40.3 |
|
Saucito |
929.9 |
20.0 |
760.0 |
20.9 |
22.4 |
|
Juanicipio |
922.6 |
19.9 |
662.8 |
18.2 |
39.2 |
|
Fresnillo |
739.3 |
15.9 |
591.2 |
16.2 |
25.1 |
|
San Julián (Veins) |
527.9 |
11.4 |
354.5 |
9.7 |
48.9 |
|
Ciénega |
232.4 |
5.0 |
228.4 |
6.3 |
1.8 |
|
Noche Buena |
52.0 |
1.1 |
43.4 |
1.2 |
19.8 |
|
San Julián (DOB) |
0.0 |
0.0 |
115.1 |
3.2 |
(100.0) |
|
Total |
4,645.3 |
100 |
3,639.9 |
100 |
27.6 |
Treatment and refining charges
Treatment and refining charges1 are reviewed annually using international benchmarks. Treatment charges per tonne of lead and zinc concentrate and silver refining charges decreased substantially in dollar terms by 40.7%, 41.8% and 41.6%, respectively. These factors, combined with the lower volumes of lead and zinc concentrates shipped from our mines to Met-Mex, resulted in an 41.4% decrease in treatment and refining charges set out in the income statement in absolute terms when compared to 2024.
1 Treatment and refining charges include the cost of treatment and refining as well as the margin charged by the refiner.
Cost of sales
|
Concept |
2025 US$ million |
2024 US$ million |
Amount US$ million |
Change % |
|
Adjusted production costs2 |
1,406.7 |
1,582.2 |
(175.5) |
(11.1) |
|
Depreciation |
490.6 |
619.8 |
(129.2) |
(20.8) |
|
Profit sharing |
15.7 |
12.3 |
3.4 |
27.6 |
|
Change in work in progress |
(22.4) |
35.8 |
(58.2) |
N/A |
|
Unproductive costs including inventory reversal and unabsorbed production costs3 |
6.5 |
0.0 |
6.5 |
100.0 |
|
Cost of sales |
1,897.1 |
2,250.1 |
(353.0) |
(15.7) |
2 Adjusted production costs are calculated as cost of sales less depreciation, profit sharing, change in inventories and unproductive costs. The Company considers this a useful additional measure to help understand underlying factors driving production costs in terms of the different stages involved in the mining and plant processes, including efficiencies and inefficiencies, as the case may be, and other factors outside the Company's control such as cost inflation or changes in accounting criteria.
3 Unproductive costs primarily include unabsorbed production costs such as non-productive costs from the temporary suspension of activities at Herradura and non-productive fixed mine costs incurred at Noche Buena from the finalisation of mining activities.
Cost of sales decreased 15.7% to 1,897.1 million in 2025. The main factors driving the US$353.0 million decrease are listed below:
Adjusted production costs decreased by US$175.5 million as shown in the graph below:
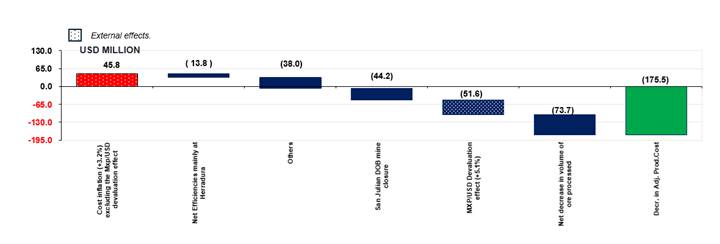
Ongoing efforts to implement cost reduction initiatives have continued, generating positive results in 2025 and driving US$13.8 million net worth of operating efficiencies. These included efficiencies and cost reductions at Herradura (-US$39.6 million), and decreased contractor costs for development at Ciénega (-US$6.7 million). This achievement was offset by inefficiencies and cost increases at Fresnillo as a result of increased contractor costs for development, increased mechanical and electrical maintenance and higher consumption of explosives and milling balls at Fresnillo (+US$27.5 million), increased electrical and mechanical maintenance at Saucito (+US$3.4 million), and higher IT costs and increased mechanical maintenance at Juanicipio (+US$1.6 million).
Others reflect non-mining/core process costs converted from a commercial arrangement to a tolling agreement.
The decrease in depreciation (-US$129.2 million) was mainly due to lower depreciation of the asset base at San Julián as the DOB approached the end of its life, with its assets being fully depreciated in 2024, and, to a lesser extent, the reduced depletion factor at Ciénega and Saucito.
Gross profit
Gross profit is a key financial indicator of profitability at each business unit and the Fresnillo Group as a whole.
Total gross profit doubled from US$1,246.3 million in 2024 to US$2,664.1 million in 2025.
The main factors driving the US$1,417.8 million increase in gross profit are shown in the graphic below:

The contribution by mine to the Group's consolidated gross profit and the year-on-year variations are outlined in the table below:
Contribution by mine to consolidated gross profit
|
|
2025 |
2024 |
Change |
|||
|
|
US$ million |
% contribution |
US$ million |
% contribution |
US$ million |
% |
|
Herradura |
716.2 |
26.9 |
274.2 |
22.0 |
442.0 |
161.2 |
|
Juanicipio |
661.7 |
24.9 |
384.8 |
31.0 |
276.9 |
72.0 |
|
Saucito |
543.1 |
20.4 |
281.7 |
22.7 |
261.4 |
92.8 |
|
Fresnillo |
339.1 |
12.8 |
180.0 |
14.5 |
159.1 |
88.4 |
|
San Julián |
289.3 |
10.9 |
89.3 |
7.2 |
200.0 |
224.0 |
|
Ciénega |
77.7 |
2.9 |
29.6 |
2.4 |
48.1 |
162.5 |
|
Noche Buena |
31.1 |
1.2 |
3.2 |
0.2 |
27.9 |
871.9 |
|
Total for operating mines |
2,658.2 |
100.0 |
1,242.8 |
100.0 |
1,415.4 |
113.9 |
|
Metal hedging and other subsidiaries |
5.9 |
|
3.5 |
|
2.4 |
68.6 |
|
Total Fresnillo plc |
2,664.1 |
|
1,246.3 |
|
1,417.8 |
113.8 |
Administrative and corporate expenses
Administrative and corporate expenses increased 8.0% from US$109.5 million in 2024 to US$118.2 million in 2025, primarily due to an increase in personnel as well as performance bonuses linked to operating and financial results paid to administrative personnel, partly mitigated by the favourable effect of the devaluation of the Mexican peso vs the US dollar on administrative expenses denominated in pesos.
Exploration expenses
Exploration expenses increased 6.4% from US$163.0 million in 2024 to US$173.5 million in 2025. In line with our strategy, exploration continued to focus on the Fresnillo district and the Ciénega and San Julián mines, prioritising efforts to increase the resource base, convert resources into reserves and improve the confidence of the grade distribution in reserves. An additional US$2.6 million was capitalised, mainly relating to exploration expenses at the Guanajuato and Orisyvo projects. As a result, risk capital invested in exploration totalled US$176.1 million in 2025, compared to US$165.0 million in 2024 (of which US$2.0 million was capitalised). This represents a year-on-year increase of 6.7%.
EBITDA
EBITDA is a gauge of the Group's financial performance and a key indicator to measure debt capacity. It is calculated as profit for the year from continuing operations before income tax, less finance income, plus finance costs, less foreign exchange gain/(loss), less the net Silverstream effects and other operating income plus other operating expenses and depreciation.
|
|
2025 US$ million |
2024 US$ million |
Amount US$ million |
Change % |
|
Profit from continuing operations before income tax |
2,082.0 |
743.9 |
1,338.1 |
179.9 |
|
- Finance income |
(92.5) |
(46.9) |
(45.6) |
97.2 |
|
+ Finance costs |
68.5 |
73.6 |
(5.1) |
(6.9) |
|
- Revaluation effects of Silverstream contract |
189.2 |
182.3 |
6.9 |
3.8 |
|
- Foreign exchange loss/(gain), net |
45.2 |
(7.0) |
52.2 |
N/A |
|
- Other operating income |
(20.2) |
(39.6) |
19.4 |
(49.0) |
|
+ Other operating expense |
33.3 |
21.3 |
12.0 |
56.3 |
|
+ Depreciation |
490.6 |
619.8 |
(129.2) |
(20.8) |
|
EBITDA |
2,796.2 |
1,547.3 |
1,248.9 |
80.7 |
|
EBITDA margin |
61.3 |
44.3 |
- |
- |
In 2025, EBITDA increased 80.7% to US$2,796.2 million, primarily driven by the higher gross profit. EBITDA margin expressed as a percentage of revenue increased, from 44.3% in 2024 to 61.3% in 2025.
Other operating income and expense
In 2025, a net loss of US$13.1 million was recognised in the income statement primarily as a result of the assets derecognised in connection with new projects which, in accordance with the energy supply agreement with the state‑owned company (CFE), are required for grid connection and must be transferred to CFE. However, this compared negatively with the net gain of US$18.3 million recorded in 2024, mainly due to higher proceeds obtained from the sale of the non-core Guazapares mining concessions to Coeur Mining.
Silverstream effects
As reported in the 2025 Interim Report, following a thorough evaluation of strategic options, it was concluded that terminating the Silverstream contract via a buyback was in the best interests of Fresnillo and its shareholders. The decision to end the Agreement followed a comprehensive review by Fresnillo and its independent advisers SRK, of the ongoing operational and financial issues at the Sabinas mine. This resulted in a US$132.4 million net loss after taxes in the income statement, including the impacts of amortisation. Further information related to the Silverstream contract is provided in notes 14 and 30 to the consolidated financial statements.
Net finance income
Net finance income of US$24.0 million compared favourably to the US$26.6 million loss recorded in 2024. This was mainly driven by the increased interest on short term deposits and investments, net of the interest paid on the 4.250% Senior Notes due 2050.
Taxation
Income tax expense for the year was US$315.0 million, which compared favourably to the tax expense of US$390.2 million in 2024. The effective tax rate, excluding the special mining rights, was 15.1% (2024: 52.5%), compared to the 30% statutory tax rate. The reason for the variation in the effective tax rate is the difference between the tax and the accounting treatment related mainly to: i) the effect of the spot exchange rate on the tax value of assets and liabilities; ii) the special mining rights deductible for corporate income tax; iii) the effect of the Mexican inflation on the restatement of tax value of fixed assets; and iv) the benefit from the lower border tax, which applied to the Herradura and Noche Buena mines, as described in the table below:
|
|
2025 |
2024 |
|
Spot exchange rate (revaluation)/devaluation |
(11.4) |
20.0 |
|
Exchange rate effect on tax value of assets and liabilities |
(US$192.5 million) |
US$300.2 million |
|
Special mining right deductible for corporate income tax |
(US$58.4 million) |
(US$38.1 million) |
|
Inflationary uplift of the tax base of assets and liabilities |
(US$50.7 million) |
(US$55.2 million) |
|
Benefit from the lower border tax, which applied to Herradura and Noche Buena mines |
(US$24.0 million) |
- |
Mining rights in 2025 were US$193.2 million compared to mining rights of US$127.0 million charged in 2024, mainly as a result of the the increase in the profit base used in the calculation along with the increase from 7.5% to 8.5% in 2025.
Profit for the period
Profit for the year increased year-on-year by 594.2% as a result of the factors described above.
|
|
2025 US$ million |
2024 US$ million |
Amount change US$ million |
Change % |
|
Profit for the period |
1,573.8 |
226.7 |
1,347.1 |
594.2 |
|
Profit for the period, excluding post-tax Silverstream effects |
1,706.3 |
354.3 |
1,352.0 |
381.6 |
|
Profit due to non-controlling interests1 |
189.8 |
85.8 |
104.0 |
121.2 |
|
Profit attributable to equity shareholders of the Group |
1,384.0 |
140.9 |
1,243.1 |
882.3 |
|
Basic and diluted earnings per share (US$/share)2 |
1.878 |
0.191 |
1.687 |
883.2 |
|
Basic and diluted earnings per share, excluding post-tax Silverstream effects (US$/share) |
2.058 |
0.364 |
1.694 |
465.4 |
1 The increase reflects the higher profit generated at Juanicipio, where Pan American owns 44% of the outstanding shares.
2 The weighted average number of Ordinary Shares was 736,893,589 for 2025 and 2024. See Note 18 to the consolidated financial statements.
Cash flow
A summary of the key items from the cash flow statement:
|
|
2025 US$ million |
2024 US$ million |
Amount US$ million |
Change % |
|
Cash generated by operations before changes in working capital |
2,787.3 |
1,559.8 |
1,227.5 |
78.7 |
|
Increase in working capital |
(128.1) |
(162.9) |
34.8 |
(21.4) |
|
Taxes and employee profit sharing paid |
(369.5) |
(97.1) |
(272.4) |
280.5 |
|
Net cash from operating activities |
2,289.7 |
1,299.8 |
989.9 |
76.2 |
|
Disposal of equity instruments and dividends |
178.3 |
3.6 |
174.7 |
>100 |
|
Silverstream contract |
85.9 |
30.0 |
55.9 |
186.3 |
|
Financial gains/(expenses) and foreign exchange effects |
48.7 |
(9.8) |
58.5 |
N/A |
|
Proceeds from the sales of mining concessions (see Note 2 to the consolidated financial statements) |
16.1 |
10.0 |
6.1 |
61.0 |
|
Dividends paid to shareholders of the Company |
(654.3) |
(78.2) |
(576.1) |
736.7 |
|
Purchase of property, plant and equipment |
(400.1) |
(370.5) |
(29.6) |
8.0 |
|
Dividends paid to non-controlling interests and loans by minority shareholders |
(105.2) |
(118.8) |
13.6 |
(11.4) |
|
Net (decrease)/increase in cash during the period after foreign exchange differences |
1,458.7 |
763.2 |
695.5 |
91.1 |
|
Cash and other liquid funds at 31 December1 |
2,756.5 |
1,297.8 |
1,458.7 |
112.4 |
1 Cash and other liquid funds are disclosed in Note 17 to the consolidated financial statements.
Cash generated by operations before changes in working capital increased 78.7% to US$2,787.3 million, primarily due to higher precious metals prices. Working capital increased US$128.1 million, mainly due to: i) a US$208.3 million increase in trade receivables from related parties principally because of higher precious metals prices; ii) an increase in ore inventories of US$20.4 million; and iii) a US$20.1 million increase in prepayments. This was partly offset by a US$120.7 million increase in trade payables.
Taxes and employee profit sharing paid increased to US$369.5 million, mainly due to: i) the higher final income tax paid in 2025, net of provisional taxes paid, corresponding to the 2024 tax fiscal year; ii) an increase in provisional tax payments paid in 2025; iii) an increase in mining rights payments; and iv) higher profit sharing paid.
As a result of the above factors, net cash from operating activities increased 76.2% to US$2,289.7 million in 2025.
In addition, the Group benefited from additional sources of cash, primarily generated by:
i) Proceeds from the sale of Mag Silver shares and dividends received for US$178.3 million.
ii) Proceeds from the Silverstream contract of US$85.9 million.
iii) Financial gains and foreign exchange effects of US$48.7 million, which compared favourably to the financial expenses and foreign exchange effects of US$9.8 million in 2024. This was primarily driven by the increased interest on short term deposits and investments, net of interest paid on the 4.250% Senior Notes due 2050.
Main uses of funds were:
i) Dividends paid to shareholders of the Group in 2025 totalled US$654.3 million, compared with US$78.2 million in 2024. The 2025 payment comprised: i) the 2024 final ordinary dividend of 26.1 cents per share paid in May 2025, totalling US$192.3 million, in line with our dividend policy, which includes a consideration of profits generated in the year, adjusted for the extraordinary, non-cash items, in particular the revaluation of the Silverstream contract and the effect of the exchange rate on deferred taxes, ii) a one-off special dividend of 41.8 cents per share also paid in May 2025, totalling US$308.0 million, and iii) the 2025 interim ordinary dividend paid in September of US$153.3 million, equivalent to 20.8 cents per share.
ii) The purchase of property, plant and equipment for a total of US$400.1 million.
iii) Dividends and loans paid to non-controlling interest US$105.2 million decreased 11.4% vs 2024.
The sources and uses of funds described above resulted in an increase in net cash of US$1,458.7 million (net increase in cash and other liquid assets), which combined with the US$1,297.8 million balance at the beginning of the year resulted in cash and other liquid assets of US$2,756.5 million at the end of December 2025.
Balance sheet
Fresnillo plc continued to maintain a solid financial position during the period with cash and other liquid funds of US$2,756.5 million as of 31 December 2025. Taking this and the US$839.9 million outstanding Senior Notes, Fresnillo plc's net cash was US$1,916.6 million as of 31 December 2025. This compares positively to the net cash of US$458.3 million as of 31 December 2024.
Inventories increased 4.2% to US$502.6 million, mainly due to the increased inventories of lead and zinc concentrates at Fresnillo and Saucito.
Dividends
Based on the Group's 2025 performance, the Directors have recommended a final ordinary dividend of 108.12 US cents per Ordinary Share, which will be paid on 29 May 2026 to shareholders on the register on 24 April 2026. The dividend will be paid in UK pounds sterling unless shareholders elect to be paid in US dollars. This is in addition to the interim ordinary dividend of 20.8 US cents per share. This is above the Group's traditional dividend policy to pay out 33-50% of the profit attributable to equity shareholders of the company after making certain customary adjustments to exclude extraordinary non-cash effects in the income statement, and was permitted by strong cash generation throughout the year, which resulted in a high cash balance at year end. The company continues to maintain a healthy cash balance to invest in growth focused projects, along with an additional buffer for any M&A opportunities that may present themselves in the future. The dividend policy remains unchanged.
As disclosed in previous reports, the corporate income tax reform introduced in Mexico in 2014 created a withholding tax obligation of 10% relating to the payment of dividends, including to foreign nationals. The 2025 final ordinary dividend will be subject to this withholding obligation.
MANAGING OUR RISKS AND OPPORTUNITIES
Our approach to risk.
Effective risk management is an essential part of our culture and strategy. By understanding, prioritising and managing risk, Fresnillo plc safeguards our people, our assets, our values and reputation, and the environment, and identifies opportunities to best serve the long-term interests of all our stakeholders. We are focused on conducting our business responsibly, safely and legally, while making risk-informed decisions when responding to the opportunities or threats that are presented to us. Risk management is a key accountability and performance criterion for our leaders.
Our risk management process helps us to manage risks that have the potential to impact our business objectives, and timely risk monitoring is at the core of our management practices. All employees have responsibility for identifying and managing risks. Our risk management framework reflects the importance of risk awareness across Fresnillo plc. It enables us to identify, assess, prioritise and manage risks to deliver the value creation objectives defined in our business model.
Risk appetite.
Defining risk appetite is key to embedding our risk management system into our organisational culture. The Company's risk appetite statement helps to align our strategy with the objectives of each business unit, clarifying which risk levels are, or are not, acceptable. It promotes consistent decision-making on risk, allied to the strategic focus and risk/reward balance approved by the Board.
We define risk appetite as 'the nature and extent of risk Fresnillo plc is willing to accept in relation to the pursuit of its objectives'. We look at risk appetite in the context of the severity of the consequences should the risk materialise, any relevant internal or external factors influencing the risk, and the status of management actions to mitigate or control the risk. A scale is used to help determine the limit of appetite for each risk, recognising that risk appetite will change over time.
The risk appetite statement for each principal risk articulates what is an acceptable level of exposure, relative to the amount of reward we are seeking, and helps to determine how much control or mitigating actions may be required.
Risks that are approaching the limit of the Company's risk appetite may require management actions to be accelerated or enhanced to ensure the risks remain within appetite levels. If a risk exceeds appetite, it will threaten the achievement of objectives and may require a change to strategy.
Risk management framework.
Our strategy, values and risk appetite inform and shape our risk management framework. We embed risk management at every level of the organisation to effectively manage threats and opportunities to our business and host communities, and our environmental impact.
Fresnillo plc has an enterprise-wide risk management information system which includes a set of integrated tools and applications to capture, manage and communicate material risks to the business. This system incorporates three lines of defence: 1st line - Unit leaders including mine, exploration and project personnel, as well as leaders of corporate and support areas; 2nd line - Corporate level oversight functions including the risk management team, the Health, Safety, Security, Environment and Community Relations (HSECR) team, the project oversight function and the Executive Committee; and 3rd line - Group Internal Audit.
Governance structure.
This structure shown below supports our risk management framework and enables the effective management of material risks.
|
Top down |
Bottom up |
Board and Committees |
|
||||||
|
Board. Overall responsibility for assessing the nature and extent of principal and emerging risks and the risk appetite of the Company and for facilitating the effective, entrepreneurial and prudent management of the business. |
Audit Committee / HSECR Committee. Responsible for reviewing the effectiveness of the Company's risk management systems and processes. Reviews assurance regarding mitigating controls. |
Internal Audit. Provides independent and objective assurance that risk management, governance and internal control processes are working effectively, thus ensuring that the Company can achieve its objectives. |
|||||||
|
|
|
||||||||
|
Executive management [2] |
Second line of defense |
||||||||
|
Executive Committee. Responsible for the review and assessment of the principal risks and for recommending risk appetite and tolerance to the Board. Develops Company strategy in line with Board appetite. |
Risk management. Responsible for monitoring principal and key risks and ensuring the effectiveness of regional and function risk management. |
||||||||
|
Operations & projects |
Exploration & ore reserves |
Finance |
Legal, ethics & compliance |
Security |
|||||
|
Human resources and union |
Community relations |
Safety & health & ESG |
TI-TO Cyber security |
Insurance policies and coverage |
|||||
|
|
|
||||||||
|
Operational management [3] |
First line of defense |
||||||||
|
Management steer regional departments, providing oversight of risk management in their areas of responsibility. Responsible for identifying, assessing and mitigating both key and operational risks within their functions/business areas. Risks should be discussed as part of country management meetings. |
|||||||||
|
|
|||||||||
|
Strategic risks |
People, operational, safety and communities' risks |
Financial risks |
|||||||
|
- Resources to reserves - Potential actions by the government* - Exploration* - Capital Project* - Technology, Cyber & AI* - Low-carbon transition - Climate change and natural disaster* - Security* |
- People and culture* - Union & labour relations* - Operational, maintenance and planning - Health, safety and environment* - Communities and social* - Ethics and compliance - Tailings dams* |
- Global macroeconomic developments* - Impact of metals prices and exchange rates* - Liquidity - Market - Credit - Tax - Disclosure |
|||||||
*Principal risk
Risk management process.
|
Set strategy, objectives and risk appetite |
1. Risk analysis
Identify, prioritise and evaluate risks to our strategy and objectives |
2. Controls and risk responses
Implement controls and actions to manage risks within risk appetite |
3. Audit & assurance
Check and verify that controls and actions are effective in managing the risks |
4. Communication & monitoring
Communicate principal and emerging risks and escalate as appropriate |
5. Improvement & embedding
Build risk capability and culture so active management is embedded in how we run our business |
6. Resilience
Develop the company's culture and capacity to adapt, resist, absorb and recover from the impact of a risk |
|
First line |
- Assess existing risks and assess new risks in the business units |
- Ensure continuous improvement of processes and controls. - Implement corrective and preventive actions based on the results of leadership team monitoring |
- Control self-certifications |
- Prepare risk dashboards and risk matrices presenting the status of individual risks in the business units |
- Comply with the highest international industry standards in areas such as TSFs |
|
|
Second line |
- Review Key Risk Indicators (KRIs) and mitigating actions |
- Implement controls and mitigations in response to risk scenarios |
- Monitor compliance with international risk standards |
- Carry out ongoing reviews of risks and threats. - Prepare quarterly, half-yearly and annual reports and briefings to the Audit and HSECR Committee |
- Promote the risk culture across the Company through workshops and training |
- Create risk scenarios to anticipate impacts and prepare risk responses |
|
Third line |
|
|
- Execute the annual internal audit programme. |
- Provide advice and recommendations regarding the most exposed or new risks |
|
- Implement appropriate policies and guidelines to build resilience to risks |
|
Culture & leadership |
||||||
1. Risk analysis.
A complete view of our risk universe starts with the analysis of our business, the external environment in which we operate, the regulatory landscape and our internal operations. This includes the impacts on and of our strategy, initiatives, governance, and processes.
The Board, the Audit Committee, the HSECR Committee, the Executive Committee and Internal Audit periodically use working sessions and interviews to review the evolution of principal and emerging risks, as well as the appetite for each risk. At these working sessions, the views and suggestions of Board members are considered, and adjustments are made according to the factors influencing each risk.
We primarily use the following methods in risk assessment:
· Scenario planning
· Horizon scanning
· Real time risk management monitoring
· Social media monitoring
· Collaboration with other organisations such as third-party suppliers
Aspects we review when assessing our principal and key risks:
· Risk ownership: each risk has an owner. In addition, each key risk is sponsored by a member of the Executive Committee who drives the monitoring and progress of mitigation measures.
· Probability and impact: five-by-five scoring matrix applied globally.
· Gross risk: before preventive controls.
· Net risk: after preventive controls have been applied.
· Risk appetite: defined at the principal and emerging risk level and approved by the Board.
· Risk tolerance: in data format, shows the amount of deviation from risk appetite.
· Key risk indicators: quantitative and qualitative measures that provide early signals of a change in the degree of risk.
· Actions: key controls in place and activities required to mitigate them if necessary.
· Impact on the Company´s strategic pillars and interdependencies between key risks.
· Any relevant risks where the principal risk is affected or may affect the emerging risk.
All principal risks are detailed in a standardised statement. This ensures effective review, understanding and monitoring across the Company, together with consistency, both in terminology and in the underlying assessment itself. Following the establishment of climate change as a separate principal risk in 2020/21, reviews have been carried out at various levels, including the Executive Committee and the Board. These include the identification and documentation of climate-related risks and the review and consideration of appropriate risk responses. This consolidated view is an input to our review of the Company's risk profile.
As part of the top-down process, an updated assessment was completed for each principal risk by the relevant risk owner, working with the Executive Committee risk sponsor and the risk function.
The framework is based on ISO 31000 (International standard that provides guidelines and principles for managing risk), ISO 22301 (International standard for Business Continuity Management Systems) and COSO ERM.[4]
Emerging risk considerations.
Emerging risks are very uncertain by nature. Given the diversity of our operations and projects as well as our geographic footprint, we are exposed to many highly uncertain, complex, and often interrelated risks. The Company continues to focus on horizon scanning activity to inform and support the identification of the most pertinent internal and external trends and developments.
We monitor key indicators of emerging risks and their potential impact on our business, markets and host communities. Many emerging risk topics are reviewed on a recurring basis, alongside ongoing activity addressing their impacts. However, it is acknowledged that the nature of the emerging risks will evolve and could drive future trends which the Company will need to prepare for in the long term.
2. Controls and risk responses.
We use five key processes to better address our risks: (i) a monthly procedure for evaluating and mitigating principal risks; (ii) a process to identify and analyse the impact of geopolitical instability on all the Company's risks, including projects, with a main focus on safety and identification of new risks; (iii) dashboards for each business unit to monitor mitigation actions and risk level; (iv) impact and probability scenarios conducted for risks related to security, supply chain of critical inputs for operations, cost increases and projects, and (v) collaboration with government, the mining sector and communities to ensure that we follow best practice.
We have an internal control framework in place to mitigate the impact of principal and emerging risks. Our executives (including operations, exploration and project managers, the controllership group, and the HSECR team), regularly engage in strengthening the effectiveness of our current controls.
In January 2024, the UK Corporate Governance Code was updated, introducing a new requirement (applicable from 2026) for the Board to make an annual declaration as to the effectiveness of the Group's material internal controls. During 2025, with the support of a specialist team and external advice, the comprehensive internal control framework was enhanced to document material financial and non-financial controls, responsibilities and accountabilities and align them with the Company's processes. The material controls related to financial, operational, and information technology processes have already been documented and evaluated, and improvements are planned for 2026 to make the controls more efficient. This has improved risk management, reduced potential negative impacts, and ensured compliance with regulatory requirements for internal controls.
The challenges facing the Risk Department and Executive Committee include changes to mining and water laws in Mexico; security issues near our business units; extreme volatility of gold and silver prices, rising operating costs; potential disruptions in the supply chain for critical inputs; geopolitical instability; and matters relating to our social licence and access to land. Due to the uncertainty surrounding these risks and those arising from new projects such as the acquisition of mining companies, during 2025, in addition to our established risk management activities, all strategic decisions were analysed using risk scenarios that modelled their potential impacts.
3. Audit and assurance.
In pursuing the Company's business objectives, the Board cannot give absolute assurance that the implementation of a risk management process will overcome, eliminate, or mitigate all material risks. However, by developing and implementing an annual and ongoing risk management process to identify, report and manage significant risks, the Board intends to provide reasonable assurance against material misstatement or loss.
We monitor how well we manage material risks to our objectives by checking and verifying the implementation of our response plans (actions and controls) and our actual performance against objectives. We enhance the "check and verify" step by applying the three lines of defence approach.
The internal audit team consists of highly experienced professionals from various specialties, who frequently review operational, financial, exploration and project processes in the field, using international standard tests and methodologies.
|
First line |
-Annual self-assessments of controls and bi-annual compliance assurance statements. |
|
Second line |
-As part of our ERM approach, the risk team conducts specialised reviews to assess risks and controls to ensure compliance, focused on validating and testing key controls to augment the first line attestations. -The risk team annually reviews key controls for our principal risks, significant local risks and response plans to identify and respond to any significant changes in the control environment. While many controls are tailored to business unit requirements, there are consistent themes across our control environment. These include clear oversight and reporting by business unit management teams, governance processes for operations, maintenance and tenders, attention to health and safety, the wellbeing of our people and prioritising the maintenance of integrity and a strong ethical culture. |
|
Third line and external activities |
-We are supported by external partners in certain specialised areas. Furthermore, we are subject to significant assurance activities and third line audits conducted through our Internal Audit team, external third parties, certification standards and customer requirements in our various business lines. -The work plan of the internal audit area considers all the Company's operational and financial processes, continuously following up on the recommendations made in each audit, with a particular focus on the most exposed risks and those that have an impact on regulatory non-compliance or business disruption. -External reviews include those that support the range of ISO certifications we manage across the business as well as independent performance and regulatory reports on Fresnillo plc operations. Examples include: - business continuity risk inspections of all business units by Zurick & Marsh in 2025. - ISO 45001 and ISO 14001 audits of Fresnillo and Saucito mines by BSI Group auditors. - certification that the Herradura mine leaching operations comply with the Cyanide Code issued by the International Cyanide Code Institute. |
|
Governance |
-The HSECR Committee meets before every Board meeting to review the effectiveness of our risk management and internal control systems, with particular attention paid to safety, climate, tailings dams and environmental risks. -The Audit Committee continues to focus closely on key financial processes, material risks and internal control. Further close attention has been given to the key areas of judgement and estimation in the financial statements. The Committee receives regular reports from Internal Audit, Internal Control and Risk Management, enabling it to determine whether internal controls and processes are functioning appropriately. |
4. Communication and monitoring.
Risk can be of any nature and manifest itself and escalate from any part of the business as a threat or even an opportunity. When risks are material to the Company, they are escalated to the Executive Committee and, where appropriate, to the Board or its Committees. This requires a strong risk culture, which we continue to develop and encourage.
Although we deploy controls to reduce the likelihood and consequences of risks, some risks inherent in our business remain. These include natural catastrophes, for which there is limited capacity in international insurance markets. We monitor these threats closely and develop business resilience plans.
The steps of the risk assessment process previously explained allow for analyses, reports and briefings that communicate the results and main findings; this information is mainly presented and discussed at Audit Committee and Board meetings.
5 & 6. Improvement, embedding and resilience.
To ensure that we can prioritise our efforts and resources, we regularly assess the potential consequences and likelihood of impact of our principal risks, creating impact scenarios to implement prevention-mitigation measures and response plans. These assessments, and the effectiveness of our associated controls, reflect management's current expectations, forecasts and assumptions. They involve subjective judgements and depend on changes in our internal and external environment.
The Board confirms that:
- a robust assessment of principal and emerging risks has been carried out.
- with support from the Audit and the HSECR Committees, it has monitored the risk management framework throughout the year.
- it has reviewed the planning, progress and preliminary results of the enhancement of the comprehensive internal control framework.
Principal risks and uncertainties.
The principal risks and uncertainties outlined in this section reflect the risks that could materially affect (negatively or positively) our ability to meet our strategic objectives. They could materialise from a combination of external or internal factors and manifest or escalate from any part of the business as an opportunity or threat.
We define principal risk as "risk, or a combination of risks, which may seriously affect the business model, performance, future or reputation of the Company".
The Company's risk profile has been developed based on the most significant risks in our business profiles. All of our principal risks were reviewed at least twice during the year, including through Key Risk Indicators (KRIs), which were developed to help embed the risk appetite framework in the business and enhance the monitoring and mitigation of risks.
Due to the effects of geopolitical instability, the volatility of prices for precious metals such as gold and silver, as well as insecurity and violence near business units, threats of cyberattacks, and changes in mining industry laws and regulations in Mexico, it has been necessary to reassess the principal risks and reorder their importance, probability, and impact, as well as reassess the related mitigation actions.
Our principal risks are summarised in the following table and shown in order of maximum reasonable consequence, probability and change since 2024.
Current assessment of principal risks, as of February 2026
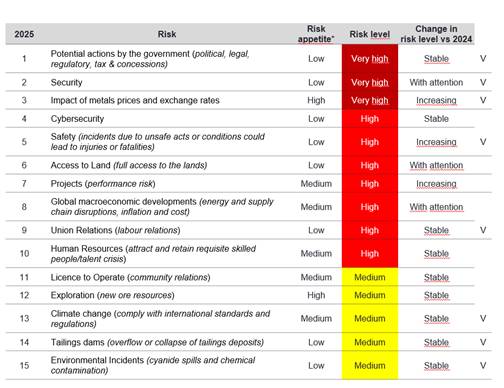 |
|||
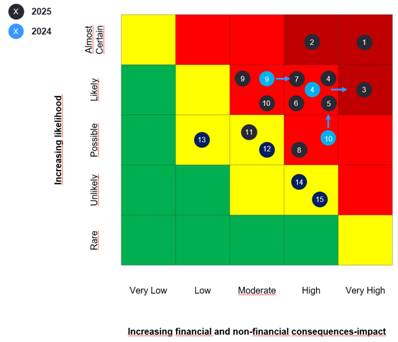 |
|||
|
* Appetite determined by the Board in January 2026. With attention. - Potential for increase in the short term. (V) Risks that were considered for the viability assessment. |
Emerging risks.
As mining is a long-term business, our strategy aims to create sustained value over the life of our mining operations and beyond. This involves careful allocation of key resource inputs - the natural, human, intellectual, financial, manufactured, and social and relationship capitals - which are essential to achieving this aim.
In the longer term, as the world transitions to a low-carbon future and consumer demand for sustainable goods flows through the value chain, the supply-demand dynamics of commodities are expected to shift. This will lead to increasing demand for resources and solutions with low CO2 emissions, and lower social and environmental footprints, in addition to a growing demand for transparent, sustainable and circular value chains.
Fresnillo plc defines an emerging risk as "new manifestation of risk that cannot yet be fully assessed, a risk that is known to some degree but is not likely to materialise or have an impact for several years, or a risk that the company is not fully aware of but that could, due to emerging macro trends in the mid or long-term future, have significant implications for the achievement of our strategic plan". Furthermore, we consider emerging risks in the context of longer-term impact and shorter-term risk velocity. We have therefore defined emerging risks as those risks captured on a risk register that: (i) are likely to be of significant scale beyond a five-year timeframe; or (ii) have the velocity to significantly increase in severity within the five-year period.
Emerging risks constantly change, can materialise quickly, and can significantly affect the company and its operations. Procedures must be in place for continuous monitoring of these risks to allow the company to adapt or develop appropriate actions.
To strengthen our emerging risks management framework, during 2025 we carried out activities to: (i) identify new emerging risks in light of geopolitical instability, technological disruption, the implications of artificial intelligence for business strategy and climate change; (ii) re-assess the emerging risks identified in 2024; (iii) deploy effective monitoring mechanisms recognising the potential for emerging risks to evolve or materialise quickly; (iv) carry out horizon scanning to consider disruptive scenarios, and (v) implement mitigating control actions and enhance our risk awareness culture.
This process involved workshops, surveys and meetings with the Board, Executive Committee, business unit leaders, support and corporate areas, as well as suppliers, contractors and customers. We also consulted third-party information from global risk reports, academic publications, risk consulting experts and industry benchmarks.
Emerging risks can impact our principal risks directly or can become elevated to a standalone principal risk. The way we manage emerging risks is dynamic - it reflects the outcomes of our monitoring and the evolution of the risk as well as findings from our scenario analyses. Managing emerging risks involves staying on top of technological advances in the mining industry and beyond; seeking value-capturing innovations that focus on efficiencies; drawing on new sources of information and working closely with universities specialising in mining and geology; as well as training and upskilling our people.
|
Emerging Risk |
Description |
Timescale |
|
Geopolitical instability |
The potential political, economic, military and social risks that can emerge from a nation's involvement in international affairs. These risks can have far-reaching implications for both the country itself and the global community at large. There are many factors that can contribute to geopolitical risks, such as a nation's economic stability, its political relations with other countries, and its military strength. |
< 1 Year |
|
Transition to a low-carbon future |
The transition to a low-carbon future is a "transition risk" according to the Task Force on Climate-related Financial Disclosures (TCFD) and presents challenges and opportunities for our portfolio in the short and long term. It is considered within the climate change principal risk mitigation strategy. However, we consider this risk to be an emerging risk due to the speed of potential new climate change regulations and the obstacles that government may place in the way of investment support for clean energy. |
> 5 Years |
|
Technological disruption & the rapid proliferation of Artificial Intelligence |
Generative Artificial Intelligence (AI) and advancing technologies have the potential to unlock transformative opportunities for businesses through enhancing efficiency, and data-driven insights to support decision making, driving pace and breadth of innovation. It is also in its infancy, which carries significant unknown risks. Our focus is on robust monitoring and internal upskilling to understand this evolution, supported by strong governance processes to support its use. |
< 3 Years |
|
Increasing societal and investor expectations |
There is increasing expectation and focus on social equality, fairness and sustainability. Financial institutions are also placing greater emphasis on Environmental, Social and Governance (ESG) considerations when making investment decisions. |
< 3 Years |
|
Replacement on depletion of ore reserves |
The inability to replace depleted ore reserves in key business units through exploration, projects or acquisitions. |
> 5 Years |
|
Unexpected mine-closure liabilities that have the potential to increase costs |
There is a possibility that government authorities could introduce more costly and rigorously applied environmental provisions and obligations in the mine closure process. |
> 5 Years |
Emerging risks are currently managed through the Group's risk management framework, which regularly enhances controls and mitigating actions. Emerging risk topics were discussed in executive level committees throughout 2025, with key actions assigned to closely monitor their manifestation and potential opportunities and, in some cases, also form part of the business planning process.
1
Potential actions by the government (political, legal, regulatory, tax & concessions)
|
Risk description |
|
Regulatory initiatives or policies issued by the government, at all three levels - federal, state and municipal - may have an adverse impact on the operation of the Company. This could include new laws, regulations, rules or guidelines with a negative impact on the mining industry in Mexico. The prohibition on granting new mining concessions continues under the new federal government administration.
There have also been complications around obtaining permits and licences for construction and environmental matters from the Ministry of Economy and the Ministry of Environment.
Recent changes to Mexico's water law could complicate the process of maintaining and obtaining water concessions. We paid special attention to the following aspects: · Permits for building/expanding tailings dams and projects. · Inability to obtain necessary water concessions due to government control or private interests. · Prohibition of new concessions for open-pit mining. · Discrepancies in the criteria used in audits carried out by the tax authority. · Possible new environmental taxes or royalties on the mining industry. · Possible profit sharing with indigenous communities. · Potential trade disputes and new labour regulations under the United States-Mexico-Canada Agreement. |
|
Factors contributing to risk |
|
A considerable level of uncertainty is likely to dominate the Mexican legal landscape for the foreseeable future, with potential impacts on the timing, consistency and nature of legal decisions, including: - Delays or failures in obtaining permits and licences from government offices such as CONAGUA and SEMARNAT. - Reorganisation of the Mexican Supreme Court and election of Justices and Federal Judges by popular vote. - New judicial administration body and new judicial discipline tribunal. - Legal reforms to the following laws: "Mining Law", "Law on National Waters", "Law on Ecological Balance and Environmental Protection" and "General Law for the prevention and integrated management of waste in the field of mining and water concessions", impacting on the granting of new concessions and their duration, exploration activities and consultation with communities and indigenous peoples as well as payments of 5% of profits to the communities. - Tax audits and information requests have increased. |
|
Controls, mitigating actions and outlook |
|
1. As a result of the new mining law, risk scenarios were developed for each change and impact, considering the legal and operational criteria to implement the necessary mitigation and prevention measures. These scenarios are constantly updated. 2. Commitment to constant communication with all levels of government. 3. Increased monitoring of the processes being implemented at the Ministry of Energy, Environment, Labour and Economy and daily monitoring, follow-up and attention to issues before the Congress of the Union that may affect the mining industry. 4. Collaboration with other members of the mining community through the Mexican Mining Chamber to lobby against any new harmful taxes, royalties or regulations. Support for industry lobbying efforts to improve the general public's understanding of the mining industry.
|
|
Link to strategy |
Risk appetite |
|
1 - 2 - 3 - 4 |
Low |
|
Risk owner |
Risk oversight |
|
· Government Relations Department · Legal Department · Taxes and royalties Department · Mining and water concessions Department |
· The Board · Audit Committee |
|
Behaviour |
Risk rating (relative position) |
|
Stable |
2025: Very high (1) 2024: Very high (1) |
2
Security
|
Risk description |
|
In all our business units, we face the risk of theft, which can occur within the mines or during transportation. Our employees, contractors and suppliers are also at risk of violence due to insecurity in some of the regions in which we operate. According to information from the Ministry of Security and Citizen Protection and the National Guard, the presence of organised crime and high impact crimes (homicide, kidnapping and extortion) increased in 2025, especially in the states where our business units are located such as Zacatecas, Sonora and Guanajuato.
The main risks we face are: · High-impact thefts in ore transportation, most notably of gold doré and silver concentrates. · Theft of assets such as vehicles, equipment, spare parts and fuel. · Homicide. · Kidnappings. · Extortion. · Vandalism. · Consumption and sale of toxic substances in our mining units. |
|
Factors contributing to risk |
|
The remote nature of many of our locations and projects. Increase in mineral theft during transport on roads near business units. Presence of organised crime in areas near business units that could lead to theft and extortion. Influence of and territorial disputes between drug cartels, organised crime and anarchy in some regions of Mexico where we have operations, projects and exploration camps, especially close to our operations in Fresnillo, Zacatecas; Caborca, Sonora; and in the mountains of Durango and Chihuahua. |
|
Controls, mitigating actions and outlook |
|
1. Our property security teams closely monitor the security situation, maintaining clear internal communications and coordinating work in areas of greater insecurity. 2. We maintain close relationships with authorities at federal, state and local levels. 3. We interact and meet regularly with representatives of the National Guard and also the Army and the Navy in some cases. There are military installations located near most of our operations. 4. We continue to implement greater technological and physical security at our operations including: - the use of a remote monitoring process at the Herradura, Noche Buena, San Julián, Juanicipio, Saucito and Fresnillo mines; - local operating and command centres for each business unit in the Saucito, Fresnillo and Juanicipio mines; 5. Increase in logistical controls to reduce the potential for theft of mineral concentrate such as: - real-time tracking technology; - surveillance cameras to identify alterations in the transported material; - protection and support services on distribution routes; - reduction in the number of authorised stops to optimise delivery times and minimise exposure of trucks transporting ore concentrates or doré. 6. We continue to invest in community programmes, infrastructure improvements and government initiatives to support the development of legal local communities and discourage criminal acts. 7. To combat drug consumption we have: - increased the number of anti-doping tests conducted at the start of the day in the mining units; - carried out frequent inspections outside and inside the mines to verify that drugs are not consumed or sold; - introduced drug consumption prevention campaigns, focused on employees. |
|
Link to strategy |
Risk appetite |
|
1 - 2 - 3 - 4 |
Low |
|
Risk owner |
Risk oversight |
|
· Security Department · Legal Department |
· Audit Committee · Executive Committee |
|
Behaviour |
Risk rating (relative position) |
|
With attention |
2025: Very high (2) 2024: Very high (2) |
3
Impact of metals prices and exchange rates
|
Risk description |
|
Our financial results are heavily dependent on commodity prices - principally gold and silver. There is an inherent risk when investing or planning for the future prices of these precious metals.
The volatility of these prices is high and unpredictable and are strongly influenced by a variety of external factors, including wars, geopolitical disruption, world economic growth, inventory balances, industry demand and supply, and possible substitution, among others.
Our sales are mainly denominated in US dollars, although some of our operating costs are in Mexican pesos. Thus, any strengthening of the Mexican peso may negatively affect our financial results. |
|
Factors contributing to risk |
|
Gold and silver prices in 2025 experienced a historic increase, with silver rising by up to 150% and gold increasing by more than 60%, driven by safe-haven demand, geopolitical fears and strong industrial purchases. Silver closed 2025 above $70-$75 per ounce, while gold reached record highs above $4,500.
Macro-economic and geopolitical factors that directly affect the price of commodities, both positively and negatively, such as the war between Ukraine and Russia, trade tensions in the US-China relationship, US policy in Latin America against drug cartels, especially the situation with Venezuela and Mexico and change in US monetary policy, with the Federal Reserve making multiple interest rate cuts during the year and markets betting on further easing in 2026.
Increased attraction of investing in instruments such as cryptocurrencies could lead to investors reducing their investment activities in precious metals. |
|
Controls, mitigating actions and outlook |
|
1. We consider exposure to commodity price fluctuations an integral part of our business and our usual policy is to sell our products at prevailing market prices although we do have a hedging policy for precious metals. 2. We monitor the commodity markets closely to determine the effect of price fluctuations on earnings, capital expenditure and cash flows., when we feel it is appropriate, we use derivative instruments to manage our exposure to commodity price fluctuations. We run our business plans through various commodity price scenarios and develop contingency plans as required. 3. We have hedging policies for exchange rate risk, including those associated with project-related capex. 4. We focus on cost efficiencies and capital discipline to deliver competitive all-in sustaining cost.
|
|
Link to strategy |
Risk appetite |
|
1 - 2 - 3 |
High |
|
Risk owner |
Risk oversight |
|
· Financial Planning · Treasury |
· The Investment Committe · Audit Committee |
|
Behaviour |
Risk rating (relative position) |
|
Increasing |
2025: Very High (3) 2024: High (4) |
4
Cybersecurity
|
Risk description |
|
Information is an asset that must always be protected. This requires maintaining confidentiality and integrity and ensuring the availability of information security management throughout all business processes. Breaches in, or failures of, our information security management could adversely impact our business activities. Malicious interventions (hacking) of our information or operations' networks could affect our reputation and/or operational continuity. Poor information security could lead to loss or harm to our technical infrastructure and the use of our technology by malicious persons or bodies. The list below shows our top eight cybersecurity and privacy risks: 1. Corruption of data - Critical data where any unauthorised modification can have adverse impacts. 2. Unauthorised access - Cybersecurity and privacy incidents due to incorrect access permissions or system abuse, exploitation, or misuse. 3. Breach and data theft - Disclosure of critical and sensitive company data by an internal or external source. 4. Business disruption - Disrupting key applications or systems for a period. 5. Lack of cybersecurity ownership - Failure to assign responsibility for implementing and adopting cybersecurity practices daily. 6. Non-compliance - Cybersecurity and privacy incidents resulting in non-compliance with applicable regulations, including privacy. 7. Health and safety incidents - Breach of availability, integrity or confidentiality of data which impacts health and safety. 8. Halt or loss of operations - Cybersecurity and privacy incidents which result in loss of operating licence or closure of operations. |
|
Factors contributing to risk |
|
Globally, cyber-attacks have increased in frequency and impact across all industries; we suffered a cybersecurity incident (partial disruption of services) in July 2024, which had negative consequences for the Group (Peñoles and Fresnillo plc). Rising geopolitical tensions. Heavy reliance on technology and automated systems to support operations within the mining industry. The industrial and mining sectors are seen to have a significantly weak level of protection, while the damage that can be caused is very high. Global and national cybersecurity and cybercrime regulations that could deter criminals are still developing and are not yet sufficiently mature. |
|
Controls, mitigating actions and outlook |
|
Our cybersecurity programme, aligned with business strategies, is based on a governance model with three lines of defence, involving all operational, tactical, and strategic business levels to prevent and mitigate the effects of computer risks. Our approach is also based on the NIST Cybersecurity Framework which is used to assess and improve our ability to prevent, detect, and respond to cyber-attacks. 1. We maintain continuous awareness of cybersecurity at all levels of the organisation, through workshops, communications, campaigns, and exercises that allow us to understand and increase our cybersecurity culture. As cybersecurity is a risk that requires more active involvement of Executive teams, we carried out awareness and training exercises focused on this level during 2025. 2. The Security Operations Centre (SOC) provides analytics that correlate information from multiple business unit sources, helping us to easily identify the impact of a threat and address the incident in a timely manner. 3. Cybersecurity incident response plans are in place and regularly assessed to ensure we can respond quickly and effectively to cybersecurity incidents. 4. We conduct ongoing assessments of the technology controls implemented in our operations and services. 5. Constant threat intelligence monitoring enables us to analyse cybersecurity trends, and to adjust our operations to anticipate and apply necessary controls. 6. In addition, our systems, networks, and assets are continuously monitored through cybersecurity tools that use Artificial Intelligence and Machine Learning technology to analyse behaviours in the organisation's networks, identifying and mitigating advanced threats. 7. Controls are in place to comply with the 'Ley Federal de Protección de Datos Personales en Posesión de Particulares' (LFPDPPP). 8. During the year, we carried out the second phase of auditing our Personal Data Management System with the NYCE office, with the objective of achieving certification in our business units. Our plan for 2026 is to focus our efforts on mitigating cyber risks, implementing and maturing controls in line with the threat landscape and emphasising the importance of individual employee responsibility to remain vigilant and alert to cyber threats.
Risk Assessment, Disaster Recovery Plans, Data Loss Prevention, Pen testing, IT/OT Network Behavioural Analysis, and targeted security enhancements for Operational Technology (OT) environments are among the initiatives that will increase our Level of Cybersecurity Maturity (based on NIST CSF). |
|
Link to strategy |
Risk appetite |
|
2 - 3 |
Low |
|
Risk owner |
Risk oversight |
|
· IT & TO Department · Cybersecurity Office |
· The Cyber Security Committee · Audit Committee |
|
Behaviour |
Risk rating (relative position) |
|
Stable |
2025: High (4) 2024: High (3) |
5
Safety (incidents due to unsafe acts or conditions could lead to injuries or fatalities)
|
Risk description |
|
The mining industry is inherently dangerous. Major hazards across our operations and projects include process safety, underground mining, surface mining and tailings and water storage.
Our workforce faces risks such as fire, explosion, electrocution and carbon monoxide poisoning, as well as risks specific to each mine site and development project. These include rockfalls caused by geological conditions, cyanide contamination, explosion, becoming trapped, electrocution, insect bites, falls, heavy or light equipment collisions involving machinery or personnel and accidents occurring while personnel are being transported.
These risks have the potential to cause death, illness or injury, damage to the environment, and disruption to communities. A poor safety record or serious accidents could have a long-term impact on morale and on our reputation and productivity, among these, the following stand out: · Rockfall/terrain failure. · Loss of vehicle/equipment control. · Team-vehicle-person interaction. |
|
Factors contributing to risk |
|
In 2025, we unfortunately experienced two fatalities (one in Juanicipio and another in Cienega), increasing the degree of risk. Frequent transportation of our people to remote business units is an ongoing feature of our operations. In many cases, these units have poor accessibility by road.
Failure to comply with safety programmes, measures and audits or with the findings of inspections.
High turnover of workforce, including contractors. |
|
Controls, mitigating actions and outlook |
|
1. Nothing is more important than the safety and wellbeing of our employees, contractors and communities. Our objective is first and foremost to have zero fatalities. We believe all incidents and injuries are preventable, so our focus is on identifying, managing and, where possible, eliminating risks. We constantly seek to improve our safety and health risk management procedures, with focus on the early identification of risks and the prevention of fatalities.
2. We are raising awareness of the risks generated by our operational activities. This includes quarterly meetings on the main safety risks at each mining unit, projects and exploration sites, overseen by the Executive Committee.
3. Continuing the implementation of the "I Care, We Care" programme in all our operations, including strengthening the programme's five lines of action.
4. We are reinforcing the four pillars of our "Safety and Occupational Health" strategy: a. Safety and health risk management: workers at all levels are able to identify hazards and controls, so that all jobs are carried out safely. b. Leadership: all employees and contractors are health and safety leaders, and we demonstrate our commitment through each individual's responsible behaviour. c. Contractor management: our contractors are an integral part of our safety team and culture, and we work together to improve. d. Reporting, research and learning from our accidents: we share good practices and learn from our mistakes.
5. We have implemented technical and safety standards and procedures for slope geotechnical, tailings management, underground mining and process safety.
6. We are advancing the automation of hazardous processes.
7. The critical controls that reduce risk in the business units are periodically updated and improved through inspections and performance evaluations, which are carried out by the safety team, external auditors such as 'Real Safety' and by government authorities such as the Ministry of Labour and PROFEPA.
|
|
Link to strategy |
Risk appetite |
|
3-4 |
Low |
|
Risk owner |
Risk oversight |
|
· Safety · Human Resources |
· HCSER Committee |
|
Behaviour |
Risk rating (relative position) |
|
Increasing |
2025: High (5) 2024: High (10) |
6
Access to land (full access to plots of land)
|
Risk description |
|
Significant failure or delay in accessing surface land above our mining concessions and other lands of interest is a permanent risk to our strategy and has a potentially high impact on our objectives.
The biggest risk is failing to gain full control of the lands where we explore or operate.
Possible barriers to access to land include: · Increasing landowner expectations. · Refusal to comply with the terms of previous land acquisitions and conditions regarding local communities. · Influence of multiple special interests in land negotiations. · Conflicts regarding land boundaries, and the subsequent resolution process. · Succession problems among landowners resulting in a lack of clarity about the legal right to own and sell land. · Risk of litigation, such as increased activism by agrarian communities and/or judicial authorities. · Presence of indigenous communities in proximity to lands of interest, where prior and informed consultation and consent of such communities are required. |
|
Factors contributing to risk |
|
The new mining law complicates efforts to regularise access to land and the procedures for obtaining new permits.
It is becoming increasingly difficult to negotiate land prices, with landowners demanding more money and benefits for access to land.
Social insecurity prevailing in the regions where our mining interests are located may not allow the necessary work to be carried out to demonstrate the minimum investments required by law, leading to the possible cancellation of the concession.
The Federal Government is continuing its policy of not granting new mining concessions. |
|
Controls, mitigating actions and outlook |
|
1. We undertake meticulous analysis of exploration objectives and construction project designs to minimise land requirements. 2. Initiatives undertaken to secure access to land in areas of strategic interest or value include: · Judicious use of lease or occupation contracts with purchase options, in compliance with legal and regulatory requirements. · Early participation of our community relations teams during the negotiation and acquisition of socially challenging objectives. · Strategic use of our social investment projects to build trust. · Close collaboration with our land negotiation teams, which include specialists hired directly by Fresnillo and provided by Peñoles as part of the service agreement. 3. We perform ongoing reviews of the legal status of our land rights, identifying certain areas of opportunity and continuing to implement measures to manage this risk on a case-by-case basis. Such measures include, wherever possible, negotiations with agricultural communities for the direct purchase of land. 4. We use mechanisms provided for in agricultural law as well as other legal mechanisms under mining legislation that provide greater protection for land occupation. 5. We negotiate carefully with the government on concessions with geological mining interest that have already been granted. |
|
Link to strategy |
Risk appetite |
|
1 - 2 - 3 |
Low |
|
Risk owner |
Risk oversight |
|
· Legal Department · Community Relations |
· Audit Committee |
|
Behaviour |
Risk rating (relative position) |
|
With attention |
2025: High (6) 2024: High (6) |
7
Projects (performance risk-greenfield projects)
|
Risk description |
|
The pursuit of advanced exploration and project development opportunities is essential to achieving our strategic goals. However, this carries certain risks: · Current or new government regulations that obstruct, limit or restrict the granting of mining concessions; delay or failure to obtain permits, licences, authorisations, etc. · Economic viability: the impact of the cost of capital to develop and maintain the mine; future metals prices; and operating costs throughout the mine's life cycle. · Access to land: a significant failure or delay in land acquisition has a very high impact on our projects. · Delivery risk: projects can exceed budget in terms of cost and time; they cannot be built according to the required specifications or there may be a delay during construction; and major mining teams cannot be delivered on time. · Other uncertainties such as: fluctuations in the degree of ore and recovery; unforeseen complexities in the mining process; poor quality of the ore; unexpected presence of groundwater or lack of water; lack of energy, lack of community support; and inability or difficulty in obtaining and maintaining the required building and operating permits.
The following risks relate specifically to prospective projects in Chile and Peru: · Government instability, especially in Peru. · Potential actions by the government (political, legal, regulatory and tax). · Security. · Licence to operate (community relations) · Access to water (national regulation and geographic complications). · Environmental compliance. · Competition for land (threat from green power generation companies, for example thermosolar). · Informal mining. · Industrial safety compliance (National Geological and Mining Service SERNAGEOMIN). · Increased mining taxes and fees. |
|
Factors contributing to risk |
|
In 2025, progress on projects was hampered by the government's failure to issue permits and licences, the presence of organised crime near the projects, a lack of electricity and diesel fuel, a shortage of water, and the lack of full land rights. Prohibition of new open-pit mining concessions. Uncontrolled increases in the costs of critical inputs directly affecting the planning and progress of projects. In some regions there are no specialised contractors or contractors with the technology to develop the projects. Contractor productivity may be lower than anticipated, causing delays in the programme. Increase in the number of high impact crimes (homicide, kidnapping, extortion) in the regions of the projects.
We have identified the following threats to project development: · Insufficient resources for project execution. · Changes in operational priorities that can affect projects. · Inadequate management structure for project supervision. · Delays in obtaining necessary permits for construction and operation. · Lengthy procedures for land acquisition, electricity supply and water. |
|
Controls, mitigating actions and outlook |
|
1. Our investment assessment process determines how best to manage available capital using the following criteria: • Technical: we evaluate and confirm the resource estimate; conduct metallurgical research of mineral bodies to optimise the recovery of economic elements; calculate and determine the investment required for the overall infrastructure (including roads, energy, water, general services, housing) and the infrastructure required for the mine and plant. • Financial: we analyse the risk in relation to the return on the proposed capital investments; set the expected Internal Rates of Return (IRR) per project as thresholds for approving the allocation of capital based on the current value of expected cash flows of invested capital; and perform stochastic and probabilistic analyses. • Qualitative: we consider the alignment of investment with our Strategic Plan and business model; identify synergies with other investments and operating assets; and consider the implications for safety and the environment, the safety of facilities, people, resources and community relations. 2. The management of our projects is based on the Project Management Body of Knowledge (PMBOK) standard of the Institute of Project Management (PMI). It allows us to closely monitor project controls to ensure the delivery of approved projects on time, within budget and in accordance with defined specifications. The executive management team and the Board of Directors are regularly updated on progress. 3. Each advanced exploration project and major capital development project has a risk record containing the project-specific identified and assessed risks.
|
|
Link to strategy |
Risk appetite |
|
2 |
Medium |
|
Risk owner |
Risk oversight |
|
· Projects · Legal · Community Relations · Access to Land Department |
· Audit Committee · The Investment Committee |
|
Behaviour |
Risk rating (relative position) |
|
Increasing |
2025: High (7) 2024: High (9) |
8
Global macroeconomic developments (energy and supply chain disruptions, inflation and cost)
|
Risk description |
|
Geopolitics has the potential to increase trade tensions, affecting rules-based trading systems. Trade measures can impact our markets, operations or key projects, limiting the advantages of being a multinational company with a global presence and leading to increased costs.
Disruptions or restrictions in the supply of critical operating inputs such as steel, cyanide, copper, diesel, transport equipment, oxygen and truck tyres, electricity, diesel and gas, steel, sulphuric acid or mining equipment spare parts (supplied mainly by land transport from the US and by sea from China and Europe) could negatively affect production or increase costs. |
|
Factors contributing to risk |
|
The 2026 review of the USMCA (United States-Mexico-Canada Agreement) which could lead to increased costs or shortages of critical supplies for operations, as well as impacts on labour arrangements.
Indirect impacts of the war in Ukraine and conflict in Latin America due to US policies against drug cartels, especially in Venezuela and Mexico.
Lack of electricity infrastructure of the state-owned company (Comisión Federal de Electricidad CFE), which supplies energy in Mexico.
Possible inflation growth in Mexico. |
|
Controls, mitigating actions and outlook |
|
1. We execute operational excellence initiatives to counter inflation and improve margins, and also enhance cost competitiveness by improving the quality of the portfolio. 2. We maintain a rigorous, risk-based supplier management framework to ensure that we engage solely with reputable product and service providers, supported by the necessary controls to ensure the traceability of all supplies (including avoiding any conduct related to modern slavery). 3. To achieve cost competitiveness, we endeavour to buy the greatest possible proportion of our key inputs, such as fuel and tyres, on as variable a price basis as possible and to link costs to underlying commodity indices where this option exists. 4. We are committed to incorporating sustainable technological and innovative solutions, such as using sea water and renewable power when economically viable, to mitigate exposure to potentially scarce resources.
|
|
Link to strategy |
Risk appetite |
|
1 - 2 - 3 |
Medium |
|
Risk owner |
Risk oversight |
|
· Procurement and contracts · Operational Comptrollers · Financial Planning |
· Audit Committee |
|
Behaviour |
Risk rating (relative position) |
|
With attention |
2025: High (8) 2024: High (5) |
9
Union relations (labour relations)
|
Risk description |
|
Our highly skilled unionised workforce and experienced management team are critical to sustaining our current operations, executing development projects and achieving long-term growth without major disruption. We are committed to safety, non-discrimination, diversity and inclusion, and compliance with Mexico's strict labour regulations. The Labour Reform allows the existence of several unions within a company and gives freedom of choice to the employee. This has led to a complex, rarefied work environment at the Fresnillo mine, with violent clashes between the union and a group of workers seeking to register a new independent union. The risk is that the fighting will continue and worsen, eventually reducing the mine's workforce. There is also a risk that this conflict could spread to other mines. There is a risk of strikes or illegal work stoppages at some of our mining units by workers who do not agree with profit sharing or some of its benefits, mainly at the Herradura mine. |
|
Factors contributing to risk |
|
In 2026, elections will be held for important union positions in several business units, and the collective labour agreement will be reviewed. This could create tension in the workplace. We run the risk of an outside union seeking to destabilise the current union. We could also be adversely affected by national union politics. |
|
Controls, mitigating actions and outlook |
|
1. We remain attentive to any developments in labour or trade union issues. Our executive leadership and the Executive Committee recognise the importance of trade union relations and follow any developments with interest. Our strategy is to integrate unionised personnel into each team in the business unit. We achieve this by clearly assigning responsibilities and through programmes aimed at maintaining close relations with trade unions in mines and at the national level. 2. Long-term labour agreements (usually three years) are in place with all the unions at our operations, helping to ensure labour stability. 3. We seek to identify and address labour issues that may arise throughout the period covered by the labour agreements and to anticipate any potential issues in good time. When appropriate, we hire experienced legal advisors to support us on labour issues. 4. We have increased communication with trade union leaders in mining units to monitor the working environment and conducted a review of the contractual benefits for union members in our mines. 5. We maintain constructive relationships with our employees and their unions through regular communication and consultation. We are proactive in our interactions with trade unions, and their representatives and leaders at various levels of the organisation are regularly involved in discussions about: - the future of the workforce. - the economic situation facing the industry. - our production results. 6. We encourage union participation in our security initiatives and other operational improvements. These initiatives include the Security Guardians programmes, certification partnerships, integration of high productivity equipment, and family activities.
|
|
Link to strategy |
Risk appetite |
|
2 - 3 |
Low |
|
Risk owner |
Risk oversight |
|
· Human Resources · Legal |
· Audit Committee · People & Remuneration Committe |
|
Behaviour |
Risk rating (relative position) |
|
Stable |
2025: High (9) 2024: High (7) |
10
Human resources (attract and retain requisite skilled people / talent crisis)
|
Risk description |
|
Our ability to achieve our operating strategy depends on attracting, developing and retaining a wide range of skilled and experienced people, not only our own employees but also those of our contractors. Managing talent and maintaining a high-quality workforce in a rapidly changing technological and cultural environment is a key priority for us. Any failure in this regard could negatively impact current operating performance and future growth prospects. We face multiple risks in the processes of recruiting, hiring, training and retaining talented, skilled and experienced people: - Sourcing skilled labour in the mining sector has become a major risk, and our industry requires an increasing number of people who are trained and experienced in mining processes. - Digital and technological innovation has the potential to generate substantial improvements in the Company's productivity, safety and environmental management. There is a risk that our workforce will be unable to transform to the extent necessary or will be resistant to change and unwilling to accept the impact of automation or to acquire new technological skills. - The lack of reliable contractors with sufficient infrastructure, machinery, performance history and trained personnel is also a risk that could affect our ability to develop and build mine sites. In addition, contractual terms prohibit us from hiring specialised personnel from business partners or contractors. |
|
Factors contributing to risk |
|
In Mexico, federal labour law is in the process of gradually reducing the working week from 48 to 40 hours. This change is being implemented gradually between 2026 and 2030, without any reduction in salaries, resulting in the need to create an additional shift. The shortage of skilled and experienced technical labour in the mining industry is leading to increased competition in the regions where we operate. In certain regions, there are not enough candidates with the necessary skills to operate mining equipment. Several of our business units are located in remote regions with limited and complex access, making it difficult to find skilled labour in those regions. Evolving societal expectations are putting pressure on our corporate and employer brand: who we are and what we stand for. |
|
Controls, mitigating actions and outlook |
|
1. We enhance the talent of our employees through training and career development, invest in initiatives to broaden the talent pool and are committed to our diversity and inclusion policy. Through these actions we aim to increase employee retention, as well as the number of women, people with disabilities and employees with international experience in the workplace. 2. Our employee performance management system is designed to attract and retain key employees by creating appropriate reward and remuneration structures and providing personal development opportunities. We have a talent management system in place to identify and develop internal candidates for key management positions, as well as to identify suitable external candidates where appropriate. 3. We aim for continuous improvement, driven by opportunities for training, development and personal growth; in short, we focus on fair recruitment, fair pay and benefits, and gender equality. 4. Our goal is to be an employer of choice, and we recognise that in order to be a profitable and sustainable business, we need to create value for our employees and their families. We do this by providing a healthy, safe, productive and team-oriented work environment that not only encourages our people to reach their potential but also supports process improvement. 5. A renewed approach to talent management has been implemented in the human resources areas of the business units. This ensures that all our employees have a meaningful conversation about their performance, motivations and experience, as well as a quality development plan that enables them to acquire the skills and experience they need for the future. 6. Employees who live far away from the business units are permanently supported with transportation, medical care for them and their families, health and nutrition programmes with access to high quality food, and support with clothing and accessories to protect them from changes in the weather. 7. A global graduate programme and strategic partnerships are in place to establish mutually beneficial relationships with universities and schools specialising in mining and geology. 8. We have established local internship training programmes as well as other future skills development partnerships. 9. We have continued our performance appraisal process, reinforcing formal feedback. We promote certification of key technical competencies for operational staff and have implemented a leadership and management competency development programme for required positions. We develop our high-potential middle managers through the Leaders with Vision programme. 10. Ongoing training workshops are held for staff by business partners and contractors, focusing on new technologies and best practices in the mining industry. Our partners include Caterpillar, Matco, Epiroc, Robbins and Sandvik, among others.
|
|
Link to strategy |
Risk appetite |
|
1 - 2 - 3 - 4 |
Medium |
|
Risk owner |
Risk oversight |
|
· Human Resources |
· Audit Committee · People & Remuneration Committe |
|
Behaviour |
Risk rating (relative position) |
|
Stable |
2025: High (10) 2024: High (8) |
11
Licence to operate (community relations)
|
Risk description |
|
Locally and globally, the mining industry's stakeholders have high expectations relating to social and environmental performance. These expectations go beyond the responsible management of negative impacts to include continuous engagement and contribution to stakeholder development. Failure to adequately address these expectations increases the risk of opposition to mining projects and operations. Negative sentiment towards mining or specifically towards Fresnillo plc could have an impact on our reputation and acceptability in the regions where we have a presence. We monitor the following risks: · Negative perception of the Company's social and environmental performance. · Failure to identify and address legitimate concerns and expectations of the community and of society at large. · Insufficient or ineffective engagement and communication. · Failure to contribute purposefully to community development. |
|
Factors contributing to risk |
|
Higher expectations and scrutiny of social and environmental performance. Increasing expectations of shared benefits associated with land agreements. Perceived competition for access to natural resources, notably water. Significant reduction in government spending on community infrastructure, development programmes and services. Anti-mining activism fuelling opposition to our industry. Community concerns about insecurity, access to water and the environmental impact of a. our operations. |
|
Controls, mitigating actions and outlook |
|
1. We hold regular meetings with key community stakeholders to share information about the company, and its social and environmental practices. 2. An internet communication channel was implemented in 2025 which makes it possible to capture concerns from the community, with cases remaining anonymous if requested. This initiative has extended our ability to interact virtually with communities as effectively as we do when issues are raised in-person. The module is proving especially valuable in instances where people are using digital technology to explore our company and key issues. 3. We closely monitor threats and opportunities in the communities associated with our operations by maintaining constant and direct contact with the leaders of each business unit, by carrying out social studies and media monitoring, and through our complaints and claims process. 4. Governance over the complaints process is improving every year. Complaints are received, assessed and managed, involving line managers, while dissatisfied stakeholders are kept informed of the status of each case, until satisfactory closure agreements are reached. 5. We deploy social programmes in the communities near the business units, including support for schools, clinics and health, the supply of medicines, nutrition and food, as well as maintenance of roads and bridges and water supply.
|
|
LINK TO STRATEGY |
RISK APPETITE |
|
1 - 2 - 3 - 4 |
Medium |
|
Risk owner |
Risk oversight |
|
· Community Relations · Human Resources |
· HCSER Committee |
|
BEHAVIOUR |
RISK RATING (RELATIVE POSITION) |
|
Stable |
2025: Medium (11) 2024: Medium (11) |
12
Exploration (new ore resources)
|
Risk description |
|
We are highly dependent on the success of the exploration programme to meet our strategic value-creation targets and our goals for long-term production and reserves. Maintaining a reasonable investment in exploration, even when metals prices are low, has been our policy through the years. While continuous investment has always been a hallmark of our exploration strategy, replenishing exploited reserves and increasing our total amount of resources could be a challenge in the future. The growing level of insecurity, a more challenging land access scenario, and delays in obtaining government permits detailed previously, translates into a longer timeframe to deliver new discoveries and improve the category of resources. In addition, difficulties in obtaining new mineral concessions could hamper exploration in new target areas. |
|
Factors contributing to risk |
|
In Mexico, the mining legislation enacted in 2024 establishes that exploration activities in new concessions will be carried out only by the Mexican Geological Services assigned to the Ministry of Economy. New concessions would be granted through a bidding process following exploration orders submitted to the Service. However, pre-existing concessions may continue to be explored by their holders and may be commercialised upon authorisation by the federal Ministry of Economy. Fresnillo plc's concessions will allow the company to continue its brownfield and greenfield exploration programmes, at least in the medium term. Access to new concessions will be difficult. This year, the exploration programme has been complicated and delayed mainly for the following reasons: · Restrictions on new mining concessions. · Delays in procedures regarding access to land. · Presence of organised crime (insecurity) in the regions where we have projects and exploration camps. · Delays and failures to obtain permits and licences from government authorities. · Increased exploration costs. · In Chile, risk factors include: lack of water in the Atacama Desert in the north and possibility of conflict with forestry or agricultural interests in the south; overall higher costs compared to those in Mexico; seasonal restrictions to exploration in the High Andes; scarcity of open grounds for staking; poor infrastructure in remote zones; the presence of anti-mining communities or NGOs; and strong competition for mining claims and staff. · In Peru, the main risk factors include: the long lead time required to obtain social permits (emphasising the need for strong community relations teams and programmes); delays in obtaining government permits; poor infrastructure in mountainous regions; the presence of anti-mining communities or NGOs; and the possibility of invasion by illegal miners. |
|
Controls, mitigating actions and outlook |
|
1. Increasing regional exploration drilling programmes to intensify efforts in the districts with high potential. 2. Carrying out aggressive local exploration drilling programmes to upgrade the resources category and convert inferred resources into reserves. 3. A team of highly trained and motivated geologists, including both employees and long-term contractors. 4. Advisory technical reviews by international third-party experts and routine use of up-to-date and integrated GIS databases, cutting edge geophysical and geochemical techniques, large to small scale hyperspectral methods, remote sensing imagery, and analytical software that identifies favourable regions for field-checking by the team. 5. The maintenance of a pipeline of drill-ready high priority projects.
|
|
Link to strategy |
Risk appetite |
|
1 |
High |
|
Risk owner |
Risk oversight |
|
· Exploration · Projects · Legal |
· The Board · The Investment Committe |
|
BEHAVIOUR |
RISK RATING (RELATIVE POSITION) |
|
Stable |
2025: Medium (12) 2024: Medium (12) |
13
Climate change
|
Risk description |
|
The mining industry is highly exposed and sensitive to climate change: - Societal responses to the transition to a low-carbon economy include stricter regulations to reduce emissions, a transformation of the global energy system, changes in behavioural and consumption choices, and emerging technologies.
- Our operations and projects are expected to face severe physical risks from extreme weather events, such as high temperatures, drought and extreme rainfall from more frequent and intense hurricanes in the Pacific Ocean. These potential natural disasters can affect the health and safety of our people, damage access roads and mine infrastructure, disrupt operations and impact our neighbouring communities.
The most significant risk we currently face relates to compliance with all provisions and requirements of international agreements to reduce pollution and greenhouse gas emissions, and regulatory disclosure standards in both Mexico and the UK.
In addition, the mining industry is also expected to face chronic risks in the coming years, such as rising temperatures, which may increase our demand for water, or a decrease in annual rainfall, which is certain to exacerbate water stress in the regions where we operate. These outcomes may also intensify competition for access to water resources, increasing the risks to our social licence to operate. |
|
Factors contributing to risk |
|
Burning fossil fuels adds greenhouse gases to the atmosphere, increasing the greenhouse effect and global warming. Deforestation by industrial logging in areas where we have operations and projects adds greenhouse gases to the atmosphere. Increased temperatures in desert areas where we operate can worsen air quality and have effects on respiratory and cardiovascular health. Changes in weather patterns can worsen air quality and cause respiratory and cardiovascular issues. Forest fires near units where we have operations or projects generate smoke and other air pollutants harmful to health. Oil and gas extraction is a major source of CO2 pollution. Increasing farming of livestock such as cows and sheep produces large amounts of methane when the animals digest their food. |
|
Controls, mitigating actions and outlook |
|
1. Understanding the exposure of each asset through assessment programmes, such as our critical risk assessment and asset integrity assurance programme, and climate change resilience assessments with support from external consultants such as PWC, Marsh and Zurich.
2. Maintaining business resilience plans and emergency response plans, training and annual exercises helps us to prepare for a natural disaster, for example by deploying established communication plans and coordination with local, regional and state agencies.
3. Using the latest generation of climate analyses (weather forecasts, climate outlooks, modelling and disaster projections) to obtain quantitative information on short-, medium- and long-term physical climate risks.
4. Applying protection principles rather than a compliance-based approach across our operations, fostering proactive relationships with international civil society organisations, governments and environmental departments to support protective legislation.
5. Actively supporting and reporting on our practices in relation to the commitments in the International Council on Mining and Metals statement on water management. |
|
Link to strategy |
Risk appetite |
|
1 - 2 - 3 - 4 |
Medium |
|
Risk owner |
Risk oversight |
|
· ESG Department · Legal Department |
· HCSER Committee |
|
Behaviour |
Risk rating (relative position) |
|
Stable |
2025: Medium (13) 2024: Medium (13) |
14
Tailings dams (overflow or collapse of tailings deposits)
|
Risk description |
|
Ensuring the stability of our tailings storage facilities (TSFs) during their entire lifecycles is central to our operations. A failure, collapse or overtopping of any of our TSFs could result in fatalities, damage to the environment, regulatory violations, reputational damage and disruption to the quality of life of neighbouring communities as well as our operations. Before constructing a dam, we conduct a series of studies to confirm the suitability of the area. These studies include geotechnical, geological, geophysical, hydrological, hydrogeological, and seismic analyses. Before construction begins, the Ministry of Environment and Natural Resources (SEMARNAT), through the Federal Office for Environmental Protection (PROFEPA), conducts several assessments.
Most of our currently operational facilities were designed and constructed under local and national controls and standards. Following investigation, re-design, and construction processes during the last four years, they also comply with our new tailings management policy and guidelines. Obtaining permits, licences and certifications from the government to be able to operate TSFs is a risk due to the time involved in carrying out these procedures, together with any legal complications. Planning new TSFs with the necessary time and to international standards is also a risk, due to the limitations of the land around our mines and the costs and time involved in construction. If we fail to manage these in a timely manner, we run the risk of disrupting the operation. |
|
Factors contributing to risk |
|
The climate in recent years has become harsher in the regions where we operate, for example with more severe and prolonged rainfall, more intense air that degrades the geomembrane liners, snowfall, and frost that complicates the operation, among other issues. |
|
Controls, mitigating actions and outlook |
|
1. The Global Industry Standard on Tailings Management (GISTM) was published in 2020 and is best practice. We understand the value and importance it brings to our industry, and we continually review and assess the impact of compliance. Taking GISTM into account, we have updated our risk assessment methods with a focus on more detailed risk identification, failure modes, and controls to avoid catastrophic failures.
2. We launched a new tailings policy in 2023, based on industry best practices, reinforcing our commitment to the safety and health of our workforce, communities, and the environment. Every year, internal audit and external auditors specialised in tailings dams, such as Hawcroft Consulting and Knight Piésold Consulting, check our compliance with the policy. 3. Catastrophic failures of TSFs are unacceptable and their potential for failure is evaluated and addressed throughout the life of each facility. We manage our TSFs in a manner that allows the effectiveness of their design, operation and closure to be monitored at the highest levels of the Company: - Our TSFs are constantly monitored, and all relevant information is provided to the authorities, regulating bodies, and the communities that could be affected. - We manage our TSFs using data, modelling, and construction and operating methods validated and recorded by qualified technical teams and reviewed by independent international experts, whose recommendations we implement to strengthen the control environment. - Risk management includes timely risk identification, control definition, and verification. Controls are based on the consequences of the potential failure of the TSFs.
4. In 2025 we continuedinitiatives to align our governance practices with current best practices: - Updating the inventory of TSFs and validating the data log. - Reviewing findings of the Independent Tailings Review Panel (ITRP) and prioritising recommendations arising from inspections.
|
|
External sources of confidence |
|
- Compliance with the Independent Tailings Review Panel (ITRP) annual review programme. This panel is comprised of renowned international experts. - Periodically, we are inspected by the ITRP, which issues corrective and preventive recommendations to ensure that the tailings dams remain in good condition. In 2025, the ITRP visited all Fresnillo plc tailings dams. |
|
Link to strategy |
Risk appetite |
|
4 |
Low |
|
Risk owner |
Risk oversight |
|
· TSFs Department · Safety & Environmental Department |
· HSECR Committee · Executive Committe |
|
Behaviour |
Risk rating (relative position) |
|
Stable |
2025: Medium (14) 2024: Medium (14) |
15
Environmental incidents (cyanide spills and chemical contamination)
|
RISK DESCRIPTION |
|
Environmental incidents are an inherent risk in our industry. These incidents include possible cyanide spills and dust emissions, which could have a high impact on our people, communities and businesses. We seek to achieve operational excellence to ensure that our employees and contractors go home safe and healthy, and that there are no adverse impacts on the communities and the environment where we operate. An operating incident that damages the environment could affect both our relationship with local stakeholders and our reputation, reducing the social value we generate. We continue to be alert to the following risks: · Cyanide management. · Impact on the environment through erosion/deforestation/forest loss or disturbance of biodiversity because of the operations of the business unit or project activities. · An event involving a leak or spill of cyanide or SO2, which due to its chemical properties could generate an event of major consequence on the premises of the business unit and / or in the nearby area. Environmental issues directly related to climate change and tailings storage are considered in our specific principal risks 'Climate Change' and 'Tailings dams'. |
|
FACTORS CONTRIBUTING TO RISK |
|
Climate change in the regions where we operate is beginning to increase the risk of incidents impacting the environment, mainly due to more extreme rainfall. We operate in challenging environments, including forests and agricultural areas in Chihuahua and Durango, and also the Sonora Desert, where water scarcity is a key problem. Disruptions and lack of supply of critical inputs for the operation. Failure to address the recommendations of external audits, especially those related to the environment. |
|
CONTROLS, MITIGATING ACTIONS AND OUTLOOK |
|
1. We work to raise awareness among employees and contractors, providing training to promote operational excellence. 2. The potential environmental impact of a project is a key consideration when assessing its viability, and we encourage the integration of innovative technology in the project design to mitigate such impacts. 3. We have an environmental management system in place. We have strengthened the regulatory risk pillar of this system, incorporating monthly updates of environmental regulations. Furthermore, we now regularly monitor the Environmental Authority inspection processes to assure compliance with our environmental commitments and action plans. 4. Each site maintains updated environmental emergency preparedness and detailed closure plans with appropriate financial provisions to ensure physical and chemical stability once operations have ceased. 5. We comply with international best practices as promoted by the International Cyanide Management Institute (ICMI) and the Mexican standard NOM-155SEMARNAT-2007, which establishes environmental requirements for gold and silver leaching systems.
|
|
External sources of confidence |
|
Fresnillo, Saucito, Herradura and Noche Buena are ISO 14001 and ISO 45001 certified.
In addition, Fresnillo and Saucito achieved the badge of environmental excellence issued by the Environmental Protection Attorney's Office (PROFEPA).
Our Herradura and Noche Buena leaching operations comply with the Cyanide Code issued by the International Cyanide Code Institute with the respective certification. |
|
Link to strategy |
Risk appetite |
|
4 |
Low |
|
Risk owner |
Risk oversight |
|
· Safety & Environmental Department |
· HSECR Committee |
|
Behaviour |
Risk rating (relative position) |
|
Stable |
2025: Medium (15) 2024: Medium (15) |
Statement of Directors' responsibilities
The Directors are responsible for preparing the annual report and the Group and Parent Company financial statements in accordance with applicable United Kingdom law and regulations.
The Directors are required to prepare financial statements for each financial year which present a true and fair view of the financial position of the Company and of the Group and the financial performance and cash flows of the Company and of the Group for that period. The Directors have elected to prepare the Group and Parent Company financial statements in accordance with UK-adopted International Accounting Standards.
In preparing those financial statements, the Directors are required to:
• select suitable accounting policies in accordance with IAS 8: 'Accounting Policies, Changes in Accounting Estimates and Errors' and then apply them consistently;
• make judgements and accounting estimates that are reasonable and prudent;
• present information, including accounting policies, in a manner that provides relevant, reliable, comparable and understandable information;
• provide additional disclosures when compliance with the specific requirements in IFRSs is insufficient to enable users to understand the impact of particular transactions, other events and conditions on the Company and of the Group's financial position and financial performance;
• state whether UK-adopted international accounting standards have been followed, subject to any material departures disclosed and explained in the financial statements; and
• prepare the accounts on a going concern basis unless, having assessed the ability of the Company and the Group to continue as a going concern it is appropriate to presume that the Company and/or the Group will not continue in business.
The Directors are responsible for keeping adequate accounting records that are sufficient to show and explain the Company's and Group's transactions and which disclose with reasonable accuracy at any time the financial position of the Company and of the Group and enable them to ensure that the financial statements comply with the Companies Act 2006. They are also responsible for safeguarding the assets of the Company and the Group and hence for taking reasonable steps for the prevention and detection of fraud and other irregularities.
Under applicable UK law and regulations, the Directors are responsible for the preparation of a Strategic report, Directors' report, Directors' Remuneration report and Corporate Governance statement that comply with that law and regulations. In addition, the Directors are responsible for the maintenance and integrity of the corporate and financial information included on the Company's website. Legislation in the UK governing the preparation and dissemination of financial statements may differ from legislation in other jurisdictions.
Neither the Company nor the Directors accept any liability to any person in relation to the annual financial report except to the extent that such liability could arise under English law. Accordingly, any liability to a person who has demonstrated reliance on any untrue or misleading statement or omission shall be determined in accordance with section 90A and schedule 10A of the Financial Services and Markets Act 2000.
Directors' responsibility statement under the UK Corporate Governance Code
In accordance with Provision 25 of the UK Corporate Governance Code, the Directors consider that the annual report and accounts, taken as a whole, is fair, balanced and understandable and provides information necessary to enable shareholders to assess the Company's position, performance, business model and strategy.
Responsibility statement of the Directors in respect of the annual report and accounts
Each of the Directors confirm that to the best of their knowledge:
a) the consolidated financial statements, prepared in accordance with UK-adopted international accounting standards give a true and fair view of the assets, liabilities, financial position and profit and loss of the Company and the undertakings included in the consolidation taken as a whole; and
b) the annual report (including the Strategic report encompassed within the 'Overview', 'Strategic report', 'Performance' and 'Governance' sections) includes a fair review of the development and performance of the business, and the position of the Company and the undertakings included in the consolidation taken as a whole, together with a description of the principal risks and uncertainties that they face.
For and on behalf of the Board.
Alberto Tiburcio
Independent Non-executive Director
2 March 2026
|
Z |
|
Year ended 31 December 2025 |
|
Year ended 31 December 2024 |
||||
|
|
Notes |
US$ thousands |
|
US$ thousands |
||||
|
|
|
Pre-Silverstream |
Silverstream |
Total |
|
Pre-Silverstream |
Silverstream |
Total |
|
Revenues |
5 |
4,561,231 |
|
4,561,231 |
|
3,496,385 |
|
3,496,385 |
|
Cost of sales |
6 |
(1,897,120) |
|
(1,897,120) |
|
(2,250,112) |
|
(2,250,112) |
|
Gross profit |
|
2,664,111 |
|
2,664,111 |
|
1,246,273 |
|
1,246,273 |
|
Administrative expenses |
|
(118,237) |
|
(118,237) |
|
(109,514) |
|
(109,514) |
|
Exploration expenses |
7 |
(173,531) |
|
(173,531) |
|
(163,048) |
|
(163,048) |
|
Selling expenses |
|
(66,770) |
|
(66,770) |
|
(46,154) |
|
(46,154) |
|
Other operating income |
9 |
20,229 |
|
20,229 |
|
39,559 |
|
39,559 |
|
Other operating expenses |
9 |
(33,338) |
|
(33,338) |
|
(21,296) |
|
(21,296) |
|
Profit before net finance costs and income tax |
|
2,292,464 |
|
2,292,464 |
|
945,820 |
|
945,820 |
|
Finance income |
10 |
92,549 |
|
92,549 |
|
46,936 |
|
46,936 |
|
Finance costs |
10 |
(68,541) |
|
(68,541) |
|
(73,571) |
|
(73,571) |
|
Revaluation effects of Silverstream contract |
14 |
- |
(189,212) |
(189,212) |
|
- |
(182,276) |
(182,276) |
|
Foreign exchange (loss)/gain |
|
(45,278) |
|
(45,278) |
|
6,993 |
|
6,993 |
|
Profit before income tax |
|
2,271,194 |
(189,212) |
2,081,982 |
|
926,178 |
(182,276) |
743,902 |
|
Corporate income tax |
11 |
(371,739) |
56,764 |
(314,975) |
|
(444,870) |
54,683 |
(390,187) |
|
Special mining right |
11 |
(193,178) |
|
(193,178) |
|
(127,024) |
|
(127,024) |
|
Income tax |
11 |
(564,917) |
56,764 |
(508,153) |
|
(571,894) |
54,683 |
(517,211) |
|
Profit for the year |
|
1,706,277 |
(132,448) |
1,573,829 |
|
354,284 |
(127,593) |
226,691 |
|
Attributable to: |
|
|
|
|
|
|
|
|
|
Equity shareholders of the Company |
|
1,516,436 |
(132,448) |
1,383,988 |
|
268,513 |
(127,593) |
140,920 |
|
Non-controlling interest |
|
189,841 |
|
189,841 |
|
85,771 |
|
85,771 |
|
|
|
1,706,277 |
(132,448) |
1,573,829 |
|
354,284 |
(127,593) |
226,691 |
|
Earnings per share: (US$) |
|
|
|
|
|
|
|
|
|
Basic and diluted earnings per Ordinary Share |
12 |
|
|
1.878 |
|
|
|
0.191 |
|
Adjusted earnings per share: (US$) |
|
|
|
|
|
|
|
|
|
Adjusted basic and diluted earnings per Ordinary Share |
12 |
2.058 |
|
|
|
0.364 |
|
|
|
|
|
|
|
|
|
|
|
|
|
|
|
Year ended 31 December |
|
|
|
Notes |
2025 |
2024 |
|
Profit for the year |
|
1,573,829 |
226,691 |
|
Other comprehensive income/(expense) |
|
|
|
|
Items that may be reclassified subsequently to profit or loss: |
|
|
|
|
Foreign currency translation |
|
2 |
(3,366) |
|
Net other comprehensive loss that may be reclassified subsequently to profit or loss: |
|
2 |
(3,366) |
|
Items that will not be reclassified to profit or loss: |
|
|
|
|
Changes in the fair value of cash flow hedges, net of tax |
|
(1,394) |
(201) |
|
Total effect of cash flow hedges |
|
(1,394) |
(201) |
|
Changes in the fair value of equity investments at fair value through other comprehensive income (FVOCI) |
|
70,855 |
35,309 |
|
Remeasurement loss on defined benefit plans |
22 |
(2,439) |
(199) |
|
Income tax effect on items that will not be reclassified to profit or loss |
11 |
(20,733) |
(10,502) |
|
Net other comprehensive income that will not be reclassified to profit or loss |
|
46,289 |
24,407 |
|
Other comprehensive income, net of tax |
|
46,291 |
21,041 |
|
Total comprehensive income for the year, net of tax |
|
1,620,120 |
247,732 |
|
Attributable to: |
|
|
|
|
Equity shareholders of the Company |
|
1,430,419 |
162,022 |
|
Non-controlling interests |
|
189,701 |
85,710 |
|
|
|
1,620,120 |
247,732 |
.
|
|
|
As at 31 December |
|
|
|
Notes |
2025 |
2024 |
|
ASSETS |
|
|
|
|
Non-current assets |
|
|
|
|
Property, plant and equipment (PPE) |
13 |
2,466,034 |
2,538,665 |
|
Equity instruments at FVOCI |
30 (b) |
34,537 |
139,968 |
|
Silverstream contract |
14 |
- |
214,437 |
|
Deferred tax asset |
11 |
610,367 |
466,734 |
|
Inventories |
15 |
69,760 |
69,760 |
|
Other receivables |
16 |
41,510 |
5,264 |
|
Other assets |
|
3,608 |
3,101 |
|
|
|
3,225,816 |
3,437,929 |
|
|
|
|
|
|
Current assets |
|
|
|
|
Inventories |
15 |
432,838 |
412,417 |
|
Trade and other receivables |
16 |
830,585 |
674,211 |
|
Prepayments |
|
33,450 |
13,881 |
|
Silverstream contract |
14 |
- |
44,204 |
|
Derivative financial instruments |
|
103 |
- |
|
Short-term investments |
17 |
92,733 |
187,403 |
|
Cash and cash equivalents |
17 |
2,663,743 |
1,110,413 |
|
|
|
4,053,452 |
2,442,529 |
|
Total assets |
|
7,279,268 |
5,880,458 |
|
EQUITY AND LIABILITIES |
|
|
|
|
Capital and reserves attributable to shareholders of the Company |
|
|
|
|
Share capital |
18 |
368,546 |
368,546 |
|
Share premium |
18 |
1,153,817 |
1,153,817 |
|
Capital reserve |
18 |
(526,910) |
(526,910) |
|
Hedging reserve |
18 |
(470) |
(92) |
|
Fair value reserve of financial assets at FVOCI |
18 |
26,168 |
66,594 |
|
Foreign currency translation reserve |
18 |
(7,568) |
(7,570) |
|
Retained earnings |
18 |
3,619,311 |
2,800,956 |
|
|
|
4,632,894 |
3,855,341 |
|
Non-controlling interests |
|
441,793 |
355,029 |
|
Total equity |
|
5,074,687 |
4,210,370 |
|
|
|
As at 31 December |
|
|
|
Notes |
2025 |
2024 |
|
Non-current liabilities |
|
|
|
|
Interest-bearing loans |
20 |
839,926 |
839,507 |
|
Lease liabilities |
25 |
6,183 |
7,581 |
|
Provision for mine closure cost |
21 |
262,521 |
233,748 |
|
Pensions and other post-employment benefit plans |
22 |
17,732 |
11,454 |
|
Deferred tax liability |
11 |
145,507 |
209,213 |
|
|
|
1,271,869 |
1,301,503 |
|
Current liabilities |
|
|
|
|
Trade and other payables |
23 |
375,175 |
223,779 |
|
Notes payable |
30 (a) |
- |
2,055 |
|
Income tax payable |
|
523,046 |
113,221 |
|
Derivative financial instruments |
30 |
741 |
189 |
|
Lease liabilities |
25 |
4,864 |
4,312 |
|
Provision for mine closure cost |
21 |
9,961 |
11,781 |
|
Employee profit sharing |
|
18,925 |
13,248 |
|
|
|
932,712 |
368,585 |
|
Total liabilities |
|
2,204,581 |
1,670,088 |
|
Total equity and liabilities |
|
7,279,268 |
5,880,458 |
These financial statements were approved by the Board of Directors on 2 March 2026 and signed on its behalf by:
Dr Arturo Fernández
Non-executive Director
2 March 2026
|
|
|
Year ended 31 December |
|
|
|
Notes |
2025 |
2024 |
|
Net cash from operating activities |
29 |
2,289,707 |
1,299,802 |
|
Cash flows from investing activities |
|
|
|
|
Purchase of property, plant and equipment |
3 |
(400,141) |
(370,542) |
|
Proceeds from the sale of property, plant and equipment and other assets |
|
462 |
2,563 |
|
Proceeds from the sale of mining concessions |
9 |
16,050 |
10,000 |
|
Proceeds from Silverstream contract |
14 |
85,945 |
29,957 |
|
Purchase of equity instruments at FVOCI1 |
30 (b) |
- |
(1,466) |
|
Disposal of equity instruments at FVOCI 1 |
30 (b) |
176,584 |
5,098 |
|
Dividends received from equity instruments at FVOCI |
|
1,754 |
- |
|
Decrease/(increase) in short-term investments |
17 |
94,670 |
(187,403) |
|
Interest received |
|
92,113 |
46,333 |
|
Net cash used in investing activities |
|
67,437 |
(465,460) |
|
Cash flows from financing activities |
|
|
|
|
Payment of notes payable |
30(a) |
(2,055) |
(92,361) |
|
Principal element of lease payments |
25 (a) |
(4,689) |
(5,443) |
|
Dividends paid to shareholders of the Company2 |
19 |
(654,313) |
(78,156) |
|
Dividends paid to non-controlling interests in subsidiaries |
4 (a) |
(103,400) |
(26,400) |
|
Capital contribution from non-controlling interest |
|
278 |
- |
|
Interest paid3 |
|
(40,625) |
(45,917) |
|
Net cash used in financing activities |
|
(804,804) |
(248,277) |
|
Net Increase in cash and cash equivalents during the year |
|
1,552,340 |
586,065 |
|
Effect of exchange rate on cash and cash equivalents |
|
990 |
(10,232) |
|
Cash and cash equivalents at 1 January |
|
1,110,413 |
534,580 |
|
Cash and cash equivalents at 31 December |
17 |
2,663,743 |
1,110,413 |
1 Following the investment strategy of the Group, during 2025, the Group decided to dispose the shares held in MAG Silver Corp. The Group disposed 9,314,877 owned shares. The gain on the disposal of US$128.6 million has been transferred from the Fair value reserve of financial assets at FVOCI to retained earnings, net of tax amounting to US$38.6 million.
2 Includes the effect of hedging of dividend payments made in currencies other than US dollar (note 19).
3 As of 31 December 2025 includes US$1.2 million (2024: US$1.2 million) related to a commitment fee in respect of undrawn amounts of the syndicated revolving credit facility entered by the Group. No amounts have been drawdown from the credit facility as of 31 December 2025.
|
|
|
|
|
Attributable to the equity holders of the Company |
|
||||||
|
|
Notes |
Share |
Share premium |
Capital reserve |
Hedging reserve |
Fair value reserve of financial assets at FVOCI |
Foreign currency translation reserve |
Retained earnings |
Total |
Non-controlling interests |
Total |
|
|
|
|
|
|
|
|
|
|
US$ thousands |
||
|
Balance at 1 January 2024 |
|
368,546 |
1,153,817 |
(526,910) |
50 |
42,591 |
(4,204) |
2,737,962 |
3,771,852 |
295,345 |
4,067,197 |
|
Profit for the year |
|
- |
- |
- |
- |
- |
- |
140,920 |
140,920 |
85,771 |
226,691 |
|
Other comprehensive income, net of tax |
|
- |
- |
- |
(95) |
24,716 |
(3,366) |
(153) |
21,102 |
(61) |
21,041 |
|
Total comprehensive income for the year |
|
- |
- |
- |
(95) |
24,716 |
(3,366) |
140,767 |
162,022 |
85,710 |
247,732 |
|
Hedging loss transferred to the carrying value of PPE purchased during the year |
|
- |
- |
- |
(47) |
- |
- |
- |
(47) |
(1) |
(48) |
|
Transfer of gain on disposal of equity investments at FVOCI to retained earnings (net of tax) |
30 (b) |
- |
- |
- |
- |
(713) |
- |
713 |
- |
- |
- |
|
Recognition of non-controlling interest |
4 (a) |
- |
- |
- |
- |
- |
- |
(375) |
(375) |
375 |
- |
|
Dividends declared and paid |
19 |
- |
- |
- |
- |
- |
- |
(78,111) |
(78,111) |
(26,400) |
(104,511) |
|
Balance at 31 December 2024 |
|
368,546 |
1,153,817 |
(526,910) |
(92) |
66,594 |
(7,570) |
2,800,956 |
3,855,341 |
355,029 |
4,210,370 |
|
Profit for the year |
|
- |
- |
- |
- |
- |
- |
1,383,988 |
1,383,988 |
189,841 |
1,573,829 |
|
Other comprehensive income, net of tax |
|
- |
- |
- |
(1,137) |
49,598 |
2 |
(2,032) |
46,431 |
(140) |
46,291 |
|
Total comprehensive income for the year |
|
- |
- |
- |
(1,137) |
49,598 |
2 |
1,381,956 |
1,430,419 |
189,701 |
1,620,120 |
|
Hedging loss transferred to the carrying value of PPE purchased during the year |
|
- |
- |
- |
759 |
- |
- |
- |
759 |
185 |
944 |
|
Transfer of gain on disposal of equity investments at FVOCI to retained earnings (net of tax) |
30 (b) |
- |
- |
- |
- |
(90,024) |
- |
90,024 |
- |
- |
- |
|
Capital contribution |
|
- |
- |
- |
- |
- |
- |
- |
- |
278 |
278 |
|
Dividends declared and paid |
19 |
- |
- |
- |
- |
- |
- |
(653,625) |
(653,625) |
(103,400) |
(757,025) |
|
Balance at 31 December 2025 |
|
368,546 |
1,153,817 |
(526,910) |
(470) |
26,168 |
(7,568) |
3,619,311 |
4,632,894 |
441,793 |
5,074,687 |
1. Corporate information
Fresnillo plc. ("the Company") is a public limited company and registered in England and Wales with registered number 6344120 and is the holding company for the Fresnillo subsidiaries detailed in note 5 of the Parent Company accounts ('the Group').
Industrias Peñoles S.A.B. de C.V. ('Peñoles') currently owns 75 percent of the shares of the Company and the ultimate controlling party of the Company is the Baillères family, whose beneficial interest is held through Peñoles. The registered address of Peñoles is Calzada Legaria 549, Mexico City 11250. Copies of Peñoles' accounts can be obtained from www.penoles.com.mx. Further information on related party balances and transactions with Peñoles' group companies is disclosed in note 27.
The consolidated financial statements of the Group for the year ended 31 December 2025 were authorised for issue by the Board of Directors of Fresnillo plc on 2 March 2026.
The financial information for the year ended 31 December 2025 and 2024 contained in this document does not constitute statutory accounts as defined in section 435 of the Companies Act 2006. The financial information for the years ended 31 December 2025 and 2024 have been extracted from the consolidated financial statements of Fresnillo plc for the year ended 31 December 2025 which have been approved by the directors on 2 March 2026 and will be delivered to the Registrar of Companies in due course. The auditor's report on those financial statements was unqualified and did not contain a statement under section 498 of the Companies Act 2006.
The Group's principal business is the mining and beneficiation of non-ferrous minerals, and the sale of related production. The primary contents of this production are silver, gold, lead and zinc. During 2025 99.8% of the production were sold to Peñoles' metallurgical complex, Met-Mex (2024: 99.6% of the production), for smelting and refining. Further information about the Group operating mines and its principal activities is disclosed in note 3.
2. Significant accounting policies
(a) Basis of preparation and consolidation, and statement of compliance
Basis of preparation and statement of compliance
The Group consolidated financial statements have been prepared in accordance with UK-adopted international accounting standards in accordance with the provisions of the Companies Act 2006.
The consolidated financial statements have been prepared on a historical cost basis, except for trade receivables, derivative financial instruments, equity securities and defined benefit pension scheme assets which have been measured at fair value.
The consolidated financial statements are presented in dollars of the United States of America (US dollars or US$) and all values are rounded to the nearest thousand ($000) except when otherwise indicated.
Going concern
The Group's business activities, together with the factors likely to affect its future development, performance and position are set out above in the Strategic Review. The financial position of the Group, its cash flows and liquidity position are described in the Financial Review. In addition, note 31 to the financial statements includes the Group's objectives, policies and processes for managing its capital; its financial risk management objectives; details of its financial instruments; and its exposures to credit risk and liquidity risk.
In making their assessment of the Group's ability to manage its future cash requirements, the Directors have considered the Company and Group budgets, and the cash flow forecasts for the period to 31 December 2027 (being the going concern assessment period). In addition, they reviewed a more conservative cash flow scenario using lower silver and gold prices of US$37.2 /Oz and US$2,549 /Oz respectively throughout this period, whilst maintaining current budgeted expenditure while only considering projects approved by the Executive Committee. This resulted in our current cash balances reducing over time but maintaining sufficient liquidity throughout the period.
The Directors have further calculated metal prices for a reverse stress test (US$20.0 /Oz and US$1,570 /Oz for silver and gold respectively), which are assumed to be maintained until the end of 2027. This would result in cash balances decreasing to minimal levels by the end of 2027, without applying mitigations and not using the revolving credit facility.
Should metal prices remain below the stressed prices above for an extended period, management have identified specific elements of capital and exploration expenditure which could be deferred without adversely affecting production profiles throughout the period. On the other hand, management could amend the mining plans to concentrate on production with a higher margin to accelerate cash generation without affecting the integrity of the mine plans. Finally, to maintain a strong liquidity, in January 2024 management acquired a committed revolving credit facility of US$350M, which could be used if needed.
After reviewing all of the above considerations, the Directors have a reasonable expectation that management have sufficient flexibility in adverse circumstances to maintain adequate resources to continue in operational existence for the foreseeable future. The Directors, therefore, continue to adopt the going concern basis of accounting in preparing the annual financial statements.
Basis of consolidation
The consolidated financial statements set out the Group's financial position as of 31 December 2025 and 2024, and the results of operations and cash flows for the years then ended.
Entities that constitute the Group are those enterprises controlled by the Group regardless of the number of shares owned by the Group. The Group controls an entity when it is exposed to, or has the right to, variable returns from its involvement with the entity and has the ability to affect those returns through its power over the entity. Entities are consolidated from the date on which control is transferred to the Group and cease to be consolidated from the date on which control is transferred out of the Group. The Group applies the acquisition method to account for business combinations in accordance with IFRS 3.
All intra-group balances, transactions, income and expenses and profits and losses, including unrealised profits arising from intra-group transactions, have been eliminated on consolidation. Unrealised losses are eliminated in the same way as unrealised gains except that they are only eliminated to the extent that there is no evidence of impairment.
Non-controlling interests in the net assets of consolidated subsidiaries are identified separately from the Group's equity therein. The interest of non-controlling shareholders may be initially measured either at fair value or at the non-controlling interest's proportionate share of the acquiree's identifiable net assets. The choice of measurement basis is made on an acquisition by-acquisition basis. Subsequent to acquisition, non-controlling interests consist of the amount attributed to such interests at initial recognition and the non-controlling interest's share of changes in equity since the date of the combination. Any losses of a subsidiary are attributed to the non-controlling interests even if that results in a deficit balance.
Transactions with non-controlling interests that do not result in loss of control are accounted for as equity transactions - that is, a transaction with the owners in their capacity as owners. The difference between fair value of any consideration paid and the relevant share acquired of the carrying value of net assets of the subsidiary is recorded in equity. Gains or losses on disposals to non-controlling interest are also recorded in equity.
(b) Changes in accounting policies and disclosures
The accounting policies adopted in the preparation of the consolidated financial statements are consistent with those applied in the preparation of the consolidated financial statements for the year ended 31 December 2024.
New standards, interpretations and amendments (new standards) adopted by the Group
A number of new or amended standards became applicable for the current reporting period. The Group did not have to change its accounting policies or make retrospective adjustments as a result of adopting these standards.
The Group has evaluated the applicability of Pillar II rules considering that the Parent Company and the main subsidiaries of the Group are tax resident in Mexico, management also assessed the status of the Pillar II legislation in the country, however no laws or regulations have been enacted to the date of this report.
Standards, interpretations and amendments issued but not yet effective
The International Accounting Standards Board (IASB) has issued new standards, interpretation and other amendments resulting from improvements to IFRSs that management considers do not have any impact on the accounting policies, financial position or performance of the Group except for the new standard IFRS 18-Presentation and Disclosure in Financial Statements; this new standard replaces IAS 1-Presentation of Financial Statements, with a focus on updates to the statement of profit or loss. This new standard is applicable for periods commencing 1 January 2027, early adoption is permitted. The Group plans to adopt the new standard on the required effective date. The Group has assessed the expected impact of IFRS 18 on its consolidated financial statements and anticipates that the standard will primarily affect the presentation and disclosure of income and expenses, including the classification of operating and non‑operating results. The Group do not expect it to have a material impact on the amounts recognised for financial performance or cash flows. However, the presentation of comparative information may change in future periods.
The Group has not early adopted any standard, interpretation or amendment that was issued but is not yet effective.
(c) Significant accounting judgements, estimates and assumptions
The preparation of the Group's consolidated financial statements in conformity with UK-adopted IFRS requires management to make judgements, estimates and assumptions that affect the reported amounts of assets, liabilities and contingent liabilities at the date of the consolidated financial statements and reported amounts of revenues and expenses during the reporting period. These judgements and estimates are based on management's best knowledge of the relevant facts and circumstances, with regard to prior experience, but actual results may differ from the amounts included in the consolidated financial statements. Information about such judgements and estimates is contained in the accounting policies and/or the notes to the consolidated financial statements.
Judgements
Areas of judgement, apart from those involving estimations, that have the most significant effect on the amounts recognised in the consolidated financial statements for the year ended 31 December 2025 are:
Recoverability of Soledad and Dipolos assets:
In 2009, five members of the El Bajio agrarian community in the state of Sonora, who claimed rights over certain surface land in the proximity of the operations of Minera Penmont ('Penmont'), submitted a legal claim before the Unitarian Agrarian Court #28 (Tribunal Unitario Agrario) of Hermosillo, Sonora, to have Penmont vacate an area of this surface land. The land in dispute (the 'Original Claim Land') encompassed a portion of surface area where part of the operations of the Soledad & Dipolos mines are located, in particular, the Dipolos pit. The litigation resulted in a definitive court order with which Penmont complied by vacating the Original Claim Land, comprising 1,824 hectares, in 2013, resulting in the suspension of operations at Soledad & Dipolos. The claim and the definitive court order did not affect the Group's legal title over the mining concession, the ore currently held in leaching pads near the mine site, or Penmont's property title over the lands where the Soledad pit is located.
Penmont is the legal and registered owner of a separate parcel of land where the leaching pads are located but has not yet been able to gain physical access to these pads due to opposition by certain local individuals and security concerns. This land was purchased by Penmont from the Federal Government of Mexico in accordance with established legal procedures. The Group has a reasonable expectation that Penmont will eventually regain access to the Soledad & Dipolos assets and process the ore content in the Soledad & Dipolos leaching pads. This expectation is supported by several elements, including but not limited to the different legal proceedings that Penmont has presented as well other actions taken by the Company. Therefore, the Group continues to recognise property, plant & equipment and inventory related to Soledad & Dipolos, as disclosed in Note 13 and Note 15, respectively. Due to the fact that it is not yet certain when access may be obtained, so that the inventory can be processed, this inventory is classified as a non-current asset.
In addition, claimants from the El Bajío community have also presented claims against occupation agreements they entered with Penmont, in respect of land parcels different to both the Original Claim Land and the area where the leaching pads are located. Penmont neither carried out extraction of minerals nor has a specific geological interest in these parcels (the 'Unmined Claim Land') and therefore the Unmined Claim Land is not considered strategic for Penmont. The Agrarian Court has issued rulings declaring the occupation agreements over the Unmined Claim Land to be null and void, and that Penmont must remediate such lands and return any minerals extracted from the Unmined Claim Land, regardless that no minerals were extracted therein. The litigation remains subject to final conclusion. Pursuant to the foregoing, in the same litigation of the Unmined Claim Land, in April 2025 the Agrarian Court issued an order that Penmont considers to be highly irregular in form and substance, ordering Penmont to pay approximately MXP$13,330 million Pesos (US$ 742 million) for the extraction of minerals carried out in the Dipolos pit, which is part of the Original Claim Land and not the Unmined Claim Land. This matter was already the subject of a different (final and unappealable) judicial ruling relating to the Original Claim Land which is mentioned in the first paragraph above which ruling did not include restitution of any minerals extracted from the Dipolos pit. Penmont has presented appeals before the Federal Courts which Penmont expects to be successful. Such Federal Courts have granted Penmont stay orders so that no further execution by the Agrarian Court against Penmont is made pending resolution of the appeals procedures. The outcome of such proceedings would still be subject to further review and appeals at the Federal level in Mexico. At this stage, the Company considers that it holds strong arguments that support its position that the Agrarian Court's decision will eventually be overturned by the higher Federal Courts; therefore, no provision has been recorded in respect of this matter. There are no material assets, liabilities or provisions recognised in respect of the Original Claim Land at 31 December 2025.
Climate change:
In the climate disclosure in the Strategic Report, the Group set out its assessment of climate risks and opportunities (CROs). The Group recognises that there may be potential financial statement implications in the future in respect of the mitigation and adaptation measures to the physical and transition risks. The potential effect of climate change would be in respect of assets and liabilities that are measured based on an estimate of future cash flows. The Group specifically considered the effect of climate change on the valuation of property, plant and equipment, deferred tax assets, and the provision for mine closure cost. The Group does not have any assets or liabilities for which measurement is directly linked to climate change performance (for example: Sustainability-Linked Bonds).
The main ways in which climate has affected the preparation of the financial statements are:
• The Group has already made certain climate-related strategic decisions, such as to focus on decarbonisation and to increase the use of wind energy. Where decisions have been approved by the Board, the effects were considered in the preparation of these financial statements by way of inclusion in future cash flow projections underpinning the estimation of the recoverable amount of property, plant and equipment and deferred tax assets, as relevant.
• Further information about the potential effect of CROs on the provision for mine closure cost is set out in Note 21.
The Group's strategy consists of mitigation and adaptation measures. To mitigate the impacts by and on climate change the Company relies on renewable electricity, fuel replacement and efficiency opportunities to reduce the carbon footprint. The approach to adaptation measures is based on climate models to produce actionable information for the design, construction, operation and closure of its mining assets, considering climate change. In addition, societal expectations are driving government action that may impose further requirements and cost on companies in the future. Future changes to the Group's climate change strategy, global decarbonisation signposts and regulation may impact the Group's significant judgements and key estimates and result in material changes to financial results and the carrying values of certain assets and liabilities in future reporting periods. However, as at the balance sheet date the Group believes there is no material impact on balance sheet carrying values of assets or liabilities. Although this is an estimate, it is not considered a critical estimate.
Uncertain tax positions:
The current income tax charge is calculated on the basis of the tax laws enacted or substantively enacted at the end of the reporting period in the countries where the company and its subsidiaries operate and generate taxable income. Management periodically evaluates positions taken in tax returns with respect to situations in which applicable tax regulation is subject to interpretation, and it considers whether it is probable that a taxation authority will accept an uncertain tax treatment. The Group measures its tax balances based on either the most likely amount or the expected value, depending on which method provides a better prediction of the resolution of the uncertainty.
Estimates and assumptions
Significant areas of estimation uncertainty considered by management in preparing the consolidated financial statements include:
Estimated recoverable ore reserves and mineral resources, note 2(e):
Ore reserves are estimates of the amount of ore that can be economically and legally extracted from the Group's mining properties. Mineral resources are an identified mineral occurrence with reasonable prospects for eventual economic extraction. The Group estimates its ore reserves and mineral resources based on information compiled by appropriately qualified persons relating to the geological and technical data on the size, depth, shape and grade of the ore body and suitable production techniques and recovery rates, in conformity with the Joint Ore Reserves Committee (JORC) code 2012. Such an analysis requires complex geological judgements to interpret the data. The estimation of recoverable ore reserves and mineral resources is based upon factors such as geological assumptions and judgements made in estimating the size and grade of the ore body, estimates of commodity prices, foreign exchange rates, future capital requirements and production costs.
As additional geological information is produced during the operation of a mine, the economic assumptions used and the estimates of ore reserves and mineral resources may change. Such changes may impact the Group's reported balance sheet and income statement including:
· The carrying value of property, plant and equipment and mining properties may be affected due to changes in the recoverable amount, which consider both ore reserves and mineral resources, refer to note 13;
· Depreciation and amortisation charges in the income statement may change where such charges are determined using the unit-of-production method based on ore reserves, refer to note 13;
· Stripping costs capitalised in the balance sheet, either as part of mine properties or inventory, or charged to profit or loss may change due to changes in stripping ratios, refer to note 13;
· Provisions for mine closure costs may change where changes to the ore reserve and resources estimates affect expectations about when such activities will occur, refer to note 21;
· The recognition and carrying value of deferred income tax assets may change due to changes regarding the existence of such assets and in estimates of the likely recovery of such assets, refer to note 11.
Estimate of recoverable ore on leaching pads, note 15:
In the Group's open pit mines, certain mined ore is placed on leaching pads where a solution is applied to the surface of the heap to dissolve the gold and enable extraction. The determination of the amount of recoverable gold requires estimation with consideration of the quantities of ore placed on the pads, the grade of the ore (based on assay data) and the estimated recovery percentage (based on metallurgical studies and current technology).
The grades of ore placed on pads are regularly compared to the quantities of metal recovered through the leaching process to evaluate the appropriateness of the estimated recovery (metallurgical balancing). The Group monitors the results of the metallurgical balancing process and recovery estimates are refined based on actual results over time and when new information becomes available. Any potential future adjustment would be applicable from the point of re-estimation and would not by itself change the value of inventory and as such no sensitivity is included.
The Group monitors the metallurgical balances to confirm the grade and recovery of the ore in inventories. Based on new technical information and the reconsideration of actual recovery grades and updated leaching targets, the Group updated its estimate of gold content in leaching pads of Noche Buena mine, increasing this by 20.7 thousand ounces of gold as at 1 January 2025.
This change in estimation was incorporated prospectively in inventory from 1 January 2025. The increase in the number of ounces in Noche Buena inventory reduced the weighted average cost of inventory. Had the estimation not changed, production cost during 2025 would have been US$13.4 million higher, with an offsetting impact against the work-in-progress inventory balance as of 31 December 2025.
Silverstream, note 14:
Until 31 December 2024, the valuation of the Silverstream contract as a derivative financial instrument requires estimation by management. The term of the derivative was based on the Sabinas life of mine and the value of this derivative was determined using a number of estimates, including the estimated future silver production, which was based on the ore that management considers possible to extract, as a market participant would.. In August 2025 the Group entered into a buyback agreement with Peñoles to terminate the Silverstream agreement for a one-off payment of US$40 million. Further detail of the buyback agreement and the valuation of this derivative are included in note 14.
Income tax, notes 2 (r) and 11:
The recognition of deferred tax assets, including those arising from un-utilised tax losses, requires management to assess the likelihood that the Group will generate taxable earnings in future periods, in order to utilise recognised deferred tax assets. Estimates of future taxable income are based on forecast cash flows from operations and the application of existing tax laws in each jurisdiction. Considering that tax losses expire in ten years and models show short term recoveries, estimated cash flows are not significantly sensitive to reasonably possible changes to key assumptions on which management bases the recoverable value calculations. The carrying value of deferred tax assets is disclosed in note 11.
Provision for mine closure cost, notes 2 (k) and 21:
The Group assesses its mine closure cost provision annually. Significant estimates and assumptions are made in determining the provision for mine closure cost as there are numerous factors that will affect the ultimate liability. These factors include estimates of the extent and costs of rehabilitation activities, technological changes, regulatory changes, cost increases, mine life and changes in discount rates. Those uncertainties may result in future actual expenditure differing from the amounts currently provided. The provision at the balance sheet date represents management's best estimate of the present value of the future closure costs required.
(d) Foreign currency translation
The Group's consolidated financial statements are presented in US dollars, which is the Parent Company's functional currency. The functional currency for each entity in the Group is determined by the currency of the primary economic environment in which it operates. The determination of functional currency requires management judgement, particularly where there may be more than one currency in which transactions are undertaken and which impact the economic environment in which the entity operates. For all operating entities, this is US dollars.
Transactions denominated in currencies other than the functional currency of the entity are translated at the exchange rate ruling at the date of the transaction. Monetary assets and liabilities denominated in foreign currencies are re-translated at the rate of exchange ruling at the balance sheet date. All differences that arise are recorded in the income statement. Non-monetary items that are measured in terms of historical cost in a foreign currency are translated using the exchange rates as at the dates of the initial transactions. Non-monetary items measured at fair value in a foreign currency are translated into US dollars using the exchange rate at the date when the fair value is determined.
For entities with functional currencies other than US dollars as at the reporting date, assets and liabilities are translated into the reporting currency of the Group by applying the exchange rate at the balance sheet date and the income statement is translated at the average exchange rate for the year. The resulting difference on exchange is included as a cumulative translation adjustment in other comprehensive income. On disposal of an entity, the deferred cumulative amount recognised in other comprehensive income relating to that operation is recognised in the income statement.
(e) Property, plant and equipment
Property, plant and equipment is stated at cost less accumulated depreciation and impairment, if any. Cost comprises the purchase price and any costs directly attributable to bringing the asset into working condition for its intended use. The cost of self-constructed assets includes the cost of materials, direct labour and an appropriate proportion of production overheads.
The cost less the residual value of each item of property, plant and equipment is depreciated over its useful life. Each item's estimated useful life has been assessed with regard to both its own physical life limitations and the present assessment of economically recoverable reserves of the mine property at which the item is located. Estimates of remaining useful lives are made on a regular basis for all mine buildings, machinery and equipment, with annual reassessments for major items. Depreciation is charged to cost of sales on a unit-of-production (UOP) basis for mine buildings and installations, plant and equipment used in the mine production process (except mobile equipment) or on a straight-line basis over the estimated useful life of the individual asset that are not related to the mine production process. Changes in estimates, which mainly affect unit-of-production calculations, are accounted for prospectively. Depreciation commences when assets are available for use. Land is not depreciated.
The average expected useful lives based on actual life of mines are as follows:
|
|
Years |
|
Buildings |
6 |
|
Plant and equipment |
10 |
|
Mining properties and development costs1 |
10 |
|
Other assets |
5 |
1 Depreciation of mining properties and development cost are determined using the unit-of-production method.
An item of property, plant and equipment is de-recognised upon disposal or when no future economic benefits are expected from its use or disposal. Any gain or loss arising at de-recognition of the asset (calculated as the difference between the net disposal proceeds and the carrying amount of the asset) is included in the income statement in the year that the asset is de-recognised.
Non-current assets or disposal groups are classified as held for sale when it is expected that the carrying amount of the asset will be recovered principally through sale rather than through continuing use. Assets are not depreciated when classified as held for sale.
Disposal of assets
Gains or losses from the disposal of assets are recognised in the income statement when all significant risks and rewards of ownership are transferred to the customer, usually when title has been passed.
Mining properties and development costs
Payments for mining concessions are expensed during the exploration phase of a prospect and capitalised during the development of the project when incurred.
Purchased rights to ore reserves and mineral resources are recognised as assets at their cost of acquisition or at fair value if purchased as part of a business combination.
Mining concessions, when capitalised, are amortised on a straight-line basis over the period of time in which benefits are expected to be obtained from that specific concession.
Mine development costs are capitalised as part of property, plant and equipment. Mine development activities commence once a feasibility study has been performed for the specific project. When an exploration prospect has entered into the advanced exploration phase and sufficient evidence of the probability of the existence of economically recoverable minerals has been obtained pre-operative expenses relating to mine preparation works are also capitalised as a mine development cost.
The initial cost of a mining property comprises its construction cost, any costs directly attributable to bringing the mining property into operation, the initial estimate of the provision for mine closure cost, and, for qualifying assets, borrowing costs. The Group ceases the capitalisation of borrowing costs when the physical construction of the asset is complete and is ready for its intended use.
Ore generated as part of the development stage may be processed and sold, giving rise to revenue before the commencement of commercial production. Where such processing is necessary to bring mining assets into the condition required for their intended use (for example, in testing the plants at the mining unit in development), revenues from metals recovered from such activities are recognised in profit or loss.
Upon commencement of production, capitalised expenditure is depreciated using the unit-of-production method based on the estimated economically proven and probable reserves to which they relate.
Mining properties and mine development are stated at cost, less accumulated depreciation and impairment in value, if any.
Construction in progress
Assets in the course of construction are capitalised as a separate component of property, plant and equipment. On completion, the cost of construction is transferred to the appropriate category of property, plant and equipment. The cost of construction in progress is not depreciated.
Subsequent expenditures
All subsequent expenditure on property, plant and equipment is capitalised if it meets the recognition criteria, and the carrying amount of those parts that are replaced, is de-recognised. All other expenditure including repairs and maintenance expenditure is recognised in the income statement as incurred.
Stripping costs
In a surface mine operation, it is necessary to remove overburden and other waste material in order to gain access to the ore bodies (stripping activity). During development and pre-production phases, the stripping activity costs are capitalised as part of the initial cost of development and construction of the mine (the stripping activity asset) and charged as depreciation or depletion to cost of sales, in the income statement, based on the mine's units of production once commercial operations begin.
Removal of waste material normally continues throughout the life of a surface mine. At the time that saleable material begins to be extracted from the surface mine the activity is referred to as production stripping.
Production stripping cost is capitalised only if the following criteria are met:
· It is probable that the future economic benefits (improved access to an ore body) associated with the stripping activity will flow to the Group;
· The Group can identify the component of an ore body for which access has been improved; and
· The costs relating to the improved access to that component can be measured reliably.
If not all of the criteria are met, the production stripping costs are charged to the income statement as operating costs as they are incurred.
Stripping activity costs associated with such development activities are capitalised into existing mining development assets, as mining properties and development cost, within property, plant and equipment, using a measure that considers the volume of waste extracted compared with expected volume, for a given volume of ore production. This measure is known as "component stripping ratio", which is revised annually in accordance with the mine plan. The amount capitalised is subsequently depreciated over the expected useful life of the identified component of the ore body related to the stripping activity asset, by using the units of production method. The identification of components and the expected useful lives of those components are evaluated as new information of reserves and resources is available.
The capitalised stripping activity asset is carried at cost less accumulated depletion/depreciation, less impairment, if any. Cost includes the accumulation of costs directly incurred to perform the stripping activity that improves access to the identified component of ore, plus an allocation of directly attributable overhead costs. The costs associated with incidental operations are excluded from the cost of the stripping activity asset.
(f) Impairment of non-financial assets
The carrying amounts of non-financial assets are reviewed for impairment if events or changes in circumstances indicate that the carrying value may not be recoverable. At each reporting date, an assessment is made to determine whether there are any indicators of impairment. If there are indicators of impairment, an exercise is undertaken to determine whether carrying values are in excess of their recoverable amount. Such reviews are undertaken on an asset by asset basis, except where such assets do not generate cash flows independent of those from other assets or groups of assets, and then the review is undertaken at the cash generating unit level.
If the carrying amount of an asset or its cash generating unit exceeds the recoverable amount, a provision is recorded to reflect the asset at the recoverable amount in the balance sheet. Impairment losses are recognised in the income statement.
The recoverable amount of an asset
The recoverable amount of an asset is the greater of its value in use and fair value less costs of disposal. In assessing value in use, estimated future cash flows are discounted to their present value using a pre-tax discount rate that reflects current market assessments of the time value of money and the risks specific to the asset. The cash flows used to determine the recoverable amount of mining assets are based on the mine plan for each mine. The mine plan is determined based on the estimated and economically proven and probable reserves, as well as certain other resources that are assessed as highly likely to be converted into reserves. Fair value less cost of disposal is based on an estimate of the amount that the Group may obtain in an orderly sale transaction between market participants. For an asset that does not generate cash inflows largely independently of those from other assets, or groups of assets, the recoverable amount is determined for the cash generating unit to which the asset belongs. The Group's cash generating units are the smallest identifiable groups of assets that generate cash inflows that are largely independent of the cash inflows from other assets or groups of assets.
Reversal of impairment
An assessment is made each reporting date as to whether there is any indication that previously recognised impairment losses may no longer exist or may have decreased. If such an indication exists, the Group makes an estimate of the recoverable amount. A previously recognised impairment loss is reversed only if there has been a change in estimates used to determine the asset's recoverable amount since the impairment loss was recognised. If that is the case, the carrying amount of the asset is increased to the recoverable amount. That increased amount cannot exceed the carrying amount that would have been determined, net of depreciation, had no impairment loss been recognised in previous years. Such impairment loss reversal is recognised in the income statement.
(g) Financial assets and liabilities
Financial assets
The Group classifies its financial assets in the following measurement categories:
· those to be measured at amortised cost.
· those to be measured subsequently at FVOCI, and.
· those to be measured subsequently at fair value through profit or loss.
The classification depends on the Group's business model for managing the financial assets and the contractual terms of the cash flows.
For assets measured at fair value, gains and losses will either be recorded in profit or loss or OCI. For investments in equity instruments that are not held for trading, this will depend on whether the group has made an irrevocable election at the time of initial recognition to account for the equity investment at FVOCI.
The Group reclassifies debt investments when and only when its business model for managing those assets changes.
Purchases or sales of financial assets that require delivery of assets within a time frame established by regulation or convention in the market place (regular way trades) are recognised on the trade date, i.e., the date that the Group commits to purchase or sell the asset.
At initial recognition, the Group measures a financial asset at its fair value plus, in the case of a financial asset not at fair value through profit or loss (FVPL), transaction costs that are directly attributable to the acquisition of the financial asset. Transaction costs of financial assets carried at FVPL are expensed in profit or loss.
Financial assets with embedded derivatives are considered in their entirety when determining whether their cash flows are solely payment of principal and interest.
Subsequent measurement of debt instruments depends on the Group's business model for managing the asset and the cash flow characteristics of the asset.
Classification
The Group holds the following financial assets:
Amortised cost
Assets that are held for collection of contractual cash flows where those cash flows represent solely payments of principal and interest are measured at amortised cost. Interest income from these financial assets is included in finance income using the effective interest rate method. Gains and losses are recognised in profit or loss when the asset is derecognised, modified or impaired.
The Group's financial assets at amortised cost include receivables (other than trade receivables which are measured at fair value through profit and loss).
Equity instruments designated as fair value through other comprehensive income
Upon initial recognition, the Group can elect to classify irrevocably its equity investments as equity instruments designated at fair value through OCI when they meet the definition of equity under IAS 32 Financial Instruments: Presentation and are not held for trading. The classification is determined on an instrument-by-instrument basis.
Gains and losses on these financial assets are never recycled to profit or loss. Dividends are recognised as other income in the statement of profit or loss when the right of payment has been established, except when the Group benefits from such proceeds as a recovery of part of the cost of the financial asset, in which case, such gains are recorded in OCI. Equity instruments designated at fair value through OCI are not subject to impairment assessment.
The Group elected to classify irrevocably its listed equity investments under this category.
Fair value through profit or loss
Assets that do not meet the criteria for amortised cost or FVOCI are measured at FVPL. A gain or loss on a debt investment that is subsequently measured at FVPL is recognised in profit or loss and presented net within other gains/(losses) in the period in which it arises.
Changes in the fair value of financial assets at FVPL are recognised in other gains/(losses) in the statement of profit or loss as applicable.
The Group's trade receivables and derivative financial instruments, including the Silverstream contract, are classified as fair value through profit or loss.
De-recognition of financial assets
Financial assets are derecognised when the rights to receive cash flows from the financial assets have expired or have been transferred and the Group has transferred substantially all the risks and rewards of ownership.
Impairment of financial assets
The Group assesses on a forward-looking basis the expected credit losses associated with its debt instruments carried at amortised cost and FVOCI. The impairment methodology applied depends on whether there has been a significant increase in credit risk.
For receivables (other than trade receivables which are measured at FVPL), the Group applies the simplified approach permitted by IFRS 9, which requires expected lifetime losses to be recognised from initial recognition of the receivables.
Financial liabilities
The Group classifies its financial liabilities as follows:
Financial liabilities are classified, at initial recognition, as financial liabilities at fair value through profit or loss, loans and borrowings, payables, or as derivatives designated as hedging instruments in an effective hedge, as appropriate.
All financial liabilities are recognised initially at fair value and, in the case of loans and borrowings and payables, net of directly attributable transaction costs.
The Group's financial liabilities include trade and other payables, loans and borrowings and derivative financial instruments.
Measurement
For purposes of subsequent measurement, financial liabilities held by the Group are classified as financial liabilities as amortised cost.
After initial recognition, interest-bearing loans and borrowings are subsequently measured at amortised cost using the effective interest rate (EIR) method. Gains and losses are recognised in profit or loss when the liabilities are derecognised as well as through the EIR amortisation process.
Amortised cost is calculated by considering any discount or premium on acquisition and fees or costs that are an integral part of the EIR. The EIR amortisation is included as finance costs in the statement of profit or loss.
De-recognition of financial liabilities
A financial liability is derecognised when the obligation under the liability is discharged or cancelled or expires. When an existing financial liability is replaced by another from the same lender on substantially different terms, or the terms of an existing liability are substantially modified, such an exchange or modification is treated as the derecognition of the original liability and the recognition of a new liability. The difference in the respective carrying amounts is recognised in the statement of profit or loss.
(h) Inventories
Finished goods, work in progress and ore stockpile inventories are measured at the lower of cost and net realisable value. Cost is determined using the weighted average cost method based on cost of production which excludes borrowing costs.
For this purpose, the costs of production include:
- personnel expenses, which include employee profit sharing;
- materials and contractor expenses which are directly attributable to the extraction and processing of ore;
- the depreciation of property, plant and equipment used in the extraction and processing of ore; and
- related production overheads (based on normal operating capacity).
Work in progress inventory comprises ore in leaching pads as processing is required to extract benefit from the ore. The recovery of gold is achieved through the heap leaching process. The leaching process may take months to obtain the expected metal recovery and mainly depends on the continuity of the leaching process. When the ore in leaching pads is in active leaching, it is classified as current. When the leaching process has stopped and not expected to restart within twelve months, ore in the leaching pads affected is classified as non-current.
Operating materials and spare parts are valued at the lower of cost or net realisable value. An allowance for obsolete and slow-moving inventories is determined by reference to specific items of stock. A regular review is undertaken by management to determine the extent of such an allowance.
Net realisable value is the estimated selling price in the ordinary course of business less any further costs expected to be incurred to completion and disposal.
(i) Short-term investments
Where the Group invests in short-term instruments with a maturity higher than three months and which are either not readily convertible into known amounts of cash or are subject to risk of changes in value that are not insignificant, these instruments are classified as short-term investments.
(j) Cash and cash equivalents
For the purposes of the balance sheet, cash and cash equivalents comprise cash at bank, cash on hand and short-term deposits held with banks that are readily convertible into known amounts of cash and which are subject to insignificant risk of changes in value. Short-term deposits earn interest at the respective short-term deposit rates between one day and three months.
(k) Provisions
Mine closure cost
A provision for mine closure cost is made in respect of the estimated future costs of closure, restoration and for environmental rehabilitation costs (which include the dismantling and demolition of infrastructure, removal of residual materials and remediation of disturbed areas) based on a mine closure plan, in the accounting period when the related environmental disturbance occurs. The provision is discounted and the unwinding of the discount is included within finance costs. At the time of establishing the provision, a corresponding asset is capitalised where it gives rise to a future economic benefit and is depreciated over future production considering proven and probable reserves from the mine to which it relates. The provision is reviewed on an annual basis by the Group for changes in cost estimates, discount rates or life of operations based on the estimated mine production which includes ore reserves and a certain amount of mineral resources. Changes to estimated future costs are recognised in the balance sheet by adjusting the mine closure cost liability and the related asset originally recognised. If, for mature mines, the revised mine assets net of mine closure cost provisions exceed the recoverable value, the portion of the increase is charged directly as an expense. For closed sites, changes to estimated costs are recognised immediately in profit or loss.
(l) Employee benefits
The Group operates the following plans for its employees based on Mexico:
Defined benefit pension plan
This funded plan is based on each employee's earnings and years of service. This plan was open to all employees in Mexico until it was closed to new entrants on 1 July 2007. The plan is denominated in Mexican Pesos. For members as at 30 June 2007, benefits were frozen at that date subject to indexation with reference to the Mexican National Consumer Price Index (NCPI).
The present value of defined benefit obligations under the plan is determined using the projected unit credit actuarial valuation method and prepared by an external actuarial firm as at each year-end balance sheet date. The discount rate is the yield on bonds that have maturity dates approximating the terms of the Group's obligations and that are denominated in the same currency in which the benefits are expected to be paid. Actuarial gains or losses are recognised in OCI and permanently excluded from profit or loss.
Past service costs are recognised when the plan amendment or curtailment occurs and when the entity recognises related restructuring costs or termination benefits.
The defined benefit asset or liability comprises the present value of the defined benefit obligation less the fair value of plan assets out of which the obligations are to be settled directly. The value of any asset is restricted to the present value of any economic benefits available in the form of refunds from the plan or reductions in the future contributions to the plan.
Net interest cost is recognised within finance cost and return on plan assets (other than amounts reflected in net interest cost) is recognised in OCI and permanently excluded from profit or loss.
Defined contribution pension plan
A defined contribution plan is a post-employment benefit plan under which the Group pays fixed contributions into a separate entity and has no legal or constructive obligation to pay further amounts. Obligations for contributions to defined contribution pension plans are recognised as an employee benefit expense in profit or loss when they are due. The contributions are based on the employee's salary.
This plan started on 1 July 2007 and it is voluntary for all employees to join this scheme.
Seniority premium for voluntary separation
This unfunded plan corresponds to an additional payment over the legal seniority premium equivalent to approximately 12 days of salary per year for those unionised workers who have more than 15 years of service. Non-unionised employees with more than 15 years of service have the right to a payment equivalent to 12 days for each year of service. For both cases, the payment is based on the legal current minimum salary.
The cost of providing benefits for the seniority premium for voluntary separation is determined using the projected unit credit actuarial valuation method and prepared by an external actuarial firm as at each year-end balance sheet date. Actuarial gains or losses are recognised as income or expense in the period in which they occur.
Other
Benefits for death and disability are covered through insurance policies.
Termination payments for involuntary retirement (dismissals) are charged to the income statement, when incurred.
(m) Employee profit sharing
In accordance with the Mexican legislation, companies in Mexico are subject to pay for employee profit sharing ('PTU') equivalent to ten percent of the taxable income of each fiscal year capped to three months of salary or average of the profit sharing paid in the last three years.
PTU is calculated based on the services rendered by employees during the year, considering their most recent salaries. The liability is recognised as it accrues and is charged to the income statement as personnel expenses. PTU, paid in each fiscal year, is deductible for income tax purposes.
(n) Leases
Group as a lessee
The Group assesses at contract inception whether a contract is, or contains, a lease. That is, if the contract conveys the right to control the use of an identified asset for a period of time in exchange for consideration.
Assets and liabilities arising from a lease are initially measured on a present value basis. Lease liabilities include the net present value of the following lease payments:
- fixed payments (including in-substance fixed payments), less any lease incentives receivable variable lease payment that are based on an index or a rate;
- amounts expected to be payable by the lessee under residual value guarantees;
- the exercise price of a purchase option if the lessee is reasonably certain to exercise that option; and
- payments of penalties for terminating the lease, if the lease term reflects the lessee exercising that option.
The lease payments are discounted using the interest rate implicit in the lease. If that rate cannot be determined, the lessee's incremental borrowing rate is used, being the rate that the lessee would have to pay to borrow the funds necessary to obtain an asset of similar value in a similar economic environment with similar terms and conditions.
Right-of-use assets are measured at cost comprising the following:
- the amount of the initial measurement of lease liability;
- any lease payments made at or before the commencement date less any lease incentives received;
- any initial direct costs; and
- restoration costs.
Each lease payment is allocated between the liability and finance cost. The finance cost is charged to profit or loss over the lease period so as to produce a constant periodic rate of interest on the remaining balance of the liability for each period. The right-of-use asset is depreciated over the shorter of the asset's useful life and the lease term on a straight-line basis.
The Group is exposed to potential future increases in variable lease payments based on an index or rate, which are not included in the lease liability until they take effect. When adjustments to lease payments based on an index or rate take effect, the lease liability is reassessed and adjusted against the right-of-use asset.
Variable lease payments that are not linked to price changes due to changes in a market rate or the value of an index and are linked to future performance or use of an underlying asset are not included in the measurement of the lease liability. Such costs are recognized in profit and loss as incurred.
Payments associated with short-term leases and leases of low-value assets are recognised on a straight-line basis as an expense in profit or loss. Short-term leases are leases with a lease term of 12 months or less. Low-value assets comprise IT-equipment.
(o) Revenue from contracts with customers
Revenue is recognised when control of goods or services transfers to the customers based on the performance obligations settle in the contracts with customers.
Sale of goods
Revenue associated with the sale of concentrates, doré, slag, precipitates and activated carbon (the products) is recognised when control of the asset sold is transferred to the customers. Indicators of control transferring include an unconditional obligation to pay, legal title, physical possession, transfer of risk and rewards and customers' acceptance. This generally occurs when the goods are delivered to the customer's smelter or refinery agreed with the buyer; at which point the buyer controls the goods.
The revenue is measured at the amount to which the Group expects to be entitled, being the estimate of the price expected to be received in the expected month of settlement and the Group's estimate of metal quantities based on assay data, and a corresponding trade receivable is recognised. Any future changes that occur before settlement are embedded within the provisionally priced trade receivables and are, therefore, within the scope of IFRS 9 and not within the scope of IFRS 15.
Given the exposure to the commodity price, these provisionally priced trade receivables will fail the cash flow characteristics test within IFRS 9 and will be required to be measured at fair value through profit or loss up from initial recognition and until the date of settlement. These subsequent changes in fair value are recognised in revenue but separately from revenue from contracts with customers.
Invoiced revenues to our customers for products other than refined silver and gold, are derived from the value of metal content which is determined by commodity market prices and adjusted for the treatment and refining charges to be incurred by the metallurgical complex of our customers. Refining and treatment charges represent an element of the cost that will be incurred by our customers in processing the products further to extract the metal content for onward sale to its customers (See note 5(c)).
(p) Exploration expenses
Exploration activity involves the search for mineral resources, the determination of technical feasibility and the assessment of commercial viability of an identified resource.
Exploration expenses are charged to the income statement as incurred and are recorded in the following captions:
Cost of sales: costs relating to in-mine exploration, that ensure continuous extraction quality and extend mine life, and
Exploration expenses:
- Costs incurred in geographical proximity to existing mines in order to replenish or increase reserves, and
- Costs incurred in regional exploration with the objective of locating new ore deposits, which are identified by project, in areas where the Group carriers out exploration activity. Currently the Group carries out exploration activities in Mexico and Latin America.
- Costs incurred are charged to the income statement until there is sufficient probability of the existence of economically recoverable minerals and a feasibility study has been performed for the specific project from which time further expenses are capitalised as exploration costs on balance sheet as Property, plant and equipment.
(q) Selling expenses
The Group recognises in selling expenses a levy in respect of the Extraordinary Mining Right as sales of gold and silver are recognised. The Extraordinary Mining Right consists of a 1.0% (2024: 0.5%) rate, applicable to the owners of mining titles in Mexico. The payment must be calculated over the total sales of all mining concessions. The payment of this mining right must be remitted no later than the last business day of March of the following year and can be credited against corporate income tax.
The Group also recognises in selling expenses a discovery premium royalty equivalent to 1% of the value of the mineral extracted and sold during the year from certain mining titles granted by the Mexican Geological Survey (SGM) in the San Julian mine. The premium is settled to SGM on a quarterly basis.
(r) Taxation
Current income tax
Current income tax assets and liabilities for the current and prior periods are measured at the amount expected to be recovered from or paid to the taxation authorities. The tax rates and tax laws used to compute the amount are those that are enacted or substantively enacted, at the reporting date in the country in which the Group operates.
Deferred income tax
Deferred income tax is provided using the liability method on temporary differences at the balance sheet date between the tax bases of assets and liabilities and their carrying amounts for financial reporting purposes.
Deferred income tax liabilities are recognised for all taxable temporary differences, except:
· where the deferred income tax liability arises from the initial recognition of goodwill or of an asset or liability in a transaction that is not a business combination and, at the time of transaction, affects neither the accounting profit nor taxable profit loss; and
· in respect of taxable temporary differences associated with investments in subsidiaries, associates and interests in joint ventures, where the timing of the reversal of the temporary differences can be controlled and it is probable that the temporary differences will not reverse in the foreseeable future.
Deferred income tax assets are recognised for all deductible temporary differences, carry forward of unused tax credits and unused tax losses, to the extent that it is probable that taxable profit will be available against which the deductible temporary differences, and the carry forward of unused tax credits and unused tax losses can be utilised, except:
· where the deferred income tax asset relating to deductible temporary differences arise from the initial recognition of an asset or liability in a transaction that is not a business combination and, at the time of the transaction, affects neither the accounting profit nor taxable profit or loss; and in respect of deductible temporary differences associated with investments in subsidiaries, associates and interests in joint ventures, deferred income tax assets are recognised only to the extent that it is probable that the temporary differences will reverse in the foreseeable future and taxable profit will be available against which the temporary differences can be utilised.
The carrying amount of deferred income tax assets is reviewed at each balance sheet date and reduced to the extent that it is no longer probable that sufficient taxable profit will be available to allow all or part of the deferred income tax asset to be utilised.
Unrecognised deferred income tax assets are reassessed at each balance sheet date and are recognised to the extent that it has become probable that future taxable profit will allow the deferred tax asset to be recovered.
Deferred income tax assets and liabilities are measured at the tax rates that are expected to apply to the year when the asset is realised or the liability is settled, based on tax rates (and tax laws) that have been enacted or substantively enacted at the balance sheet date.
Deferred income tax relating to items recognised directly in other comprehensive income is recognised in equity and not in the income statement.
Deferred income tax assets and deferred income tax liabilities are offset, if a legally enforceable right exists to set off current tax assets against current income tax liabilities and the deferred income taxes relate to the same taxable entity and the same taxation authority.
Mining Rights
The Special Mining Right is considered an income tax under IFRS and states that the owners of mining titles and concessions in Mexico are subject to pay an annual mining right of 8.5% (2024: 7.5%) of the profit derived from the extractive activities (note 11 (e)). The Group recognises deferred tax assets and liabilities on temporary differences arising in the determination of the Special Mining Right ( note 11).
Sales tax
Expenses and assets are recognised net of the amount of sales tax, except when the sales tax incurred on a purchase of assets or services is not recoverable from the taxation authority, in which case, the sales tax is recognised as part of the cost of acquisition of the asset or as part of the expense item. The net amount of sales tax recoverable from, or payable to, the taxation authority is included as part of receivables or payables in the balance sheet.
(s) Derivative financial instruments and hedging
The Group uses derivatives to reduce certain market risks derived from changes in foreign exchange which impact its financial and business transactions.
Such derivative financial instruments are initially recognised at fair value on the date on which a derivative contract is entered into and are subsequently remeasured at fair value. Derivatives are carried as assets when the fair value is positive and as liabilities when the fair value is negative. The full fair value of a derivative is classified as non-current asset or liability if the remaining maturity of the item is more than 12 months.
Any gains or losses arising from changes in fair value on derivatives during the year that do not qualify for hedge accounting are taken directly to the income statement as finance income or finance cost respectively.
Derivatives are valued using valuation approaches and methodologies (such as Black Scholes and Net Present Value) applicable to the specific type of derivative instrument. The fair value of forward currency and commodity contracts is calculated by reference to current forward exchange rates for contracts with similar maturity profiles, European foreign exchange and commodity options are valued using the Black Scholes model. The Silverstream contract is valued using a Net Present Value valuation approach.
The documentation includes identification of the hedging instrument, the hedged item, the nature of the risk being hedged and how the Group will assess whether the hedging relationship meets the hedge effectiveness requirements (including the analysis of sources of hedge ineffectiveness and how the hedge ratio is determined). A hedging relationship qualifies for hedge accounting if it meets all of the following effectiveness requirements:
• There is 'an economic relationship' between the hedged item and the hedging instrument.
• The effect of credit risk does not 'dominate the value changes' that result from that economic relationship.
• The hedge ratio of the hedging relationship is the same as that resulting from the quantity of the hedged item that the Group actually hedges and the quantity of the hedging instrument that the Group actually uses to hedge that quantity of hedged item.
Hedges which meet the criteria for hedge accounting are accounted for as cash flow hedges.
For derivatives that are designated and qualify as cash flow hedges, the effective portion of changes in the fair value of derivative instruments is recorded as in other comprehensive income and are transferred to the income statement when the hedged transaction affects profit or loss, such as when a forecast sale or purchase occurs. For gains or losses related to the hedging of foreign exchange risk these are included, in the line item in which the hedged costs are reflected. Where the hedged item is the cost of a non-financial asset or liability, the amounts recognised in other comprehensive income are transferred to the initial carrying amount of the non-financial asset or liability. This is not a reclassification adjustment and will not be recognised in OCI for the period. The ineffective portion of changes in the fair value of cash flow hedges is recognised directly as finance costs, in the income statement of the related period.
If the hedging instrument expires or is sold, terminated or exercised without replacement or rollover, or if its designation as a hedge is revoked, any cumulative gain or loss recognised directly in other comprehensive income from the period that the hedge was effective remains separately in other comprehensive income until the forecast transaction occurs, when it is recognised in the income statement. When a forecast transaction is no longer expected to occur, the cumulative gain or loss that was reported in other comprehensive income is immediately transferred to the income statement.
When hedging with options, the Group designates only the intrinsic value movement of the hedging option within the hedge relationship. The time value of the option contracts is therefore excluded from the hedge designation. In such cases, changes in the time value of options are initially recognised in OCI as a cost of hedging. Where the hedged item is transaction related, amounts initially recognised in OCI related to the change in the time value of options are reclassified to profit or loss or as a basis adjustment to non-financial assets or liabilities upon maturity of the hedged item, or, in the case of a hedged item that realises over time, the amounts initially recognised in OCI are amortised to profit or loss on a systematic and rational basis over the life of the hedged item.
When hedging with forward contracts, the forward element is included in the designation of the financial instrument. Therefore, there is no cost of hedging in relation to forward contracts.
(t) Borrowing costs
Borrowing costs directly attributable to the acquisition, construction or production of an asset that necessarily takes 12 or more months to get ready for its intended use or sale (a qualifying asset) are capitalised as part of the cost of the respective asset. Borrowing costs consist of interest and other costs that an entity incurs in connection with the borrowing of funds.
Where funds are borrowed specifically to finance a project, the amount capitalised represents the actual borrowing costs incurred. Where surplus funds are available for a short term from funds borrowed specifically to finance a project, the income generated from the temporary investment of such amounts is also capitalised and deducted from the total capitalised borrowing cost. Where the funds used to finance a project form part of general borrowings, the amount capitalised is calculated using a weighted average of rates applicable to relevant general borrowings of the Group during the period.
All other borrowing costs are recognised in the income statement in the period in which they are incurred.
(u) Fair value measurement
The Group measures financial instruments at fair value at each balance sheet date. Fair values of financial instruments measured at amortised cost are disclosed in note 30(b).
Fair value is the price that would be received to sell an asset or paid to transfer a liability in an orderly transaction between market participants at the measurement date. The fair value measurement is based on the presumption that the transaction to sell the asset or transfer the liability takes place either:
In the principal market for the asset or liability, or;
In the absence of a principal market, in the most advantageous market for the asset or liability.
The principal or the most advantageous market must be accessible to the Group.
The fair value of an asset or a liability is measured using the assumptions that market participants would use when pricing the asset or liability, assuming that market participants act in their economic best interest.
A fair value measurement of a non-financial asset takes into account a market participant's ability to generate economic benefits by using the asset in its highest and best use or by selling it to another market participant that would use the asset in its highest and best use.
The Group uses valuation techniques that are appropriate in the circumstances and for which sufficient data are available to measure fair value, maximising the use of relevant observable inputs and minimising the use of unobservable inputs.
All assets and liabilities for which fair value is measured or disclosed in the financial statements are categorised within the fair value hierarchy, described as follows, based on the lowest level input that is significant to the fair value measurement as a whole:
Level 1 - Quoted (unadjusted) market prices in active markets for identical assets or liabilities
Level 2 - Valuation techniques for which the lowest level input that is significant to the fair value measurement is directly or indirectly observable
Level 3 - Valuation techniques for which the lowest level input that is significant to the fair value measurement is unobservable
For assets and liabilities that are recognised in the financial statements on a recurring basis, the Group determines whether transfers have occurred between levels in the hierarchy by re-assessing categorisation (based on the lowest level input that is significant to the fair value measurement as a whole) at the end of each reporting period.
For the purpose of fair value disclosures, the Group has determined classes of assets and liabilities based on the nature, characteristics and risks of the asset or liability and the level of the fair value hierarchy as explained above. Further information on fair values is described in note 30.
(v) Dividend distribution
Dividends on the Company's ordinary shares are recognised when they have been appropriately authorised and are no longer at the Company's discretion. Accordingly, interim dividends are recognised when they are paid and final dividends are recognised when they are declared following approval by shareholders at the Company's Annual General Meeting.
3. Segment reporting
For management purposes, the Group is organised into operating segments based on producing mines.
At 31 December 2025, the Group has seven reportable operating segments as follows:
The Fresnillo mine, located in the state of Zacatecas, an underground silver mine;
The Saucito mine, located in the state of Zacatecas, an underground silver mine;
The Cienega mine, located in the state of Durango, an underground silver-gold mine;
The Herradura mine, located in the state of Sonora, a surface gold mine;
The Noche Buena mine, located in state of Sonora, a surface gold mine;
The San Julian mine, located on the border of Chihuahua / Durango states, an underground silver-gold mine, and
The Juanicipio mine, in the State of Zacatecas, an underground silver mine.
The operating performance and financial results for each of these mines are reviewed by management. As the Group´s chief operating decision maker (CODM) does not review segment assets and liabilities, the Group has not disclosed this information.
Management monitors the results of its operating segments separately for the purpose of performance assessment and making decisions about resource allocation. Segment performance is evaluated without taking into account certain adjustments included in Revenue as reported in the consolidated income statement, and certain costs included within Cost of sales and Gross profit which are considered to be outside of the control of the operating management of the mines. The table below provides a reconciliation from segment profit to Gross profit as per the consolidated income statement. Administrative expenses, Exploration expenses, Selling expenses, and Other income and expenses not related to production activities included in the consolidated income statement are not allocated to operating segments. Also, the Group's financing (including finance cost and finance income) and income taxes are managed on a Group basis and are not allocated to operating segments. Transactions between reportable segments are accounted for on an arm's length basis similar to transactions with third parties.
In 2025 99.8% of revenue was derived from customers based in Mexico (2024: 99.6% of revenue was derived from customers based in Mexico)
Operating segments
The following tables present revenue and profit information regarding the Group's operating segments for the year ended 31 December 2025 and 2024, respectively. Revenues for the year ended 31 December 2025 and 2024 include those derived from contracts with customers and other revenues, as shown in note 5.
|
Year ended 31 December 2025 |
|||||||||||||||||||
|
US$ thousands |
Fresnillo |
Herradura |
Cienega |
Saucito |
Noche Buena |
San Julian |
Juanicipio |
Other4 |
Adjustments and eliminations |
Total |
|||||||||
|
Revenues: |
|
|
|
|
|
|
|
|
|
|
|
||||||||
|
Third party1 |
632,318 |
1,239,748 |
230,101 |
1,007,973 |
51,793 |
524,360 |
874,938 |
- |
- |
4,561,231 |
|||||||||
|
Inter-segment |
67,461 |
- |
- |
- |
- |
- |
17,534 |
50,278 |
(135,273) |
- |
|
||||||||
|
Segment revenues |
699,779 |
1,239,748 |
230,101 |
1,007,973 |
51,793 |
524,360 |
892,472 |
50,278 |
(135,273) |
4,561,231 |
|||||||||
|
Segment profit2 |
437,685 |
767,366 |
123,856 |
649,423 |
30,929 |
366,021 |
746,965 |
48,166 |
|
3,170,411 |
|||||||||
|
Depreciation and amortisation in cost of sales |
|
|
|
|
|
|
|
|
|
(490,647) |
|
||||||||
|
Employee profit sharing in cost of sales |
|
|
|
|
|
|
|
|
|
(15,653) |
|
||||||||
|
Gross profit as per the income statement |
|
|
|
|
|
|
|
|
|
2,664,111 |
|
||||||||
|
Capital expenditure3 |
91,837 |
89,873 |
17,555 |
92,149 |
- |
49,704 |
54,412 |
4,611 |
|
400,141 |
|||||||||
1 During 2025 all segment revenues were derived from Met-Mex, except in Juanicipio which includes sales of iron concentrate to another external customers of US$8.5 million.
2 The Group's CODM primarily uses this measure to monitor the operating results directly related to the production of its business units separately to make decisions about resource allocation and performance assessment. Segment profit excludes , depreciation and amortisation and employee profit sharing.
3 Capital expenditure represents the cash outflow in respect of additions to property, plant and equipment, excluding additions relating to changes in the mine closure provision. Significant additions include expansions of tailings dams at Saucito, Fresnillo, Juanicipio, San Julian and Herradura; mining works at San Julian, Fresnillo and Saucito and stripping cost and construction of leaching pads at Herradura mine.
4 Other inter-segment revenue corresponds to leasing services provided by Minera Bermejal, S.A. de C.V; capital expenditure mainly corresponds to Minera Bermejal, S. de R.L. de C.V.
|
Year ended 31 December 2024 |
|||||||||||||||||||
|
US$ thousands |
Fresnillo |
Herradura |
Cienega |
Saucito |
Noche Buena |
San Julian |
Juanicipio |
Other4 |
Adjustments and eliminations |
Total |
|||||||||
|
Revenues: |
|
|
|
|
|
|
|
|
|
|
|
||||||||
|
Third party1 |
499,519 |
883,571 |
222,455 |
764,708 |
42,923 |
455,995 |
627,214 |
- |
- |
3,496,385 |
|||||||||
|
Inter-segment |
36,409 |
- |
- |
- |
- |
- |
152 |
50,839 |
(87,400) |
- |
|
||||||||
|
Segment revenues |
535,928 |
883,571 |
222,455 |
764,708 |
42,923 |
455,995 |
627,366 |
50,839 |
(87,400) |
3,496,385 |
|||||||||
|
Segment profit2 |
277,333 |
323,696 |
92,898 |
405,077 |
4,348 |
253,494 |
475,113 |
49,102 |
(2,662) |
1,878,399 |
|||||||||
|
Depreciation and amortisation in cost of sales |
|
|
|
|
|
|
|
|
|
(619,779) |
|
||||||||
|
Employee profit sharing in cost of sales |
|
|
|
|
|
|
|
|
|
(12,347) |
|
||||||||
|
Gross profit as per the income statement |
|
|
|
|
|
|
|
|
|
1,246,273 |
|
||||||||
|
Capital expenditure3 |
90,335 |
55,049 |
17,111 |
97,270 |
- |
49,429 |
59,263 |
2,085 |
|
370,542 |
|||||||||
1 During 2024 all segment revenues were derived from Met-Mex, except in Juanicipio which includes sales of iron concentrate to another external customers of US$14.7 million.
2 The Group's CODM primarily uses this measure to monitor the operating results directly related to the production of its business units separately to make decisions about resource allocation and performance assessment. Segment profit excludes depreciation and amortisation and employee profit sharing.
3 Capital expenditure represents the cash outflow in respect of additions to property, plant and equipment, excluding additions relating to changes in the mine closure provision. Significant additions include expansions of tailings dams at Saucito, Fresnillo, Juanicipio and San Julian, mining works at San Julian, Fresnillo and Saucito and stripping cost and construction of leaching pads at Herradura mine.
4 Other inter-segment revenue corresponds to leasing services provided by Minera Bermejal, S.A. de C.V; capital expenditure mainly corresponds to Minera Bermejal, S. de R.L. de C.V.
4. Group information
The list of the Company's subsidiaries included in the consolidated financial statements and its principal activities are shown in Note 5 on the Parent Company's separate financial statements. The country of incorporation or registration is also their principal place of business.
(a) Material partly-owned subsidiaries
The table below shows the detail of non-wholly owned subsidiaries of the Group that have non-controlling interests:
|
|
Portion of ownership interest held by non-controlling interest |
Profit (loss) allocated to non-controlling interest |
Accumulated non-controlling interest |
|||
|
|
31-Dec-25 |
31-Dec-24 |
31-Dec-25 |
31-Dec-24 |
31-Dec-25 |
31-Dec-24 |
|
Minera Juanicipio, S. A. de C.V. |
44% |
44% |
170,903 |
90,616 |
335,908 |
266,153 |
|
Equipos Chaparral, S. A. de C.V. |
44% |
44% |
21,773 |
(10,891) |
106,079 |
86,443 |
|
Other subsidiaries with non-controlling interests not considered to be material1 |
- |
- |
(2,835) |
6,046 |
(194) |
2,433 |
1 In October 2024 the Group entered into an exploration joint venture in Chile through its subsidiary Minera Capricornio, SCM (Capricornio) and Sociedad Quimica y Minera de Chile, S.A. de C.V. (SQM), a Chilean mining company. The agreement considers a transfer of 25% ownership which represent a net share of US$0.4 million.
Set out below is the summarised financial information for each subsidiary that has non-controlling interests that are material to the Group. Figures are presented in thousands of US dollars unless otherwise indicated.
Summarised income statement for the year ended 31 December 2025 and 2024
|
|
Minera Juanicipio, S. A. de C.V. |
Equipos Chaparral, S. A. de C.V. |
||
|
|
31-Dec-25 |
31-Dec-24 |
31-Dec-25 |
31-Dec-24 |
|
Revenue |
892,472 |
627,366 |
- |
- |
|
Profit/(loss) before income tax |
562,738 |
366,541 |
55,114 |
(21,698) |
|
Income tax charge |
174,323 |
160,595 |
5,630 |
3,054 |
|
Profit/(loss) for the year |
388,415 |
205,946 |
49,484 |
(24,752) |
|
Other comprehensive (loss)/gain |
(43) |
(30) |
(54) |
90 |
|
Total comprehensive income/(loss) |
388,372 |
205,916 |
49,430 |
(24,662) |
|
Attributable to non-controlling interests |
170,884 |
90,603 |
21,749 |
(10,851) |
|
Dividends paid to non-controlling interests |
(101,200) |
(26,400) |
(2,200) |
- |
Summarised statement of financial position as at 31 December 2025 and 2024
|
|
Minera Juanicipio, S. A. de C.V. |
Equipos Chaparral, S. A. de C.V. |
||
|
|
31-Dec-25 |
31-Dec-24 |
31-Dec-25 |
31-Dec-24 |
|
Current |
|
|
|
|
|
Assets |
532,955 |
161,736 |
22,822 |
29,462 |
|
Liabilities |
(308,024) |
(82,572) |
(12,037) |
(7,919) |
|
Total current net assets |
224,931 |
79,164 |
10,785 |
21,543 |
|
Non-current |
|
|
|
|
|
Assets |
720,588 |
730,074 |
230,314 |
174,871 |
|
Liabilities |
(182,092) |
(204,266) |
(11) |
(6) |
|
Total non-current net assets |
538,496 |
525,808 |
230,303 |
174,865 |
|
Net assets |
763,427 |
604,972 |
241,088 |
196,461 |
|
Attributable to: |
|
|
|
|
|
Equity holders of parent |
427,519 |
338,819 |
135,009 |
110,018 |
|
Non-controlling interest |
335,908 |
266,153 |
106,079 |
86,443 |
Summarised cash flow information for the year ended 31 December 2025 and 2024
|
|
Minera Juanicipio, S. A. de C.V. |
Equipos Chaparral, S. A. de C.V. |
||
|
|
31-Dec-25 |
31-Dec-24 |
31-Dec-25 |
31-Dec-24 |
|
Operating |
532,088 |
354,895 |
8,262 |
17,521 |
|
Investing |
(24,583) |
(40,104) |
383 |
692 |
|
Financing |
(272,087) |
(297,489) |
(9,774) |
(24,485) |
|
Net increase/(decrease) in cash and cash equivalents |
235,418 |
17,302 |
(1,129) |
(6,272) |
5. Revenues
Revenues reflect the sale of goods, being concentrates, doré, slag, precipitates and activated carbon of which the primary contents are silver, gold lead and zinc.
(a) Revenues by source
|
|
Year ended 31 December |
|
|
|
2025 |
2024 |
|
Revenues from contracts with customers |
4,512,948 |
3,503,662 |
|
Revenues from other sources: |
|
|
|
Provisional pricing adjustment on products sold |
48,283 |
(7,277) |
|
|
4,561,231 |
3,496,385 |
(b) Revenues by product sold
|
|
Year ended 31 December |
|
|
|
2025 |
2024 |
|
Lead concentrates (containing silver, gold, lead and by-products) |
2,167,423 |
1,652,909 |
|
Doré and slag (containing gold, silver and by-products) |
816,695 |
753,747 |
|
Zinc concentrates (containing zinc, silver and by-products) |
346,705 |
380,169 |
|
Precipitates (containing gold and silver) |
747,014 |
522,077 |
|
Activated carbon (containing gold, silver and by-products) |
474,847 |
172,747 |
|
Iron concentrates (containing silver, gold, lead and by-products) |
8,547 |
14,736 |
|
|
4,561,231 |
3,496,385 |
|
|
|
|
(c) Value of metal content in products sold
Invoiced revenues are derived from the value of metal content which is determined by commodity market prices and adjusted for the treatment and refining charges to be incurred by the metallurgical complex of our customer. The value of the metal content of the products sold, before treatment and refining charges is considered as an alternative performance measure for the Group. The Group considers this a useful additional measure to help understand underlying factors driving revenue in terms of volumes sold and realised prices. The value of production sold by metal is as follows:
|
|
Year ended 31 December |
|
|
|
2025 |
2024 |
|
Silver |
2,161,932 |
1,673,901 |
|
Gold |
2,071,175 |
1,514,702 |
|
Zinc |
287,594 |
311,557 |
|
Lead |
124,587 |
139,789 |
|
Value of metal content in products sold |
4,645,288 |
3,639,949 |
|
Refining and treatment charges1 |
(84,057) |
(143,564) |
|
Total revenues2, |
4,561,231 |
3,496,385 |
|
|
|
|
1 The methodology to determine the refining and treatment charges takes into account industry benchmark charges and adjustments to reflect ore composition and transport costs (refer to note 27(b).
2 Includes provisional price adjustments which represent changes in the fair value of trade receivables resulting in a gain of US$48.2 million (2024: loss of US$7.2 million). For further detail, refer to note 2(o).
The average realised prices for the gold and silver content of products sold, prior to the deduction of treatment and refining charges, were:
|
|
Year ended 31 December |
|
|
|
2025 |
2024 |
|
Gold |
3,532.74 |
2,453.58 |
|
Silver |
43.60 |
28.78 |
6. Cost of sales
|
|
Year ended 31 December |
|
|
|
2025 |
2024 |
|
Depreciation and amortisation |
490,647 |
619,779 |
|
Contractors |
339,766 |
351,474 |
|
Maintenance and repairs |
288,284 |
289,475 |
|
Operating materials |
243,640 |
304,946 |
|
Personnel expenses (note 8(a)) |
232,099 |
230,312 |
|
Energy |
202,633 |
249,517 |
|
Mining concession rights and contributions |
28,873 |
27,192 |
|
Surveillance |
21,352 |
21,705 |
|
Insurance |
14,911 |
12,727 |
|
Mine equipment leased 1 |
13,577 |
59,156 |
|
IT services |
12,106 |
10,785 |
|
Freight |
6,948 |
7,607 |
|
Other |
24,708 |
29,672 |
|
Cost of production |
1,919,544 |
2,214,347 |
|
Change in work in progress and finished goods (ore inventories) 2 |
(22,424) |
35,765 |
|
|
1,897,120 |
2,250,112 |
1 Corresponds to mine equipment leased to contractors, the lease payments are based on a variable rate linked to the usage of the assets.
2 Refer to note 2 (c) for more detail related to change in work in progress inventories for the year ended 31 December 2025 following a change in estimation.
7. Exploration expenses
|
|
Year ended 31 December |
|
|
|
2025 |
2024 |
|
Contractors |
112,002 |
101,514 |
|
Mining concession rights and contributions |
29,055 |
30,437 |
|
Personnel expenses (note 8(a)) |
15,921 |
15,461 |
|
Assays |
6,585 |
5,746 |
|
Administrative services |
2,167 |
1,406 |
|
Rentals |
1,380 |
869 |
|
Other |
6,421 |
7,615 |
|
|
173,531 |
163,048 |
|
|
|
|
These exploration expenses were mainly incurred in the operating mines located in Mexico; the Guanajuato and Orisyvo projects; and the Tajitos prospect. Exploration expenses of US$13.6 million (2024: US$17.6 million) were incurred in the year on projects located in Peru and Chile.
Cash flows relating to exploration activities are as follows:
|
|
Year ended 31 December |
|
|
|
2025 |
2024 |
|
Operating cash outflows related to exploration activities |
172,925 |
162,837 |
8. Personnel expenses
|
|
Year ended 31 December |
|
|
|
2025 |
2024 |
|
Salaries and wages |
112,100 |
108,800 |
|
Statutory healthcare and housing contributions |
49,086 |
48,214 |
|
Bonuses |
48,675 |
36,547 |
|
Other benefits |
25,048 |
29,704 |
|
Employees' profit sharing |
15,859 |
13,609 |
|
Post-employment benefits |
9,762 |
9,684 |
|
Legal contributions |
6,477 |
5,625 |
|
Vacations and vacations bonus |
6,305 |
8,727 |
|
Training |
2,431 |
1,923 |
|
Other |
4,473 |
4,625 |
|
|
280,216 |
267,458 |
(a) Personnel expenses are reflected in the following line items:
|
|
Year ended 31 December |
|
|
|
2025 |
2024 |
|
Cost of sales (note 6) |
232,099 |
230,312 |
|
Administrative expenses |
32,196 |
21,685 |
|
Exploration expenses (note 7) |
15,921 |
15,461 |
|
|
280,216 |
267,458 |
(b) The monthly average number of employees during the year was as follows:
|
|
Year ended 31 December |
|
|
|
2025 |
2024 |
|
Mining |
3,526 |
3,572 |
|
Plant |
932 |
1,040 |
|
Exploration |
155 |
101 |
|
Maintenance |
1,314 |
1,261 |
|
Administration and other |
1,268 |
1,266 |
|
Total |
7,195 |
7,240 |
9. Other operating income and expenses
|
|
Year ended 31 December |
|
|
|
2025 |
2024 |
|
Other income: |
|
|
|
Gain on sale of mining concessions1 |
13,050 |
24,149 |
|
Insurance claims recovered |
200 |
6,302 |
|
Gain on sale of property, plant and equipment and other assets |
286 |
1,004 |
|
Selling of sundry materials and scrap |
907 |
1,549 |
|
Change in mine closure cost provision2 |
344 |
1,222 |
|
Rentals |
1,934 |
543 |
|
Dividends from Equity instruments at FVOCI |
1,754 |
- |
|
Other |
1,754 |
4,790 |
|
|
20,229 |
39,559 |
|
|
Year ended 31 December |
|
|
|
2025 |
2024 |
|
Other expenses: |
|
|
|
Allowance for obsolete and slow-moving inventories |
3,652 |
6,165 |
|
Donations |
2,909 |
4,517 |
|
Maintenance3 |
6,158 |
3,554 |
|
Indemnities to suppliers |
- |
2,151 |
|
Write-off of PPE assets4 |
15,988 |
1,704 |
|
Change in mine closure cost provision2 |
- |
1,214 |
|
Environmental activities5 |
392 |
599 |
|
Consumption tax expensed |
960 |
709 |
|
Other |
3,279 |
683 |
|
|
33,338 |
21,296 |
1. In 2025 the Group sold certain mining concession that on an individual basis are not material amounts. In July 2024, the Group entered into a contract to assign the rights and obligations of certain mining concessions to Coeur Mexicana, S.A. de C.V., subsidiary of Coeur Mining Inc. The total consideration amounted US$25.0 million. The settlement considers three payments: US$10.0 million that was paid upon ratification of the contract, US$10.0 million that was paid on 3 July 2025, and US$5.0 million that will be paid no later than 30 June 2026.
2 Relates to changes in estimates after the completion of mining activities and adjustment to the value of mine closure assets.
3 Costs relating to the rehabilitation of the facilities of Compañía Minera las Torres, S.A. de C.V. (a closed mine).
4 In 2025, mainly corresponds to assets derecognised in connection with new projects which, in accordance with the energy supply agreement with the state‑owned company (CFE), are required for grid connection and must be transferred to CFE. (2024: mainly corresponds to mobile equipment damaged).
5 Main activities were related to improvement in tailings dam in Cienega (2024: Main activities were related to improvement in tailing dams in Cienega).
10. Finance income and finance costs
|
|
Year ended 31 December |
|
|
|
2025 |
2024 |
|
Finance income: |
|
|
|
Interest on short-term deposits and investments |
84,088 |
42,210 |
|
Interest on tax receivables |
3,856 |
3,117 |
|
Other |
4,605 |
1,609 |
|
|
92,549 |
46,936 |
|
|
Year ended 31 December |
|
|
|
2025 |
2024 |
|
Finance costs: |
|
|
|
Interest on interest-bearing loans and notes payable |
39,675 |
43,845 |
|
Unwinding of discount on provisions (note 21) |
22,360 |
24,997 |
|
Interest on lease liabilities (note 25(a)) |
1,031 |
1,574 |
|
Other |
5,475 |
3,155 |
|
|
68,541 |
73,571 |
11. Income tax expense
a) Major components of income tax expense:
|
|
Year ended 31 December |
|
|
|
2025 |
2024 |
|
Consolidated income statement: |
|
|
|
Corporate income tax |
|
|
|
Current: |
|
|
|
Income tax charge |
567,703 |
187,027 |
|
Amounts (over) / under provided in previous years1 |
(23,030) |
(158) |
|
|
544,673 |
186,869 |
|
Deferred: |
|
|
|
Origination and reversal of temporary differences |
(172,933) |
258,001 |
|
Effects of Silverstream contract |
(56,765) |
(54,683) |
|
|
(229,698) |
203,318 |
|
Corporate income tax |
314,975 |
390,187 |
|
Special mining right |
|
|
|
Current: |
|
|
|
Special mining right charge (note 11 (e)) |
191,417 |
66,469 |
|
Amounts (over)/under provided in previous years |
151 |
(238) |
|
|
191,568 |
66,231 |
|
Deferred: |
|
|
|
Origination and reversal of temporary differences |
1,610 |
60,793 |
|
Special mining right |
193,178 |
127,024 |
|
Income tax expense reported in the income statement |
508,153 |
517,211 |
1 During 2025, the Group received a favourable resolution to apply the incentive for the North border region to prior years, resulting in a decrease in current income tax of US$ 23.0 million.
|
|
Year ended 31 December |
|
|
|
2025 |
2024 |
|
Consolidated statement of comprehensive income: |
|
|
|
Deferred income tax (charge)/credit related to items recognised directly in other comprehensive income: |
|
|
|
Changes in fair value of cash flow hedges |
135 |
60 |
|
Changes in fair value of equity investments at FVOCI |
(21,257) |
(10,593) |
|
Remeasurement losses on defined benefit plans |
389 |
31 |
|
Income tax effect reported in other comprehensive income |
(20,733) |
(10,502) |
(b) Reconciliation of the income tax expense at the Group's statutory income rate to income tax expense at the Group's effective income tax rate:
|
|
Year ended 31 December |
|
|
|
2025 |
2024 |
|
Accounting profit before income tax |
2,081,982 |
743,902 |
|
Tax at the Group's statutory corporate income tax rate 30.0% |
624,595 |
223,171 |
|
Exchange rate effect on tax value of assets and liabilities1 |
(192,494) |
300,243 |
|
Expenses not deductible for tax purposes |
9,023 |
7,122 |
|
Inflationary uplift of the tax base of assets and liabilities |
(50,670) |
(55,170) |
|
Special mining right deductible for corporate income tax |
(58,359) |
(38,107) |
|
Non-taxable/non-deductible foreign exchange effects |
(6,233) |
(18,601) |
|
Update of tax values2 |
- |
(13,468) |
|
Incentive for Northern Border Zone (note 11 (e)) |
425 |
(12,921) |
|
Deferred tax asset not recognised |
10,890 |
6,392 |
|
Inflationary uplift of tax losses |
(1,870) |
(4,701) |
|
Current income tax (over)/underprovided in previous years |
(22,879) |
(1,977) |
|
Inflationary uplift on tax refunds |
(1,157) |
(935) |
|
Other |
3,704 |
(861) |
|
Corporate income tax at the effective tax rate of 15.1% (2024: 52.5%) |
314,975 |
390,187 |
|
Special mining right |
193,178 |
127,024 |
|
Tax at the effective income tax rate of 24.4% (2024: 69.5%) |
508,153 |
517,211 |
1 Mainly derived from the tax value of property, plant and equipment.
2 Correspond to the update of tax values of Juanicipio's property, plant and equipment for assets expensed during 2021 to 2023.
The most significant items reducing the effective tax rate are: a) the exchange rate effect on the tax value of assets and liabilities. This amount reflects the impact of converting the tax base of non-monetary assets (mainly PPE) denominated in Mexican pesos into US dollars at closing foreign exchange rate (instead of historical rates), b) the inflationary uplift of the tax base of assets and liabilities as allowed under Mexican tax regulations, and c) the deduction of the Special Mining Right. The future effects of inflation and exchange rate will depend on future market conditions.
(c) Movements in deferred income tax liabilities and assets:
|
|
Year ended 31 December |
|
|
|
2025 |
2024 |
|
Opening net asset/(liability) |
257,521 |
532,100 |
|
Income statement credit / (charge) arising on corporate income tax |
229,698 |
(203,318) |
|
Income statement charge arising on special mining right |
(1,610) |
(60,793) |
|
Exchange differencewhy |
(16) |
34 |
|
Net charge related to items directly charged to other comprehensive income |
(20,733) |
(10,502) |
|
Closing net asset |
464,860 |
257,521 |
The amounts of deferred income tax assets and liabilities as at 31 December 2025 and 2024, considering the nature of the related temporary differences, are as follows:
|
|
Consolidated balance sheet |
|
Consolidated income statement |
||
|
|
2025 |
2024 US$ thousands |
|
2025 |
2024 |
|
Related party receivables |
(430,412) |
(352,650) |
|
77,762 |
171,414 |
|
Other receivables |
(4,452) |
(11,656) |
|
(7,205) |
5,423 |
|
Inventories |
150,911 |
148,629 |
|
(2,282) |
3,749 |
|
Prepayments |
(4,847) |
(2,939) |
|
1,908 |
(560) |
|
Derivative financial instruments including Silverstream contract |
191 |
(71,833) |
|
(71,889) |
(66,278) |
|
Property, plant and equipment arising from corporate income tax |
478,359 |
300,222 |
|
(178,137) |
66,472 |
|
Exploration expenses and operating liabilities |
106,974 |
90,201 |
|
(16,774) |
17,510 |
|
Other payables and provisions |
81,745 |
73,659 |
|
(8,086) |
14,046 |
|
Losses carried forward |
46,441 |
90,124 |
|
43,683 |
50,999 |
|
Post-employment benefits |
2,819 |
1,821 |
|
(610) |
310 |
|
Deductible profit sharing |
6,089 |
3,974 |
|
(2,115) |
(3,121) |
|
Special mining right deductible for corporate income tax |
92,552 |
39,886 |
|
(52,666) |
(32,441) |
|
Equity investments at FVOCI |
(676) |
(10,017) |
|
(30,598) |
792 |
|
Other |
(9,739) |
7,580 |
|
17,310 |
(24,996) |
|
Net deferred tax asset related to corporate income tax |
515,955 |
307,001 |
|
|
|
|
Deferred tax credit related to corporate income tax |
|
|
|
(229,698) |
203,319 |
|
Related party receivables arising from special mining right |
(120,219) |
(99,487) |
|
20,732 |
54,524 |
|
Inventories arising from special mining right |
41,996 |
41,664 |
|
(332) |
(4,540) |
|
Property plant and equipment arising from special mining right |
(10,688) |
(22,444) |
|
(11,757) |
10,756 |
|
Other |
37,816 |
30,787 |
|
(7,033) |
52 |
|
Net deferred tax liability related to special mining rights |
(51,095) |
(49,480) |
|
|
|
|
Deferred tax (charge)/credit |
|
|
|
(228,088) |
264,111 |
|
Reflected in the statement of financial position as follows: |
|
|
|
|
|
|
Deferred tax assets |
610,367 |
466,734 |
|
|
|
|
Deferred tax liabilities |
(145,507) |
(209,213) |
|
|
|
|
Net deferred tax asset |
464,860 |
257,521 |
|
|
|
Deferred income tax assets and liabilities are offset when there is a legally enforceable right to offset current tax assets against current tax liabilities and when the deferred income tax assets and liabilities relate to the same fiscal authority. Under Mexican tax legislation, tax losses cannot be offset against taxable profits from other legal entities within the same group.
Based on management's internal forecast, a deferred tax asset of US$31.9 million (2024: US$79.6 million) has been recognised in respect of tax losses amounting to US$106.4 million (2024: US$265.3 million). If not utilised, US$15.7 million (2024: US$7.8 million) will expire within five years and US$139.1 million (2024: US$292.6 million) will expire between six and ten years. Of the total deferred tax asset related to losses, US$37.2 million (2024: US$21.7 million) is covered by the existence of taxable temporary differences, the remaining US$9.2 million (2024: US$57.9 million) corresponds to Fresnillo plc which maintained a deferred net asset position. Management has considered the taxable profit generated in the current year of US$190.3 million and based on a consideration of this, combined with future financial and tax projections, Management considers that there is evidence that sufficient taxable profits will be available against which these unused tax losses can be utilised. Management has performed a sensitivity assessment on key inputs of the deferred tax asset assessment, such as interest income or finance expense. Management concluded that there are no reasonably possible changes to these key inputs that could result in the deferred tax asset recognised in respect of tax losses not being recoverable.
The Group has also performed an assessment of the recoverability of tax losses from mining entities based on financial projections that are consistent with the Group's impairment assessment (refer to note 13), together with relevant tax projections which consider the amount and timing of certain tax deductions. Based on those assumptions, the Group expects to fully utilise its recognised losses.
The Group has further tax losses and other similar attributes carried forward for companies out of Mexico of US$146.9 million (2024: US$119.7 million) on which no deferred tax is recognised due to insufficient certainty regarding the availability of appropriate future taxable profits. Based on the applicable tax legislation the tax losses are not subject to expiry.
(d) Unrecognised deferred tax on investments in subsidiaries
The Group has not recognised all of the deferred tax liability in respect of distributable reserves of its subsidiaries because it controls them and only part of the temporary differences is expected to reverse in the foreseeable future. The temporary differences for which a deferred tax liability has not been recognised aggregate to US$1,544.9 million (2024: US$1,139.3 million).
(e) Corporate Income Tax ('Impuesto Sobre la Renta' or 'ISR') and Special Mining Right ("SMR")
The Group's principal operating subsidiaries are Mexican residents for taxation purposes. The rate of current corporate income tax is 30%.
On 30 December 2018, the Decree of tax incentives for the northern border region of Mexico was published in the Official Gazette, which provided a reduction of income tax by a third and also a reduction of 50% of the value added tax rate, for taxpayers that produce income from business activities carried out within the northern border region. The tax incentives were applicable since 1 January 2019 and remained in force until 31 December 2020. On 30 December 2020 an extension of the Decree was published in the Official Gazette which remained in force until 31 December 2024. On 31 December 2025 a further extension of the Decree was published in the Official Gazette which remains in force until 31 December 2026. Some of the Group companies which produce income from business activities carried out within Caborca, Sonora, which is considered for purposes of the Decree as northern border region, applied for this Decree tax incentives before the Mexican tax authorities, and were granted authorization for income tax and value added tax purposes.
The special mining right "SMR" states that the owners of mining titles and concessions are subject to pay an annual mining right of 8.5% of the profit derived from the extractive activities and is considered as income tax under IFRS. The 8.5% tax applies to a base of income before interest, annual inflation adjustment, taxes paid on the regular activity, depreciation and amortization, as defined by the new ISR. This SMR can be credited against the corporate income tax of the same fiscal year and its payment must be remitted no later than the last business day of March of the following year.
12. Earnings per share
Earnings per share ('EPS') is calculated by dividing profit for the year attributable to equity shareholders of the Company by the weighted average number of Ordinary Shares in issue during the period.
The Company has no dilutive potential Ordinary Shares.
As of 31 December 2025 and 2024, earnings per share have been calculated as follows:
|
|
Year ended 31 December |
|
|
|
2025 |
2024 |
|
Earnings: |
|
|
|
Profit attributable to equity holders of the Company |
1,383,988 |
140,920 |
|
Adjusted profit attributable to equity holders of the Company |
1,516,436 |
268,513 |
|
|
|
|
Adjusted profit is profit as disclosed in the Consolidated Income Statement adjusted to exclude revaluation effects of the Silverstream contract of US$189.2 million loss (US$132.4 million net of tax) (2024: US$240.3 million loss (US$168.2 million net of tax)).
Adjusted earnings per share have been provided in order to provide a measure of the underlying performance of the Group, prior to the revaluation effects of the Silverstream contract, a derivative financial instrument.
|
|
2025 |
2024 |
|
Number of shares: |
|
|
|
Weighted average number of Ordinary Shares in issue |
736,894 |
736,894 |
|
|
2025 |
2024 |
|
Earnings per share: |
|
|
|
Basic and diluted earnings per share |
1.878 |
0.191 |
|
Adjusted basic and diluted earnings per Ordinary Share |
2.058 |
0.364 |
|
|
|
|
13. Property, plant and equipment
|
|
Year ended 31 December 20251 |
|||||
|
|
Land and |
Plant and equipment2 |
Mining properties and development costs |
Other assets3 |
Construction in progress |
Total |
|
|
US$ thousands |
|||||
|
Cost |
|
|
|
|
|
|
|
At 1 January 2025 |
478,595 |
3,238,079 |
3,430,657 |
395,029 |
269,613 |
7,811,973 |
|
Additions |
- |
6,994 |
4,056 |
4,250 |
422,812 |
438,112 |
|
Disposals4 |
(3,366) |
(48,596) |
(266,703) |
(1,286) |
- |
(319,951) |
|
Transfers and other movements |
66,032 |
56,520 |
202,934 |
5,352 |
(330,838) |
- |
|
At 31 December 2025 |
541,261 |
3,252,997 |
3,370,944 |
403,345 |
361,587 |
7,930,134 |
|
Accumulated depreciation |
|
|
|
|
|
|
|
At 1 January 2025 |
(282,128) |
(2,230,801) |
(2,463,157) |
(297,222) |
- |
(5,273,308) |
|
Depreciation for the year5 |
(79,209) |
(143,682) |
(253,385) |
(16,506) |
- |
(492,782) |
|
Disposals4 |
1,466 |
37,101 |
262,548 |
875 |
- |
301,990 |
|
At 31 December 2025 |
(359,871) |
(2,337,382) |
(2,453,994) |
(312,853) |
- |
(5,464,100) |
|
Net book amount at 31 December 2025 |
181,390 |
915,615 |
916,950 |
90,492 |
361,587 |
2,466,034 |
1 Amounts include Right-of-use assets as described in note 25.
2 The amount of Property, plant and equipment related to Soledad & Dipolos at 31 December 2025 is US$33.4 million and reflects capitalised mining works and the amount recognised in the cost of
Property plant and equipment related to estimated remediation and closure activities.
3 From the additions in "other assets" category US$6.1 million corresponds to the reassessment of mine closure rehabilitations costs, see note 21.
4 From the total net amount of disposals, US$16.0 million correspond to a write off of assets as disclosed in note 9.
5 Depreciation for the year includes US$491.6 million recognised as an expense in the income statement and US$1.1 million capitalised as part of construction in progress.
|
|
Year ended 31 December 20243 |
|||||
|
|
Land and |
Plant and equipment4 |
Mining properties and development costs |
Other assets2 |
Construction in progress |
Total |
|
|
US$ thousands |
|||||
|
Cost |
|
|
|
|
|
|
|
At 1 January 2024 |
435,884 |
3,132,445 |
3,240,706 |
453,048 |
285,473 |
7,547,556 |
|
Additions |
40,627 |
32,215 |
144,041 |
(51,426) |
136,565 |
302,022 |
|
Disposals5 |
(70) |
(27,069) |
(4,148) |
(6,318) |
- |
(37,605) |
|
Transfers and other movements |
2,154 |
100,488 |
50,058 |
(275) |
(152,425) |
- |
|
At 31 December 2024 |
478,595 |
3,238,079 |
3,430,657 |
395,029 |
269,613 |
7,811,973 |
|
Accumulated depreciation |
|
|
|
|
|
|
|
At 1 January 2024 |
(246,713) |
(1,991,095) |
(2,185,700) |
(263,132) |
- |
(4,686,640) |
|
Depreciation for the year1 |
(35,483) |
(265,219) |
(281,539) |
(40,119) |
- |
(622,360) |
|
Disposals4 |
68 |
25,513 |
4,082 |
6,029 |
- |
35,692 |
|
At 31 December 2024 |
(282,128) |
(2,230,801) |
(2,463,157) |
(297,222) |
- |
(5,273,308) |
|
Net book amount at 31 December 2024 |
196,467 |
1,007,278 |
967,500 |
97,807 |
269,613 |
2,538,665 |
1 Amounts include Right-of-use assets as described in note 25.
2 The amount of Property, plant and equipment related to Soledad & Dipolos at 31 December 2024 is US$30.4 million and reflects capitalised mining works and the amount recognised in the cost of
Property plant and equipment related to estimated remediation and closure activities.
3 From the additions in "other assets" category US($42.7) million corresponds to the reassessment of mine closure rehabilitations costs, see note 21.
4 From the total net amount of disposals, US$1.4 million correspond to a write off of assets as disclosed in note 9.
5 Depreciation for the year includes US$620.9 million recognised as an expense in the income statement and US$1.2 million capitalised as part of construction in progress.
The table below details construction in progress by operating mine and development projects
|
|
Year ended 31 December |
|
|
|
2025 |
2024 |
|
Fresnillo |
62,755 |
60,674 |
|
Saucito |
84,346 |
81,712 |
|
Juanicipio |
60,138 |
48,846 |
|
Cienega |
8,058 |
13,843 |
|
San Julian |
28,371 |
15,820 |
|
Herradura |
117,513 |
48,422 |
|
Other1 |
406 |
296 |
|
|
361,587 |
269,613 |
1 Mainly corresponds to Minera Bermejal, S.A. de C.V. (2024: Minera Bermejal, S.A. de C.V.).
14. Silverstream contract
On 31 December 2007, the Group entered into an agreement with Peñoles through which the Group is entitled to receive the proceeds received by the Peñoles Group in respect of the refined silver sold from the Sabinas Mine ('Sabinas'), a base-metal polymetallic mine owned and operated by the Peñoles Group. The agreement required an upfront payment of US$350 million by Fresnillo. In addition, a per ounce cash payment of US$2.00 in years one to five and US$5.00 thereafter (subject to an inflationary adjustment that commenced from 31 December 2013) is payable to Peñoles. The cash payment to Peñoles per ounce of silver for the year ended 31 December 2025 was US$5.83 per ounce (2024: $5.74 per ounce). Under the contract, the Group has the option to receive a net cash settlement from Peñoles attributable to the silver produced and sold from Sabinas, to take delivery of an equivalent amount of refined silver or to receive settlement in the form of both cash and silver. If, by 31 December 2032, the amount of silver produced by Sabinas were to be less than 60 million ounces, a further payment would have been due from Peñoles to the Group of US$1.0 per ounce of shortfall.
On 12 November 2024 Fresnillo announced it had received notification from Peñoles, the owner and operator of the Sabinas mine, that the mine was experiencing operational and financial difficulties impacting silver production and the long-term viability of the mine and consequently of the Agreement. Fresnillo and Peñoles immediately set up a working group to assess the extent of the challenges faced by the mine and identify a realistic and sustainable solution for the Sabinas mine and the Agreement. As a result, Fresnillo reported a revaluation loss of the Agreement, net of its amortisation and before taxes, of US$182.3 million in its 2024 accounts, valuing the Agreement at US$258.6 million before taxes.
In May 2025 the Group received an updated reserves report that was based on additional information obtained in 2025 from Peñoles for the Sabinas mine, audited independently by SRK Consulting in July, which used a rigorous criterion, including higher cut off grades and new analysis of infill exploration data. This showed a significant reduction in reserves from previous reports (more than 50%). In light of this additional information, a revised mine plan and sequencing programme were drawn up which materially impacted future production and free cash flow projections.
The Group together with Peñoles assessed strategic options for Sabinas given the financial profile of the mine whereby revenues did not cover its operational costs, nor the obligations imposed by the Agreement. These options included changing the terms and conditions of the Silverstream Agreement (increasing the strike price), the transfer of ownership of the mine to Fresnillo (becoming the owner and operator) and other ownership structures, in lieu of the Agreement, or immediate suspension of mine operations for an indefinite period. Based on the analysis and after careful consideration, it was concluded there was no realistic prospect of increasing the expected value of the mine and therefore the options listed above were not considered viable options, nor was continuing the Agreement in its current form viable
Finally, Peñoles offered US$40 million to terminate the Silverstream agreement as an additional alternative. Based on the above-mentioned analysis Management considered this to be the best option in terms of risk and rewards.
The Independent Directors of Fresnillo received financial advice from Bank of America Securities in relation to the consideration payable by Peñoles to Fresnillo to buy back the Silverstream agreement. The Independent Directors considered the valuation offered by the buyback of the Silverstream Agreement was fair and in the best interests of Fresnillo shareholders given the considerable challenges identified.
On 26 August 2025, Fresnillo received the final US$40 million one-off payment from Peñoles, which considers the buyback date to be the 31 July 2025.
Until 31 July 2025, the Silverstream contract represented a derivative financial instrument which had been recorded at FVPL and classified within non-current and current assets as appropriate. In the year ended 31 December 2025 total proceeds received in cash were US$45.9 million, plus US$40 million relating to the final settlement payment (2024: US$30.0 million) of which, US$16.5 million was in respect of proceeds receivable as at 31 December 2024 (2024: US$5.0 million in respect of proceeds receivable as at 31 December 2023). Cash received in respect of the year of US$69.5 million (2024: US$24.9 million) corresponds to 2.0 million ounces of payable silver (2024: 1.4 million ounces). As at 31 December 2025 no amount was due As at 31 December 2024, a further US$16.5 million of cash receivable corresponding to 713,061 ounces of silver was due.
A reconciliation of the beginning balance to the ending balance is shown below:
|
|
|
2025 |
2024 |
|
Balance at 1 January |
|
258,641 |
482,340 |
|
Cash received in respect of the year |
|
(69,429) |
(24,907) |
|
Cash receivable |
|
- |
(16,515) |
|
Remeasurement losses recognised in profit and loss |
|
(189,212) |
(182,276) |
|
Balance at 31 December |
|
- |
258,641 |
|
Less - Current portion |
|
- |
44,204 |
|
Non-current portion |
|
- |
214,437 |
The US$189.2 million realised loss recorded in the income statement (31 December 2024: US$182.3 million loss) mainly resulted from the decrease in reserves in Sabinas mine which underlies the change in the final proceeds.
As of 31 December 2024, the fair value of Silverstream contract was based on the following significant assumptions:
- Forecasted volumes (millions of ounces/moz)
- Silver to be produced and sold over the life of mine 29.0 moz
- Average annual silver to be produced and sold 2.9 moz
- Weighted average discount rate 20.1%
- Future silver prices (US$ per ounce)
|
Year ended 31 December |
Year 1 |
Year 2 |
Year 3 |
Year 4 |
Year 5 |
Long-term |
|
2024 |
29.70 |
31.36 |
32.74 |
33.31 |
33.77 |
24.5 |
15. Inventories
|
|
As at 31 December |
|
|
|
2025 |
2024 |
|
Finished goods1 |
69,704 |
36,766 |
|
Work in progress2 |
259,577 |
274,936 |
|
Ore stockpile3 |
11,087 |
6,281 |
|
Operating materials and spare parts |
179,001 |
177,043 |
|
|
519,369 |
495,026 |
|
Allowance for obsolete and slow-moving inventories |
(16,771) |
(12,849) |
|
Balance as 31 December |
502,598 |
482,177 |
|
Less - Current portion |
432,838 |
412,417 |
|
Non-current portion4 |
69,760 |
69,760 |
1 Finished goods include metals contained in concentrates, doré bars and activated carbon on hand or in transit to a smelter or refinery.
2 Work in progress includes metals contained in ores on leaching pads for an amount of US$218.3 million (2024: US$253.5 million) and in stockpiles US$41.3 million (2024: US$21.4 million) that will be processed in dynamic leaching plants (note 2(c)).
3 Ore stockpile includes ore mineral obtained at Juanicipio.
4 Non-current inventories relate to ore in leaching pads where the leaching process has stopped and is not expected to restart within twelve months. As at 31 December 2025 and 2024 non-current inventories corresponds to Soledad & Dipolos mine unit (note 2 (c)).
Concentrates are a product containing sulphides with variable content of precious and base metals and are sold to smelters and/or refineries. Doré is an alloy containing a variable mixture of gold and silver that is delivered in bar form to refineries. Activated carbon is a product containing variable mixture of gold and silver that is delivered in small particles.
The amount of inventories recognised as an expense in the year was US$1,897 million (2024: US$2,254 million). During 2025 and 2024, there was no adjustment to net realisable value allowance against work-in-progress inventory. The adjustment to the allowance for obsolete and slow-moving inventory recognised as an expense was US$3.9 million (2024: US$6.2 million).
16. Trade and other receivables
|
|
Year ended 31 December |
|
|
|
2025 |
2024 |
|
Trade receivables from related parties (note 27) |
760,177 |
548,760 |
|
Value Added Tax receivable |
46,419 |
89,441 |
|
Other receivables from related parties (note 27a) |
1,355 |
17,339 |
|
Other trade receivables |
6,312 |
2,079 |
|
Other receivables |
16,618 |
16,885 |
|
|
830,881 |
674,504 |
|
Expected credit loss of 'Other receivables' |
(296) |
(293) |
|
Trade and other receivables classified as current assets |
830,585 |
674,211 |
|
Other receivables classified as non-current assets: |
|
|
|
Other receivables |
411 |
5,264 |
|
Value Added Tax receivable |
41,099 |
- |
|
Trade and other receivables classified as non-current assets |
41,510 |
5,264 |
|
Total trade and other receivables |
872,095 |
679,475 |
Trade receivables are shown net of any corresponding advances, are non-interest bearing and generally have payment terms of 46 to 60 days.
The total receivables denominated in US dollars were US$783.4 million (2024: US$584.1 million), and in Mexican pesos US$87.5 million (2024: US$95.4 million)
Balances corresponding to Value Added Tax receivables and US$3.3 million within Other receivables (2024: US$2.3 million) are not financial assets.
As of 31 December for each year presented, except for 'other receivables' in the table above, all trade and other receivables were neither past due nor credit-impaired. The amount past due and considered as credit-impaired as of 31 December 2025 is US$1.4 million (2024: US$0.3 million). Trade receivables from related parties and other receivables from related parties (see note 14) are classified as financial assets at FVTPL and are therefore not considered in the expected credit loss analysis. In determining the recoverability of receivables, the Group performs a risk analysis considering the type and age of the outstanding receivable and the credit worthiness of the counterparty, see note 31(b).
17. Cash and cash equivalents and short-term investments
The Group considers cash and cash equivalents when planning its operations and in order to achieve its treasury objectives.
|
|
As at 31 December |
|
|
|
2025 |
2024 |
|
Cash at bank and on hand |
7,070 |
2,194 |
|
Short-term deposits |
2,656,673 |
1,108,219 |
|
Cash and cash equivalents |
2,663,743 |
1,110,413 |
Cash at bank earns interest at floating rates based on daily bank deposits. Short-term deposits are made for varying periods of between one day and three months, depending on the immediate cash requirements of the Group, and earn interest at the respective short-term deposit rates. Short-term deposits can be withdrawn at short notice without any penalty or loss in value.
|
|
As at 31 December |
|
|
|
2025 |
2024 |
|
Short-term investments |
92,733 |
187,403 |
Short-term investments are made for fixed periods longer than three months and earn interest at fixed rates without an option for early withdrawal. As at 31 December 2025 short-term investments are held in fixed-term bank deposits of US$92.7million (31 December 2024: US$187.4 million).
18. Equity
Share capital and share premium
Authorised share capital of the Company is as follows:
|
|
|
|
As at 31 December |
||
|
|
2025 |
|
2024 |
||
|
Class of share |
Number |
Amount |
|
Number |
Amount |
|
Ordinary Shares each of US$0.50 |
1,000,000,000 |
$500,000,000 |
|
1,000,000,000 |
$500,000,000 |
|
Sterling Deferred Ordinary Shares each of £1.00 |
50,000 |
£50,000 |
|
50,000 |
£50,000 |
Issued share capital of the Company is as follows:
|
|
Ordinary Shares |
|
Sterling Deferred Ordinary Shares |
||
|
|
Number |
US$ |
|
Number |
£ |
|
At 1 January 2024 |
736,893,589 |
$368,545,586 |
|
50,000 |
£50,000 |
|
At 31 December 2024 |
736,893,589 |
$368,545,586 |
|
50,000 |
£50,000 |
|
At 31 December 2025 |
736,893,589 |
$368,545,586 |
|
50,000 |
£50,000 |
As at 31 December 2025 and 2024, all issued shares with a par value of US$0.50 each are fully paid. The rights and obligations attached to these shares are governed by law and the Company's Articles of Association. Ordinary shareholders are entitled to receive notice and to attend and speak at any general meeting of the Company. There are no restrictions on the transfer of the Ordinary shares.
The Sterling Deferred Ordinary Shares only entitle the shareholder on winding up or on a return of capital to payment of the amount paid up after repayment to Ordinary Shareholders. The Sterling Deferred Ordinary Shares do not entitle the holder to payment of any dividend, or to receive notice or to attend and speak at any general meeting of the Company. The Company may also at its option redeem the Sterling Deferred Ordinary Shares at a price of £1.00 or, as custodian, purchase or cancel the Sterling Deferred Ordinary Shares or require the holder to transfer the Sterling Deferred Ordinary Shares. Except at the option of the Company, the Sterling Deferred Ordinary Shares are not transferrable.
Reserves
Share premium
This reserve records the consideration premium for shares issued at a value that exceeds their nominal value.
Capital reserve
The capital reserve arose as a consequence of the Pre-IPO Reorganisation as a result of using the pooling of interest method.
Hedging reserve
This reserve records the portion of the gain or loss on a hedging instrument in a cash flow hedge that is determined to be an effective hedge, net of tax. When the hedged transaction occurs, the gain or the loss is transferred out of equity to the income statement or the value of other assets.
Fair value reserve of financial assets at FVOCI
The Group has elected to recognise changes in the fair value of certain investments in equity securities in OCI, as explained in note 2(g) . These changes are accumulated within the FVOCI reserve within equity. The Group transfers amounts from this reserve to retained earnings when the relevant equity securities are derecognised.
Foreign currency translation reserve
The foreign currency translation reserve is used to record exchange differences arising from the translation of the financial information of entities with a functional currency different to that of the presentational currency of the Group.
Retained earnings
This reserve records the accumulated results of the Group, less any distributions and dividends paid.
19. Dividends declared and paid
The dividends declared and paid during the years ended 31 December 2025 and 2024 are as follows:
|
|
US cents per |
Amount |
|
Year ended 31 December 2025 |
|
|
|
Final dividend for 2024 declared and paid during the year1 |
26.1 |
192,329 |
|
Special dividend for 2024 declared and paid during the year2 |
41.8 |
307,992 |
|
Interim dividend for 2025 declared and paid during the year3 |
20.8 |
153,274 |
|
|
88.7 |
653,595 |
|
Year ended 31 December 2024 |
|
|
|
Final dividend for 2023 declared and paid during the year4 |
4.2 |
30,950 |
|
Interim dividend for 2024 declared and paid during the year5 |
6.4 |
47,161 |
|
|
10.6 |
78,111 |
|
|
|
|
1 This dividend was approved by the Shareholders on 20 May 2025 and paid on 30 May 2025
2 This dividend was approved by the Shareholders on 20 May 2025 and paid on 30 May 2025
3 This dividend was approved by the Board of Directors on 28 July 2025 and paid on 17 September 2025
4 This dividend was approved by the Shareholders on 21 May 2024 and paid on 29 May 2024
5 This dividend was approved by the Board of Directors on 29 July 2024 and paid on 17 September 2024
A reconciliation between dividend declared, dividends affected to retained earnings and dividend presented in the cash flow statements is as follows:
|
|
|
Year ended 31 December |
|
|
|
|
2025 |
2024 |
|
Dividends declared |
|
653,595 |
78,111 |
|
Foreign exchange effect |
|
30 |
- |
|
Dividends recognised in retained earnings |
|
653,625 |
78,111 |
|
Foreign exchange and hedging effect |
|
688 |
45 |
|
Dividends paid |
|
654,313 |
78,156 |
The directors have proposed a final dividend of US$108.12 cents per share, which is subject to approval at the annual general meeting and is not recognised as a liability as at 31 December 2025. Dividends paid from the profits generated from 1 January 2014 to residents in Mexico and to non-resident shareholders may be subject to an additional tax of up to 10%, which will be withheld by the Group.
20. Interest-bearing loans
Senior Notes
On 2 October 2020, the Group completed its offering of US$850 million aggregate principal amount of 4.250% Senior Notes due 2050 in the Euronext Dublin. Movements in the year in the debt recognised in the balance sheet are as follows:
|
|
As at 31 December |
|
|
|
2025 US$ thousands |
2024 US$ thousands |
|
Opening balance |
839,507 |
839,002 |
|
Accrued interest |
37,986 |
38,093 |
|
Interest paid1 |
(37,986) |
(37,986) |
|
Amortisation of discount and transaction costs |
419 |
398 |
|
Closing balance |
839,926 |
839,507 |
1 Interest is payable semi-annually on 2 April and 2 October for 4.250% senior notes.
The Group has the following restrictions derived from the issuance of all outstanding Senior Notes:
Change of control:
Should the rating of the senior notes be downgraded as a result of a change of control (defined as the sale or transfer of 35% or more of the common shares; the transfer of all or substantially all the assets of the Group; starting a dissolution or liquidation process; or the loss of the majority in the board of directors) the Group is obligated to repurchase the notes at an equivalent price of 101% of their nominal value plus the interest earned at the repurchase date, if requested to do so by any creditor.
Pledge on assets:
The Group shall not pledge or allow a pledge on any property that may have a material impact on business performance (key assets). Nevertheless, the Group may pledge the aforementioned properties provided that the repayment of the Notes keeps the same level of priority as the pledge on those assets.
21. Provision for mine closure cost
The provision represents the discounted values of the risk-adjusted estimated cost to decommission and rehabilitate the mines at the estimated date of depletion of mine deposits. Uncertainties in estimating these costs include potential changes in regulatory requirements, decommissioning, dismantling and reclamation alternatives, timing; the effects of climate change, and the discount, foreign exchange and inflation rates applied. Closure provisions are typically based on conceptual level studies that are refreshed at least every three years. As these studies are renewed, they incorporate greater consideration of forecast climate conditions at closure.
The Group has performed separate calculations of the provision by currency, discounting at corresponding rates. As at 31 December 2025, the discount rates used in the calculation of the parts of the provision that relate to Mexican pesos range from 7.53% to 9.84% (2024: range from 9.84% to 10.50%). The range for the current year parts that relate to US dollars range from 3.33% to 4.03% (2024: range from 3.69% to 4.00%).
Mexican regulations regarding the decommissioning and rehabilitation of mines are limited and less developed in comparison to regulations in many other jurisdictions. It is the Group's intention to rehabilitate the mines beyond the requirements of Mexican law, and estimated costs reflect this level of expense. The Group intends to fully rehabilitate the affected areas at the end of the lives of the mines.
The provision is expected to become payable at the end of the production life of each mine, based on the estimation of reserves and resources, which ranges from 2 to 25 years from 31 December 2025 (1 to 22 years from 31 December 2024). As at 31 December 2025 the weighted average term of the provision is 13 years (2024: 12 years).
|
|
As at 31 December |
|
|
|
2025 |
2024 |
|
Opening balance |
245,529 |
292,316 |
|
Decrease to existing provision |
(30,397) |
(4,072) |
|
Effect of changes in discount rate |
11,858 |
(28,736) |
|
Unwinding of discount rate |
22,360 |
24,997 |
|
Payments |
(2,512) |
(3,093) |
|
Foreign exchange |
25,644 |
(35,883) |
|
Closing balance |
272,482 |
245,529 |
|
Less - Current portion |
9,961 |
11,781 |
|
Non-current portion |
262,521 |
233,748 |
The provision is sensitive to a reasonably possible change in discount rates, exchange rate US Dollar compared to Mexican peso, change in future costs, and change in the expected life of mine (years). The sensitivity of these key inputs is as follows:
|
|
Discount rate |
Foreign currency |
Estimated costs |
Change in LOM |
||||
|
Year ended 31 December |
Basis point increase/ |
Effect on provision: increase/ |
Strengthening/ |
Effect on provision: increase/ |
Increase/ |
Effect on provision: increase/ |
Increase/ |
Effect on provision: increase/ |
|
2025 |
50 |
3,112 |
10% |
(24,624) |
10% |
32,072 |
2 |
(10,179) |
|
|
(50) |
(3,480) |
(5%) |
14,256 |
(10%) |
(32,072) |
(2) |
11,764 |
|
2024 |
50 |
8,783 |
10% |
(19,030) |
5% |
12,991 |
2 |
(9,751) |
|
|
(50) |
(11,708) |
(5%) |
11,017 |
(5%) |
(12,991) |
(2) |
11,764 |
Change in the provision would be principally offset by a change to the value of the associated asset unless the asset is fully depreciated, in which case the change in estimate is recognised directly within the income statement.
22. Pensions and other post-employment benefit plans
The Group has a defined contribution plan and a defined benefit plan.
The defined contribution plan was established as from 1 July 2007 and consists of periodic contributions made by each Mexican non-unionised worker and contributions made by the Group to the fund matching workers' contributions, capped at 8% of the employee's annual salary.
The defined benefit plan provides pension benefits based on each worker's earnings and years of services provided by personnel hired up to 30 June 2007 as well as statutory seniority premiums for both unionised and non-unionised workers.
The overall investment policy and strategy for the Group's defined benefit plan is guided by the objective of achieving an investment return which, together with contributions, ensures that there will be sufficient assets to pay pension benefits and statutory seniority premiums for non-unionised workers as they fall due while also mitigating the various risks of the plan. However, the portion of the plan related to statutory seniority premiums for unionised workers is not funded. The investment strategies for the plan are generally managed under local laws and regulations. The actual asset allocation is determined by current and expected economic and market conditions and in consideration of specific asset class risk in the risk profile. Within this framework, the Group ensures that the trustees consider how the asset investment strategy correlates with the maturity profile of the plan liabilities and the respective potential impact on the funded status of the plan, including potential short-term liquidity requirements.
Death and disability benefits are covered through insurance policies.
The following tables provide information relating to changes in the defined benefit obligation and the fair value of plan assets:
|
|
|
Pension cost charge to income statement |
|
Remeasurement gains/(losses) in OCI |
|
|||||||||
|
|
Balance at 1 January 2025 |
Service cost |
Net interest |
Foreign exchange |
Sub-total recognised in the year |
Benefits paid |
Return on plan assets (excluding amounts included in net interest |
Actuarial changes arising from changes in financial assumptions |
Sub-total included in OCI1 |
Contributions by employer |
Defined benefit decrease due to personnel transfer |
Balance at 31 December 2025 |
||
|
|
|
|
US$ thousands |
|||||||||||
|
Defined benefit obligation |
(29,110) |
(1,618) |
(2,688) |
(3,884) |
(8,190) |
1,859 |
(761) |
(1,462) |
(2,223) |
|
(56) |
(37,720) |
||
|
Fair value of plan assets |
17,656 |
|
1,519 |
2,390 |
3,909 |
(1,859) |
(216) |
|
(216) |
481 |
17 |
19,988 |
||
|
|
|
|
|
|
|
|
|
|
|
|
|
|
||
|
Net benefit liability |
(11,454) |
(1,618) |
(1,169) |
(1,494) |
(4,281) |
- |
(977) |
(1,462) |
(2,439) |
481 |
(39) |
(17,732) |
||
|
|
|
Pension cost charge to income statement |
|
Remeasurement gains/(losses) in OCI |
|
|
|||||||||
|
|
Balance at 1 January 2024 |
Service cost |
Net interest |
Foreign exchange |
Sub-total recognised in the year |
Benefits paid |
Return on plan assets (excluding amounts included in net interest |
Actuarial changes arising from changes in financial assumptions |
Sub-total included in OCI1 |
Contributions by employer |
Defined benefit decrease due to personnel transfer |
Balance at 31 December 2024 |
|
||
|
US$ thousands |
|||||||||||||||
|
Defined benefit obligation |
(32,671) |
222 |
(2,664) |
5,713 |
3,271 |
1,458 |
|
(672) |
(672) |
|
(496) |
(29,110) |
|
||
|
Fair value of plan assets |
19,460 |
|
1,486 |
(2,914) |
(1,428) |
(1,458) |
474 |
|
474 |
256 |
352 |
17,656 |
|
||
|
Net benefit liability |
(13,211) |
222 |
(1,178) |
2,799 |
1,843 |
0 |
474 |
(672) |
(198) |
256 |
(144) |
(11,454) |
|
||
Of the total defined benefit obligation, US$17.5 million (2024: US$12.1 million) relates to statutory seniority premiums for unionised workers which are not funded. The expected contributions to the plan for the next annual reporting period are nil. The principal assumptions used in determining pension and other post-employment benefit obligations for the Group's plans are shown below:
|
|
As at 31 December |
|
|
|
2025 |
2024 |
|
Discount rate |
9.09 |
10.14 |
|
Future salary increases (National Consumer Price Index) |
5.25 |
5.25 |
The life expectancy of current and future pensioners, men and women aged 65 and older will live on average for a further 25 and 29 years respectively (2024: 22.5 years for men and 23.7 for women). The weighted average duration of the defined benefit obligation is 8.0 years (2024: 7.8 years).
The fair values of the plan assets were as follows:
|
|
As at 31 December |
|
|
|
2025 |
2024 |
|
State owned companies |
618 |
279 |
|
Mutual funds (fixed rates) |
19,370 |
17,377 |
|
|
19,988 |
17,656 |
As at 31 December 2025 and 2024, all the funds were invested in quoted debt instruments.
The pension plan has not invested in any of the Group's own financial instruments nor in properties or assets used by the Group.
A quantitative sensitivity analysis for significant assumptions as at 31 December 2025 is as shown below:
|
Assumptions |
|
Discount rate |
Future salary increases (NCPI) |
Life expectancy of pensioners |
||
|
Sensitivity Level |
|
0.5% Increase |
0.5% Decrease |
0.5% increase |
0.5% decrease |
+ 1 Increase |
|
Year ended 31 December 2025 (Decrease)/increase to the net defined benefit obligation (US$ thousands) |
|
(1,378) |
1,477 |
476 |
(456) |
(149) |
|
Year ended 31 December 2024 (Decrease)/increase to the net defined benefit obligation (US$ thousands) |
|
(1,026) |
1,101 |
270 |
(260) |
167 |
The sensitivity analysis above has been determined based on a method that extrapolates the impact on net defined benefit obligation as a result of reasonable changes in key assumptions occurring at the end of the reporting period. The pension plan is not sensitive to future changes in salaries other than in respect of inflation.
23. Trade and other payables
|
|
As at 31 December |
|
|
|
2025 |
2024 |
|
Trade payables |
200,696 |
110,891 |
|
Other payables to related parties (note 27(a)) |
40,720 |
39,203 |
|
Accrued expenses |
68,210 |
38,188 |
|
Other taxes and contributions |
65,549 |
35,497 |
|
|
375,175 |
223,779 |
Trade payables are mainly for the acquisition of materials, supplies and contractor services. These payables do not accrue interest and no guarantees have been granted. The fair value of trade and other payables approximate their book values.
Balances corresponding to Accrued expenses and Other taxes and contributions are not financial liabilities.
The Group's exposure to currency and liquidity risk related to trade and other payables is disclosed in note 31.
24. Commitments
A summary of capital expenditure commitments by operating mines and development project is as follows:
|
|
As at 31 December |
|
|
|
2025 |
2024 |
|
Saucito |
36,974 |
28,030 |
|
Fresnillo |
41,934 |
20,324 |
|
San Julian |
5,303 |
4,785 |
|
Juanicipio |
23,963 |
21,776 |
|
Herradura |
19,285 |
16,167 |
|
Cienega |
3,047 |
2,603 |
|
Other1 |
841 |
657 |
|
|
131,347 |
94,342 |
1 Mainly corresponds to Minera el Bermejal, S. de R.L. de C.V.
25. Leases
(a) The Group as lessee
The Group leases various offices, buildings, plant and equipment and IT equipment. The resulting lease liability is as follows:
|
|
As at |
|
|
|
31 December 2025 |
31 December 2024 |
|
IT equipment |
5,228 |
5,925 |
|
Plant and equipment |
3,198 |
3,123 |
|
Buildings |
2,621 |
2,845 |
|
Total lease liability |
11,047 |
11,893 |
|
Less - Current portion |
4,864 |
4,312 |
|
Non-current portion |
6,183 |
7,581 |
The total cash outflow for leases for the year ended 31 December 2025, except short term and low value leases, amounts to US$3.0 million (2024: US$7.0 million), including finance costs of US$1.0 million (2024: US$1.6 million). The table below details right-of-use assets included as property plant and equipment in note 13.
|
|
|
Year ended 31 December 2025 |
||
|
|
Buildings |
Computer equipment |
Plant and Equipment |
Total |
|
|
|
|
|
US$ thousands |
|
Cost |
|
|
|
|
|
At 1 January 2025 |
5,907 |
15,788 |
4,139 |
25,834 |
|
Additions |
- |
4,056 |
144 |
4,200 |
|
Disposals |
- |
(921) |
- |
(921) |
|
At 31 December 2025 |
5,907 |
18,923 |
4,283 |
29,113 |
|
Accumulated depreciation |
|
|
|
|
|
At 1 January 2025 |
(3,729) |
(10,301) |
(1,390) |
(15,420) |
|
Depreciation for the year |
(640) |
(3,519) |
(502) |
(4,661) |
|
Disposals |
- |
179 |
- |
179 |
|
At 31 December 2025 |
(4,369) |
(13,641) |
(1,892) |
(19,902) |
|
Net book amount at 31 December 2025 |
1,538 |
5,282 |
2,391 |
9,211 |
|
|
|
Year ended 31 December 2024 |
||
|
|
Buildings |
Computer equipment |
Plant and Equipment |
Total |
|
|
|
|
|
US$ thousands |
|
Cost |
|
|
|
|
|
At 1 January 2024 |
5,035 |
19,279 |
4,056 |
28,370 |
|
Additions |
942 |
1,329 |
83 |
2,354 |
|
Disposals |
(70) |
(4,820) |
- |
(4,890) |
|
At 31 December 2024 |
5,907 |
15,788 |
4,139 |
25,834 |
|
Accumulated depreciation |
|
|
|
|
|
At 1 January 2024 |
(3,034) |
(11,155) |
(801) |
(14,990) |
|
Depreciation for the year |
(763) |
(3,926) |
(589) |
(5,278) |
|
Disposals |
68 |
4,780 |
- |
4,848 |
|
At 31 December 2024 |
(3,729) |
(10,301) |
(1,390) |
(15,420) |
|
Net book amount at 31 December 2024 |
2,178 |
5,487 |
2,749 |
10,414 |
Amounts recognised in profit and loss for the year, additional to depreciation of right-of-use assets, included US$1.1 million (2024: US$1.6 million) relating to interest expense, US$15.7 million (2024: US$62.1 million) on relating variable lease payments (note 6) of which US$2.1 million (2024: US$2.9 million) were capitalised as a part of stripping cost, US$0.1 million (2024: US$0.3 million) relating to short-term leases and US$3.1 million (2024:US$2.7 million) relating to low-value assets.
(b) The Group as a lessor
Operating leases, in which the Group is the lessor, relate to mobile equipment owned by the Group with lease terms of between 12 to 36 months. All operating lease contracts contain market review clauses in the event that the lessee exercises its option to renew. The lessee does not have an option to purchase the equipment at the expiry of the lease period. The Group's leases as a lessor are not material.
26. Contingencies
As of 31 December 2025, the Group has the following contingencies:
- The Group is subject to various laws and regulations which, if not observed, could give rise to penalties.
- Tax periods remain open to review by the Mexican tax authorities (SAT, by its Spanish acronym) in respect of income taxes for five years following the date of the filing of corporate income tax returns, during which time the authorities have the right to raise additional tax assessments including penalties and interest. Under certain circumstances, the reviews may cover longer periods. As such, there is a risk that transactions, and in particular related party transactions, that have not been challenged in the past by the authorities, may be challenged by them in the future.
It is not practical to determine the amount of any potential claims or the likelihood of any unfavourable outcome arising from this or any future inspections that may be initiated. However, management believes that its interpretation of the relevant legislation is appropriate and that the Group has complied with all regulations and paid or accrued all taxes and withholding taxes that are applicable.
- On 8 May 2008, the Company and Peñoles entered into the Separation Agreement (the 'Separation Agreement'). This agreement relates to the separation of the Group and the Peñoles Group and governs certain aspects of the relationship between the Fresnillo Group and the Peñoles Group following the initial public offering in May 2008 ('Admission'). The Separation Agreement provides for cross-indemnities between the Company and Peñoles so that, in the case of Peñoles, it is held harmless against losses, claims and liabilities (including tax liabilities) properly attributable to the precious metals business of the Group and, in the case of the Company, it is held harmless by Peñoles against losses, claims and liabilities which are not properly attributable to the precious metals business. Save for any liability arising in connection with tax, the aggregate liability of either party under the indemnities shall not exceed US$250 million in aggregate.
- In 2011, following a flooding in the Saucito mine, Group filed an insurance claim in respect of the damage caused (and in respect of business interruption). This insurance claim was rejected by the insurance provider. In early 2018, after the matter had been taken to mutually agreed arbitration, the insurance claim was declared valid; however, there is disagreement about the appropriate amount to be paid. In October 2018 the Group received US$13.6 million in respect of the insurance claim, however this does not constitute a final settlement and management continues to pursue a higher insurance payment. Due to the fact that negotiations are on-going and there is uncertainty regarding the timing and amount involved in reaching a final settlement with the insurer, it is currently not practicable to determine the total amount expected to be recovered.
- On 4 July 2024, the SAT issued the tax assessment ruling regarding the 2016 tax audit of Comercializadora de Metales Fresnillo where it confirmed its findings on the tax treatment of the Silverstream premium payment amounting to US$16.8 million, which includes the effect of time value of the money, penalties and surcharges. The Company filed an administrative appeal on 30 August 2024 to challenge the SAT assessment.
- On 11 April, 2025, Comercializadora de Metales Fresnillo reached an agreement with the SAT, so the SAT confirmed that the tax treatment applied by the company is correct for considering the transaction as a financial derivative transaction for tax purposes, and the premium paid by the company and allocated in 2016, 2017 and 2018, is deductible for income tax purposes. The company will not make any tax amendment for the years 2016 to 2018, and the SAT also confirmed its tax treatment for the year 2019. Currently, the agreement reached with the SAT is still being implemented as follows: The administrative appeal filed by the Company to challenge the SAT assessment for 2016 is in the process of being revoked; the 2017, 2018 and 2019 tax audits have been concluded by the SAT.
Regarding the Minera Fresnillo, Minera Penmont, and Minera Saucito tax audits for the year 2019, findings were shared by the SAT on 9 December 2025,11 December 2025, and 15 December 2025, respectively. The SAT´s findings relate mainly to consider non-deductible expenses for income tax purposes, the union payments, the travel expenses and in the case of Minera Fresnillo, also the administrative services payments. In addition, in the case of Minera Penmont and Minera Saucito, the SAT is challenging the VAT vs Income Tax Compensation (Compensación Universal). Also, the SAT is challenging the transfer pricing analysis of certain transactions made by the companies with its related parties. The companies responded to the SAT on January 2026 and began a Conclusive Agreement procedure before the Mexican tax ombudsman (PRODECON).
It is not practical to determine the amount of any potential claims or the likelihood of any unfavourable outcome arising from this or any future inspections that may be initiated.
The Directors and their external tax advisors consider management´s interpretation of the relevant legislation and assessment of taxation to be appropriate, that the Group has complied with all regulations and paid or accrued all taxes and withholdings that are applicable and that it is probable that the Group's tax position will be sustained.
- It is probable that interest income will be earned on the Group's outstanding income and value added tax receivable balances; however, there is no certainty that this interest will be realised until the underlying balance is recovered. Due to that uncertainty, it is also not practicable to estimate the amount of interest income earned but not recovered to date.
27. Related party balances and transactions
The Group had the following related party transactions during the years ended 31 December 2025 and 2024 and balances as at 31 December 2025 and 2024.
Related parties are those entities owned or controlled by the ultimate controlling party, as well as those who have a minority participation in Group companies and key management personnel of the Group.
(a) Related party balances
|
|
Accounts receivable |
|
Accounts payable |
|
||
|
|
As at 31 December |
|
As at 31 December |
|
||
|
|
2025 |
2024 |
|
2025 |
2024 |
|
|
Trade: |
|
|
|
|
|
|
|
Metalúrgica Met-Mex Peñoles, S.A. de C.V. |
760,177 |
548,760 |
|
- |
6,622 |
|
|
Other: |
|
|
|
|
|
|
|
Industrias Peñoles, S.A.B. de C.V.1 |
- |
16,516 |
|
- |
- |
|
|
Metalúrgica Met-Mex Peñoles, S.A. de C.V. |
- |
322 |
|
1,886 |
1,791 |
|
|
Servicios Administrativos Peñoles, S.A. de C.V. |
- |
- |
|
10,688 |
6,420 |
|
|
Servicios Especializados Peñoles, S.A. de C.V. |
- |
- |
|
8,995 |
10,374 |
|
|
Fuentes de Energía Peñoles, S.A. de C.V. |
- |
- |
|
10,624 |
6,373 |
|
|
Termoeléctrica Peñoles, S. de R.L. de C.V. |
- |
- |
|
- |
439 |
|
|
Peñoles Tecnología, S.A. de C.V. |
- |
- |
|
1,282 |
1,640 |
|
|
Eólica de Coahuila S.A. de C.V. |
- |
- |
|
4,076 |
2,693 |
|
|
Minera Capela, S.A. de C.V. |
- |
- |
|
- |
2 |
|
|
Grupo Nacional Provincial, S.A. B. de C.V.2 |
995 |
357 |
|
- |
- |
|
|
Other |
360 |
144 |
|
3,169 |
2,849 |
|
|
Sub-total |
761,532 |
566,099 |
|
40,720 |
39,203 |
|
|
Less-current portion |
761,532 |
566,099 |
|
40,720 |
39,203 |
|
|
Non-current portion |
- |
- |
|
- |
- |
|
1 This balance corresponds to the cash receivable related to the Silverstream contract, see note 14.
2 This balance corresponds to excess payments to the defined contribution plan which will be refunded.
Related party accounts receivable and payable will be settled in cash.
Other balances with related parties:
|
|
Year ended 31 December |
|
|
|
2025 |
2024 |
|
Silverstream contract: |
|
|
|
Industrias Peñoles, S.A.B. de C.V. |
- |
258,641 |
As of 31 December 2025, the Silverstream contract has been settled in cash. As of 31 December 2024, the Silverstream contract can be settled in either silver or cash. Details of the Silverstream contract are provided in note 14.
(b) Principal transactions with affiliates, including Industrias Peñoles S.A.B de C.V., the Company's parent, are as follows:
|
|
Year ended 31 December |
|
|
|
2025 |
2024 |
|
Income: |
|
|
|
Sales: |
|
|
|
Metalúrgica Met-Mex Peñoles, S.A. de C.V. 1 |
4,552,684 |
3,481,650 |
|
Insurance recovery |
|
|
|
Grupo Nacional Provincial, S.A. B. de C.V. |
246 |
8,317 |
|
Other income |
7,574 |
4,678 |
|
Total income |
4,560,504 |
3,494,645 |
1 Invoiced revenue are derived from the value of metal content which is determined by commodity market prices and adjusted for the treatment and refining charges to be incurred by the metallurgical complex (refer to note 5(c)).
|
|
Year ended 31 December |
|
|
|
2025 |
2024 |
|
Expenses: |
|
|
|
Administrative services: |
|
|
|
Servicios Administrativos Peñoles, S.A. de C.V. 2 |
51,171 |
52,352 |
|
Servicios Especializados Peñoles, S.A. de C.V. 3 |
14,938 |
18,738 |
|
Peñoles Tecnología, S.A. de C.V. |
6,387 |
4,970 |
|
|
72,496 |
76,060 |
|
Energy: |
|
|
|
Termoeléctrica Peñoles, S. de R.L. de C.V. |
- |
7,295 |
|
Fuentes de Energía Peñoles, S.A. de C.V. |
38,410 |
35,711 |
|
Eólica de Coahuila S.A. de C.V. |
39,561 |
46,057 |
|
|
77,971 |
89,063 |
|
Operating materials and spare parts: |
|
|
|
Wideco Inc |
5,652 |
5,315 |
|
Metalúrgica Met-Mex Peñoles, S.A. de C.V. |
15,038 |
55,525 |
|
|
20,690 |
60,840 |
|
Equipment repair and administrative services: |
|
|
|
Serviminas, S.A. de C.V. |
750 |
2,760 |
|
Insurance premiums: |
|
|
|
Grupo Nacional Provincial, S.A. B. de C.V. |
25,598 |
21,068 |
|
Other expenses: |
3,513 |
2,755 |
|
Total expenses |
201,018 |
252,546 |
2 Includes US$0.9million (2024: US$0.9 million) corresponding to expenses reimbursed.
3 Includes US$8.6 million (2024: US$8.5 million) relating to engineering costs that were capitalised.
(c) Compensation of key management personnel of the Group
Key management personnel include the members of the Board of Directors and the Executive Committee.
|
|
Year ended 31 December |
|
|
|
2025 |
2024 |
|
Salaries and bonuses |
7,612 |
6,044 |
|
Post-employment benefits |
432 |
395 |
|
Other benefits |
388 |
342 |
|
Total compensation paid in respect of key management personnel |
8,432 |
6,781 |
|
|
As at 31 December |
|
|
|
2025 |
2024 |
|
Accumulated accrued defined benefit pension entitlement |
5,393 |
4,325 |
This compensation includes amounts paid to directors disclosed in the Directors' Remuneration Report.
The accumulated accrued defined pension entitlement represents benefits accrued at the time the benefits were frozen. There are no further benefits accruing under the defined benefit scheme in respect of current services.
28. Auditor's remuneration
Fees due by the Group to its auditor during the year ended 31 December 2025 and 2024 are as follows:
|
|
|
|
|
Class of services |
2025 |
2024 |
|
Fees payable to the Group's auditor for the audit of the Group's annual accounts |
2,077 |
2,048 |
|
Fees payable to the Group's auditor and its associates for other services as follows: |
|
|
|
The audit of the Company's subsidiaries pursuant to legislation |
892 |
975 |
|
Audit-related assurance services1 |
860 |
748 |
|
Total |
3,829 |
3,771 |
1 Includes US$0.7 million (2024: US$0.6 million) for the limited review of the Half Yearly financial report, US$0.1 (2024: US$0.2 million) for the Mexican tax audit opinions and US$0.1 million (2024: US$0.1 million) for the limited assurance services over certain GHG's KPIs.
29. Notes to the consolidated statement of cash flows
|
|
Notes |
2025 |
2024 |
|
Reconciliation of profit for the year to net cash generated from operating activities |
|
|
|
|
Profit for the year |
|
1,573,829 |
226,691 |
|
Adjustments to reconcile profit for the period to net cash inflows from operating activities: |
|
|
|
|
Depreciation and amortisation |
13 |
491,636 |
620,867 |
|
Employee profit sharing |
8 |
15,859 |
13,609 |
|
Deferred income tax (credit)/expense |
11 |
(224,789) |
264,111 |
|
Current income tax expense |
11 |
732,942 |
253,100 |
|
Write-off of assets |
9 |
15,988 |
1,704 |
|
Gain on the sale of property, plant and equipment and other assets |
|
(286) |
(1,004) |
|
Net finance costs |
|
(24,238) |
25,131 |
|
Unrealised foreign exchange loss/(gain) |
|
30,261 |
(2,200) |
|
Difference between pension contributions paid and amounts recognised in the income statement |
|
1,657 |
(63) |
|
Dividends received from equity instruments at FVOCI |
|
(1,754) |
- |
|
Non-cash movement on derivatives |
|
(297) |
(301) |
|
Changes in fair value of Silverstream |
14 |
189,212 |
182,276 |
|
Change in mine closure cost provision |
9 |
344 |
8 |
|
Gain on sale of mining concessions |
9 |
(13,050) |
(24,149) |
|
Other |
|
- |
- |
|
Working capital adjustments |
|
|
|
|
Increase in trade and other receivables |
|
(208,292) |
(196,196) |
|
(Increase)/decrease in prepayments and other assets |
|
(20,076) |
10,741 |
|
(Increase)/decrease in inventories |
|
(20,421) |
50,556 |
|
Increase/(decrease) in trade and other payables |
|
120,664 |
(28,016) |
|
Cash generated from operations |
|
2,659,189 |
1,396,865 |
|
Income tax paid1 |
|
(357,561) |
(94,957) |
|
Employee profit sharing paid |
|
(11,921) |
(2,106) |
|
Net cash from operating activities |
|
2,289,707 |
1,299,802 |
1 Income tax paid includes US$294.3 million corresponding to corporate income tax (2024: US$72.1 million) and US$63.2 million corresponding to special mining right (2024: US$22.9 million), for further information refer to note 11.
30. Financial instruments
(a) Fair value category
|
As at 31 December 2025 |
||||||
|
US$ thousands |
||||||
|
Financial assets: |
|
Amortized cost |
Fair value through OCI |
Fair value (hedging instruments) |
Fair value through profit or loss |
|
|
Trade and other receivables1 |
|
21,341 |
- |
- |
760,177 |
|
|
Equity instruments at FVOCI |
|
- |
34,537 |
- |
- |
|
|
Silverstream contract (note 14) |
|
- |
- |
- |
- |
|
|
Derivative financial instruments |
|
- |
- |
103 |
- |
|
|
Financial liabilities: |
|
|
Amortized cost |
Fair value (hedging instruments) |
Fair value through profit or loss |
|
|
Interest-bearing loans (note 20) |
|
- |
839,926 |
- |
- |
|
|
Trade and other payables (note 23) |
|
- |
241,416 |
- |
- |
|
|
Derivative financial instruments |
|
- |
- |
741 |
- |
|
|
As at 31 December 2024 |
||||||
|
US$ thousands |
||||||
|
Financial assets: |
|
Amortized cost |
Fair value through OCI |
Fair value (hedging instruments) |
Fair value through profit or loss |
|
|
Trade and other receivables1 |
|
8,542 |
- |
- |
565,276 |
|
|
Equity instruments at FVOCI |
|
- |
139,968 |
- |
- |
|
|
Silverstream contract (note 14) |
|
- |
- |
- |
258,641 |
|
|
Financial liabilities: |
|
|
Amortized cost |
Fair value (hedging instruments) |
Fair value through profit or loss |
|
|
Interest-bearing loans (note 20) |
|
|
839,507 |
- |
- |
|
|
Notes payable2 |
|
|
2,055 |
- |
- |
|
|
Trade and other payables (note 23) |
|
|
150,094 |
- |
- |
|
|
Derivative financial instruments |
|
|
- |
189 |
- |
|
1 Trade and other receivables and embedded derivative within sales contracts are presented net in Trade and other receivables in the balance sheet.
2 Corresponds to interest-bearing notes payable received from Minera los Lagartos, S.A. de C.V. which holds a non-controlling interest in Juanicipio project. The notes are denominated in US Dollars and bear interest at a of 6.76%. Interest paid amounted to US$5.0 million.
(b) Fair value measurement
The value of financial assets and liabilities other than those measured at fair value are as follows:
|
|
|
|
As at 31 December |
|
||
|
|
Carrying amount |
|
Fair value |
|
||
|
|
2025 |
2024 |
|
2025 |
2024 |
|
|
Financial assets: |
|
|
|
|
|
|
|
Trade and other receivables |
21,341 |
8,542 |
|
21,341 |
8,542 |
|
|
Financial liabilities: |
|
|
|
|
|
|
|
Interest-bearing loans1 (note 20) |
839,926 |
839,507 |
|
678,215 |
605,396 |
|
|
Trade and other payables |
241,416 |
150,094 |
|
241,416 |
150,094 |
|
|
Notes payable |
- |
2,055 |
|
- |
2,055 |
|
1 Interest-bearing loans are categorised in Level 1 of the fair value hierarchy.
The financial assets and liabilities measured at fair value are categorised into the fair value hierarchy as at 31 December as follows:
|
As of 31 December 2025 |
||||||||
|
Fair value measure using |
||||||||
|
|
|
Quoted prices in active markets Level 1 |
|
Significant observable Level 2 |
|
Significant unobservable Level 3 |
|
Total |
|
Financial assets: |
|
|
|
|
|
|
|
|
|
Trade receivables |
|
- |
|
- |
|
760,177 |
|
760,177 |
|
Derivative financial instruments: |
|
|
|
|
|
|
|
|
|
Option and forward foreign exchange contracts |
|
|
- |
103 |
|
- |
|
103 |
|
Other financial assets: |
|
|
|
|
|
|
|
|
|
Equity instruments at FVOCI |
|
34,537 |
|
- |
|
- |
|
34,537 |
|
|
|
|
|
- |
|
|
|
|
1 This balance corresponds to the cash receivable related to the Silverstream contract, see note 14.
|
As of 31 December 2024 |
||||||||
|
Fair value measure using |
||||||||
|
|
|
Quoted prices in active markets Level 1 |
|
Significant observable Level 2 |
|
Significant unobservable Level 3 |
|
Total |
|
Financial assets: |
|
|
|
|
|
|
|
|
|
Trade receivables |
|
- |
|
- |
|
548,760 |
|
548,760 |
|
Other receivables from related parties1 |
|
- |
|
- |
|
16,516 |
|
16,516 |
|
Derivative financial instruments: |
|
|
|
|
|
|
|
|
|
Silverstream contract |
|
|
- |
- |
|
258,641 |
|
258,641 |
|
Other financial assets: |
|
|
|
|
|
|
|
|
|
Equity instruments at FVOCI |
|
139,968 |
|
- |
|
- |
|
139,968 |
|
|
|
139,968 |
|
- |
|
823,917 |
|
963,885 |
1 This balance corresponds to the cash receivable related to the Silverstream contract, see note 14.
There have been no transfers between Level 1 and Level 2 of the fair value hierarchy, and no transfers into and out of Level 3 fair value measurements.
A reconciliation of the opening balance to the closing balance for Level 3 financial instruments other than Silverstream (which is disclosed in note 14) is shown below:
|
|
2025 |
2024 |
|
Balance at 1 January: |
548,760 |
306,668 |
|
Sales |
4,512,967 |
3,503,662 |
|
Cash collection |
(4,349,814) |
(3,254,312) |
|
Changes in fair value |
83,129 |
32,638 |
|
Realised embedded derivatives during the year |
(34,865) |
(39,896) |
|
Balance at 31 December |
760,177 |
548,760 |
The fair value of financial assets and liabilities is included at reflects the amount at which the instrument could be exchanged in a current transaction between willing parties, other than in a forced or liquidation sale.
The following valuation techniques were used to estimate the fair values:
Option and forward foreign exchange contracts
The Group enters into derivative financial instruments with various counterparties, principally financial institutions with investment grade credit ratings. The foreign currency forward (Level 2) contracts are measured based on observable spot exchange rates, the yield curves of the respective currencies as well as the currency basis spreads between the respective currencies. The foreign currency option contracts are valued using the Black Scholes model, the significant inputs to which include observable spot exchange rates, interest rates and the volatility of the currency.
Silverstream contract
Further information relating to the valuation techniques used to estimate the fair value of the Silverstream contract as well as the sensitivity of the valuation to the key inputs are disclosed in note 14.
Equity investments:
The fair value of equity investments is derived from quoted market prices in active markets (Level 1). These investments were irrevocably designated at fair value through OCI as the Group considers these investments to be strategic in nature. As of 31 December 2025, approximately 58.6% of the investments correspond to 2,800,0000 shares (2024: 2,800,000 shares) of Endeavor Silver Corp. for an amount of US$26.3 million (2024: US$10.3 million). These equity investments are listed on the Toronto stock Exchange. The price per share as 31 December 2025 were US$12.91 (2024: US$3.66).
During May and June 2025, the Group disposed its equity investment of 9,314,877 shares in MAG Silver, Corp. The shares sold had a fair value of US$176.6 million and the Group realised a gain of US$128.6 million which had already been included in OCI. This gain has been transferred to retained earnings, net of tax amounting to US$38.6 million.
Interest-bearing loans
The fair value of the Group's interest-bearing loan is derived from quoted market prices in active markets (Level 1).
Trade receivables:
Sales of concentrates, precipitates doré bars and activated carbon are 'provisionally priced' and revenue is initially recognised using this provisional price and the Group's best estimate of the contained metal. Revenue is subject to final price and metal content adjustments subsequent to the date of delivery (see note 2 (o)). This price exposure is considered to be an embedded derivative and therefore the entire related trade receivable is measured at fair value.
At each reporting date, the provisionally priced metal content is revalued based on the forward selling price for the quotational period stipulated in the relevant sales contract. The selling price of metals can be reliably measured as these metals are actively traded on international exchanges but the estimated metal content is a non-observable input to this valuation.
31. Financial risk management
Overview
The Group's principal financial assets and liabilities, other than derivatives, comprise trade and other receivables, cash, equity instruments at FVOCI, interest-bearing loans, notes payable and trade payables.
The Group has exposure to the following risks from its use of financial instruments:
- Market risk, including foreign currency, commodity price, interest rate and equity price risks
- Credit risk
- Liquidity risk
This note presents information about the Group's exposure to each of the above risks and the Group's objectives, policies and processes for assessing and managing risk. Further quantitative disclosures are included throughout the financial statements.
The Board of Directors has overall responsibility for the establishment and oversight of the Group's risk management framework.
The Group's risk management policies are established to identify and analyse the risks faced by the Group, to set appropriate risk limits and controls, and to monitor risks and adherence to limits. Risk management policies and systems are reviewed regularly to reflect changes in market conditions and the Group's activities. The Group, through its training and management standards and procedures, aims to develop a disciplined and constructive control environment in which all employees understand their roles and obligations.
The Fresnillo Audit Committee has responsibility for overseeing how management monitors compliance with the Group's risk management policies and procedures and reviews the adequacy of the risk management framework in relation to the risks faced by the Group. The Audit Committee is assisted in its oversight role by Internal Audit, which undertakes both regular and ad hoc reviews of risk management controls and procedures, the results of which are reported to the Audit Committee.
(a) Market risk
Market risk is the risk that changes in market factors, such as foreign exchange rates, commodity prices or interest rates will affect the Group's income or the value of its financial instruments.
The objective of market risk management is to manage and control market risk exposures within acceptable parameters, while optimising the return on risk.
In the following tables, the effect on equity excludes the changes in retained earnings as a direct result of changes in profit before tax.
Foreign currency risk
The Group has financial instruments that are denominated in Mexican peso and other foreign currencies which are exposed to foreign currency risk. Transactions in currencies other than the US dollar include the purchase of services, fixed assets, spare parts and the payment of dividends. As a result, the Group has financial assets and liabilities denominated in currencies other than functional currency and holds cash and cash equivalents in Mexican peso.
In order to manage the Group's exposure to foreign currency risk on expenditure denominated in currencies other than the US dollar, the Group has entered into certain forward and option derivative contracts.
The following table demonstrates the sensitivity of cash and cash equivalents, trade and other receivables, trade and other payables and derivatives financial instruments (excluding Silverstream which impact is disclosed in note 14) to a reasonably possible change in the US dollar exchange rate compared to the Mexican peso, reflecting the impact on the Group's profit before tax and equity, with all other variables held constant. It is assumed that the same percentage change in exchange rates is applied to all applicable periods for the purposes of calculating the sensitivity with relation to derivative financial instruments.
|
Year ended 31 December |
Strengthening/ |
Effect on |
Effect on equity: |
|
2025 |
5% |
1,356 |
(19,031) |
|
|
(5%) |
(3,418) |
23,312 |
|
2024 |
10% |
955 |
(582) |
|
|
(5%) |
(2,228) |
582 |
The Group's exposure to reasonably possible changes in other currencies is not material.
Commodity risk
The Group has exposure to changes in metals prices (specifically silver, gold, lead and zinc) which have a significant effect on the Group's results. These prices are subject to global economic conditions and industry-related cycles.
The table below reflects the aggregate sensitivity of financial assets and liabilities (excluding Silverstream which impact is disclosed in note 14) to a reasonably possible change in commodities prices, reflecting the impact on the Group's profit before tax with all other variables held constant.
The sensitivity shown in the table below relates to changes in fair value of commodity derivatives financial instruments contracts (excluding Silverstream) and embedded derivatives in sales.
|
Year ended 31 December |
Increase/(decrease) in commodity prices |
Effect on |
|||
|
Gold |
Silver |
Zinc |
Lead |
||
|
2025 |
20% |
40% |
10% |
5% |
175,345 |
|
|
(20%) |
(40%) |
(10%) |
(5%) |
(175,347) |
|
2024 |
10% |
15% |
10% |
10% |
38,509 |
|
|
(10%) |
(15%) |
(10%) |
(10%) |
(38,509) |
Interest rate risk
The Group is exposed to interest rate risk from the possibility that changes in interest rates will affect future cash flows or the fair values of its financial instruments, principally relating to the cash balances. Interest-bearing loans and notes payable are at a fixed rate, therefore the possibility of a change in interest rate only impacts its fair value but not its carrying amount. Therefore, interest-bearing loans, notes payable and loans from related parties are excluded from the table below.
The following table demonstrates the sensitivity of financial assets and financial liabilities (excluding Silverstream which impact is disclosed in note 14) to a reasonably possible change in interest rate applied to a full year from the balance sheet date. There is no impact on the Group's equity other than the equivalent change in retained earnings.
|
Year ended 31 December |
Basis point increase/ |
Effect on profit before tax: increase/ |
|
20251 |
- |
- |
|
|
(50) |
(13,826) |
|
20241 |
- |
- |
|
|
(50) |
(6,556) |
The sensitivity shown in the table above primarily relates to the full year of interest on cash balances held as at the year end.
1 Based on actual market conditions management considers an increase in interest rates is likely remote.
Equity price risk
The Group has exposure to changes in the price of equity instruments that it holds as equity investments at FVOCI.
The following table demonstrates the sensitivity of equity investments at FVOCI to a reasonably possible change in market price of these equity instruments, reflecting the effect on the Group's profit before tax and equity:
|
Year ended 31 December |
Increase/ |
Effect on |
Effect on equity: increase/ |
|
2025 |
100% |
- |
34,537 |
|
|
(20%) |
- |
(6,907) |
|
2024 |
80% |
- |
111,958 |
|
|
(20%) |
- |
(27,989) |
(b) Credit risk
Exposure to credit risk arises as a result of transactions in the Group's ordinary course of business and is applicable to trade and other receivables, cash and cash equivalents and derivative financial instruments.
The Group's policies are aimed at minimising losses as a result of counterparties' failure to honour their obligations. Individual exposures are monitored with customers subject to credit limits to ensure that the Group's exposure to bad debts is not significant. The Group's exposure to credit risk is influenced mainly by the individual characteristics of each counter party. The Group's financial assets are with counterparties whom the Group considers to have an appropriate credit rating. As disclosed in note 27, the counterparties to a significant proportion of these financial assets are related parties. At each balance sheet date, the Group's financial assets were neither credit-impaired nor past due, other than 'Other receivables' as disclosed in note 16. The Group's policies are aimed at minimising losses from foreign currency hedging contracts. The Company's foreign currency hedging contracts are entered into with large financial institutions with strong credit ratings.
The Group has a high concentration of trade receivables with one counterparty Met-Mex Peñoles, the Group's principal customer throughout 2025 and 2024. Met-Mex is a subsidiary in the Peñoles group which currently owns 75 per cent of the shares of the Company and is considered by management to be of appropriate credit rating.
The Group's surplus funds are managed by Servicios Administrativos Fresnillo, S.A. de C.V., which manages cash and cash equivalents, including short-term investments investing in several financial institutions. Accordingly, on an ongoing basis the Group deposits surplus funds with a range of financial institutions, depending on market conditions. In order to minimise exposure to credit risk, the Group only deposits surplus funds with financial institutions with a credit rating of MX-1 (Moody´s) and mxA-1+ (Standard and Poor's) and above. As at 31 December 2025, the Group had concentrations of credit risk as 22.9 percent of surplus funds were deposited with one financial institution of which the total investment was held in short term deposits.
The maximum credit exposure at the reporting date of each category of financial asset above is the carrying value as detailed in the relevant notes. See note 17 for the maximum credit exposure to cash and cash equivalents and short-term investments, note 16 for other receivables and note 27 for related party trade and other receivables.
(c) Liquidity risk
Liquidity risk is the risk that the Group will not be able to meet its financial obligations as they fall due.
The Group monitors its risk of a shortage of funds using projected cash flows from operations and by monitoring the maturity of both its financial assets and liabilities.
The table below summarises the maturity profile of the Group's financial liabilities based on contractual undiscounted payments.
|
|
US$ thousands |
|
||||||||
|
|
Within 1 year |
|
2-3 years |
|
3-5 years |
|
> 5 years |
|
Total |
|
|
As at 31 December 2025 |
|
|
|
|
|
|
|
|
|
|
|
Interest-bearing loans |
37,986 |
|
75,973 |
|
75,973 |
|
1,609,727 |
|
1,799,659 |
|
|
Trade and other payables |
241,416 |
|
- |
|
- |
|
- |
|
241,416 |
|
|
Lease liabilities |
5,368 |
|
5,349 |
|
920 |
|
- |
|
11,637 |
|
|
|
US$ thousands |
|
||||||||
|
|
Within 1 year |
|
2-3 years |
|
3-5 years |
|
> 5 years |
|
Total |
|
|
As at 31 December 2024 |
|
|
|
|
|
|
|
|
|
|
|
Interest-bearing loans |
37,986 |
|
75,973 |
|
75,973 |
|
1,647,713 |
|
1,837,645 |
|
|
Trade and other payables |
,150,094 |
|
- |
|
- |
|
- |
|
150,094 |
|
|
Notes payable |
2,055 |
|
- |
|
- |
|
- |
|
2,055 |
|
|
Lease liabilities |
4,994 |
|
6,092 |
|
2,604 |
|
- |
|
13,691 |
|
The payments for financial derivative instruments are the gross undiscounted cash flows. However, those amounts may be settled gross or net. The following table shows the corresponding estimated inflows based on the contractual terms:
|
|
US$ thousands |
|
||||||||
|
|
Within 1 year |
|
2-3 years |
|
3-5 years |
|
> 5 years |
|
Total |
|
|
As at 31 December 2025 |
|
|
|
|
|
|
|
|
|
|
|
Inflows |
437,947 |
|
- |
|
- |
|
- |
|
437,947 |
|
|
Outflows |
(439,562) |
|
- |
|
- |
|
- |
|
(439,562) |
|
|
Net |
(1,615) |
|
- |
|
- |
|
- |
|
(1,615) |
|
|
|
US$ thousands |
|
||||||||
|
|
Within 1 year |
|
2-3 years |
|
3-5 years |
|
> 5 years |
|
Total |
|
|
As at 31 December 2024 |
|
|
|
|
|
|
|
|
|
|
|
Inflows |
13,191 |
|
- |
|
- |
|
- |
|
13,191 |
|
|
Outflows |
(12,403) |
|
- |
|
- |
|
- |
|
(12,403) |
|
|
Net |
788 |
|
- |
|
- |
|
- |
|
788 |
|
The above liquidity tables include expected inflows and outflows from currency option contracts which the Group expects to be exercised during 2026 as at 31 December 2025 and during 2025 as at 31 December 2024, either by the Group or counterparty.
Management considers that the Group has adequate current assets and forecast cash from operations to manage liquidity risks arising from current liabilities and non-current liabilities.
Capital management
The primary objective of the Group's capital management is to ensure that it maintains a strong credit rating and healthy capital ratios that support its business and maximise shareholder value. Management considers capital to consist of equity and interest-bearing loans, excluding net unrealised gains or losses on revaluation of derivatives financial instruments and equity instruments at FVOCI. Refer to notes 18, 20 and 30 respectively for a quantitative summary of these items.
In order to ensure an appropriate return for shareholders' capital invested in the Group, management thoroughly evaluates all material projects and potential acquisitions and approves them at its Executive Committee before submission to the Board for ultimate approval, where applicable. The Group's dividend policy is based on the profitability of the business and underlying growth in earnings of the Group, as well as its capital requirements and cash flows including the cash flows from the Silverstream up to its buy back in August 2025.
One of the Group's metrics of capital is cash and other liquid assets which in 2025 and 2024 consisted of only cash and cash equivalents, which details are disclosed in note 17.
In January 2024 the Group entered into a syndicated revolving credit facility ("the facility") with a term from January 2024 to January 2029. The maximum amount available under the facility is US$350.0 million. The facility is unsecured and has an interest rate on drawn amounts of SOFR plus an interest margin of 1.15%. The terms of this facility include financial covenants related to leverage and interest cover ratios. No amounts have been drawn from the facility to date.
32. Subsequent event
On 31 October 2025, the Company entered into a definitive arrangement to acquire 100% of the issued and outstanding shares of Probe Gold Inc for an all-cash consideration of CAD$3.65 per share. On 21 January 2026 the Group completed the acquisition of 100% of the issued and outstanding shares of Probe Gold Inc., for a total consideration of US$555 million (CAD$770 million).
Probe is a Canadian exploration company focused on the acquisition, exploration, and development of highly prospective gold properties. It is the 100% owner of the multimillion-ounce Novador Gold Project, as well as an early-stage Detour Gold project, both located in Quebec.
The Group has applied its judgment to weigh the characteristics of Probe's acquisition and conclude whether it constitutes the acquisition of a business or a set of assets and activities under IFRS 3 "Business combinations". The Group has applied the optional concentration test outlined in the standard and on this basis, concluded that the acquisition of Probe does not constitute the acquisition of a business but the acquisition of a set of assets.
[1] Economic Value Distributed is considered to be a social performance measure and includes wages, taxes and payments to suppliers.
2 Silver eq. ounces are calculated converting only gold into silver ounces with an Au:Ag ratio of 80:1. Lead and zinc production is not included in silver eq. ounces.
[2] Main areas of executive management
[3] All the Company's risks are considered
[4] The Committee of Sponsoring Organizations (COSO) of the Treadway Commission Enterprise Risk Management (ERM) framework.
RNS may use your IP address to confirm compliance with the terms and conditions, to analyse how you engage with the information contained in this communication, and to share such analysis on an anonymised basis with others as part of our commercial services. For further information about how RNS and the London Stock Exchange use the personal data you provide us, please see our Privacy Policy.

Latest directors dealings
- 8 hours ago Molten Ventures
- 8 hours ago National Grid
- 8 hours ago Origin Enterprises (CDI)
- 8 hours ago Computacenter
- 9 hours ago Norcros