
Interim Results for the six months to 30 June 2026
Summary by AI BETAClose X

 Fresnillo plc
21 Upper Brook Street
London W1K 7PY
United Kingdom
4 August 2026
Fresnillo plc interim results
for the six months to 30 June 2026
Octavio Alvídrez, Chief Executive Officer, commented:
"Fresnillo delivered an exceptional financial performance in the first half of 2026. Through a combination of solid operational execution and cost discipline, we continued to capitalise on the historic strength of precious metals prices, with revenues up 74.7% to US$3.4 billion, driving Gross Profit up 130.7% to US$2.4 billion and strong operating cash flow. Our financial position enabled us to fund the strategic acquisition of Probe Gold, ongoing capex requirements, investment in exploration, and to declare an increased interim dividend of 43.4 cents per share for the period, in accordance with our dividend policy, while maintaining a robust balance sheet.
"Operationally, gold and silver production was in line with our expectations and plans across our mines are progressing well. We saw year-on-year changes from lower grades, a minor delay in the commissioning of the leaching pad XV at Herradura, and weather-related disruptions.
"We remain focused on managing costs within our control by driving efficiencies across our supply chain and advancing key infrastructure projects, including the interconnection of the Jarillas shaft at Saucito.
"Our full-year production guidance remains unchanged, and our high-margin portfolio puts us in a strong position to capitalise on ongoing market tailwinds. The safety and well-being of our people and host communities remain our core priority as we deliver on our strategy for the remainder of 2026."
First half highlights
Financial highlights (1H26/1H25 comparisons)
· Adjusted Revenues[1] of US$3,413.2m, up 72.1%; mainly due to higher silver and gold prices, partly offset by the anticipated lower volumes of gold and silver sold.
· Revenues of US$3,382.6m, up 74.7%; driven by the increased adjusted revenues and lower treatment and refining charges.
· Adjusted production costs[2] of US$811.9m, up 20.5% over 1H25, primarily due to the 12.5% revaluation of the Mexican peso vs. the US dollar, cost inflation, higher maintenance costs at Saucito, higher stripping and longer haulage distances at Herradura, together with higher contractor costs associated with the temporary hauling of material while the two sections of the Jarillas shaft at Saucito are being interconnected.
· Cost of sales of US$1,023.2m, up 12.0% mainly as a result of the higher adjusted production costs, mitigated by lower depreciation.
· Gross profit and EBITDA[3] of US$2,359.4m and US$2,349.7m, up 130.7% and 113.2%, respectively.
· Exploration expenses of US$109.3m, up 42.5% but in line with the increased guidance to intensify exploration activities at several operations and advanced exploration projects.
· Profit from continuing operations before net finance costs and income tax of US$2,143.8m, up 149.0%.
· Profit for the period before income tax of US$2,163.1m, up 227.6%.
· Income tax expense of US$516.5m and mining rights of US$183.2m, up 322.6% and 159.6%, respectively.
· Profit for the period of US$1,463.4m, up 213.0% from US$467.6m.
· Basic and diluted EPS from continuing operations of US$175.1 cents per share, up 227.9% from US$53.4 cents per share.
· Cash generated from operations, before changes in working capital, of US$2,364.7m, up 114.3%.
· Strong balance sheet with cash and other liquid funds as of 30 June 2026 of US$2,503.1m (31 December 2025: $2,756.5m).
· Interim dividend of 43.4 US cents per share, totalling US$319.8m (1H25: US$153.3m).
Operational highlights (1H26/1H25 comparisons)
As disclosed in the 2Q26 production report on 22 July 2026:
· First half attributable silver production of 22.0 moz decreased 11.4% vs. 1H25, mainly due to the end of the contribution from the Silverstream contract, the lower ore grade and decrease in volume of ore processed at Saucito, the lower ore grade at Juanicipio, Fresnillo and San Julián Veins, and the lower ore grade and recovery rate, and decreased volume of ore processed at Ciénega.
· First half attributable gold production of 290.9 koz, decreased 7.3% vs. 1H25, mainly due to the lower ore grade, decreased volume of ore processed and lower recovery rate at Herradura.
· Ongoing focus on safety, cost control, and productivity.
Highlights for 1H26
|
US$ million unless stated |
H1 26 |
H1 25 |
% change |
|
Silver production (koz) * |
22,049 |
24,882 |
(11.4) |
|
Gold production (oz) |
290,885 |
313,840 |
(7.3) |
|
Total revenues |
3,382.6 |
1,936.2 |
74.7 |
|
Adjusted revenues1 |
3,413.2 |
1,982.9 |
72.1 |
|
Cost of Sales |
1,023.2 |
913.2 |
12.0 |
|
Gross profit |
2,359.4 |
1,022.9 |
130.7 |
|
Adjusted production costs2 |
811.9 |
673.5 |
20.5 |
|
EBITDA3 |
2,349.7 |
1,102.1 |
113.2 |
|
Profit for the period |
1,463.4 |
467.6 |
213.0 |
|
Cash generated by operations before changes in working capital |
2,364.7 |
1,103.6 |
114.3 |
|
Basic and Diluted EPS (US$)4 |
1.751 |
0.534 |
227.9 |
|
Basic and Diluted EPS, excluding post-tax Silverstream revaluation effects (US$) |
1.751 |
0.715 |
144.9 |
|
Dividend per ordinary share (US$) |
0.434 |
0.208 |
108.7 |
* Silver production includes volumes realised under the Silverstream contract
1 Adjusted revenues are the revenues shown in the income statement adjusted to add back treatment and refining charges. The Company considers this is a useful additional measure to help understand underlying factors driving revenue in terms of volumes sold and realised prices
2 Adjusted production costs are calculated as cost of sales less depreciation, profit sharing, hedging and change in inventories. The Company considers this a useful additional measure to help understand underlying factors driving production costs in terms of the different stages involved in the mining and plant processes, including efficiencies and inefficiencies as the case may be and other factors outside the Company's control such as cost inflation or changes in accounting criteria.
3 Earnings before interest, taxes, depreciation and amortisation (EBITDA) is calculated as profit for the year from continuing operations before income tax, less finance income, plus finance costs, less foreign exchange gain/(loss), less revaluation effects of the Silverstream contract, less other operating income plus other operating expenses and depreciation.
4 The weighted average number of shares for H1 2026 and H1 2025 was 736.9m. See Note 8 in the Interim Consolidated Financial Statements.
Commentary on the Group's results
Operating results
First half attributable silver production of 22.0 moz (including Silverstream) decreased 11.4% vs. 1H25, mainly due to the end of the contribution from the Silverstream, the lower ore grade and decrease in volume of ore processed at Saucito, the lower ore grade at Juanicipio, Fresnillo and San Julián Veins, and the lower ore grade and recovery rate, and decreased volume of ore processed at Ciénega.
First half attributable gold production of 290.9 koz, decreased 7.3% vs. 1H25 due to the lower ore grade at Herradura resulting from reduced volumes of high-grade ore processed at the Dynamic Leaching Plant I, due to a fissure in the ball mill. To a lesser extent, the decrease in volumes of ore processed at Herradura driven by a minor delay in the commissioning of the leaching pad XV, and heavy rain and fog at the beginning of the year also contributed to the lower gold production.
First half attributable by-product lead production increased 8.8% vs. 1H25 mainly due to the higher ore grade at Fresnillo and Juanicipio, partly offset by the lower ore grade at Saucito.
First half attributable by-product zinc production remained broadly stable when compared to 1H25.
Financial results
Total revenue increased by 74.7% to US$3,382.6 million in 1H26, mainly due to higher silver and gold prices, partly offset by the anticipated decrease in gold and silver ounces sold.
The average realised silver price increased 134.4% from US$33.7 per ounce in 1H25 to US$78.9 per ounce in 1H26, while the average realised gold price rose 47.3%, from US$3,167.6 per ounce in 1H25 to US$4,666.8 per ounce in 1H26. The average realised lead by-product price decreased to US$86.5 cents per pound, down 2.3% vs 1H26, while the average realised zinc by-product price increased by 27.0% to US$155.3 cents per pound.
Adjusted production costs[4] increased by 20.5% to US$811.9 million in 1H26. The US$138.4 million decrease resulted primarily from the 12.5% revaluation of the Mexican peso vs. the US dollar, cost inflation, higher maintenance costs at Saucito, higher stripping and longer haulage distances at Herradura, together with higher contractor costs associated with the temporary hauling of material while the two sections of the Jarillas shaft at Saucito are being interconnected.
Depreciation decreased 11.0%, primarily due to lower production at Herradura, and the lower depletion factor at Fresnillo and Ciénega driven by the increase in reserves.
The factors mentioned above resulted in a 12.0% increase in cost of sales compared with 1H25.
The increase in revenues, together with the increase in cost of sales, resulted in a 130.7% increase in gross profit to US$2,359.4 million in 1H26.
Driven by an increase in gross profit, EBITDA increased by 113.2%, with EBITDA margin rising from 56.9% in 1H25 to 69.5% in 1H26. Similarly, profit from continuing operations before net finance costs and income tax increased from US$860.8 million in 1H25 to US$2,143.8 million in 1H26.
Profit from continuing operations before income tax increased 227.6% from US$660.3 million in 1H25 to US$2,163.1 million in 1H26.
Income tax expense for the period was US$516.5m, up 322.6% from US$122.2 million in 1H25. The effective tax rate, excluding the special mining rights, was 23.9% (1H25: 18.5%), which was below the 30% statutory tax rate. This variance resulted mainly from the special mining rights deductible for corporate income tax; the revaluation of the Mexican peso/US dollar spot exchange rate on the tax value of assets and liabilities; the benefit from the lower border tax which applied to the Herradura and Noche Buena mines; and the effect of the inflation rate (Mexican Consumer Price Index) that impacted the inflationary uplift of the tax base for assets and liabilities.
Profit for the period increased from US$467.6 million in 1H25 to US$1,463.4 million in 1H26, a 213.0% increase half-on-half as a result of the factors described above. Profit due to non-controlling interests increased 135.0% to US$173.4 million, reflecting the profit generated at Juanicipio, where Pan American Silver owns 44% of the outstanding shares. Accordingly, the profit attributable to equity shareholders of the Group was US$1,290.0 million, a 227.6% increase half-on-half.
Cash generated by operations before changes in working capital increased by 114.3% to US$2,364.7 million, mainly as a result of the higher profit from continuing operations generated in the year.
Capital expenditure in 1H26 totalled US$236.2 million, a 49.6% increase over 1H25. Investments during the period included mine development and stripping, purchase of in-mine equipment, construction of a leaching pad at Herradura, the deepening of the Jarillas shaft at Saucito, and investments in tailings dams.
Other uses of funds during the period were dividends paid of US$797.4 million (US$501.0 million in 1H25), a record high in the Group's history, income tax, special mining rights and profit sharing paid of US$890.0 million (US$255.4 million in 1H25), the acquisition of Probe Gold of US$547.8 million[5], and dividends paid to non-controlling interests in subsidiaries of US$191.7 million (US$59.4 1H25).
Fresnillo plc continued to maintain a solid financial position during the period with cash, cash equivalents and short-term investments of US$2,503.1 million as of 30 June 2026, decreasing 9.2% versus 31 December 2025 and increasing 37.3% versus 30 June 2025.
Interim Dividend
The Board of Directors has declared an interim dividend of 43.4 US cents per Ordinary Share totalling US$319.8 million, which will be paid on 18 September 2026 to shareholders on the register on 14 August 2026. The dividend will be paid in UK pounds sterling unless shareholders elect to be paid in US dollars. This interim dividend is higher than the previous period due to the increase in profit in 1H26, and remains in line with the Group's dividend policy. This decision was made after a comprehensive review of the Group's financial situation, ensuring that the Group is well placed to meet its current and future financial requirements, including its development and exploration projects.
As previously disclosed, the corporate income tax reform introduced in Mexico in 2014 created a withholding tax obligation of 10% (including to foreign nationals). The 2026 interim dividend will be subject to this withholding obligation.
5% share purchase in Sinda
As reported on 22 June 2026, Fresnillo entered into an agreement to acquire shares of common stock (the "Common Shares") of Sinda Ltd ("Sinda") pursuant to a private placement concurrent to Sinda's initial public offering and NYSE listing in the United States (the "Concurrent Placement"). The closing of the Concurrent Placement occurred on July 27, 2026, with Fresnillo purchasing 7,939,544 Common Shares of Sinda (NYSE: SIND) for gross proceeds of approximately US$95.3 million (US$12.0 per share). This investment enhances Fresnillo's exposure to attractive geological silver districts, complementary to its organic portfolio. This transaction was not recognised in the Group's interim financial statements since the closing occurred after 30 June 2026.
Outlook
Our 2026 outlook remains in line with previous guidance:
Attributable silver production expected to be in the range of 42.0 to 46.5 moz.
Attributable gold production expected to be in the range of 500.0 to 550 koz.
Attributable lead production expected to be in the range of 54 to 59 kt.
Attributable zinc production expected to be in the range of 85 to 95 kt.
Expressed in silver equivalent ounces, total production is expected to be 82 -91 million ounces.
Expected production for 2027 and 2028 remains unchanged. However we expect a slightly higher production of gold from the Herradura district and Fresnillo, and slightly lower production of silver from Saucito. A more detailed update regarding individual metal production expectations for 2027 and 2028 is expected to be issued in the Q4 production report.
Exploration expenses for 2026 are expected to be c. US$260 million, and risk capital invested in exploration anticipated to be approximately c. US$308 million.
Capex for 2026 has been revised to a range of US$500-550 million, reflecting the rationalisation of capex across mining operations.
Analyst Presentation
Fresnillo plc will be hosting a webcast presentation for analysts and investors today at 9:00am (GMT). A link to the webcast will be made available on Fresnillo's homepage: www.fresnilloplc.com, or can be accessed directly here:
For those unable to access the webcast, a conference line will also be provided, please pre-register here:
https://registrations.events/direct/LON840923
For further information, please visit our website: www.fresnilloplc.com or contact:
|
Fresnillo plc |
|
|
London Office Gabriela Mayor, Head of Investor Relations Mark Mochalski
|
Tel: +44(0)20 7339 2470
|
|
Mexico City Office Ana Belém Zárate |
Tel: +52 55 52 79 3206
|
|
|
|
|
Sodali Peter Ogden |
Tel: +44(0)20 7250 1446 |
ABOUT FRESNILLO PLC
Fresnillo plc is the world's largest primary silver producer and Mexico's largest gold producer, listed on the London and Mexican Stock Exchanges under the symbol FRES.
Fresnillo plc has eight operating mines, all of them in Mexico - Fresnillo, Saucito, Juanicipio, Ciénega, Herradura, Soledad-Dipolos1, Noche Buena2 and San Julián Veins and five advanced exploration projects - Orisyvo, Rodeo, Guanajuato, Novador and Tajitos as well as a number of other long term exploration prospects.
Fresnillo plc has mining concessions and exploration projects in Mexico, Peru and Chile.
Fresnillo plc's goal is to maintain the Group's position as the world's largest primary silver company and Mexico's largest gold producer.
1 Operations at Soledad-Dipolos are currently suspended.
2 Mineral extraction concluded in May 2023, however leaching of gold content inventories at the leaching pads continues.
FORWARD LOOKING STATEMENTS
Information contained in this announcement may include 'forward-looking statements'. All statements other than statements of historical facts included herein, including, without limitation, those regarding the Fresnillo Group's intentions, beliefs or current expectations concerning, amongst other things, the Fresnillo Group's results of operations, financial position, liquidity, prospects, growth, strategies and the silver and gold industries are forward-looking statements. Such forward-looking statements involve risk and uncertainty because they relate to future events and circumstances. Forward-looking statements are not guarantees of future performance and the actual results of the Fresnillo Group's operations, financial position and liquidity, and the development of the markets and the industry in which the Fresnillo Group operates, may differ materially from those described in, or suggested by, the forward-looking statements contained in this document. In addition, even if the results of operations, financial position and liquidity, and the development of the markets and the industry in which the Fresnillo Group operates are consistent with the forward-looking statements contained in this document, those results or developments may not be indicative of results or developments in subsequent periods. A number of factors could cause results and developments to differ materially from those expressed or implied by the forward-looking statements including, without limitation, general economic and business conditions, industry trends, competition, commodity prices, changes in regulation, currency fluctuations (including the US dollar and Mexican Peso exchanges rates), the Fresnillo Group's ability to recover its reserves or develop new reserves, including its ability to convert its resources into reserves and its mineral potential into resources or reserves, changes in its business strategy and political and economic uncertainty.
H1 2026 Operational Review
Production
|
Production |
H1 2026 |
H1 2025 |
% change |
|
Silver (koz) |
22,049 |
23,943 |
(7.9) |
|
Silverstream prod'n (koz) |
0 |
940 |
(100.0) |
|
Total Silver prod'n (koz) |
22,049 |
24,882 |
(11.4) |
|
Gold (oz) |
290,885 |
313,840 |
(7.3) |
|
Lead (t) |
32,828 |
30,182 |
8.8 |
|
Zinc (t) |
53,798 |
53,651 |
0.3 |
First half attributable silver production of 22.0 moz (including Silverstream) decreased 11.4% vs. 1H25, mainly due to the end of the contribution from the Silverstream, the lower ore grade and decrease in volume of ore processed at Saucito, the lower ore grade at Juanicipio, Fresnillo and San Julián Veins, and the lower ore grade and recovery rate, and decreased volume of ore processed at Ciénega.
First half attributable gold production of 290.9 koz, decreased 7.3% vs. 1H25 due to the lower ore grade at Herradura resulting from reduced volumes of high-grade ore processed at the Dynamic Leaching Plant I, due to a fissure in the ball mill. To a lesser extent, the decrease in volumes of ore processed at Herradura driven by a minor delay in the commissioning of the leaching pad XV, and heavy rain and fog at the beginning of the year also contributed to the lower gold production.
First half attributable by-product lead production increased 8.8% vs. 1H25 mainly due to the higher ore grade at Fresnillo and Juanicipio, partly offset by the lower ore grade at Saucito.
First half attributable by-product zinc production remained broadly stable when compared to 1H25.
Fresnillo mine production
|
|
H1 2026 |
H1 2025 |
% change |
|
Ore Processed (t) |
1,038,608 |
1,040,826 |
(0.2) |
|
|
|
|
|
|
Production |
|
|
|
|
Silver (koz) |
4,854 |
5,151 |
(5.8) |
|
Gold (oz) |
29,274 |
19,831 |
47.6 |
|
Lead (t) |
13,113 |
10,464 |
25.3 |
|
Zinc (t) |
25,170 |
22,213 |
13.3 |
|
|
|
|
|
|
Ore Grades |
|
|
|
|
Silver (g/t) |
162 |
170 |
(4.7) |
|
Gold (g/t) |
1.14 |
0.80 |
42.5 |
|
Lead (%) |
1.49 |
1.20 |
24.2 |
|
Zinc (%) |
3.30 |
2.85 |
15.8 |
|
|
|
|
|
|
|
|
|
|
|
Pyrite Concentrates Processed (t) |
42,527 |
38,606 |
10.2 |
|
|
|
|
|
|
Production |
|
|
|
|
Silver (koz) |
782 |
754 |
3.7 |
|
Gold (oz) |
1,057 |
958 |
10.3 |
First half silver production decreased 5.8% vs IH25, primarily driven by the lower ore grade due to increased dilution in narrower veins, as well as poor ground stability in long-hole stopes and a structural fault at San Alberto, which delayed access to the area. Additional anchoring and shotcreting activities are being implemented to strengthen ground support.
Mine development rates increased 13.3% half on half to an average of 3,435m per month in 1H25 (1H25: 3,033m per month), primarily due to higher equipment availability.
First half by product gold production increased 47.6% vs IH25, mainly due to the higher ore grade.
The silver ore grade in 2026 is expected to be in the range of 160 to 180 g/t, while the gold ore grade is estimated to be between 0.80 to 1.0 g/t.
Saucito mine production
|
|
H1 2026 |
H1 2025 |
% change |
|
Ore Processed (t) |
1,128,571 |
1,151,176 |
(2.0) |
|
|
|
|
|
|
Production |
|
|
|
|
Silver (koz) |
6,228 |
6,734 |
(7.5) |
|
Gold (oz) |
29,948 |
31,437 |
(4.7) |
|
Lead (t) |
11,361 |
13,615 |
(16.6) |
|
Zinc (t) |
16,309 |
21,411 |
(23.8) |
|
|
|
|
|
|
Ore Grades |
|
|
|
|
Silver (g/t) |
198 |
206 |
(3.9) |
|
Gold (g/t) |
1.08 |
1.12 |
(3.6) |
|
Lead (%) |
1.18 |
1.38 |
(14.5) |
|
Zinc (%) |
1.88 |
2.38 |
(21.0) |
|
|
|
|
|
|
Pyrite Concentrates Processed (t) |
38,627 |
34,880 |
10.7 |
|
|
|
|
|
|
Production |
|
|
|
|
Silver (koz) |
226 |
262 |
(13.7) |
|
Gold (oz) |
674 |
538 |
25.3 |
First half silver production decreased 7.5% vs. 1H25, mainly due to lower ore grade. In addition, the lower volume of ore processed from the Natalias, Mezquite and Central areas, and the temporary stoppage of the Jarillas shaft in mid-March to complete the interconnection of its two sections, also contributed to the lower silver production.
First half by-product gold production decreased 4.7% vs. 1H25, due to the lower ore grade and decreased volume of ore processed.
Mine development rates increased 2.7% half on half to an average of 2,504m per month in 1H26 (1H25: 2,439m per month), primarily due to increased availability of contractors' equipment, relative to 1H25.
The silver ore grade for 2026 is expected to be in the range of 200-220 g/t, while the gold grade is estimated to be between 0.95-1.15 g/t.
Juanicipio - Attributable
|
|
H1 2026 |
H1 2025 |
% change |
|
Ore Processed (t) |
381,798 |
380,538 |
0.3 |
|
|
|
|
|
|
Production |
|
|
|
|
Silver (koz) |
4,420 |
4,859 |
(9.0) |
|
Gold (oz) |
13,454 |
11,294 |
19.1 |
|
Lead (t) |
7,923 |
5,619 |
41.0 |
|
Zinc (t) |
12,318 |
9,500 |
29.7 |
|
|
|
|
|
|
Ore Grades |
|
|
|
|
Silver (g/t) |
390 |
423 |
(7.8) |
|
Gold (g/t) |
1.41 |
1.23 |
14.6 |
|
Lead (%) |
2.28 |
1.66 |
37.3 |
|
Zinc (%) |
4.04 |
3.12 |
29.5 |
|
|
|
|
|
|
Pyrite Concentrates Processed (t) |
1,358 |
3,995 |
(66.0) |
|
|
|
|
|
|
Production |
|
|
|
|
Silver (koz) |
20 |
54 |
(63.0) |
|
Gold (oz) |
24 |
74 |
(67.6) |
Attributable first half attributable silver production decreased 9.0% vs. 1H25, mainly due to the expected lower ore grade.
Attributable first half gold production increased 19.1% vs 1H25, mainly due to the higher ore grade.
The silver ore grade in 2026 is expected to be in the range of 320-370 g/t, while the gold grade is estimated to be between 1.1-1.3 g/t.
Ciénega mine production
|
|
H1 2026 |
H1 2025 |
% change |
|
Ore Processed (t) |
467,343 |
482,599 |
(3.2) |
|
|
|
|
|
|
Production |
|
|
|
|
Gold (oz) |
20,379 |
17,678 |
15.3 |
|
Silver (koz) |
1,218 |
1,653 |
(26.3) |
|
Lead (t) |
431 |
484 |
(11.0) |
|
Zinc (t) |
0 |
527 |
(100.0) |
|
|
|
|
|
|
Ore Grades |
|
|
|
|
Gold (g/t) |
1.45 |
1.24 |
16.9 |
|
Silver (g/t) |
117 |
133 |
(12.0) |
|
Lead (%) |
0.26 |
0.22 |
18.2 |
|
Zinc (%) |
0.30 |
0.30 |
0.0 |
First half gold production increased 15.3% vs. 1H25, due to the higher ore grade at Victoria and Virginia stopes, partly offset by the lower volume of ore processed due to reduced equipment availability.
First half silver production decreased 26.3% vs. 1H25 primarily driven by decreased recovery rate due to the higher portion of oxides processed at the flotation plant following the depletion of sulphides from Taspana, and lower ore grade. The lower volume of ore processed also impacted first half silver production vs 1H25.
The gold and silver ore grades for 2026 are estimated to be in the ranges of 1.5-1.7 g/t and 110-130 g/t, respectively.
San Julián Veins production
|
|
H1 2026 |
H1 2025 |
% change |
|
Ore Processed Veins (t) |
638,975 |
616,058 |
3.7 |
|
|
|
|
|
|
Production Veins |
|
|
|
|
Gold (oz) |
22,195 |
25,919 |
(14.4) |
|
Silver (koz) |
3,973 |
4,218 |
(5.8) |
|
|
|
|
|
|
Ore Grades Veins |
|
|
|
|
Gold (g/t) |
1.13 |
1.37 |
(17.5) |
|
Silver (g/t) |
215 |
234 |
(8.1) |
First half gold and silver production decreased vs. 1H25, primarily driven by the lower ore grade and differences with the geological model, mainly at the San Antonio Vein, and increased dilution at medium width veins. This was mitigated by the higher volume of ore processed compared with 1H25 due to improved operational continuity in 1H26, whereas an electrical fault in 1H25 affected the ball mill and required an unplanned maintenance stoppage.
Silver and gold ore grades in 2026 are expected to be in the ranges of 210-230 g/t and 0.9-1.1 g/t, respectively.
Herradura mine production
|
|
H1 2026 |
H1 2025 |
% change |
|
Ore Processed (t) |
9,858,090 |
10,125,225 |
(2.6) |
|
Total Volume Hauled (t) |
45,814,614 |
48,504,399 |
(5.5) |
|
|
|
|
|
|
Production |
|
|
|
|
Gold (oz) |
167,559 |
197,431 |
(15.1) |
|
Silver (koz) |
326 |
255 |
27.8 |
|
|
|
|
|
|
Ore Grades |
|
|
|
|
Gold (g/t) |
0.64 |
0.71 |
(9.9) |
|
Silver (g/t) |
1.47 |
1.22 |
20.5 |
First half gold production decreased 15.1% vs. 1H25 due to lower ore grade resulting from reduced volumes of high-grade ore processed at the Dynamic Leaching Plant 1, following a fissure in the ball mill that led to more frequent temporary stoppages and extended maintenance works. In addition, the decrease in volumes of ore processed, driven by a minor delay in the commissioning of the leaching pad XV, phase II, and heavy rain and fog at the beginning of the year, also impacted gold production.
The Carbon-in-Column facility was commissioned in 1Q26, and achieved full operational capacity in 2Q26, thus contributing to the increase in production quarter on quarter.
In addition, the engineering for the sulphides crushing circuit and the ADR plants continued during the period.
The average gold ore grade in 2026 is expected to be in the range of 0.50-0.70 g/t.
Noche Buena mine production
First half gold production totalled 6,321 ounces, a 27.2% decrease when compared with 1H25. As previously announced, a more detailed analysis and preparatory activities were undertaken in 2Q26 to resume operations at Noche Buena in 2027. This included recruitment of personnel, rehabilitation of facilities, and advancing engineering studies.
Below we provide an update on other projects which are expected to contribute to our medium and long term growth. These projects have not yet been approved by the Board and are subject to ongoing internal review. However, certain minor works and exploration activities might be in progress in preparation for Board approval and as such, are included within the 2026 approved capex and exploration budget.
Advanced exploration projects
Rodeo
Rodeo is an open pit, heap leaching gold project located in central Durango state. Gold occurs in a volcanic rock-hosted disseminated ore body showing thorough oxidation down to depths exceeding 200 metres. The metallurgical and extension drilling campaign completed in 2025 delivered an increase of mineral resources, which now stand at 2.3 million ounces of gold, 67% in the indicated category. The comprehensive metallurgical investigations completed have confirmed good recoveries for the proposed heap leaching operation.
Good results have been obtained from the 5,319 metres of core drilling completed in 1H 2026, focusing on priority infill drilling within the pit limits, and in the initial exploration of a disseminated gold target located close to the main deposit. Drilling will continue during 2H 2026.
The advanced PEA of the project is at its final stage, with results expected during early 3Q 2026. This will be submitted for approval and followed by the PFS stage, expected to start during the third quarter. The project execution timeline indicates production start by late 2029 to early 2030, subject to permitting timing. A robust community and government engagement programme continues in operation in the region, receiving good response from the involved parties.
Orisyvo
Orisyvo is a world-class, high-sulphidation epithermal, disseminated gold deposit located in the Sierra Madre mountains of Chihuahua state, hosting open-pit constrained total resources of 9.6 million ounces of gold.
The PFS-B advanced during 1H 2026 focusing on the definition of the main enabling projects, including tailings storage facilities and water and energy supply. Work will continue during 2H 2026 with environmental studies to submit permit applications before year-end, complementary studies, and the formalisation of the process of indigenous consultation. The land acquisition strategy and government and community engagement programmes continue to operate in the region. Production is expected to start by 2033 at an average of 180 - 220 koz gold per year.
Tajitos
Tajitos is a low strip ratio open-pit, heap-leach, disseminated gold project located in the Herradura Corridor of northwestern Sonora state, hosting a resource of 1.1 million ounces of gold, 90% in the indicated category.
Good results have been obtained from 12,157 metres of core drilling completed during 1H 2026, focusing on the search for additional disseminated and vein-hosted gold deposit in the western portion of the project. Metallurgical investigation in the main pit area is being refined, and it is expected to be concluded in 2H26, with a revised PEA scheduled in 1Q27.
Environmental studies associated with the potential development of this project are advancing well, along with our regional community relations programme and the evaluation of alternatives for water and energy supply and potential synergies with the existing infrastructure of the Herradura operations. The preliminary schedule indicates production from Tajitos may start by 2030.
Guanajuato
Guanajuato is a historic, world-class gold and silver epithermal vein field stretching more than 40 kilometres along the central Mexican state of Guanajuato. During 1H 2026, exploration was focused on the southern part of the district, with exploration drilling amounting to 32,844 metres of infill holes of the upper part of the main El Roble vein. Infill drilling will continue at an enhanced pace during 2H 2026.
PFS level studies are in progress following positive results from initial conceptual studies, including preparation for additional metallurgical investigations, geotechnical drilling, environmental permitting, land acquisition strategy, refining of layout of mining and processing infrastructure, and additional engineering work, all supported by our community and government engagement programmes. Preliminary scheduling indicates production from Guanajuato Sur to start by 2033.
Exploration continued in the central portion of the district at a slower pace, with 4,393 metres of core drilling completed at the Torres and Peregrina areas, where exploration potential remains in underexplored areas of these historic mining sites.
Novador
Following the closing of the acquisition of Probe Gold in January 2026, exploration and PFS level studies continued without interruption at the Novador project in the Quebec province of Canada. 37,550 metres of condemnation, extension, and infill drilling were completed during 1H 2026 with good results. PFS outcomes are expected during 2H 2026, to be closely followed by additional peer review and supplementary trade-off studies required for the start-up of an optimised feasibility study. Novador is expected to deliver an annual average of 200+ oz gold starting by 2033. Project activities continue to advance in accordance with applicable requirements, although there have been delays in obtaining the necessary permits.
Exploration
Exploration drilling meterage completed by Fresnillo plc during 1H26 amounted to 468,878 metres, an increase of 30% with respect to 1H 2025. 75% of the drilled metres were devoted to brownfields targets. The focus of the mine exploration teams lies on infill drilling to upgrade the resources category from inferred to indicated, to foster reserve replenishment, and on infill drilling of reserves to improve their certainty for short and medium-term mine planning. At Ciénega, emphasis was also put on resource extension drilling over a recently discovered new set of veins. Brownfields exploration is also carried out by the Exploration Division, devoting 38% of its drilling metres for the period to the evaluation of targets around the Fresnillo and San Julián districts and the Tajitos and Central Guanajuato projects.
In 1H 2026, Fresnillo's greenfield exploration included 96,340 metres drilled at the Guanajuato Sur, Novador, Rodeo, Lucerito, Capricornio, and Yastai projects.
Evaluation of Fresnillo properties in Mexico, Peru, and Chile is advancing to continue strengthening and optimising our portfolio; some selected third-party projects are under evaluation as well in the three countries where we operate.
In the first six months, US$109.3 million of exploration expenses were recorded in the income statement, a 42.4% increase from the same period in 2025. Total risk capital invested in exploration for the full year 2026 is expected to be US$308 million.
Related party transactions
Details of related party transactions that have taken place in the first six months of the current financial year are detailed in note 16 of the interim consolidated financial statements.
Sustainability performance
At Fresnillo, our purpose to contribute to the wellbeing of people through the sustainable mining of silver and gold, shapes both our long-term vision and our daily actions, with a clear focus on the issues most material to our business and stakeholders. The following sections outline our progress in the first half of 2026, as we continue evolving toward a more responsible, resilient, and inclusive mining model.
People
Our workforce is essential to fulfilling our organisational purpose. We aim to foster an inclusive culture that values diversity and empowers all employees to reach their full potential.
Workforce figures remained largely stable during the first half of 2026, as shown in Tables 1 and 2. We have continued to build on the momentum from meeting our 2025 gender representation targets. As of June 30, 2026, women represented 15.3826% of unionised and non-unionised employees (up from 14.73% as of December 2025) and 12.95% of our total workforce, including contractors (compared to 12.63% as of December 2025).
Table 1. Workforce composition
|
|
As at June 30, 2026 |
As at December 31, 2025 |
% Change |
|
Unionised employees |
5,642 |
5,529 |
2.04 |
|
Non-unionised employees |
1,706 |
1,648 |
3.52 |
|
Total unionised and non-unionised employees |
7,348 |
7,177 |
2.38 |
|
Unionised and non-unionised women (%) |
15.38 |
14.73 |
- |
|
Contractors |
11,729 |
11,096 |
5.70 |
|
Total workforce |
19,077 |
18,273 |
4.40 |
|
Total women (%) |
12.95 |
12.63 |
- |
Table 2. Turnover
|
|
As at June 30, 2026 |
As at June 30, 2025 |
|
Voluntary turnover (%) |
2.63 |
2.06 |
|
Total turnover (%) |
5.35 |
3.77 |
This year, Saucito Mine earned the Gold distinction of the Women in Mining (WIM) Seal - an initiative by WIM Mexico that evaluates workplace infrastructure, policies, and practices from a gender perspective, following Herradura's recognition in 2025. Building on this momentum, we continue scaling our efforts through a comprehensive programme aligned with the Women's Empowerment Principles (WEPs), aiming to embed an inclusion lens across processes and decision-making.
As part of this approach, our Inclusion Committee - composed of representatives from all mining units, exploration, and corporate offices - completed its first DEI maturity diagnostic in the second quarter of 2026, applying the ICMM's DEI Maturity Matrix to identify site-specific gaps and priorities. Drawing on these results, the Committee is now working to define a focused set of standardized DEI actions to be reviewed consistently across all business units, reinforcing alignment and shared accountability as the programme matures.
Safety
Safety is a fundamental value, rooted in our deep respect for life and embodied in the daily practice of our 'I Care, We Care' philosophy. We foster a culture of care, accountability and prevention to keep our people safe every day.
Between 2018 and June 2026, we have achieved a 73% reduction in the Total Recordable Injury Frequency Rate (TRIFR) and a 61% reduction in the Lost Time Injury Frequency Rate (LTIFR), per million hours worked. During the first half of 2026, we continued to improve our safety performance compared with the previous year, as shown in the table below, and reached 12 consecutive months without a fatal accident.
Table 3. TRIFR and LTIFR performance*
|
|
As at June 30, 2026 |
As at December 31, 2025 |
% Change |
|
Total Recordable Injury Frequency Rates (TRIFR) |
5.52 |
6.26 |
-11.82 |
|
Lost Time Injury Frequency Rates (LTIFR) |
3.36 |
4.10 |
-17.98 |
|
Fatal accidents |
0 |
2 |
-100.00 |
* Frequencies for every 1,000,000 hours worked
This performance reflects the continued implementation of our I Care, We Care philosophy, an integrated framework that addresses inherent industry risks through critical control management and ensures that all risks are managed systematically. During the first half of 2026, we continued to advance this work through the following initiatives:
Leadership remained a key focus, with continued efforts to reinforce visible leadership, accountability and risk ownership across all levels of the organisation, and the I Care, We Care Operational Committee has continued to enhance governance over the Company's Critical Risk portfolio. During the period, the Committee led the standardisation of seven of the fourteen Critical Risks and the development of common operational standards and guidance, which together with the implementation of the Business Partner Standard, continue to strengthen our systems risk competencies and the accountability needed to support a consistent approach to risk management across the business.
Behavioural risk competencies were also reinforced through the relaunch of the Competencies Facing the Risk (CFR) workshop, which strengthens field observation, active safety tools and leadership practices among operational leaders and middle management. Finally, the rollout of the Eye on Risk verification process - a cross-site verification process in which leaders responsible for the same operational discipline review one another's implementation of critical controls and risk management practices - significantly contributes to organisational learning environment, with findings shared across the Group to allow lessons learned and good practices to be transferred systematically between operations.
Together, these initiatives underpin a more proactive approach to safety across our workforce and business partners. By embedding safe decision-making into everyday operations, we continue to build a culture where everyone takes ownership of safety, supporting our ambition of eliminating fatalities and serious harm.
Health
We foster a safe and healthy work environment that prioritises the overall wellbeing of our workforce.
Our health strategy continues to evolve beyond traditional occupational health through five lines of action that focus on the early identification and prevention of both occupational and chronic diseases, while also promoting a healthier, safer, and more productive workplace: health surveillance, integral wellbeing, industrial care, development and innovation, and emergency preparedness.
During the first half of 2026, health surveillance continued to support early detection of occupational and non-occupational risks, with periodic medical screenings of our workforce, advancing to around a third of our annual target.
Integral wellbeing advanced through several initiatives, as mental health continues to gain prominence for the Company. This includes the Emotional Maturity Programme workshops, aimed at strengthening communication, self-awareness and team interaction, as well as the launch of the Behaviour Based Safety (BBS) pilot, designed to gather deeper evidence on the root causes of unsafe behaviour and generate analytics to inform accident prevention programmes.
Emergency preparedness was reinforced through continued coordination between our compliance and medical teams to ensure site clinics align with Ministry of Health and Ministry of Labour and Social Welfare (STPS) requirements, alongside first-aid training to strengthen on-site response capability.
Environment
We optimise resource consumption and manage environmental risk responsibly, working closely with communities and government to strengthen our environmental stewardship and licence to operate.
Our approach to water stewardship was validated externally this half, as Juanicipio Mine received an Environmental Achievement Award from the Zacatecas State Legislature for its water management model, which relies exclusively on treated wastewater in its beneficiation plant, avoiding the consumption of freshwater.
Climate and energy transition efforts continued, with renewable electricity consumption reaching 83.7% in 1H26, though we expect this to ease to around 79% by year end - a modest increase against 2025, but still comfortably ahead of our 2030 target of 75%. Alongside this, we continued to advance our energy demand forecasting methodology, structured across a robust process for our current operations, which we look to extend to new projects as they advance to feasibility stages to support our decarbonisation targets.
Environmental risk management progressed with the roll-out of our High Potential Environmental Strategy, building on last year's Critical Environmental Risk Portfolio - a tool designed to help each site identify its most critical environmental risks and implement standardised and consistent critical controls to prevent adverse impacts. San Julián Mine served as the pilot, completing the foundational phase - mapping critical environmental risks, developing bow-tie analyses of threats and controls, and documenting Critical Control Checklists (HVCCs) - to establish a standardised framework that extends across sites. Current efforts are focused on platform training, rolling out the strategy to contractors, and tracking findings to close gaps and monitor trends.
Across our Tailings Storage Facilities, we maintain a comprehensive internal and external review and monitoring programme, with corrective works when needed. Tailings management also advanced through the completion of the Beleña sink at Fresnillo Mine - a project designed to reprocess high-grade tailings, reducing the stored load at the Proaño TSF and improving its stability.
Biodiversity and environmental stewardship were reinforced through Fresnillo District's participation in the Federal Attorney's Office for Environmental Protection's (PROFEPA) "A Goal for the Environment" programme, advancing circular economy principles through the reduction of single-use plastics. In parallel, all mining operations and exploration offices marked World Environment Day through clean-up and reforestation campaigns, conferences and community engagement.
Community Relations
We operate with the aim of earning and maintaining the trust of our communities through meaningful engagement, support for their most pressing priorities, and accountability for our impact.
Rooted in a deep understanding of local culture and traditions, we listen closely to community concerns through social perception studies and our grievance mechanism, feeding directly into our social management plan. This approach is delivered in partnership with civil society and government, aligned with the UN Sustainable Development Goals.
We have continued to advance our Social Involvement programme to strengthen the link between our workforce and local communities, with employees acting as social ambassadors, and are now extending this into a second phase that reaches our business partners, reinforced through awareness sessions on shared expectations for community engagement and responsible conduct. Building on this, we laid the foundations this half for a more organic Transparency and Communication strategy to engage communities on our operational and social activity.
Health and wellbeing (SDG3) in our communities advanced through health brigades delivered in partnership with Fundación UNAM across Fresnillo District, San Julián and Ciénega, providing dental, physiotherapy, optometry and general medicine services. Alongside this, our Líderes en el Horizonte programme with FutbolMas continued to build youth leadership through sport, consolidating in San Julián, Guanajuato and Penmont and gaining early traction in Ciénega and Saucito, complemented by our baseball, basketball and Santos-Fresnillo football academies.
Quality education (SDG4) continued to be a core pillar. Picando Letras, our early-literacy programme, expanded to benefit children across all operations, and Prest Math, focused on promoting mathematics, science and technology, successfully concluded the academic period in San Julián and Penmont, laying the groundwork to launch in Ciénega next period.
Our First Robotics programme sponsored seven community teams, with the team from Juanicipio receiving the Rising All Star Award at the FIRST World Championship in Houston, Texas. Our Excellence Scholarship programme closed the 2025-26 academic year supporting 12 students at La Salle University and 15 at public universities, with 25 new applicants for 2026-27 across three new institutions in Chihuahua and Durango.
Decent work and economic growth (SDG8) progressed through continued support for agro-industrial workshops and bakery initiatives in Fresnillo District, and artisanal small businesses in Saucito, alongside the selection of potential beneficiaries for a second phase of our entrepreneurship programme across Ciénega, San Julián and Penmont.
Clean water and sanitation (SDG6) remain a top priority for our communities. In partnership with the Durango state government and the community itself, we successfully completed a water infrastructure project in Ciénega de Nuestra Señora, now supplying clean water to most of the community.
Life on Land (SDG15) initiatives brought employees, contractors and community members together in shared action - from clean-up campaigns in Ciénega and reforestation in Fresnillo, to an Earth Day cycling event for children in Saucito and climate-focused conferences and theatre presentations in Penmont, among others.
FINANCIAL REVIEW
The interim consolidated financial statements of the Group for the six months ended 30 June 2026 have been prepared in accordance with IAS 34 Interim Financial Reporting as issued by the IASB and as adopted by the UK. All comparisons refer to the first halves of 2026 and 2025, unless otherwise noted. The financial information and half year on half year variations are presented in US dollars, except where indicated. Management recommends reading this section in conjunction with the Interim Financial Statements and their accompanying Notes.
INCOME STATEMENT
|
|
1H 2026 US$ million |
1H 2025 US$ million |
Amount Change US$ million |
Change % |
|
Adjusted revenue [6] |
3,413.2 |
1,982.9 |
1,430.3 |
72.1 |
|
Total revenue |
3,382.6 |
1,936.2 |
1,446.4 |
74.7 |
|
Cost of sales |
1,023.2 |
913.2 |
110.0 |
12.0 |
|
Gross profit |
2,359.4 |
1,022.9 |
1,336.7 |
130.7 |
|
Exploration expenses |
109.3 |
76.7 |
32.6 |
42.5 |
|
Operating profit |
2,143.8 |
860.8 |
1,283.0 |
149.0 |
|
EBITDA [7] |
2,349.7 |
1,102.1 |
1,247.6 |
113.2 |
|
Income tax expense, including special mining rights |
699.7 |
192.8 |
506.9 |
262.9 |
|
Profit for the period |
1,463.4 |
467.6 |
995.8 |
213.0 |
|
Profit for the period, excluding post-tax Silverstream effects |
1,463.4 |
600.6 |
862.8 |
143.7 |
|
Basic and diluted earnings per share (US$/share) 5 |
1.751 |
0.534 |
1.217 |
227.9 |
|
Basic and diluted earnings per share, excluding post-tax Silverstream effects (US$/share) |
1.751 |
0.715 |
1.036 |
144.9 |
The Group's financial results are largely determined by the performance of our operations. However, there are other factors such as a number of macroeconomic variables, that lie beyond our control and which affect financial results. These include:
METALS PRICES
The average realised silver price increased 134.4% from US$33.7 per ounce in 1H25 to US$78.9 per ounce in 1H26, while the average realised gold price rose 47.3%, from US$3,167.6 per ounce in 1H25 to US$4,666.8 per ounce in 1H26. The average realised zinc by-product price increased by 27.0% to US$155.3 cents per pound in 1H26, while the average realised lead by-product price decreased to US$86.5 cents per pound, down 2.3% vs 1H25.
MX$/US$ EXCHANGE RATE
|
Spot exchange rate at 30 June 2026 |
Spot exchange rate at 31 December 2025 |
Impact |
|
$17.47 per US dollar |
$17.97 per US dollar |
The 2.8% spot revaluation had a favourable effect on deferred taxes and special mining rights. |
|
Average Mexican peso/US dollar exchange rate 1H26 |
Average Mexican peso/US dollar exchange rate 1H25 |
Impact |
|
$17.49 per US dollar |
$19.98 |
The 12.5% revaluation had an adverse effect of US$58.5 million on the Group's costs denominated in Mexican pesos when converted to US dollars. |
COST INFLATION
The Mexican Consumer Price Index for 1H26 was 1.9%. However, to evaluate the Group´s cost inflation for the period, we calculate the unit price increase for each component of adjusted production costs and take into consideration their weighted average within the Group's basket. In 1H26, this resulted in a cost inflation (increase in unit price) of 13.8% (including the adverse effect of the average revaluation of the Mexican peso vs. US dollar). Underlying cost inflation (cost inflation excluding the revaluation of the Mexican peso vs. US dollar) was 3.5%. The main components of our cost inflation (including the effect of the revaluation of the Mexican peso vs. US dollar) basket are listed below:
Labour
Unionised employees received on average a 7.0% increase in wages in Mexican pesos, while non-unionised employees received on average a 5.5% increase in wages in Mexican pesos; when converted to US dollars, this resulted in a weighted average labour inflation of 21.7%.
Energy
Electricity
The weighted average cost of electricity in US dollars increased 5.4% from US$7.89 cents per kw in 1H25 to US$8.32 cents per kw in 1H26. The main reason for the increase in US dollars was the revaluation of the Mexican peso; excluding this effect, the increase would have been approximately 1.1%.
Diesel
The weighted average cost of diesel, which is paid for in Mexican pesos, increased by only 5.4% due to the stimulus reduction in IEPS (Special Excise Tax on diesel). However, when converted to US dollars, the diesel price increased 20.5% to 124.43 US cents per litre in 1H26, mainly due to the revaluation of the Mexican peso vs the US dollar.
Operating materials
|
|
Half-on-half change in unit price % |
|
Other reagents |
17.9 |
|
Steel for drilling |
7.8 |
|
Sodium cyanide |
5.9 |
|
Lubricants |
4.9 |
|
Explosives |
4.8 |
|
Steel balls for milling |
1.0 |
|
Tyres |
1.0 |
|
Weighted average of all operating materials |
6.6 |
The weighted average unit prices of all operating materials increased by 6.6% half-on-half as the unit prices of reagents, steel for drilling, sodium cyanide, lubricants, and explosives continued to rise in US dollar terms, reflecting higher input and energy costs across the supply chain, together with global inflationary pressures. Although only approximately 20% of these costs are denominated in Mexican pesos, the 12.5% revaluation of the Mexican peso against the U.S. dollar accounted for nearly 40% of the increase in U.S. dollar terms.
Contractors
Agreements are signed individually with each contractor company and include specific terms and conditions that cover not only labour, but also operating materials, equipment and maintenance, amongst others. Contractor costs are mainly denominated in Mexican pesos and are an important component of our total production costs. In 1H26, increases per unit (i.e. per metre developed/ per tonne hauled) granted to contractors, resulted in a weighted average increase of 11.9% in US dollars, mainly due to the revaluation of the Mexican peso vs. US dollar.
Maintenance
Approximately 30% of maintenance costs are denominated in US dollars, which on average increased by 5.2%. The remaining 70% is Mexican peso-denominated and was impacted by the average revaluation of the Mexican peso. This caused an overall 12.3% increase on average in US dollar terms.
The effects of the above external factors, combined with the Group's internal variables, are further described below through the main line items of the income statement.
REVENUE
CONSOLIDATED REVENUE
|
|
1H 2026 |
1H 2025 |
Amount |
Change % |
|
Adjusted revenue [8] |
3,413.2 |
1,982.9 |
1,430.3 |
72.1 |
|
Treatment and refining charges |
(30.5) |
(46.8) |
16.3 |
(34.8) |
|
Total revenue |
3,382.6 |
1,936.2 |
1,446.4 |
74.7 |
Adjusted revenue increased by US$1,430.3 million, mainly due to the higher silver and gold prices, partly offset by the anticipated decrease in gold and silver ounces sold. Total revenue increased by 74.7% to US$3,382.6 million in 1H26.
ADJUSTED REVENUE8 BY METAL
|
|
H1 2026 |
|
H1 2025 |
|
|
|
|
|
|
|
US$ million |
% |
US$ million |
% |
Volume Variance |
Price |
Total net |
% |
|
Gold |
1,321.1 |
38.7 |
959.8 |
48.4 |
(72.7) |
434.0 |
361.3 |
37.6 |
|
Silver |
1,842.2 |
54.0 |
827.7 |
41.7 |
(18.2) |
1,032.8 |
1,014.6 |
122.6 |
|
Lead |
69.3 |
2.0 |
59.6 |
3.0 |
11.2 |
(1.5) |
9.7 |
16.3 |
|
Zinc |
180.5 |
5.3 |
135.9 |
6.9 |
7.2 |
37.5 |
44.7 |
32.8 |
|
Total adjusted revenue |
3,413.2 |
100.0 |
1,982.9 |
100.0 |
(72.6) |
1,502.8 |
1,430.2 |
72.1 |
ADJUSTED REVENUE BY Mine
The contribution by mine to Adjusted revenues is outlined in the table below. This is expected to change further in the future, as new projects are incorporated into the Group's operations and as precious metals prices fluctuate.
|
|
1H 2026 |
1H 2025 |
|
||||
|
|
(US$ million) |
% |
(US$ million) |
% |
Change % |
||
|
Herradura |
774.1 |
22.7 |
623.4 |
31.4 |
24.2 |
||
|
Juanicipio |
758.0 |
22.2 |
377.3 |
19.0 |
100.9 |
||
|
Saucito |
659.8 |
19.3 |
358.6 |
18.1 |
84.0 |
||
|
Fresnillo |
611.8 |
17.9 |
293.3 |
14.8 |
108.6 |
||
|
San Julián (Veins) |
398.4 |
11.7 |
216.0 |
10.9 |
84.4 |
||
|
Ciénega |
180.9 |
5.3 |
98.7 |
5.0 |
83.3 |
||
|
Noche Buena |
30.1 |
0.9 |
16.0 |
0.8 |
88.1 |
||
|
San Julián (DOB) |
0.0 |
0.0 |
(0.3) |
0.0 |
(100.0) |
||
|
Total |
3,413.2 |
100.0 |
1,982.9 |
100.0 |
72.1 |
||
VOLUMES OF METAL SOLD
|
|
1H 2026 |
% contribution |
1H 2025 |
% contribution |
% change |
|
Silver (koz) |
|
|
|
|
|
|
Juanicipio |
7,409 |
31.6% |
7,714 |
32.4% |
(4.0) |
|
Saucito |
4,927 |
21.0% |
4,906 |
20.6% |
0.4 |
|
Fresnillo |
4,359 |
18.6% |
4,346 |
18.3% |
0.3 |
|
San Julián (Veins) |
3,872 |
16.5% |
4,024 |
16.9% |
(3.8) |
|
Ciénega |
1,165 |
5.0% |
1,340 |
5.6% |
(13.1) |
|
Pyrites from Fresnillo |
782 |
3.3% |
735 |
3.1% |
6.4 |
|
Pyrites from Juanicipio |
324 |
1.4% |
241 |
1.0% |
34.4 |
|
Herradura |
322 |
1.4% |
254 |
1.1% |
26.8 |
|
Pyrites from Saucito |
269 |
1.1% |
242 |
1.0% |
11.2 |
|
Noche Buena |
1 |
0.0% |
1 |
0.0% |
0.0 |
|
San Julián (DOB)* |
0 |
0.0% |
(5) |
0.0% |
(100.0) |
|
Total silver (koz) |
23,430 |
100.0% |
23,798 |
100.0% |
(1.5) |
|
Gold (oz) |
|
|
|
|
|
|
Herradura |
160,684 |
56.7% |
195,291 |
64.6% |
(17.7) |
|
Saucito |
26,075 |
9.2% |
25,273 |
8.4% |
3.2 |
|
Fresnillo |
24,761 |
8.7% |
15,800 |
5.2% |
56.7 |
|
San Julián (Veins) |
21,955 |
7.7% |
24,913 |
8.2% |
(11.9) |
|
Juanicipio |
20,867 |
7.4% |
17,847 |
5.9% |
16.9 |
|
Ciénega |
19,485 |
6.9% |
15,847 |
5.2% |
23.0 |
|
Noche Buena |
6,531 |
2.3% |
4,870 |
1.6% |
34.1 |
|
Pyrites from Juancipio |
1,271 |
0.4% |
544 |
0.2% |
133.6 |
|
Pyrites from Fresnillo |
1,057 |
0.4% |
941 |
0.3% |
12.3 |
|
Pyrites from Saucito |
845 |
0.3% |
879 |
0.3% |
(3.9) |
|
San Julián (DOB)* |
0 |
0.0% |
17 |
0.0% |
(100.0) |
|
Total gold (oz) |
283,531 |
100.0% |
302,222 |
100.0% |
(6.2) |
|
Lead (t) |
|
|
|
|
|
|
Juanicipio |
13,465 |
37.1% |
9,045 |
38.5% |
48.9 |
|
Fresnillo |
11,933 |
32.8% |
9,189 |
39.1% |
29.9 |
|
Saucito |
10,563 |
29.1% |
4,906 |
20.9% |
115.3 |
|
Ciénega |
368 |
1.0% |
328 |
1.4% |
12.2 |
|
San Julián (DOB)* |
0 |
0.0% |
4 |
0.0% |
(100.0) |
|
Total lead (t) |
36,329 |
100.0% |
23,472 |
100.0% |
54.8 |
|
Zinc (t) |
|
|
|
|
|
|
Fresnillo |
21,386 |
40.6% |
18,640 |
37.0% |
14.7 |
|
Juanicipio |
17,663 |
33.5% |
13,801 |
27.4% |
28.0 |
|
Saucito |
13,690 |
26.0% |
17,575 |
34.9% |
(22.1) |
|
Ciénega |
0 |
0.0% |
434 |
0.9% |
(100.0) |
|
San Julián (DOB)* |
0 |
0.0% |
(53) |
(0.1%) |
(100.0) |
|
Total zinc (t) |
52,739 |
100.0% |
50,397 |
100.0% |
4.6 |
*Final adjustments to sales volumes from 2024.
TREATMENT AND REFINING CHARGES
Similar to previous years, the 2026 treatment and refining charges[9] (TRCs) per tonne and per ounce are currently being negotiated with Met-Mex (Peñoles' smelter and refinery) in accordance with international benchmarks and will apply retrospectively from January 2026. We expect these negotiations to conclude in 2H26.
Latest global market conditions indicate that treatment and refining charges (TRCs) will decline significantly year over year. Accordingly, to reflect current market expectations, we have recognised a provision based on our latest estimates.
These factors, combined with the higher volumes of zinc concentrates and lead concentrates shipped from our mines to Met-Mex, resulted in a 34.8% decrease in treatment and refining charges set out in the income statement in absolute terms when compared to 1H25.
COST OF SALES
|
|
1H 2026 |
1H 2025 |
Amount |
Change % |
|
Adjusted production costs [10] |
811.9 |
673.5 |
138.4 |
20.5 |
|
Depreciation |
214.8 |
241.4 |
(26.6) |
(11.0) |
|
Profit sharing |
10.1 |
7.9 |
2.0 |
25.3 |
|
Change in inventories |
(13.6) |
(9.6) |
(4.0) |
41.7 |
|
Cost of sales |
1,023.2 |
913.2 |
110.0 |
12.0 |
Cost of sales increased 12.0% to US$1,023.2 million in 1H26. The main factors driving the US$110.0 million increase are listed below:
• Adjusted production costs increased by US$138.4 million as shown in the graph below:
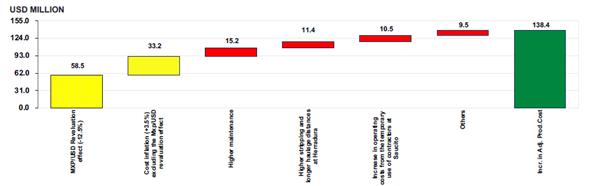
Approximately two thirds of the increase in adjusted production costs was attributable to the average revaluation of the MXN/USD exchange rate and cost inflation. The remaining third was primarily driven by higher maintenance costs at Saucito, higher stripping and longer haulage distances at Herradura, together with higher contractor costs associated with the temporary hauling of material while the two sections of the Jarillas shaft at Saucito are being interconnected. Additional explanations are provided in the cost per tonne section.
This adverse effect was mitigated by:
• Depreciation (-US$26.6 million) primarily due to lower production at Herradura, and the lower depletion factors at Fresnillo and Ciénega driven by the increase in reserves.
• The variation in the change in inventories had a favourable effect of US$4.0 million versus 1H25, primarily due to an increase in the weighted average cost of inventories on the leaching pads at Herradura, net of the consumption of inventories at Juanicipio, Saucito and Fresnillo, whereas in 1H25 an increase in inventories at Fresnillo, Saucito and Juanicipio was registered.
COST PER TONNE, CASH COST PER OUNCE AND ALL-IN SUSTAINING COST (AISC)
Cost per tonne is a key indicator to measure the effects of changes in production costs and cost control performance at each mine. This indicator is calculated as total production costs, plus ordinary mining rights, less depreciation, profit sharing and exchange rate hedging effects, divided by total tonnage processed. We have included cost per tonne hauled/moved as we believe it is a useful indicator to thoroughly analyse cost performance for the open pit mines.
|
Cost per tonne |
|
1H 2026 |
1H 2025 |
% change |
|
Fresnillo |
US$/tonne milled |
150.68 |
123.10 |
22.4 |
|
Saucito |
US$/tonne milled |
151.34 |
107.26 |
41.1 |
|
Juanicipio |
US$/tonne milled |
123.46 |
110.07 |
12.2 |
|
San Julián (Veins) |
US$/tonne milled |
131.74 |
128.29 |
2.7 |
|
Ciénega |
US$/tonne milled |
125.93 |
113.49 |
11.0 |
|
Herradura |
US$/tonne deposited |
25.47 |
20.40 |
24.9 |
|
Herradura |
US$/tonne hauled |
5.50 |
4.80 |
14.6 |
Fresnillo: Cost per tonne increased 22.4% to US$150.7 in 1H26, driven mainly by the adverse effect of the 12.5% revaluation of the Mexican peso vs the US dollar, higher development rates, which increased contractor costs, and the consumption of explosives and steel for drilling, and cost inflation.
Saucito: Cost per tonne increased 41.1% to US$151.3, primarily due to higher contractor costs driven by the temporary increase in material haulage through the ramp, while the two sections of the shaft are interconnected and the increase in metres developed, increase in maintenance and repairs, the adverse effect of the 12.5% revaluation of the Mexican peso vs the US dollar, and cost inflation.
Juanicipio: Cost per tonne increased 12.2% mainly due to the adverse effect of the 12.5% revaluation of the Mexican peso vs the US dollar, and the underlying cost inflation.
San Julián Veins: Cost per tonne increased 2.7% to US$131.7, primarily driven by the adverse effect of the 12.5% revaluation of the Mexican peso vs the US dollar and cost inflation. This was mostly offset by the decrease in contractor costs driven by lower development and infrastructure spend.
Ciénega: Cost per tonne increased 11.0% to US$125.9, mainly driven by the adverse effect of the 12.5% revaluation of the Mexican peso vs the US dollar and cost inflation, mitigated by lower contractor costs due to the decrease in metres developed.
Herradura: Cost per tonne of ore deposited increased 24.9% to US$25.5, primarily due to the adverse effect of the 12.5% revaluation of the Mexican peso vs the US dollar, higher stripping and longer haulage distances, and cost inflation.
Cash cost per ounce when compared to the corresponding metal price, is an indicator of the ability of the mine to generate competitive profit margins. Cash cost per ounce is calculated as the total cash cost (cost of sales plus treatment and refining charges, less depreciation) divided by the silver or gold equivalent ounces sold.
|
Cash cost per ounce |
|
1H 2026 |
1H 2025 |
% change |
|
Fresnillo |
US$ per eq. silver ounce |
21.07 |
15.36 |
37.2 |
|
Saucito |
US$ per eq. silver ounce |
20.53 |
11.72 |
75.2 |
|
Juanicipio |
US$ per eq. silver ounce |
9.59 |
7.68 |
24.9 |
|
San Julián (Veins) |
US$ per eq. silver ounce |
16.64 |
12.36 |
34.6 |
|
Ciénega |
US$ per eq. gold ounce |
1,550.26 |
1,843.60 |
(15.9) |
|
Herradura |
US$ per eq. gold ounce |
1,397.37 |
1,148.37 |
21.7 |
Fresnillo: Cash cost per equivalent silver ounce increased by 37.2%, mainly driven by the impact of the higher price of silver when calculating by product equivalent silver ounces, and the higher cost per tonne; mitigated by the higher gold, lead and zinc ore grades (increase in production) and the lower treatment and refining charges.
Saucito: Cash cost per equivalent silver ounce increased 75.2%, mainly due to the higher cost per tonne, the impact of the higher price of silver when calculating by product equivalent silver ounces; mitigated by the lower treatment and refining charges.
Juanicipio: Cash cost per equivalent silver ounce increased by 24.9%, primarily due to the the impact of the higher price of silver when calculating by product equivalent silver ounces, and higher cost per tonne, partly mitigated by the higher lead, zinc and gold ore grades (increase in production).
San Julián Veins: Cash cost per equivalent silver ounce increased 34.7%, mainly due to the impact of the higher price of silver when calculating by product equivalent silver ounces, and the lower silver and gold ore grades (decrease in production).
Ciénega: Cash cost per equivalent gold ounce decreased 16.0% due to the positive effect of the higher increase in the price of silver (a by-product) relative to the increase in the price of gold when calculating equivalent gold ounces, and higher gold and lead ore grades, partly offset by the higher cost per tonne.
Herradura: Cash cost per equivalent gold ounce increased 21.6% mainly due to the lower gold production (lower ore grade), and higher cost per tonne.
In addition to the traditional cash cost, the Group is reporting All-In Sustaining Cost (AISC).
This cost metric is calculated as traditional cash cost plus on-site general, corporate and administrative costs, community costs related to current operations, capitalised stripping and underground mine development, sustaining capital expenditures and remediation expenses. Similarly to cash cost, AISC is calculated using equivalent silver or gold ounces.
We consider AISC to be a reasonable indicator of a mine's ability to generate free cash flow when compared with the corresponding metal price. We also believe it is a means to monitor not only current production costs, but also sustaining costs as it includes mine development costs incurred to prepare the mine for future production, as well as sustaining capex.
ALL-IN SUSTAINING COST (AISC)
|
AISC |
|
1H 2026 |
1H 2025 |
% change |
|
Fresnillo |
US$ per eq. silver ounce |
32.87 |
22.17 |
48.3 |
|
Saucito |
US$ per eq. silver ounce |
29.32 |
17.19 |
70.6 |
|
Juanicipio |
US$ per eq. silver ounce |
15.82 |
11.35 |
39.4 |
|
San Julián (Veins) |
US$ per eq. silver ounce |
25.23 |
16.81 |
50.1 |
|
Ciénega |
US$ per eq. gold ounce |
2,007.48 |
2,341.63 |
(14.3) |
|
Herradura |
US$ per eq. gold ounce |
1,790.56 |
1,371.84 |
30.5 |
Fresnillo: All-in sustaining cost increased 48.3% over 1H25, primarily due to higher cash cost and an increase in sustaining capex, including capitalised mine development, per equivalent ounce.
Saucito: All-in sustaining cost increased 70.6%, due to higher cash cost, and an increase in sustaining capex, including capitalised mine development per equivalent ounce.
Juanicipio: All in sustaining cost increased 39.4%, primarily driven by higher cash cost, and an increase in sustaining capex and capitalised mine development per equivalent ounce.
San Julián Veins: All-in sustaining cost increased 50.1%, due to a higher cash cost, and an increase in capitalised mine development and sustaining capex per equivalent ounce.
Ciénega: The decrease in all-in sustaining cost was primarily driven by the lower cash cost, together with a decrease in capitalised mine development and sustaining capex per equivalent ounce.
Herradura: All-in sustaining cost increased by 30.4% mainly due to the higher cash cost and an increase in sustaining capex per equivalent ounce, mitigated by lower capitalised stripping.
GROSS PROFIT
Gross profit is a key financial indicator of profitability at each business unit and the Fresnillo Group as a whole.
Total gross profit increased by 130.7% from US$1,022.9 million in 1H25 to US$2,359.4 million in 1H26.
The main factors driving the US$1,336.5 million increase in gross profit were the higher silver and gold prices.
CONTRIBUTION BY MINE TO CONSOLIDATED GROSS PROFIT
|
|
1H 2026 |
1H 2025 |
Change |
|||
|
|
US$ million |
% |
US$ million |
% |
US$ million |
% |
|
Herradura |
513.5 |
21.8 |
349.4 |
34.3 |
164.1 |
47.0 |
|
Juanicipio |
621.1 |
26.3 |
250.6 |
24.6 |
370.5 |
147.8 |
|
Saucito |
424.3 |
18.0 |
181.4 |
17.8 |
242.9 |
133.9 |
|
Fresnillo |
401.7 |
17.0 |
114.7 |
11.2 |
287.0 |
250.2 |
|
San Julián |
274.2 |
11.6 |
101.1 |
9.9 |
173.1 |
171.2 |
|
Ciénega |
103.0 |
4.4 |
18.7 |
1.8 |
84.3 |
450.8 |
|
Noche Buena |
20.5 |
0.9 |
4.0 |
0.4 |
16.5 |
412.5 |
|
Total for operating mines |
2,358.3 |
100.0 |
1,019.9 |
100.0 |
1,338.4 |
131.2 |
|
Metal hedging and other subsidiaries |
1.1 |
|
3.0 |
|
(1.9) |
(63.3) |
|
Total Fresnillo plc |
2,359.4 |
|
1,022.9 |
|
1,336.5 |
130.7 |
EBITDA
|
|
1H 2026 |
1H 2025 |
Amount |
Change % |
|
Profit from continuing operations before income tax |
2,163.1 |
660.3 |
1,502.8 |
227.6 |
|
- Finance income |
(57.8) |
(42.2) |
(15.6) |
37.0 |
|
+ Finance costs |
32.6 |
31.8 |
0.8 |
2.5 |
|
+ Revaluation effects of Silverstream contract |
0.0 |
190.1 |
(190.1) |
(100.0) |
|
- Foreign exchange gain (loss), net |
5.9 |
20.8 |
(14.9) |
(71.6) |
|
- Other operating income |
(18.4) |
(5.4) |
(13.0) |
240.7 |
|
+ Other operating expense |
9.4 |
5.3 |
4.1 |
77.4 |
|
+ Depreciation |
214.8 |
241.4 |
(26.6) |
(11.0) |
|
EBITDA |
2,349.7 |
1,102.1 |
1,247.6 |
113.2 |
|
EBITDA margin |
69.5% |
56.9% |
|
|
EBITDA is a gauge of the Group's financial performance and a key indicator to measure debt capacity. It is calculated as profit for the year from continuing operations before income tax, less finance income, plus finance costs, less foreign exchange gain / (loss), plus the net Silverstream effects, less other operating income plus other operating expenses and depreciation. In 1H26, EBITDA doubled to US$2,349.7 million, primarily driven by the higher gross profit. As a result, EBITDA margin expressed as a percentage of revenue increased, from 56.9% in 1H25 to 69.5% in 1H26.
Finance income/(expense)Net finance income (excluding the Silverstream effect) increased from US$10.4 million in 1H25 to US$25.2 million in 1H26. This was mainly driven by the increased interest on short term deposits and investments, net of the interest paid on the 4.250% Senior Notes due 2050. In 2025, the Silverstream contract was terminated, resulting in a net loss in 1H25. The above factors had a favourable effect on the half-on-half comparison of US$204.9 million.
FOREIGN EXCHANGE
A foreign exchange loss of US$5.9 million was recorded over the period, mainly driven by the effect of the variation of the Mexican peso/US dollar exchange rate on the value of peso-denominated net monetary asset position. This compared favourably to the US$20.8 million loss registered in 1H25.
TAXATION
Income tax expense for the period was US$516.5 million, which compared negatively to the US$122.2 million income tax expense in 1H25. The effective tax rate, excluding the special mining rights, was 23.9%, which was below the 30% statutory tax rate. This variance resulted mainly from: i) the special mining rights deductible for corporate income tax; ii) the 2.8% revaluation of the Mexican peso/US dollar spot exchange rate on the tax value of assets and liabilities; iii) the benefit from the lower border tax which applied to the Herradura and Noche Buena mines; iv) and the effect of the inflation rate (Mexican Consumer Price Index) that impacted the inflationary uplift of the tax base for assets and liabilities.
The effective tax rate, excluding the special mining rights, was 18.5% in 1H25.
Mining rights increased from US$70.6 million in 1H25 to US$183.2 million in 1H26, mainly as a result of the increase in the profit base used in the calculation.
PROFIT FOR THE PERIOD
Profit for the period increased from US$467.6 million in 1H25 to US$1,463.4 million in 1H26, a 213.0% increase half-on-half due to the factors described above.
|
|
1H26 US$ million |
1H25 US$ million |
Amount change US$ million |
Change % |
|
Profit for the period |
1,463.4 |
467.6 |
995.8 |
213.0 |
|
Profit for the period, excluding post-tax Silverstream effects |
1,463.4 |
600.6 |
862.8 |
143.7 |
|
Profit due to non-controlling interests1 |
173.4 |
73.8 |
99.6 |
135.0 |
|
Profit attributable to equity shareholders of the Group |
1,290.0 |
393.8 |
896.2 |
227.6 |
|
Basic and diluted earnings per share (US$/share)5 |
1.751 |
0.534 |
1.217 |
227.9 |
|
Basic and diluted earnings per share, excluding post-tax Silverstream effects (US$/share) |
1.751 |
0.715 |
1.036 |
144.9 |
CASH FLOW
A summary of the key items from the cash flow statement is set out below:
|
|
1H 2026 |
1H 2025 |
Amount |
Change % |
|
Cash generated by operations before changes in working capital |
2,364.7 |
1,103.6 |
1,261.1 |
114.3 |
|
Decrease in working capital |
18.6 |
191.9 |
(173.3) |
(90.3) |
|
Taxes and employee profit sharing paid |
(890.0) |
(255.4) |
(634.6) |
248.5 |
|
Net cash from operating activities |
1,493.3 |
1,040.1 |
453.2 |
43.6 |
|
Financial interest and foreign exchange effects |
32.2 |
22.0 |
10.2 |
46.4 |
|
Disposal of equity instruments |
0.0 |
149.5 |
(149.5) |
(100.0) |
|
Silverstream contract |
0.0 |
34.3 |
(34.3) |
(100.0) |
|
Dividends paid to shareholders of the Company |
(797.4) |
(501.0) |
(296.4) |
59.2 |
|
Acquisition of Probe Gold, net of cash received and transaction costs (see note 9) |
(547.8) |
0.0 |
(547.8) |
100.0 |
|
Purchase of property, plant and equipment |
(236.2) |
(157.9) |
(78.3) |
49.6 |
|
Dividends paid to non-controlling interests in subsidiaries |
(191.7) |
(59.4) |
(132.3) |
222.9 |
|
Net increase/decrease in cash during the period after foreign exchange differences |
(253.4) |
525.1 |
(778.5) |
(148.3) |
|
Cash, cash equivalents and short-term investments at 30 June |
2,503.1 |
1,823.0 |
680.1 |
37.3 |
Cash generated by operations before changes in working capital more than doubled to US$2,364.7 million, due to the higher profits generated in the period. Working capital decreased US$18.6 million, mainly due to a US$65.2 million decrease in trade receivables mostly from related parties; net of a decrease in trade and other payables of US$29.0 million and a decrease of US$15.4 million in inventories.
Taxes, mining rights and employee profit sharing paid increased to US$890.0 million, up 248.5% vs 1H25, mainly due to: i) the higher final income tax corresponding to the 2025 tax fiscal year paid in 1H26, net of provisional taxes paid in 2025; ii) the increase in provisional tax payments paid in 1H26; iii) an increase in mining rights; and iv) higher profit sharing paid. The above increases resulted from higher profit levels.
As a result of the above factors, net cash from operating activities increased 43.6% from US$1,040.1 million in 1H25 to US$1,493.3 million in 1H26.
Additionally, net financial interests and foreign exchange effects increased 46.4% to US$32.2 million in 1H26. Interest received during the period totalled US$57.8 million (US$42.1 million in 1H25). Financial expenses in 1H26 and 1H25 included the interest paid on the 4.250% Senior Notes due 2050.
Main uses of funds were:
i) Dividends paid: a) to shareholders of the Group in 1H26 totalled US$797.4 million, a 59.2% increase over 1H25 as a result of the 2025 final dividend of 108.1 cents per share, paid in May 2026; and b) to minority shareholders (Pan American Silver participation in Juanicipio) of US$191.7 million
ii) The purchase of property, plant and equipment for a total of US$236.2 million, a 49.6% increase vs 1H25. Capital expenditures for 1H26 are described below:
PURCHASE OF PROPERTY, PLANT AND EQUIPMENT
|
|
1H 2026 |
|
|
|
Fresnillo mine |
59.9 |
|
Mine development and mining works, tailings dam, and purchase of in-mine equipment. |
|
Saucito mine |
52.5 |
|
Mine development, purchase of in-mine equipment, deepening of the Jarillas shaft and expansion of tailings dam. |
|
San Julián Veins |
48.3 |
|
Mining works and purchase of in-mine equipment. |
|
Juanicipio mine |
33.0 |
|
Mine development, expansion of tailings dam, and equipment |
|
Herradura mine |
32.8 |
|
Stripping, construction of leaching pads, tailings dam, and purchase of mine equipment. |
|
Ciénega mine |
9.3 |
|
Mining works, tailings dam, and purchase of in-mine equipment. |
|
Other |
0.3 |
|
Minera Bermejal. |
|
Total purchase of property, plant and equipment |
236.2 |
|
|
|
Acquisition of Probe Gold, net of cash received (Note 9) |
552.4 |
|
|
The sources and uses of funds described above resulted in a net decrease in cash and cash equivalents of US$255.2 million, which combined with the US$2,756.5 million balance at the beginning of the year resulted in cash, cash equivalents and short-term investments of US$2,503.1 million at the end of June 2026.
BALANCE SHEET
Fresnillo plc continued to maintain a solid financial position during the period with cash, cash equivalents and short-term investments of US$2,503.11 million as of 30 June 2026, decreasing 9.2% versus 31 December 2025 and increasing 37.3% versus 30 June 2025. Taking into account the cash, cash equivalents and short-term investments of US$2,503.1 million and the US$840.0 million outstanding Senior Notes, Fresnillo plc's net cash is US$1,663.1 million as of 30 June 2026. This compares to the net cash position of US$1,916.6 million as of 31 December 2025.
GOING CONCERN
The Group's business activities, together with the factors likely to affect its future development, performance and position are set out above in the Operational Review, with further detail in the Annual Report 2025. The financial position of the Group, its cash flows and liquidity position are described in the Financial Review. In addition, note 17 to the financial statements includes the Group's objectives, policies and processes for managing its capital; its financial risk management objectives; details of its financial instruments; and its exposures to credit risk and liquidity risk.
In making their assessment of the Group's ability to manage its future cash requirements, the Directors have considered the Company and Group budgets, and the cash flow forecasts for the period to 31 December 2027 (being the going concern assessment period). In addition, they reviewed a more conservative cash flow scenario using lower silver and gold prices of US$55.1 per ounce and US$3,979.0 per ounce respectively throughout this period, whilst maintaining current budgeted expenditure while only considering projects approved by the Executive Committee. This resulted in our current cash balances reducing over time but maintaining sufficient liquidity throughout the period.
The Directors have further calculated metal prices for a reverse stress test (US$15.0 per ounce and US$998.0 per ounce for silver and gold respectively), which are assumed to be maintained until the end of 2027. This would result in cash balances decreasing to minimal levels by the end of 2027, without applying mitigations and not using the revolving credit facility.
Should metal prices remain below the stressed prices above for an extended period, management has identified specific elements of capital and exploration expenditure which could be deferred without adversely affecting production profiles throughout the period. On the other hand, management could amend the mining plans to concentrate on production with a higher margin to accelerate cash generation without affecting the integrity of the mine plans. Finally, to maintain a strong liquidity, in January 2024 management acquired a committed revolving credit facility of US$350 million, which could be used if needed.
After reviewing all the above considerations, the Directors have a reasonable expectation that management have sufficient flexibility in adverse circumstances to maintain adequate resources to continue in operational existence for the foreseeable future. The Directors, therefore, continue to adopt the going concern basis of accounting in preparing the annual financial statements.
DIVIDENDS
The Board of Directors has declared an interim dividend of 43.4 US cents per Ordinary Share totalling US$319.8 million, which will be paid on 18 September 2026 to shareholders on the register on 14 August 2025. The dividend will be paid in UK pounds sterling unless shareholders elect to be paid in US dollars. This interim dividend is higher than the previous period due to the increase in profit in 1H26, and remains in line with the Group's dividend policy. This decision was made after a comprehensive review of the Group's financial situation, assuring that the Group is well placed to meet its current and future financial requirements, including its development and exploration projects.
As disclosed in previous reports, the corporate income tax reform introduced in Mexico in 2014 created a withholding tax obligation of 10% relating to the payment of dividends, including to foreign nationals. The 2026 interim dividend will be subject to this withholding obligation.
OUR APPROACH TO RISK MANAGEMENT
Effective risk management is an essential part of our culture and strategy. The accurate and timely identification, assessment and management of principal and emerging risks give us a clear understanding of the actions required to achieve our objectives. We have embedded a global risk management framework across Fresnillo plc which aims to always ensure consistency and the application of the appropriate level of oversight.
Key elements of integrated risk management:
· We recognise that risks are inherent to our business: Only through adequate risk management can internal stakeholders be effectively supported in making key strategic decisions and implementing our strategy.
· Exposure to risks must be consistent with our risk appetite: The Board defines and regularly reviews the acceptable level of exposure to emerging and principal risks. Risks are aligned with our risk appetite, taking into consideration the balance between threats and opportunities.
· We are all responsible for managing risks: Each business activity carries out risk evaluations to ensure the sound identification, management, monitoring and reporting of risks that could impact the achievement of our goals.
· Risk is analysed using a consistent framework: Our risk management methodology is applied to all our operations, projects, exploration activities and support areas, so that we have a comprehensive view of the uncertainties that could affect us in achieving our strategic goals.
· We are committed to continuous improvement: Lessons learned and best practices are incorporated into our procedures to protect and unlock value sustainably.
I. How we manage risk.
As explained in our 2025 Annual Report, the Company ended last year with good progress in risk management, including the implementation of actions that mitigated our most significant risks. In parallel, the risk department developed a training program focused on identifying and mitigating the risks the Company is most exposed to, which was rolled out across the business to increase awareness of our risk culture. During this first half of the year, we continued to improve our risk framework by increasing the use of metrics and scenarios to more accurately articulate the risk appetite and tolerance limits within which we wish to operate.
We maintain a risk register through a robust assessment of the potential principal risks that could affect the Company's performance. This register ensures that principal risks are identified in a thorough and systematic way and that agreed definitions of risk are used.
Defining risk appetite is key in embedding the risk management system into our organisational culture. The Company's risk appetite statement helps to align our strategy with the objectives of each business unit, clarifying which risk levels are, or are not, acceptable. It promotes consistent decision-making on risk, allied to the strategic focus and risk/reward balance approved by the Board.
During the first part of 2026, our risk team focused its efforts on identifying and assessing: "Potential action by the government", "Security", "Cybersecurity" and "Climate change". For the second part of the year, we will be assessing: "Fraud", "Safety", "Access to land" and "Community relations" risks.
II. Key thematic areas to consider in 2026.
The Company's risk profile has been developed based on the most significant risks in our business profiles. All our principal risks were reviewed at least twice during the year, including through KRIs, which were developed to help embed the risk appetite framework in the business and enhance the monitoring and mitigation of risks.
Due to the effects caused by geopolitical instability, it has been necessary to reassess the principal risks and reorder their materiality, likelihood and impact, as well as reassess related mitigation actions. Geopolitical instabilities include those relating to the Israel-Iran and Russia-Ukraine wars, attacks on commercial shipping in the Red Sea by Iran-backed Houthi rebels, the effects of global inflation on the cost of operations, as well as security and violence near business units, cyber-attacks, climatic disturbances, environmental situations close to our operations and changes to the laws and regulations in the mining industry in Mexico.
III. Our Principal Risk matrix.
Fresnillo plc is exposed to a variety of risks and uncertainties which may have a financial, operational or reputational impact on the Company, and which may also have an impact on the achievement of social, economic and environmental objectives.
A consistent assessment of the likelihood and impact of risk occurrence is fundamental to establishing, prioritising and managing the risk profile of the Company. In common with many organisations and in line with best practice, we use a probability and impact matrix for this purpose.
The following table presents the risk rating of Fresnillo plc's principal risks as at 30 June 2026:
|
1H´26 |
Principal risk |
Risk Appetite* |
Risk level |
Change in risk level vs 2025 |
|
1 |
Potential actions by the government (political, legal, regulatory, tax & concessions) |
Low |
Very high |
Stable |
|
2 |
Security |
Low |
Very high |
Monitoring |
|
3 |
Impact of metals prices and exchange rates |
High |
Very high |
Monitoring |
|
4 |
Cybersecurity |
Low |
High |
Monitoring |
|
5 |
Safety (incidents due to unsafe acts or conditions could lead to injuries or fatalities) |
Low |
High |
Stable |
|
6 |
Access to Land (full access to the lands) |
Low |
High |
Monitoring |
|
7 |
Projects (performance risk) |
Medium |
High |
Monitoring |
|
8 |
Global macroeconomic developments (energy and supply chain disruptions, inflation and cost) |
Medium |
High |
Monitoring |
|
9 |
Union Relations (labour relations) |
Low |
High |
Monitoring |
|
10 |
Human Resources (attract and retain requisite skilled people/talent crisis) |
Medium |
High |
Stable |
|
11 |
Licence to Operate (community relations) |
Medium |
Medium |
Stable |
|
12 |
Exploration (new ore resources) |
High |
Medium |
Stable |
|
13 |
Climate change (comply with international standards and regulations) |
Medium |
Medium |
Stable |
|
14 |
Tailings dams (overflow or collapse of tailings deposits) |
Low |
Medium |
Stable |
|
15 |
Environmental Incidents (cyanide spills and chemical contamination) |
Low |
Medium |
Stable |
IV. Our Emerging Risk matrix.
We define an emerging risk as a: "new manifestation of risk that cannot yet be fully assessed, a risk that is known to some degree but is not likely to materialise or have an impact for several years, or a risk that the company is not fully aware of but that could, due to emerging macro trends in the mid or long-term future, have significant implications for the achievement of our strategic plan". Furthermore, we consider emerging risks in the context of longer-term impact and shorter-term risk velocity.
The following table presents the risk rating of Fresnillo plc's emerging risks as at 30 June 2026:
|
1H´26 |
Emerging risks |
Risk level |
Change in risk level vs ARA´25 |
|
1 |
Geopolitical instability |
High |
Increasing |
|
2 |
Technological disruption & the rapid proliferation of artificial intelligence |
Medium |
Stable |
|
3 |
Transition to a low-carbon future (decarbonization) |
Medium |
Stable |
|
4 |
Increased expectations of society and investors |
Medium |
Stable |
|
5 |
Replacement on depletion of ore reserves |
Medium |
Stable |
|
6 |
Unexpected mine-closure liabilities that have the potential to increase costs |
Low |
Stable |
V. Preparation for the revised Provision 29 of the 2024 UK Corporate Governance Code.
In order to comply with Provision 29 of the UK Code, the risk management department carried out the following activities during the first half of the year:
1. The comprehensive risk management system was reviewed to assess its ability to identify, measure, and mitigate emerging or strategic threats, as well as the related control and governance activities.
2. The approaches, scopes, and impacts of each of the principal and emerging risks-as well as the individual risks included in Fresnillo plc's Risk Atlas-were reviewed in detail to identify risks lacking adequate controls or mitigation measures, or processes and activities that posed risks but had not been identified.
3. The financial, operational, and compliance mitigation actions and controls associated with each major and emerging risk were evaluated to assess the effectiveness of each.
4. In some cases, key risk indicators (KRIs) were redesigned to improve the measurement of risk levels in terms of timing and impact.
The following activities are planned for the second half of 2026:
a. Risk Pilot. - Three Risk Pilot sessions will be held, with the participation of risk owners, deputy directors, and in some cases directors, to improve mitigation measures and controls, and reduce the impact of risks related to fraud, asset security, and projects.
b. Risk Management Platform. - Fresnillo plc's Corporate Risk Register will be migrated to a specialized platform called "Goat," which enables more dynamic, real-time risk monitoring and reporting, and facilitates tracking of risk ownership, mitigation measures, and the effectiveness of controls, in line with the most stringent expectations of Provision 29.
c. 2026 Fraud Risk Assessment. - This will be conducted with the support of a third-party risk specialist, "Control Risk," to broaden the scope of the risk assessment and ensure compliance with various mandatory legal provisions, such as the "UK's Economic Crime and Corporate Transparency Act," and adherence to ISO 37003, the anti-fraud standard.
d. There is ongoing communication and information exchange with the Internal Control department, which is responsible for implementing and ensuring compliance with Provision 29 of the UK Corporate Governance Code.
Statement of directors' responsibilities
The Directors of the Company hereby confirm that to the best of their knowledge:
· the condensed set of financial statements has been prepared in accordance with IAS 34 Interim Financial Reporting as issued by the International Accounting Standards Board IASB and as adopted by the UK and gives a true and fair view of the assets, liabilities, financial position and profit and loss account of the Fresnillo Group as required by DTR 4.2.4; and
· the interim management report includes a fair review of the information required by
o DTR 4.2.7 (being an indication of important events that have occurred during the first six months of the financial year and their impact on the condensed set of financial statements; and a description of the principal risks and uncertainties for the remaining six months of the year); and
o DTR 4.2.8 (being related party transactions that have taken place in the first six months of the current financial year and that have materially affected the financial position or performance of the entity during that period and changes since the last annual report).
The Directors of the Company are:
|
Alejandro Baillères |
Chairman |
|
Arturo Fernández |
Non-executive director |
|
Fernando Ruiz |
Non-executive director |
|
Eduardo Cepeda |
Non-executive director |
|
Charlie Jacobs |
Non-executive director |
|
Alberto Tiburcio |
Independent non-executive director |
|
Dame Judith Macgregor |
Senior Independent non-executive director |
|
Georgina Kessel |
Independent non-executive director |
|
Guadalupe de la Vega |
Independent non-executive director |
|
Héctor Rangel |
Independent non-executive director |
|
Rosa Vázquez |
Independent non-executive director |
|
Luz Adriana Ramírez |
Independent non-executive director |
On behalf of the board of directors of Fresnillo plc
Octavio Alvídrez
Chief Executive Officer
INDEPENDENT REVIEW REPORT TO FRESNILLO PLC
Conclusion
We have been engaged by the Company to review the condensed set of financial statements in the half-yearly financial report for the six months ended 30 June 2026 which comprises the Interim Consolidated Income Statement, Interim Consolidated Statement of Comprehensive Income, Interim Consolidated Balance Sheet, Interim Consolidated Statement of Cash Flows and the related notes 1 to 19. We have read the other information contained in the half yearly financial report and considered whether it contains any apparent misstatements or material inconsistencies with the information in the condensed set of financial statements.
Based on our review, nothing has come to our attention that causes us to believe that the condensed set of financial statements in the half-yearly financial report for the six months ended 30 June 2026 is not prepared, in all material respects, in accordance with UK adopted International Accounting Standard 34 and the Disclosure Guidance and Transparency Rules of the United Kingdom's Financial Conduct Authority.
Basis for Conclusion
We conducted our review in accordance with International Standard on Review Engagements 2410 (UK) "Review of Interim Financial Information Performed by the Independent Auditor of the Entity" issued by the Financial Reporting Council. A review of interim financial information consists of making enquiries, primarily of persons responsible for financial and accounting matters, and applying analytical and other review procedures. A review is substantially less in scope than an audit conducted in accordance with International Standards on Auditing (UK) and consequently does not enable us to obtain assurance that we would become aware of all significant matters that might be identified in an audit. Accordingly, we do not express an audit opinion.
As disclosed in note 2a, the annual financial statements of the group are prepared in accordance with UK adopted international accounting standards. The condensed set of financial statements included in this half-yearly financial report has been prepared in accordance with UK adopted International Accounting Standard 34, "Interim Financial Reporting".
Conclusions Relating to Going Concern
Based on our review procedures, which are less extensive than those performed in an audit as described in the Basis for Conclusion section of this report, nothing has come to our attention to suggest that management have inappropriately adopted the going concern basis of accounting or that management have identified material uncertainties relating to going concern that are not appropriately disclosed.
This conclusion is based on the review procedures performed in accordance with International Standard on Review Engagements 2410 (UK) "Review of Interim Financial Information Performed by the Independent Auditor of the Entity" issued by the Financial Reporting Council, however future events or conditions may cause the entity to cease to continue as a going concern.
Responsibilities of the directors
The directors are responsible for preparing the half-yearly financial report in accordance with the Disclosure Guidance and Transparency Rules of the United Kingdom's Financial Conduct Authority.
In preparing the half-yearly financial report, the directors are responsible for assessing the company's ability to continue as a going concern, disclosing, as applicable, matters related to going concern and using the going concern basis of accounting unless the directors either intend to liquidate the company or to cease operations, or have no realistic alternative but to do so.
Auditor's Responsibilities for the review of the financial information
In reviewing the half-yearly report, we are responsible for expressing to the Company a conclusion on the condensed set of financial statements in the half-yearly financial report. Our conclusion, including our Conclusions Relating to Going Concern, are based on procedures that are less extensive than audit procedures, as described in the Basis for Conclusion paragraph of this report.
Use of our report
This report is made solely to the Company in accordance with guidance contained in International Standard on Review Engagements 2410 (UK) "Review of Interim Financial Information Performed by the Independent Auditor of the Entity" issued by the Financial Reporting Council. To the fullest extent permitted by law, we do not accept or assume responsibility to anyone other than the Company, for our work, for this report, or for the conclusions we have formed.
Ernst & Young LLP
London
4 August 2026
Interim Consolidated Income Statement
|
|
Notes |
For the six months ended 30 June |
|
||||||
|
|
|
2026 (Unaudited) |
2025 (Unaudited) |
||||||
|
|
|
(in thousands of US dollars) |
|
||||||
|
| |
|
Total |
Pre- Silverstream revaluation effect |
Silverstream revaluation effect1 |
Total |
|
|||
|
Continuing operations: |
|
|
|
|
|
|
|||
|
Revenues |
4 |
3,382,623 |
1,936,152 |
|
1,936,152 |
|
|||
|
Cost of sales |
5 |
(1,023,210) |
(913,218) |
|
(913,218) |
|
|||
|
|
|
|
|
|
|
|
|||
|
Gross profit |
|
2,359,413 |
1,022,934 |
|
1,022,934 |
|
|||
|
Administrative expenses |
|
(65,690) |
(55,187) |
|
(55,187) |
|
|||
|
Exploration expenses |
|
(109,256) |
(76,698) |
|
(76,698) |
|
|||
|
Selling expenses |
|
(49,610) |
(30,414) |
|
(30,414) |
|
|||
|
Other operating income |
|
18,350 |
5,388 |
|
5,388 |
|
|||
|
Other operating expenses |
|
(9,404) |
(5,254) |
|
(5,254) |
|
|||
|
|
|
|
|
|
|
|
|||
|
Profit before net finance costs and income tax |
|
2,143,803 |
860,769 |
|
860,769 |
|
|||
|
Finance income |
6 |
57,820 |
42,150 |
|
42,150 |
|
|||
|
Finance costs |
6 |
(32,585) |
(31,777) |
|
(31,777) |
|
|||
|
Revaluation effects of Silverstream contract |
|
- |
|
(190,055) |
(190,055) |
|
|||
|
Foreign exchange loss |
|
(5,928) |
(20,756) |
|
(20,756) |
|
|||
|
|
|
|
|
|
|
|
|||
|
Profit from before income tax |
|
2,163,110 |
850,386 |
(190,055) |
660,331 |
|
|||
|
Corporate income tax |
7 |
(516,515) |
(179,232) |
57,016 |
(122,216) |
|
|||
|
Special mining right |
7 |
(183,165) |
(70,552) |
|
(70,552) |
|
|||
|
|
|
|
|
|
|
|
|||
|
Income tax expense |
7 |
(699,680) |
(249,784) |
57,016 |
(192,768) |
|
|||
|
|
|
|
|
|
|
|
|||
|
Profit for the period |
|
1,463,430 |
600,602 |
(133,039) |
467,563 |
|
|||
|
|
|
|
|
|
|
|
|||
|
Attributable to: |
|
|
|
|
|
|
|||
|
Equity shareholders of the Company |
|
1,289,994 |
526,818 |
(133,039) |
393,779 |
|
|||
|
Non-controlling interests |
|
173,436 |
73,784 |
|
73,784 |
|
|||
|
|
|
|
|
|
|
|
|||
|
|
|
1,463,430 |
600,602 |
(133,039) |
467,563 |
|
|||
|
|
|
|
|
|
|
|
|||
|
Earnings per share: (US$) |
|
|
|
|
|
|
|||
|
Basic and diluted earnings per ordinary share |
8 |
1.751 |
|
|
0.534 |
|
|||
|
|
|
|
|
|
|
|
|||
|
Adjusted earnings per share: (US$) |
|
|
|
|
|
|
|||
|
Adjusted basic and diluted earnings per ordinary share |
8 |
1.751 |
0.715 |
|
|
|
|||
1 Corresponds to the fair value adjustment to the Silverstream contract as of 30 June 2025. The Silverstream contract was terminated on 1 August 2025 for an amount of US$40 million.
Interim Consolidated Statement of Comprehensive Income
|
|
|
For the six months ended 30 June |
|
|
|
|
|
2026 (Unaudited) |
2025 (Unaudited) |
|
|
|
|
(in thousands of US dollars) |
|
|
|
|
|
|
|
|
|
Profit for the period |
|
1,463,430 |
467,563 |
|
|
Other comprehensive income |
|
|
|
|
|
Items that may be reclassified subsequently to profit or loss: |
|
|
|
|
|
Foreign currency translation |
|
(60) |
95 |
|
|
|
|
|
|
|
|
Net other comprehensive income/(loss) that may be reclassified subsequently to profit or loss |
|
(60) |
95 |
|
|
|
|
|
|
|
|
Items that will not be reclassified to profit or loss: |
|
|
|
|
|
Changes in the fair value of cash flow hedges |
|
530 |
653 |
|
|
|
|
|
|
|
|
Total effect of cash flow hedges |
|
530 |
653 |
|
|
|
|
|
|
|
|
Changes in the fair value of equity investments at fair value through other comprehensive income (FVOCI) |
|
(7,785) |
53,913 |
|
|
Income tax effect on items that will not be reclassified to profit or loss |
|
2,237 |
(16,370) |
|
|
|
|
|
|
|
|
Net other comprehensive income/(loss) that will not be reclassified to profit or loss |
|
(5,018) |
38,196 |
|
|
|
|
|
|
|
|
Other comprehensive income/(loss), net of tax |
|
(5,078) |
38,291 |
|
|
|
|
|
|
|
|
Total comprehensive income, net of tax |
|
1,458,352 |
505,854 |
|
|
|
|
|
|
|
|
|
|
|
|
|
|
Attributable to: |
|
|
|
|
|
Equity shareholders of the Company |
|
1,284,961 |
431,956 |
|
|
Non-controlling interests |
|
173,391 |
73,898 |
|
|
|
|
|
|
|
|
|
|
1,458,352 |
505,854 |
|
|
|
|
|
|
|
Interim Consolidated Balance Sheet
|
|
Notes |
As of 30 June 2026 (Unaudited) |
As of 31 December 2025 (Audited) |
|
|
|
||
|
|
|
(in thousands of US dollars) |
|
|
ASSETS |
|
|
|
|
Non-current assets |
|
|
|
|
Property, plant and equipment (PPE) |
9 |
3,026,616 |
2,466,034 |
|
Equity instruments at FVOCI |
17 |
40,417 |
34,537 |
|
Deferred tax asset |
7 |
531,636 |
610,367 |
|
Inventories |
10 |
69,760 |
69,760 |
|
Other receivables |
11 |
42,664 |
41,510 |
|
Other assets |
|
3,742 |
3,608 |
|
|
|
|
|
|
|
|
3,714,835 |
3,225,816 |
|
|
|
|
|
|
Current assets |
|
|
|
|
Inventories |
10 |
448,260 |
432,838 |
|
Trade and other receivables |
11 |
750,931 |
830,585 |
|
Prepayments |
|
35,825 |
33,450 |
|
Derivative financial instruments |
17 |
- |
103 |
|
Short-term investments |
12 |
1,868 |
92,733 |
|
Cash and cash equivalents |
12 |
2,501,246 |
2,663,743 |
|
|
|
|
|
|
|
|
3,738,130 |
4,053,452 |
|
|
|
|
|
|
Total assets |
|
7,452,965 |
7,279,268 |
|
|
|
|
|
|
EQUITY AND LIABILITIES |
|
|
|
|
Capital and reserves attributable to shareholders of the Company |
|
|
|
|
Share capital |
|
368,546 |
368,546 |
|
Share premium |
|
1,153,817 |
1,153,817 |
|
Capital reserve |
|
(526,910) |
(526,910) |
|
Hedging reserve |
|
(36) |
(470) |
|
Fair value reserve of financial assets at FVOCI |
|
20,794 |
26,168 |
|
Foreign currency translation reserve |
|
(7,628) |
(7,568) |
|
Retained earnings |
|
4,112,576 |
3,619,311 |
|
|
|
|
|
|
|
|
5,121,159 |
4,632,894 |
|
Non-controlling interests |
|
422,958 |
441,793 |
|
|
|
|
|
|
Total equity |
|
5,544,117 |
5,074,687 |
|
|
|
|
|
|
Non-current liabilities |
|
|
|
|
Interest-bearing loans |
|
840,037 |
839,926 |
|
Lease liabilities |
|
7,953 |
6,183 |
|
Provision for mine closure cost |
|
282,124 |
262,521 |
|
Provision for pensions and other post-employment benefit plans |
|
19,641 |
17,732 |
|
Deferred tax liability |
7 |
170,147 |
145,507 |
|
|
|
|
|
|
|
|
1,319,902 |
1,271,869 |
|
|
|
|
|
|
Current liabilities |
|
|
|
|
Trade and other payables |
|
332,326 |
375,175 |
|
Income tax payable |
|
228,569 |
523,046 |
|
Derivative financial instruments |
17 |
55 |
741 |
|
Lease liabilities |
|
5,491 |
4,864 |
|
Provision for mine closure cost |
|
9,961 |
9,961 |
|
Employee profit sharing |
|
12,544 |
18,925 |
|
|
|
|
|
|
|
|
588,946 |
932,712 |
|
|
|
|
|
|
Total liabilities |
|
1,908,848 |
2,204,581 |
|
|
|
|
|
|
Total equity and liabilities |
|
7,452,965 |
7,279,268 |
|
|
|
|
|
Interim Consolidated Statement of Cash Flows
|
|
Notes |
For the six months ended 30 June |
|
|
|
|
2026 (Unaudited) |
2025 (Unaudited) |
|
|
|
(in thousands of US dollars) |
|
|
Net cash from operating activities |
16 |
1,493,307 |
1,040,086 |
|
|
|
|
|
|
Cash flows from investing activities |
|
|
|
|
Purchase of property, plant and equipment |
|
(236,170) |
(157,881) |
|
Acquisition of Probe Gold, net of cash received (note 9) |
|
(552,439) |
- |
|
Proceeds from the sale of property, plant and equipment and other assets |
|
258 |
258 |
|
Silverstream contract |
|
- |
34,251 |
|
Proceeds from the sale of mining concessions |
|
1,000 |
- |
|
Interest received |
|
57,769 |
42,097 |
|
Disposal of equity instruments at FVOCI1 |
|
- |
149,458 |
|
Dividends received from equity instruments at FVOCI |
|
- |
1,752 |
|
Short-term investments |
|
90,865 |
(90,466) |
|
|
|
|
|
|
Net cash used in investing activities |
|
(638,717) |
(20,531) |
|
|
|
|
|
|
Cash flows from financing activities |
|
|
|
|
Payment of note payable |
|
- |
(2,053) |
|
Dividends paid to shareholders of the Company2 |
|
(797,368) |
(501,006) |
|
Dividends paid to non-controlling interests in subsidiaries |
|
(191,768) |
(59,400) |
|
Capital contribution from non-controlling interest |
|
29 |
- |
|
Principal elements of lease payment |
|
(2,394) |
(2,288) |
|
Interest paid3 |
|
(20,296) |
(20,134) |
|
|
|
|
|
|
Net cash used in financing activities |
|
(1,011,797) |
(584,881) |
|
|
|
|
|
|
Net (decrease)/increase in cash and cash equivalents during the period |
|
(157,207) |
434,674 |
|
Effect of exchange rate on cash and cash equivalents |
|
(5,290) |
2 |
|
Cash and cash equivalents at 1 January |
12 |
2,663,743 |
1,110,413 |
|
|
|
|
|
|
Cash and cash equivalents at 30 June |
12 |
2,501,246 |
1,545,089 |
|
|
|
|
|
1 As of 30 June 2025, the Group disposed of 8,068,100 out of its 9,314,877 owned shares in MAG Silver and collected US$149.5 million. The gain on the disposal of US$114.3 million has been transferred from the Fair value reserve of financial assets at FVOCI to retained earnings, net of tax of US$34.3 million. During 2026, there have not been any acquisitions or disposals of equity investments impacting the Consolidated Statement of Cash Flows. During 2026, the Group has acquired equity instruments amounting to US$13.7 million as a result of non-cash transaction mainly related to the disposal of the Group's subsidiary Exploraciones y Desarrollos Mineros Coneto, S.A. P. I. de C.V.
2 Includes the effect of hedging of dividend payments made in currencies other than US dollar (note 13).
3 As of 30 June 2026 includes US$0.6 million (30 June 2025: US$0.6 million) related to a commitment fee in respect of undrawn amounts of the syndicated revolving credit facility entered by the Group. No amounts have been drawdown from the credit facility as of 30 June 2026.
Interim Consolidated Statement of Changes in Equity
|
|
Notes |
Share |
Share |
Capital reserve |
Hedging Reserve |
Fair value reserve of financial assets at FVOCI |
Foreign |
Retained |
Total attributable to shareholders of the Company |
Non-controlling interests |
Total |
|
(in thousands of US dollars) |
|||||||||||
|
Balance at 1 January 2025 (Audited) |
|
368,546 |
1,153,817 |
(526,910) |
(92) |
66,594 |
(7,570) |
2,800,956 |
3,855,341 |
355,029 |
4,210,370 |
|
Profit for the period |
|
|
|
|
|
|
|
393,779 |
393,779 |
73,784 |
467,563 |
|
Other comprehensive income, net of tax |
|
- |
- |
- |
343 |
37,739 |
95 |
- |
38,177 |
114 |
38,291 |
|
|
|
|
|
|
|
|
|
|
|
|
|
|
Total comprehensive income for the period |
|
- |
- |
- |
343 |
37,739 |
95 |
393,779 |
431,956 |
73,898 |
505,854 |
|
Hedging gain transferred to the carrying value of PPE purchased during the period |
|
- |
- |
- |
170 |
- |
- |
- |
170 |
79 |
249 |
|
Transfer of gain on disposal of equity investments at FVOCI to retained earnings (net of tax) |
|
- |
- |
- |
- |
(80,000) |
- |
80,706 |
706 |
- |
706 |
|
Dividends declared and paid |
13 |
- |
- |
- |
- |
- |
- |
(500,351) |
(500,351) |
(59,400) |
(559,751) |
|
|
|
|
|
|
|
|
|
|
|
|
|
|
Balance at 30 June 2025 (Unaudited) |
|
368,546 |
1,153,817 |
(526,910) |
421 |
24,333 |
(7,475) |
2,775,090 |
3,787,822 |
369,606 |
4,157,428 |
|
|
|
|
|
|
|
|
|
|
|
|
|
|
|
|
|
|
|
|
|
|
|
|
|
|
|
Balance at 1 January 2026 (Audited) |
|
368,546 |
1,153,817 |
(526,910) |
(470) |
26,168 |
(7,568) |
3,619,311 |
4,632,894 |
441,793 |
5,074,687 |
|
Profit for the period |
|
|
|
|
|
|
|
1,289,994 |
1,289,994 |
173,436 |
1,463,430 |
|
Other comprehensive income, net of tax |
|
|
|
|
401 |
(5,374) |
(60) |
- |
(5,033) |
(45) |
(5,078) |
|
|
|
|
|
|
|
|
|
|
|
|
|
|
Total comprehensive income for the period |
|
|
|
|
401 |
(5,374) |
(60) |
1,289,994 |
1,284,961 |
173,391 |
1,458,352 |
|
Hedging loss transferred to the carrying value of PPE purchased during the period |
|
|
|
|
33 |
|
|
|
33 |
20 |
53 |
|
Disposal of investment in subsidiary1 |
|
- |
- |
- |
- |
- |
- |
- |
- |
(507) |
(507) |
|
Capital contribution |
|
- |
- |
- |
- |
- |
- |
- |
- |
29 |
29 |
|
Dividends declared and paid |
13 |
- |
- |
- |
- |
- |
- |
(796,729) |
(796,729) |
(191,768) |
(988,497) |
|
|
|
|
|
|
|
|
|
|
|
|
|
|
Balance at 30 June 2026 (Unaudited) |
|
368,546 |
1,153,817 |
(526,910) |
(36) |
20,794 |
(7,628) |
4,112,576 |
5,121,159 |
422,958 |
5,544,117 |
|
|
|
|
|
|
|
|
|
|
|
|
|
1 In May 2026, the Company disposed of its investment in Exploraciones y Desarrollos Mineros Coneto, S.A. P. I. de C.V., in which the non-controlling interest held 39%. The consideration for the sale was settled in equity instruments of the acquiring company. |The value of the equity instruments received amounted to US$9.2 million.
Notes to the Interim Condensed Consolidated Financial Statements
1 Corporate Information
Fresnillo plc ("the Company", together with its subsidiaries, "the Group") is a public limited company registered in England and Wales with the registered number 6344120.
Industrias Peñoles S.A.B. de C.V. ("Peñoles") currently owns 75 percent of the shares of the Company and the ultimate controlling party of the Company is the Baillères family, whose beneficial interest is held through Peñoles. The registered address of Peñoles is Calzada Legaria 549, Mexico City 11250. Copies of Peñoles' accounts can be obtained from www.penoles.com.mx. Further information on related party balances and transactions with Peñoles group companies is disclosed in Note 15.
The interim condensed consolidated financial statements of the Group for the six months ended 30 June 2026 ("interim consolidated financial statements") were authorised for issue by the Board of Directors of Fresnillo plc on 3 August 2026.
The Group's principal business is the mining and beneficiation of non-ferrous minerals, and the sale of related production. The primary contents of this production are silver, gold, lead and zinc. Further information about the Group's operating mines and its principal activities is disclosed in Note 3.
2 Significant accounting policies
(a) Basis of preparation and statement of compliance
The interim consolidated financial statements of the Group for the six months ended 30 June 2026 have been prepared in accordance with IAS 34 Interim Financial Reporting included in the UK-adopted International Accounting Standards.
These interim consolidated financial statements do not constitute statutory accounts as defined in section 435 of the Companies Act 2006. A copy of the statutory accounts for the year ended 31 December 2025 has been delivered to the Registrar of Companies. The auditor's report in accordance with Chapter 3 of Part 16 of the Companies Act 2006 in relation to those accounts was unqualified, did not include a reference to any matters to which the auditor drew attention by way of emphasis without qualifying the report and did not contain a statement under section 498(2) or section 498(3) of the UK Companies Act 2006.
The interim consolidated financial statements have been prepared on a historical cost basis, except for trade receivables, derivative financial instruments, equity securities and defined benefit pension scheme assets which have been measured at fair value.
The interim consolidated financial statements are presented in dollars of the United States of America (US dollars or US$) and all values are rounded to the nearest thousand ($000) except where otherwise indicated.
The impact of seasonality or cyclicality on operations is not considered significant on the interim consolidated financial statements.
(b) Basis of consolidation
The interim consolidated financial statements set out the Group's financial position as of 30 June 2026 and 31 December 2025, and its operations and cash flows for the six-month periods ended 30 June 2026 and 30 June 2025.
The basis of consolidation adopted in the preparation of the interim consolidated financial statements is consistent with that applied in the preparation of the consolidated financial statements for the year ended 31 December 2025.
(c) Changes in accounting policies and presentation
The accounting policies adopted in the preparation of the interim consolidated financial statements are consistent with those applied in the preparation of the consolidated financial statements for the year ended 31 December 2025.
New standards, amendments and interpretations as adopted by the Group
A number of new or amended standards became applicable for the current reporting period. The Group did not have to change its accounting policies or make retrospective adjustments as a result of adopting these standards.
Impact of standards issued but not yet applied by the Group
There have been no significant changes to the standards issued but not yet effective as disclosed in the Group's annual consolidated financial statements for the year ended 31 December 2025. IFRS 18 Presentation and Disclosure in Financial Statements, which replaces IAS 1 Presentation of Financial Statements, is effective for annual reporting periods beginning on or after 1 January 2027. The Group continues to assess the impact of the new standard and expects it to primarily affect the presentation and disclosure of information in the consolidated financial statements. Based on the assessment performed to date, the Group does not anticipate a material impact on reported financial performance or cash flows. The Group has not early adopted any standard, interpretation or amendment that was issued but is not yet effective.
Significant accounting judgments, estimates and assumptions
Significant accounting judgments, estimates and assumptions, other than the asset acquisition judgment outlined below, are consistent with those disclosed in the consolidated financial statements for the year ended 31 December 2025.
Acquiring a subsidiary or a group of assets
In identifying a business combination or acquisition of assets the Group considers the underlying inputs, processes and outputs acquired as a part of the transaction. For an acquired set of activities and assets to be considered a business there must be at least some inputs and processes that have the capability to achieve the purposes of the Group. Where significant inputs and processes have not been acquired, a transaction is considered to be the purchase of assets. For the assets and assumed liabilities acquired the Group allocates the total consideration paid (including directly attributable transaction costs) based on the relative fair values of the underlying items. On 21 January 2026 the Group acquired Probe Gold Inc (note 9). The transaction was accounted for as a purchase of assets as no systems, processes or outputs were acquired, with the main asset acquired being the Novador project, which is in an advanced exploration stage.
(d) Going concern
The Group's business activities, together with the factors likely to affect its future development, performance and position are set out above in the Operational Review, with further detail in the Annual Report 2025. The financial position of the Group, its cash flows and liquidity position are described in the Financial Review. In addition, note 17 to the financial statements includes the Group's objectives, policies and processes for managing its capital; its financial risk management objectives; details of its financial instruments; and its exposures to credit risk and liquidity risk.
In making their assessment of the Group's ability to manage its future cash requirements, the Directors have considered the Company and Group budgets, and the cash flow forecasts for the period to 31 December 2027 (being the going concern assessment period). In addition, they reviewed a more conservative cash flow scenario using lower silver and gold prices of US$55.1/ounce and US$3,979/ounce respectively throughout this period, whilst maintaining current budgeted expenditure while only considering projects approved by the Executive Committee. This resulted in our current cash balances reducing over time but maintaining sufficient liquidity throughout the period.
The Directors have further calculated metal prices for a reverse stress test (US$15.0/ounce and US$998/ounce for silver and gold respectively), which are assumed to be maintained until the end of 2027. This would result in cash balances decreasing to minimal levels by the end of 2027, without applying mitigations and not using the revolving credit facility.
Should metal prices remain below the stressed prices above for an extended period, management have identified specific elements of capital and exploration expenditure which could be deferred without adversely affecting production profiles throughout the period. On the other hand, management could amend the mining plans to concentrate on production with a higher margin to accelerate cash generation without affecting the integrity of the mine plans. Finally, to maintain a strong liquidity, in January 2024 management acquired a committed revolving credit facility of US$350 million, which could be used if needed.
After reviewing all of the above considerations, the Directors have a reasonable expectation that management have sufficient flexibility in adverse circumstances to maintain adequate resources to continue in operational existence for the foreseeable future. The Directors, therefore, continue to adopt the going concern basis of accounting in preparing the annual financial statements.
3 Segment reporting
For management purposes, the Group is organised into operating segments based on producing mines.
At 30 June 2026 the Group has seven reportable operating segments represented by seven producing mines as follows:
The Fresnillo mine, located in the State of Zacatecas, an underground silver mine;
The Saucito mine, located in the State of Zacatecas, an underground silver mine;
The Cienega mine, located in the State of Durango, an underground gold mine;
The Herradura mine, located in the State of Sonora, a surface gold mine;
The Noche Buena mine, located in the State of Sonora, a surface gold mine;
The San Julian mine, located on the border of Chihuahua / Durango states, an underground silver-gold mine; and
The Juanicipio mine, located in the State of Zacatecas, an underground silver mine.
The operating performance and financial results for each of these mines are reviewed by management. As the Group´s Chief Operating Decision Maker (CODM) does not review segment assets and liabilities, the Group has not disclosed this information.
In the six months ended 30 June 2026 99.3% (30 June 2025: 99.7%) of revenue was derived from customers based in Mexico.
Management monitors the results of its operating segments separately for the purpose of performance assessment and making decisions about resource allocation. Segment performance is evaluated without taking into account certain adjustments included in Revenue as reported in the Interim Consolidated Income Statement, and certain costs included within Cost of sales and Gross profit which are considered to be outside of the control of the operating management of the mines. The table below provides a reconciliation from segment profit to Gross profit as per the Interim Consolidated Income Statement. Administrative expenses, Exploration expenses, Selling expenses, and Other income and expenses not related to production activities included in the Interim Consolidated Income Statement are not allocated to operating segments. Also, the Group's financing (including Finance cost and Finance income) and Income taxes are managed on a Group basis and are not allocated to operating segments. Transactions between reportable segments are accounted for on an arm's length basis similar to transactions with third parties.
Operating segments
The following tables present revenue and profit information regarding the Group's operating segments for the six months ended 30 June 2026 and 2025, respectively. Revenues for the six months ended 30 June 2026 and 2025 include those derived from contracts with customers and other revenues, as shown in note 4.
|
Six months ended 30 June 2026 |
|
||||||||||||||||||||
|
US$ thousands |
Fresnillo |
Herradura |
Cienega |
Saucito |
Noche |
San Julian |
Juanicipio |
Other4
|
Adjustments and eliminations |
Total |
|||||||||||
|
Revenues: |
|
|
|
|
|
|
|
|
|
|
|
||||||||||
|
Third party1 |
537,322 |
773,220 |
180,125 |
722,088 |
30,014 |
396,758 |
743,096 |
|
|
3,382,623 |
|
||||||||||
|
Inter-Segment |
55,499 |
|
|
|
|
|
4,204 |
27,698 |
(87,401) |
- |
|
||||||||||
|
Segment revenues |
592,821 |
773,220 |
180,125 |
722,088 |
30,014 |
396,758 |
747,300 |
27,698 |
(87,401) |
3,382,623 |
|
||||||||||
|
Segment profit2 |
441,476 |
519,763 |
121,982 |
482,706 |
20,327 |
311,751 |
659,961 |
26,399 |
|
2,584,365 |
|
||||||||||
|
Depreciation and amortisation |
|
|
|
|
|
|
|
|
|
(214,832) |
|
||||||||||
|
Employee profit sharing |
|
|
|
|
|
|
|
|
|
(10,120) |
|
||||||||||
|
Gross profit as per the income statement |
|
|
|
|
|
|
|
|
|
2,359,413 |
|
||||||||||
|
Capital expenditure3 |
59,881 |
32,844 |
9,273 |
52,486 |
- |
48,337 |
33,010 |
339 |
|
236,170 |
|
||||||||||
|
|
|
|
|
|
|
|
|
|
|
|
|||||||||||
1 During 2026 all segment revenues were related to sales to Met-Mex, except in Juanicipio which includes sales to other external customers of US$23.2 million.
2 The Group's CODM primarily uses this measure to monitor the operating results directly related to the production of its business units separately to make decisions about resource allocation and performance assessment. Segment profit excluding depreciation and amortisation and employee profit sharing.
3 Capital expenditure represents the cash outflow in respect of additions to property, plant and equipment, including mine development and purchase of mine equipment, excluding additions relating to changes in the mine closure provision. Significant additions include the expansion of the tailings dam at Fresnillo, Juanicipio, Saucito, and Herradura, and mining works at Fresnillo, Saucito and San Julian.
4 Other inter-segment revenue corresponds to leasing services provided by Minera Bermejal, S.A. de C.V; capital expenditure mainly corresponds to exploration entities.
|
Six months ended 30 June 2025 |
||||||||||||||||||||
|
US$ thousands |
Fresnillo |
Herradura |
Cienega |
Saucito |
Noche |
San Julian |
Juanicipio |
Other4 |
Adjustments and eliminations |
Total |
||||||||||
|
Revenues: |
|
|
|
|
|
|
|
|
|
|
||||||||||
|
Third party1 |
250,922 |
622,594 |
97,328 |
376,443 |
15,947 |
213,882 |
359,036 |
|
|
1,936,152 |
||||||||||
|
Inter-Segment |
22,471 |
|
|
|
|
|
2,664 |
24,888 |
(50,023) |
- |
||||||||||
|
Segment revenues |
273,393 |
622,594 |
97,328 |
376,443 |
15,947 |
213,882 |
361,700 |
24,888 |
(50,023) |
1,936,152 |
||||||||||
|
Segment profit2 |
161,736 |
374,192 |
43,124 |
235,132 |
3,924 |
137,117 |
292,108 |
24,015 |
877 |
1,272,225 |
||||||||||
|
Depreciation and amortisation |
|
|
|
|
|
|
|
|
|
(241,425) |
||||||||||
|
Employee profit sharing |
|
|
|
|
|
|
|
|
|
(7,866) |
||||||||||
|
Gross profit as per the income statement |
|
|
|
|
|
|
|
|
|
1,022,934 |
||||||||||
|
Capital expenditure3 |
39,050 |
27,336 |
11,308 |
37,360 |
- |
18,315 |
24,353 |
159 |
|
157,881 |
||||||||||
|
|
|
|
|
|
|
|
|
|
|
|
||||||||||
1 During 2025 all segment revenues were related to sales to Met-Mex, except in Juanicipio which includes sales to other external customers of US$6.3 million.
2 The Group's CODM primarily uses this measure to monitor the operating results directly related to the production of its business units separately to make decisions about resource allocation and performance assessment. Segment profit excluding depreciation and amortisation and employee profit sharing.
3 Capital expenditure represents the cash outflow in respect of additions to property, plant and equipment, including stripping cost, mine development and purchase of mine equipment, excluding additions relating to changes in the mine closure provision. Significant additions include the expansion of the tailings dam at Juanicipio and Saucito, mining works at Fresnillo, Saucito and San Julian, and stripping cost at Herradura mine.
4 Other inter-segment revenue corresponds to leasing services provided by Minera Bermejal, S.A. de C.V; capital expenditure mainly corresponds to exploration entities.
4 Revenues
Revenues reflect the sale of goods, being concentrates, doré, slag, precipitates and activated carbon of which the primary contents are silver, gold, lead and zinc.
(a) Revenues
|
|
Six months ended 30 June |
|
|
|
2026 |
2025 |
|
|
(in thousands of US dollars) |
|
| Revenues from contracts with customers |
3,463,582 |
1,931,534 |
| Revenues from other sources |
|
|
| Provisional pricing adjustment on products sold |
(80,959) |
4,618 |
|
|
|
|
|
|
3,382,623 |
1,936,152 |
|
|
|
|
(b) Revenues by product sold
|
|
Six months ended 30 June |
|
|
|
2026 |
2025 |
|
|
(in thousands of US dollars) |
|
| Lead concentrates (containing silver, gold, lead and by-products) |
1,774,427 |
830,678 |
| Doré and slag (containing gold, silver and by-products) |
495,883 |
379,667 |
| Zinc concentrates (containing zinc, silver and by-products) |
226,075 |
163,362 |
|
Precipitates (containing gold and silver) |
555,653 |
297,303 |
| Activated carbon (containing gold, silver and by-products) |
307,353 |
258,875 |
| Iron concentrates (containing silver, gold, lead and by-products) |
23,232 |
6,267 |
|
|
|
|
|
|
3,382,623 |
1,936,152 |
|
|
|
|
(c) Value of metal content in products sold
Invoiced revenues are derived from the value of metal content which is determined by commodity market prices and adjusted for the treatment and refining charges to be incurred by the metallurgical complex of our customer. The value of the metal content of the products sold, before treatment and refining charges is considered as an alternative performance measure for the Group. The Group considers this a useful additional measure to help understand underlying factors driving revenue in terms of volumes sold and realised prices. The value of production sold by metal is as follows:
|
|
Six months ended 30 June |
|
|
|
2026 |
2025 |
|
|
(in thousands of US dollars) |
|
| Silver |
1,842,228 |
827,671 |
| Gold |
1,321,083 |
959,834 |
| Zinc |
180,527 |
135,866 |
| Lead |
69,312 |
59,572 |
|
|
|
|
| Value of metal content in products sold |
3,413,150 |
1,982,943 |
| Refining and treatment charges1 |
(30,527) |
(46,791) |
|
|
|
|
| Total revenues2 |
3,382,623 |
1,936,152 |
|
|
|
|
1 The methodology to determine the refining and treatment charges takes into account industry benchmark charges and adjustments to reflect ore composition and transport costs, refer to note 15(b).
2 Includes provisional price adjustments which represent changes in the fair value of trade receivables resulting in a loss of US$81.0 million (2025: gain of US$4.6 million).
The average realised prices for the gold and silver content of products sold prior to the deduction of treatment and refining charges, were:
|
|
Six months ended 30 June |
|
|
|
2026 |
2025 |
|
|
(in US dollars per ounce) |
|
|
|
|
|
| Gold |
4,666.75 |
3,167.62 |
| Silver |
78.92 |
33.67 |
i. Cost of sales
|
|
Six months ended 30 June |
|
|
|
2026 |
2025 |
|
|
(in thousands of US dollars) |
|
|
Depreciation and amortisation |
214,832 |
241,425 |
|
Contractors |
192,720 |
156,108 |
|
Operating materials |
131,279 |
121,408 |
|
Maintenance and repairs |
168,509 |
134,270 |
|
Energy |
122,260 |
100,686 |
|
Personnel expenses1 |
136,281 |
112,350 |
|
Mining concession rights and contributions |
15,266 |
13,445 |
|
Mine equipment leased |
6,832 |
7,637 |
|
Surveillance |
13,113 |
9,880 |
|
Insurance |
7,229 |
6,460 |
|
IT services |
6,419 |
5,325 |
|
Freight |
3,792 |
3,350 |
|
Other2 |
18,303 |
10,465 |
|
|
|
|
|
Cost of production |
1,036,835 |
922,809 |
|
Change in work in progress and finished goods (ore inventories) |
(13,625) |
(9,591) |
|
|
|
|
|
Cost of sales |
1,023,210 |
913,218 |
|
|
|
|
1 Personnel expenses include employees' profit sharing of US$10.1 million for the six months ended 30 June 2026 (six months ended 30 June 2025: US$7.9 million).
2 Mainly include buildings cleaning and maintenance services, short-term and low value leases and communications services.
6 Finance income and finance costs
|
|
Six months ended 30 June |
|
|
|
2026 |
2025 |
|
|
(in thousands of US dollars) |
|
|
Finance income: |
|
|
| Interest on short-term deposits and investments |
51,506 |
38,481 |
| Interest on tax receivables |
1,981 |
1,787 |
| Other |
4,333 |
1,882 |
|
|
|
|
|
|
57,820 |
42,150 |
|
|
|
|
| Finance costs: |
|
|
| Interest on interest-bearing loans and notes payables |
19,685 |
19,747 |
| Interest on lease liabilities |
503 |
456 |
| Unwinding of discount on provisions |
11,198 |
10,779 |
|
Other |
1,199 |
795 |
|
|
|
|
|
|
32,585 |
31,777 |
|
|
|
|
7 Income tax expense
|
|
Six months ended 30 June |
|
|
|
2026 |
2025 |
|
|
(in thousands of US dollars) |
|
|
|
|
|
| Current corporate income tax: |
|
|
| Income tax charge |
427,837 |
263,121 |
| Amounts over provided in previous periods |
106 |
(23,049) |
|
|
|
|
|
|
427,943 |
240,072 |
|
|
|
|
|
Deferred corporate income tax: |
|
|
| Origination and reversal of temporary differences |
88,572 |
(60,839) |
| Revaluation effects of Silverstream contract |
- |
(57,017) |
|
|
|
|
|
|
88,572 |
(117,856) |
|
|
|
|
| Corporate income tax |
516,515 |
122,216 |
|
|
|
|
|
|
|
|
| Current special mining right: |
|
|
| Special mining right charge1 |
165,212 |
93,427 |
|
|
|
|
|
|
165,212 |
93,427 |
|
|
|
|
| Deferred special mining right: |
|
|
| Origination and reversal of temporary differences |
17,953 |
(22,875) |
|
|
|
|
| Special mining right |
183,165 |
70,552 |
|
|
|
|
| Income tax expense as reported in the income statement |
699,680 |
192,768 |
|
|
|
|
1 The total mining concession rights paid during the six-month period were US$17.2 million (2025: US$14.1 million) and have been recognised in the income statement within cost of sales and exploration expenses.
Tax charged within the six-month period ended 30 June 2026 has been calculated by applying the effective rate of tax which is expected to apply to the Group for the period ended 31 December 2026 using rates substantively enacted by 30 June 2026 as required by IAS 34 Interim Financial Reporting. The effective income tax rate expected for the full financial year is 23.8%, generating an income tax expense of US$516.5 million.
The effective tax rate for corporate income tax for the six months ended 30 June 2026 is 23.8% (six months ended 30 June 2025: 18.5%) and 32.3% including the special mining right (six months ended 30 June 2025: 29.2%). The main factors that decrease the effective tax rate for corporate income tax below 30% are the Special Mining Right credit (2.5)%, the foreign exchange effect on tax value of assets and liabilities (2.3)% the uplift of tax values corresponding to fixed assets (1.1)%, and the incentive for Northern Border Zone (1.8)%. The net deferred tax asset decrease to US$361.4 million (31 December 2025: net deferred tax asset of US$464.9 million) is primarily due to the increase in the value of provisional sales and the offset of tax loss carry forwards.
8 Earnings per share
Earnings per share ('EPS') is calculated by dividing profit for the period attributable to equity shareholders of the Company by the weighted average number of ordinary shares in issue during the period.
The Company has no dilutive potential ordinary shares.
For the six months ended 30 June 2026 and 30 June 2025, earnings per share have been calculated as follows:
|
|
Six months ended 30 June |
|
|
|
2026 |
2025 |
|
|
(in thousands of US dollars) |
|
|
Earnings: |
|
|
|
|
|
|
|
Profit from the period attributable to equity holders of the Company |
1,289,994 |
393,779 |
|
|
Six months ended 30 June |
|
|
|
2026 |
2025 |
|
Number of shares:
Weighted average number of ordinary shares in issue ('000) |
736,894 |
736,894 |
|
|
Six months ended 30 June |
|
|
|
2026 |
2025 |
|
Earnings per share:
Basic and diluted earnings per ordinary share (US$)
Adjusted basic and diluted earnings per ordinary share (US$)
|
1.751
1.751
|
0.534
0.715 |
As of 30 June 2026, Basic and Adjusted earnings per ordinary share are equal as a result of the termination of the Silverstream contract in August 2025. As of 30 June 2025 Adjusted earnings per share have been provided in order to provide a measure of the underlying performance of the Group, prior to the revaluation effects of the Silverstream contract, a derivative financial instrument. As of 30 June 2025, adjusted profit excluded revaluation effects of the Silverstream contract of US$190.1 million loss (US$133.0 million net of tax) amounted to US$526.8 million. As of 30 June 2025 adjusted earnings per share was calculated by dividing the adjusted profit for the period attributable to equity shareholders of the Company by the weighted average number of ordinary shares in issue during the period.
9 Property, plant and equipment
The changes in property, plant and equipment, including right-of-use assets, during the six months ended 30 June 2026 are principally additions of US$822.1 million which include US$558.3 million related to the acquisition of Probe Gold Inc as described below (six months ended 30 June 2025: US$156.7 million) and depreciation and amortisation of US$215.4 million. During the period of six months ended 30 June 2026 there was no depreciation capitalised as a part of the cost of other fixed assets (six months ended 30 June 2025: US$242.5 million, of which US$0.6 million was capitalised). Significant additions during the period include the expansion of the tailings dams at Fresnillo, Juanicipio, Saucito and Herradura, and mining works at Fresnillo, Saucito and San Julian.
As of 30 June 2026, the Group has contractual commitments related to the construction and acquisition of property, plant and equipment of US$101.7 million (30 June 2025: US$101.8 million).
Acquisition of Probe Gold
On 21 January 2026 the Company completed the acquisition of 100% of the issued and outstanding shares of Probe Gold Inc. (Probe), for a total consideration of US$564.2 million (CAD$776 million) in cash including transaction costs. The Group has applied its judgment to weigh the characteristics of Probe's acquisition and conclude whether it constitutes the acquisition of a business or a set of assets and activities under IFRS 3 "Business combinations". The Group has applied the optional concentration test outlined in the standard and on this basis, concluded that the acquisition of Probe does not constitute the acquisition of a business but the acquisition of a set of assets. Accordingly, the Company allocated the sum of consideration paid and transaction costs incurred to the fair value of identifiable assets and liabilities assumed with the remainder allocated to the mineral property acquired.
Consideration paid is summarised as follows:
|
|
US$ thousands |
|
Consideration paid in cash |
559,503 |
|
Transaction costs |
4,670 |
|
|
|
|
|
564,173 |
The identifiable assets and liabilities acquired as at the date of acquisition, inclusive of transaction costs are:
|
|
US$ thousands |
|
Cash and cash equivalents |
11,734 |
|
Other receivables |
3,367 |
|
Marketable securities |
485 |
|
Other assets |
252 |
|
Property and equipment |
558,263 |
|
|
|
|
Total assets |
574,101 |
|
Trade and other payables |
648 |
|
Lease liability |
221 |
|
Provisions |
9,059 |
|
|
|
|
Total assets acquired and liabilities assumed, net |
564,173 |
|
|
|
|
|
|
The Probe assets acquired consist primarily of the Novador advanced gold project in the region of Val d'Or in Quebec.
10 Inventories
|
|
As at 30 June 2026 |
As at 31 December 2025 |
|
|
|
(in thousands of US dollars) |
|
|
|
Finished goods1 |
75,851 |
69,704 |
|
|
Work in progress2 |
270,554 |
259,577 |
|
|
Ore stockpile3 |
7,460 |
11,087 |
|
|
Operating materials and spare parts |
183,603 |
179,001 |
|
|
|
|
|
|
|
Inventories at lower of cost and net realisable value |
537,468 |
519,369 |
|
|
Allowance for obsolete and slow-moving inventories |
(19,448) |
(16,771) |
|
|
|
|
|
|
|
Balance at lower of cost and net realisable value |
518,020 |
502,598 |
|
|
Less-Current portion |
448,260 |
432,838 |
|
|
|
|
|
|
|
Non-current portion4 |
69,760 |
69,760 |
|
|
|
|
|
|
1 Finished goods include metals contained in concentrates and doré bars, and concentrates on hand or in transit to a smelter or refinery.
2 Work in progress includes metals contained in ores on leaching pads for an amount of US$217.8 million (2025: US$218.3 million) and in stockpiles US$52.7 million (2025: US$41.3 million) that will be processed in dynamic leaching plants.
3 Ore stockpile includes ore mineral obtained at Juanicipio.
4 Non-current inventories relate to ore in leaching pads where the leaching process has stopped and is not expected to restart within twelve months. As at 30 June 2026 and 31 December 2025 non-current inventories corresponds to Soledad & Dipolos mine unit.
11 Trade and other receivables
|
|
As at 30 June 2026 |
As at 31 December 2025 |
|||
|
|
(in thousands of US dollars) |
||||
|
Trade receivables from related parties (Note 15)1 |
681,877 |
760,177 |
|||
|
Value Added Tax receivable |
46,480 |
46,419 |
|||
|
Other receivables from related parties |
966 |
1,355 |
|||
|
Other trade receivables1 |
3,530 |
6,312 |
|||
|
Other receivables |
18,362 |
16,618 |
|||
|
|
|
|
|||
|
|
751,215 |
830,881 |
|||
|
Expected credit loss of 'Other receivables' |
(284) |
(296) |
|||
|
|
|
|
|||
|
|
750,931 |
830,585 |
|||
|
Other receivables classified as non-current assets: |
|
|
|||
|
Other receivables |
397 |
411 |
|||
|
Value Added Tax receivable |
42,267 |
41,099 |
|||
|
|
|
|
|||
|
|
42,664 |
41,510 |
|||
|
|
|
|
|||
|
|
793,595 |
872,095 |
|||
|
|
|
|
|||
1 Trade receivables from related parties and other trade receivables are valued at fair value based on forward market prices.
Balances corresponding to Value Added Tax receivables and US$3.4 million within Other receivables (2025: US$3.3 million) are not financial assets.
12 Cash and cash equivalents
The Group considers cash and cash equivalents when planning its operations and in order to achieve its treasury objectives.
|
|
As at 30 June 2026 |
As at 31 December 2025 |
|
|
(in thousands of US dollars) |
|
| Cash at bank and on hand |
20,070 |
7,070 |
| Short-term deposits |
2,481,176 |
2,656,673 |
|
|
|
|
| Cash and cash equivalents |
2,501,246 |
2,663,743 |
|
|
|
|
Cash at bank earns interest at floating rates based on daily bank deposits. Short-term deposits are made for varying periods of between one day and three months, depending on the immediate cash requirements of the Group, and earn interest at the respective short-term deposit rates. Short-term deposits can be withdrawn at short notice without any penalty or loss in value.
|
|
As at 30 June 2026 |
As at 31 December 2025 |
|
|
(in thousands of US dollars) |
|
|
Short-term investments |
1,868 |
92,733 |
|
|
|
|
Short-term investments are made for fixed periods longer than three months and earn interest at fixed rates without an option for early withdrawal. As at 30 June 2026 short-term investments are held in fixed-term bank deposits of US$1.9 million (2025: US$92.7 million).
13 Dividends paid
Dividends declared and authorised by the Company are as follows:
|
|
Per share US Cents |
Amounts US$ Million |
|
Six months ended 30 June 2026 |
|
|
|
Total dividends paid during the period1 |
108.12 |
796.7 |
|
Six months ended 30 June 2025 |
|
|
|
Total dividends paid during the period2,3 |
67.9 |
500.3 |
1 Final dividend for 2025 US$108.12 cents approved at the Annual General Meeting on 19 May 2026 and paid on 29 May 2026.
2 Final dividend for 2024 US$26.1 cents approved at the Annual General Meeting on 20 May 2025 and paid on 30 May 2025.
3 Special dividend for 2024 US$41.8 cents approved at the Annual General Meeting on 20 May 2025 and paid on 30 May 2025.
A reconciliation between dividend declared, dividends recognised in retained earnings and dividend presented in the cash flow statements is as follows:
|
|
|
Six months ended 30 June |
|
|
|
|
2026 |
2025 |
|
Dividends declared and authorised |
|
796,729 |
500,351 |
|
Foreign exchange and hedging effect |
|
639 |
655 |
|
Dividends paid |
|
797,368 |
501,006 |
The directors have declared an interim dividend of US$43.4 cents per share and is not recognised as a liability as at 30 June 2026. Dividends paid from the profits generated from 1 January 2014 to residents in Mexico and to non-resident shareholders may be subject to an additional tax of up to 10%, which will be withheld by the Group.
14 Contingencies
The contingencies in the Group's annual consolidated financial statements for the year ended 31 December 2025 as published in the 2025 Annual Report, are still applicable as of 30 June 2026, with the following updates:
Regarding the 2016 tax audit of Comercializadora de Metales Fresnillo, on 12 May 2026, the SAT´s Dispute Resolution Area revoked the company tax assessment.
It is not practical to determine the amount of any potential claims or the likelihood of any unfavourable outcome arising from this or any future inspections that may be initiated).
The Directors and their external tax advisors consider management´s interpretation of the relevant legislation and assessment of taxation to be appropriate, that the Group has complied with all regulations and paid or accrued all taxes and withholdings that are applicable and that it is probable that the Group's tax position will be sustained.
Regarding the Soledad and Dipolos rulings concerning occupation agreements over land where no mineral extraction took place, in April 2025 the Agrarian Court issued an order requiring Minera Penmont to pay approximately MXP$13,300 million Pesos (US$761 million). The Company considers the order to be highly irregular, both in form and substance, as it improperly encompasses the extraction of minerals from the Dipolos Pit. Matters relating to the Dipolos Pit were previously the subject of separate judicial proceedings that have been finally determined, and those proceedings did not order the restitution of any extracted minerals.
On 19 June 2026, a Federal District Court granted an amparo in favour of Minera Penmont, setting aside the aforementioned judgment. The Court ordered that the challenged judgment dated 6 May 2025 be vacated and remanded the matter to the Agrarian Court for the issuance of a new decision. In doing so, the Court instructed the Agrarian Court, among other things, to properly assess the expert evidence, address the Company's legal arguments, and provide adequate legal reasoning for its decision.
Based on external legal advice and management's assessment of the merits of the case, the Company believes that it has strong legal grounds to support its position and, accordingly, no provision has been recognised in respect of this matter.
15 Related party balances and transactions
The Group had the following related party transactions during the six months ended 30 June 2026 and 30 June 2025 and balances as at 30 June 2026 and 31 December 2025.
Related parties are those entities owned or controlled by the ultimate controlling party, as well as those who have a minority participation in Group companies and key management personnel of the Group.
(a) Related party accounts receivable and payable
|
|
Accounts receivable |
|
Accounts payable |
||
|
|
As at 30 June 2026 |
As at 31 December 2025 |
|
As at 30 June 2026 |
As at 31 December 2025 |
|
|
(in thousands of US dollars) |
||||
|
Trade: |
|
|
|
|
|
|
Metalúrgica Met-Mex Peñoles, S.A. de C.V. |
681,877 |
760,177 |
|
- |
- |
|
Other: |
|
|
|
|
|
|
Metalúrgica Met-Mex Peñoles, S.A. de C.V. |
- |
- |
|
344 |
1,886 |
|
Servicios Administrativos Peñoles, S.A de C.V. |
- |
- |
|
8,173 |
10,688 |
|
Servicios Especializados Peñoles, S.A. de C.V. |
- |
- |
|
3,893 |
8,995 |
|
Fuentes de Energía Peñoles, S.A. de C.V. |
- |
- |
|
6,498 |
10,624 |
|
Peñoles Tecnología, S.A. de C.V. |
- |
- |
|
729 |
1,282 |
|
Eólica de Coahuila S.A. de C.V. |
- |
- |
|
3,596 |
4,076 |
|
Grupo Nacional Provincial, S.A. B. de C.V. |
758 |
995 |
|
- |
- |
|
Minera Peñoles de Chile Limitada1 |
- |
- |
|
5,928 |
- |
|
Other |
208 |
360 |
|
1,934 |
3,169 |
|
|
|
|
|
|
|
|
|
682,843 |
761,532 |
|
31,095 |
40,720 |
|
|
|
|
|
|
|
1 In June 2026, the Company entered into a Mining Option Agreement through its subsidiary Fresnillo Chile SpA with Minera Peñoles de Chile Limitada (Peñoles Chile). This Agreement allows Fresnillo to acquire a 100% interest in mining assets in Chile over a 60-month period. The Company made an initial payment of US$0.3 million and will make similar annual payments to maintain the option. A final payment of US$48.7 million is due when the option is exercised. The Agreement requires a minimum annual investment of US$10 million in exploration. The Company also agreed to reimburse Peñoles Chile US$5.9 million for their 2026 exploration costs, which will count towards the minimum investment for the year.
Related party accounts receivable and payable will be settled in cash.
(b) Principal transactions with affiliates are as follows:
|
|
|
|
|
|
|
|
|
|
|
|
|
|
Six months ended 30 June |
|||
|
|
2026 |
2025 |
||
|
|
(in thousands of US dollars) |
|||
|
Income: |
|
|
||
| Sales: |
|
|
||
| Metalúrgica Met-Mex Peñoles, S.A. de C.V.1 |
3,359,392 |
1,929,885 |
||
|
|
|
|
||
| Other income |
5,299 |
4,641 |
||
|
|
|
|
||
| Total income |
3,364,691 |
1,934,526 |
||
|
|
|
|
||
1 Invoiced revenue are derived from the value of metal content which is determined by commodity market prices and adjusted for the treatment and refining charges to be incurred by the metallurgical complex (refer to note 4(c)).
|
|
|
|
|
||
|
|
Six months ended 30 June |
|
|||
|
|
2026 |
2025 |
|
||
|
|
(in thousands of US dollars) |
|
|||
| Expenses: |
|
|
|
||
| Administrative Services: |
|
|
|
||
| Servicios Administrativos Peñoles, S.A. de C.V.1 |
26,489 |
22,367 |
|
||
| Servicios Especializados Peñoles, S.A. de C.V. 2 |
4,344 |
2,583 |
|
||
| Peñoles Tecnología, S.A. de C.V. |
1,636 |
2,438 |
|
||
|
|
|
|
|
||
|
32,469 |
27,388 |
|
|||
|
|
|
|
|
||
| Energy: |
|
|
|
||
| Fuentes de Energía Peñoles, S.A. de C.V. |
18,944 |
19,503 |
|
||
| Eólica de Coahuila, S.A. de C.V. |
23,203 |
21,215 |
|
||
|
|
|
|
|
||
|
42,147 |
40,718 |
|
|||
|
|
|
|
|
||
| Operating materials and spare parts: |
|
|
|
||
| Wideco Inc |
5,040 |
2,688 |
|
||
| Metalúrgica Met-Mex Peñoles, S.A. de C.V. |
7,926 |
7,894 |
|
||
|
|
|
|
|
||
|
12,966 |
10,582 |
|
|||
|
|
|
|
|
||
| Equipment repairs and administrative services: |
|
|
|
||
| Serviminas, S.A. de C.V. |
430 |
311 |
|
||
|
|
|
|
|
||
| Insurance premiums: |
|
|
|
||
| Grupo Nacional Provincial, S.A.B. de C.V. |
5,777 |
5,868 |
|
||
|
|
|
|
|
||
| Other expenses |
1,969 |
1,824 |
|
||
|
|
|
|
|
||
| Total expenses |
95,758 |
86,691 |
|
||
|
|
|
|
|
||
1 Includes US$0.5 million (2025: US$0.1 million) corresponding to expenses reimbursed.
2 Includes US$2.4 (2025: US$nill) relating to engineering costs that were capitalised.
(c) Compensation of key management personnel of the Group
Key management personnel include the members of the Board of Directors and the Executive Committee who receive remuneration.
|
|
Six months ended 30 June |
|
|
|
2026 |
2025 |
|
|
(in thousands of US dollars) |
|
| Salaries and bonuses |
5,373 |
4,378 |
| Post-employment pension |
225 |
197 |
| Other benefits |
300 |
230 |
|
|
|
|
| Total compensation paid to key management personnel |
5,898 |
4,805 |
|
|
|
|
16 Notes to the consolidated statement of cash flows
|
|
Notes |
Six months ended 30 June |
|
||
|
|
|
2026 |
2025 |
|
|
|
|
|
(in thousands of US dollars) |
|
||
|
Reconciliation of profit for the period to net cash generated from operating activities |
|
|
|
|
|
|
Profit for the period |
|
1,463,430 |
467,563 |
|
|
|
Adjustments to reconcile profit for the period to net cash inflows from operating activities: |
|
|
|
|
|
|
Depreciation and amortisation |
|
215,347 |
241,898 |
|
|
|
Employee profit sharing |
|
10,748 |
8,024 |
|
|
|
Deferred income tax expense/(credit) |
7 |
106,525 |
(140,731) |
|
|
|
Current income tax expense |
7 |
593,155 |
333,499 |
|
|
|
Loss on the sale of property, plant and equipment |
|
1,326 |
706 |
|
|
|
Net finance income |
|
(25,496) |
(7,407) |
|
|
|
Foreign exchange gain |
|
7,004 |
11,051 |
|
|
|
Disposal of investment in subsidiary |
|
(8,381) |
- |
|
|
|
Difference between pension contributions paid and amounts recognised in the income statement |
|
1,011 |
721 |
|
|
|
Dividends received from equity instruments at FVOCI |
|
- |
(1,752) |
|
|
|
Changes in fair value of Silverstream |
|
- |
190,055 |
|
|
|
|
|
|
|
||
|
Operating cash flow before change in working capital |
|
2,364,669 |
1,103,627 |
|
|
|
Working capital adjustments |
|
|
|
|
|
|
Decrease in trade and other receivables |
|
65,222 |
103,938 |
|
|
|
Increase in prepayments and other assets |
|
(2,257) |
(5,094) |
|
|
|
Decrease in inventories |
|
(15,421) |
(8,674) |
|
|
|
(Decrease)/Increase in trade and other payables |
|
(28,952) |
101,693 |
|
|
|
|
|
|
|
||
|
Cash generated from operations |
|
2,383,261 |
1,295,490 |
|
|
|
Income tax paid1 |
|
(872,062) |
(243,772) |
|
|
|
Employee profit sharing paid |
|
(17,892) |
(11,632) |
|
|
|
|
|
|
|
||
|
Net cash from operating activities |
|
1,493,307 |
1,040,086 |
|
|
|
|
|
|
|
||
|
|
|
|
|
|
|
1 Income tax paid includes US$667.3 million corresponding to corporate income tax (June 2025: US$177.1 million) and US$204.7 million corresponding to special mining right (June 2025: US$63.2 million), for further information refer to note 7.
17 Financial instruments
a. Classification
|
As at 30 June 2026 |
|||||||||||
|
US$ thousands |
|||||||||||
|
Financial assets: |
Amortised cost |
Fair value through OCI |
Fair value (hedging instruments) |
Fair value through profit or loss |
|
||||||
|
Trade and other receivables 1 |
19,868 |
- |
- |
681,877 |
|
||||||
|
Equity instruments at FVOCI |
- |
40,417 |
- |
- |
|
||||||
|
Financial liabilities: |
|
Amortised Cost |
Fair value (hedging instruments) |
Fair value through profit or loss |
|
||||||
|
Interest-bearing loans |
- |
840,037 |
- |
- |
|
||||||
|
Trade and other payables |
- |
193,517 |
- |
- |
|
||||||
|
Derivative financial instruments |
- |
- |
55 |
- |
|
||||||
|
|
|
|
|
|
|
|
|
||||
|
As at 31 December 2025 |
|||||||||||
|
US$ thousands |
|||||||||||
|
Financial assets: |
Amortised cost |
Fair value through OCI |
Fair value (hedging instruments) |
Fair value through profit or loss |
|
||||||
|
Trade and other receivables 1 |
21,341 |
- |
- |
760,177 |
|
||||||
|
Equity instruments at FVOCI |
- |
34,537 |
- |
- |
|
||||||
|
Derivative financial instruments |
- |
- |
103 |
- |
|
||||||
|
Financial liabilities: |
|
Amortised Cost |
Fair value (hedging instruments) |
Fair value through profit or loss |
|
||||||
|
Interest-bearing loans |
- |
839,926 |
- |
- |
|
||||||
|
Trade and other payables |
- |
241,416 |
- |
- |
|
||||||
|
Derivative financial instruments |
- |
- |
741 |
- |
|
||||||
|
|
|
|
|
|
|
|
|
||||
1 Trade and other receivables and embedded derivative within sales contracts are presented net in Trade and other receivables in the balance sheet.
b. Fair value measurement
Fair value hierarchy
The Group uses valuation techniques that are appropriate in the circumstances and for which sufficient data are available to measure fair value, maximising the use of relevant observable inputs and minimising the use of unobservable inputs.
All assets and liabilities for which fair value is measured or disclosed in the interim consolidated financial statements are categorised within the fair value hierarchy, described as follows, based on the lowest level input that is significant to the fair value measurement as a whole:
Level 1 - Quoted (unadjusted) market prices in active markets for identical assets or liabilities
Level 2 - Valuation techniques for which the lowest level input that is significant to the fair value measurement is directly or indirectly observable
Level 3 - Valuation techniques for which the lowest level input that is significant to the fair value measurement is unobservable
For assets and liabilities that are recognised in the financial statements on a recurring basis, the Group determines whether transfers have occurred between levels in the hierarchy by re-assessing categorisation (based on the lowest level input that is significant to the fair value measurement as a whole) at the end of each reporting period.
For the purpose of fair value disclosures, the Group has determined classes of assets and liabilities on the basis of the nature, characteristics and risks of the asset or liability and the level of the fair value hierarchy as explained above.
The value of financial assets and liabilities other than those measured at fair value are as follows:
|
|
Carrying amount |
Fair value |
|||||
|
|
30 June 2026 |
31 December 2025 |
30 June 2026 |
31 December 2025 |
|
||
|
|
US$ thousands |
|
|||||
|
Financial assets: |
|
|
|
|
|
||
|
Trade and other receivables |
19,868 |
21,341 |
19,868 |
21,341 |
|
||
|
Financial liabilities: |
|
|
|
|
|
||
|
Interest-bearing loans1 |
840,037 |
839,926 |
658,334 |
678,215 |
|
||
|
Trade and other payables |
193,517 |
241,416 |
193,517 |
241,416 |
|
||
|
|
|
|
|
|
|
|
|
1 Interest-bearing loans are categorised in Level 1 of the fair value hierarchy.
The carrying amounts of all other financial instruments are measured at fair value.
The financial assets and liabilities measured at fair value are categorised into the fair value hierarchy as follows:
|
As of 30 June 2026 |
|||||||
|
|
Fair value measure using |
|
|||||
|
|
Quoted prices in active markets (Level 1) |
Significant observable (Level 2) |
Significant unobservable (Level 3) |
Total |
|||
|
|
US$ thousands |
||||||
|
Financial assets: |
|
|
|
|
|||
|
Trade receivables |
|
|
681,877 |
681,877 |
|||
|
|
Derivative financial instruments: |
|
|
|
|
|
|
|
Option and forward foreign exchange contracts |
- |
- |
- |
- |
|||
|
Other financial assets: |
|
|
|
|
|||
|
Equity instruments at FVOCI |
40,417 |
|
|
40,417 |
|||
|
|
|
|
|
|
|||
|
Financial liabilities: |
|
|
|
|
|||
|
Derivative financial instruments: |
|
|
|
|
|||
|
Option and forward foreign exchange contracts |
- |
55 |
- |
55 |
|||
|
As of 31 December 2025 |
|
||||||
|
|
Fair value measure using |
|
|||||
|
|
Quoted prices in active markets (Level 1) |
Significant observable (Level 2) |
Significant unobservable (Level 3) |
Total |
|
||
|
|
US$ thousands |
|
|||||
|
Financial assets: |
|
|
|
|
|
||
|
Trade receivables |
- |
- |
760,177 |
760,177 |
|
||
|
Derivative financial instruments: |
|
|
|
|
|
||
|
Option and forward foreign exchange contracts |
- |
103 |
- |
103 |
|
||
|
Other financial assets: |
|
|
|
|
|
||
|
Equity instruments at FVOCI |
34,537 |
- |
- |
34,537 |
|
||
|
|
|
|
|
|
|
||
|
Financial liabilities: |
|
|
|
|
|
||
|
Derivative financial instruments: |
|
|
|
|
|
||
|
Option and forward foreign exchange contracts |
- |
741 |
- |
741 |
|
||
.
There have been no significant transfers between Level 1 and Level 2 of the fair value hierarchy, and no transfers into or out of Level 3 fair value measurements.
A reconciliation of the opening balance to the closing balance for Level 3 financial instruments is shown below:
|
|
2026 |
2025 |
|
|
(in thousands of US dollars) |
|
|
Balance at 1 January |
760,177 |
548,760 |
|
Sales |
3,463,581 |
1,931,388 |
|
Cash collection |
(3,460,923) |
(2,027,481) |
|
Changes in fair value |
(24,813) |
16,762 |
|
Realised embedded derivatives during the year |
(56,145) |
(11,998) |
|
Balance at 30 June |
681,877 |
457,431 |
The fair value of financial assets and liabilities is included at reflects the amount at which the instrument could be exchanged in a current transaction between willing parties, other than in a forced or liquidation sale.
Valuation techniques
The following valuation techniques were used to estimate the fair values:
Option commodity contracts
The Group enters into derivative financial instruments with various counterparties, principally financial institutions with investment grade credit ratings. The Level 2 option commodity contracts are measured based on observable spot commodity prices, the yield curves of the respective commodity as well as the commodity basis spreads between the respective commodities. The option contracts are valued using the Black-Scholes model, the significant inputs to which include observable spot commodities price, interest rates and the volatility of the commodity.
Option and forward foreign exchange contracts
The Group enters into derivative financial instruments with various counterparties, principally financial institutions with investment grade credit ratings. The Level 2 foreign currency forward contracts are measured based on observable spot exchange rates, the yield curves of the respective currencies as well as the currency basis spreads between the respective currencies. The foreign currency option contracts are valued using the Black-Scholes model, the significant inputs to which include observable spot exchange rates, interest rates and the volatility of the currency.
Equity investments
The fair value of equity investments is derived from quoted market prices in active markets.
Interest-bearing loans
The fair value of the Group's interest-bearing loan is derived from quoted market prices in active markets.
Trade receivables
Sales of concentrates, precipitates and doré bars are 'provisionally priced' and revenue is initially recognised using this provisional price and the Group's best estimate of the contained metal. Revenue is subject to final price and metal content adjustments subsequent to the date of delivery. This price exposure is considered to be an embedded derivative and therefore the entire related trade receivable is measured at fair value.
At each reporting date, the provisionally priced metal content is revalued based on the forward selling price for the quotational period stipulated in the relevant sales contract. The selling price of metals can be reliably measured as these metals are actively traded on international exchanges but the estimated metal content is a non-observable input to this valuation.
c. Capital management
The primary objective of the Group's capital management is to ensure that it maintains a strong credit rating and healthy capital ratios that support its business and maximise shareholder value. Management considers capital to consist of equity and interest-bearing loans, including loans from related parties, as disclosed in the balance sheet, excluding net unrealised gains or losses on revaluation of cash flow hedges and debt instruments. In order to ensure an appropriate return for shareholder's capital invested in the Group management thoroughly evaluates all material projects and potential acquisitions and approves them at its Executive Committee before submission to the Board for ultimate approval, where applicable. The Group's dividend policy is based on the profitability of the business and underlying growth in earnings of the Group, as well as its capital requirements and cash flows, including cash flows from the Silverstream.
One of the Group's metrics of capital is cash and other liquid assets which as at 30 June 2026 and 2025 consisted of only cash and cash equivalents.
18 Subsequent event
On June 22, 2026, Fresnillo plc entered into a Common Stock Purchase Agreement with Sinda Ltd. pursuant to which Fresnillo agreed to subscribe for common shares in connection with Sinda Ltd.'s proposed initial public offering ("IPO"). The agreement was subject to the satisfaction of various conditions precedent, including the successful completion of the IPO. As of June 30, 2026, the conditions required for closing had not yet been satisfied, no shares had been issued to Fresnillo, and no consideration had been paid. Accordingly, no asset or liability was recognised in the consolidated financial statements as of that date.
On 27 July 2026, all material conditions precedent were satisfied, and the transaction closed. As a result, Fresnillo acquired 7,939,544 common shares of Sinda Ltd for an amount of US$95.3 million in accordance with the terms of the agreement.
[1] Adjusted revenues are the revenues shown in the income statement adjusted to add back treatment and refining charges. The Company considers this is a useful additional measure to help understand underlying factors driving revenue in terms of volumes sold and realised prices.
[2] Adjusted production costs are calculated as cost of sales less depreciation, profit sharing, hedging, and change in inventories. The Company considers this a useful additional measure to help understand underlying factors driving production costs in terms of the different stages involved in the mining and plant processes, including efficiencies and inefficiencies as the case may be and other factors outside the Company's control such as cost inflation or changes in accounting criteria.
[3] Earnings before interest, taxes, depreciation and amortisation (EBITDA) is calculated as profit for the year from continuing operations before income tax, less finance income, plus finance costs, less foreign exchange gain/(loss), less revaluation effects of the Silverstream contract, less other operating income plus other operating expenses and depreciation.
[4] Adjusted production cost is calculated as total production costs less depreciation, profit sharing and the effects of exchange rate hedging.
[5] Net of cash received and transaction costs
[6] Adjusted revenue is revenue as disclosed in the income statement adjusted to exclude treatment and refining charges.
[7] Earnings before interest, taxes, depreciation and amortisation (EBITDA) is calculated as profit for the year from continuing operations before income tax, less finance income, plus finance costs, less foreign exchange gain/(loss), plus revaluation effects of the Silverstream contract, less other operating income plus other operating expenses and depreciation.
[8] Adjusted revenue is revenue as disclosed in the income statement adjusted to exclude treatment and refining charges.
[9] Treatment and refining charges include the cost of treatment and refining as well as the margin charged by the refiner.
[10] Adjusted production costs are calculated as cost of sales less depreciation, profit sharing, hedging, and change in inventories. The Company considers this a useful additional measure to help understand underlying factors driving production costs in terms of the different stages involved in the mining and plant processes, including efficiencies and inefficiencies as the case may be and other factors outside the Company's control such as cost inflation or changes in accounting criteria.
RNS may use your IP address to confirm compliance with the terms and conditions, to analyse how you engage with the information contained in this communication, and to share such analysis on an anonymised basis with others as part of our commercial services. For further information about how RNS and the London Stock Exchange use the personal data you provide us, please see our Privacy Policy.

Latest directors dealings
- 2 days ago Schroder Real Estate Investment Trust Ltd
- 2 days ago Barclays
- 2 days ago Diageo
- 2 days ago Mortgage Advice Bureau (Holdings)
- 2 days ago PZ Cussons