
Updated Feasibility Study Enhances Taronga Value
Summary by AI BETAClose X


17 August 2026
First Tin PLC
("First Tin" or "the Company")
Updated Definitive Feasibility Study Significantly Enhances Taronga Project Value
First Tin PLC, a tin development company with advanced, low-capex projects in Australia and Germany, is pleased to announce that its wholly owned subsidiary, Taronga Mines Pty Ltd ("TMPL"), has completed an updated Definitive Feasibility Study ("DFS") for its 100%-owned Taronga Tin Project in New South Wales, Australia.
The updated DFS, together with a low-risk conceptual planned Phase 2 mine life extension[1], demonstrates a substantial increase in project value, enhanced project quality and further de-risks the project through process design and permitting progress. The DFS and extension are based on conservative long-term tin price and FX assumptions[2] and highlight significant leverage to higher tin prices.
Using a long-term tin price of US$40,000/t, the updated DFS and projected conceptual Phase 2 extension delivers a combined post-tax NPV8 of A$246 million (pre-tax A$364 million), compared with A$98 million (pre-tax A$143 million) in the 2024 DFS. At the current spot tin price of US$55,675/t[3], the combined post-tax NPV8 increases to A$580 million (pre-tax A$826 million).
The initial Phase 1 development, based on Proven & Probable Reserves is contained entirely within the existing pit limits that form the basis of the current permitting envelope. The proposed Phase 2 extension incorporates recently upgraded Measured & Indicated Resources, requiring permitting in later years for continuation of mining. Further mine life extension potential exists from the conversion of Inferred Resources. Combined numbers below reflect both Phase 1 and Phase 2 development.
Highlights:
Greater Value Creation
• Combined post-tax NPV8 of A$246 million (pre-tax A$364 million) using a conservative US$40,000/t tin price, compared with A$98 million (pre-tax A$143 million) in the 2024 DFS.
• Combined post-tax IRR increased to 21% (pre-tax 25.6%).
• At the current spot tin price of US$55,675/t, combined post-tax NPV8 increases to A$580 million at a post-tax IRR of 33.7% (pre-tax A$826 million and 40.7%).
• Life of mine C1 cash cost, of A$24,575/t (US$17,203/t) of tin produced placing Taronga in the lower half of the global cost curve, potentially at or near lowest quartile.
• EBITDA margin is over 60% at current spot prices.
• Payback period of 24 months at current spot prices.
• Combined mine life increased to 13.5 years with the potential identified to further increase based on conversion of inferred resources .
• Significant leverage to higher tin prices.
• Upside potential, not included in the economic evaluation, from future recovery of copper and silver by-products, further addition to the life of mine from identified extensions to the mineralisation and resource conversion, and addition of a fine tin flotation circuit.
• Environmental permitting progressing through to final approval stages.
• Financing and off-take discussions progressing and well advanced.
Project Quality Enhanced and Derisked
• Mining strip ratio has been reduced to 0.79:1 for the existing Phase 1 mine plan, meaning more ore will be mined than waste, lowering the mining cost.
• High Pressure Grinding Rolls (HPGR) incorporated into plant design to improve robustness and long-term performance.
• Pre-production capital cost updated reflecting the inclusion of the HPGR and increased contingency, with project design remaining around proven open-pit mining methods and conventional gravity processing.
• Mine plan indicates significantly higher than average grade ore will be mined during the first 18 months, improving early cash flow and reducing risk.
Key project metrics are provided here.
|
|
DFS 2024 |
Combined P1 and P2 Extension 2026 |
|
|
Tin Price (USD/t) |
26,000 |
40,000 |
55,675 |
|
FX (AUD:USD) |
0.66 |
0.70 |
0.70 |
|
EBITDA Margin (%) |
>50% |
57% |
>60% |
|
Pre-Tax NPV8 (AUD millions) |
143 |
364 |
826 |
|
Post-Tax NPV8 (AUD millions) |
98 |
246 |
580 |
|
Pre-Tax IRR (%) |
24 |
25.6 |
40.7 |
|
Post-Tax IRR (%) |
20 |
21 |
33.7 |
|
Payback |
2.2 |
3.0 |
2.0 |
First Tin CEO, Bill Scotting, commented:
"The updated DFS marks another important milestone for Taronga and demonstrates that the project has become substantially more valuable than reflected in our 2024 study. Encouragingly, this is despite significant industry-wide inflationary pressures on capital and operating costs over the past two years, and a stronger AUD.
"This value enhancement reflects the work delivered by the team since the original DFS, including resource conversion, mine optimisation, process engineering and refinement of the project design. Together these initiatives have shown the potential for an extended mine life, increased recoverable tin and strengthened the long-term economics of the project.
"Importantly, the updated DFS and conceptual Phase 2 extension are based on a long-term tin price of US$40,000 per tonne, significantly below the current spot price, which is over US$55,000. We believe this provides an appropriately conservative basis for project evaluation while clearly illustrating the project's leverage to forecast stronger tin markets. Further upside exists from copper and silver recovery, an even longer life of mine, and the addition of fine tin flotation.
"Taronga combines several characteristics rarely found together in a development project. The shallow, outcropping orebody supports low-cost open pit mining, with a very low strip ratio, while the coarse cassiterite mineralisation enables conventional gravity processing with a relatively simple plant design.
"The location in northern NSW, Australia is exceptionally advantageous for a mine development, designated as a State Significant Development and with existing infrastructure nearby. Situated in an historic tin mining district, Taronga has received strong community and local council support through the permitting process, with only 4 objections logged. With freehold land ownership, secured water, and planned on-site renewable power generation, these advantages underpin Taronga's competitive position on the global tin cost curve.
"As a relatively low-cost project, Taronga has significant leverage to higher tin prices as shown by the combined pre- and post-tax value of phases 1 and 2 of A$826 million and A$580 million and an EBITDA margin of over 60% at the current spot tin price. Future demand growth looks set to be driven by the energy transition and digital transformation, with miniaturisation in the electronics sector fading and new demand arising from the growth of 5G, AI, solar and EV sectors. Given this strong outlook for tin demand growth, the historically low levels of inventory and modest outlook for new sources of supply, the market is expected to transition into a period of sustained supply deficit, and there is a level of conservatism in our price assumption.
"With the DFS update complete and environmental permitting progressing through the final stages, our priorities are now to complete project financing, advance Taronga towards construction and progress offtake arrangements. We believe the project is well positioned to become one of the few significant new sources of responsibly produced tin at a time when long-term demand continues to strengthen."
Summary of Updated DFS and Phase 2 Extension.
Taronga Tin Project Economics
Tin is traded on the London Metal Exchange ("LME") and Shanghai Futures Exchange ("SHFE"). The average trailing 3-month tin prices and exchange rate for different time horizons is shown in Table 1.
|
Period |
US$/t tin |
AUD:USD rate |
A$/t tin |
|
Spot (04/08/26) |
55,675 |
0.7019 |
79,320 |
|
1 year average |
44,936 |
0.6826 |
65,811 |
|
3 year average |
34,883 |
0.6638 |
52,550 |
|
5 year average |
33,230 |
0.6755 |
49,193 |
|
10 year average |
31,887 |
0.7040 |
45,294 |
Table 1: Tin price and exchange rates for different time periods
For cash flow and production scheduling purposes a price of US$40,000 per tonne has been used. This is 11% lower than the trailing 1-year average price (US$ 44,936/t) and 28% lower than the spot price of US$55,675/t on the 4th August 2026.
There is a level of conservativeness in this price forecast. Given the structural changes underway in the tin market with the positive outlook for tin demand growth, the historically low levels of inventory and modest outlook for new sources of supply, the International Tin Association ("ITA") has forecast the market to transition into a period of sustained supply deficit. As such prices will be set by the cost of marginal players, with inducement pricing also coming into play to encourage new capacity. Furthermore, the cost curve is steepening with the cost of marginal supply under pressure as global inflation drives up costs for labour, supplies and materials, tin grades continuing their declining trend, and legislative and royalty changes adding to the cost curve pressure.
Exchange rates are more difficult to predict. Accordingly, as is common practice, the spot exchange rate of AUD:USD 0.70 has been assumed, which is relatively conservative against the medium to longer term averages shown in Table 1.
The updated DFS covers the initial Phase 1 development of Taronga for which the scope and life of mine is currently limited to comply with the existing development approval application. The mine plan as currently being permitted and using current Reserves, delivers a stand-alone pre-tax NPV8 of A$292 million at a tin price of US$40,000 per tonne, double the A$143 million of the 2024 DFS. The pre-tax NPV8 increases to A$672 million at the current spot tin price of US$55,675 per tonne.
The drilling programme undertaken last year (see RNS dated 18 December 2025) led to an upgrade of the Mineral Resource Estimate ("MRE") (see RNS dated 30 April 2026). The conceptual Phase 2 takes account of this upgrade and is considered to be a low-risk extension of the mining beyond that allowed with the current permit application. As this mining extension is effectively a continuation of mining requiring a push-back of the existing pits, we do not need to permit the mine life extension until nearer the time. Therefore, we do not disrupt the planning process for the existing mine plan application and present this Phase 2 extension as a conceptual option.
Based on the updated MRE and revised geological modelling, pit optimisations were re-run using current assumptions to generate a series of optimised pit shells. Four different scenarios were modelled:
1. Maximum Cashflow Pit - Measured and Indicated Resources only
2. Maximum Cashflow Pit - Measured, Indicated and Inferred Resources
3. Maximum DCF Pit - Measured and Indicated Resources only
4. Maximum DCF Pit - Measured, Indicated and Inferred Resources
These returned the tonnes and grade within the optimised pits as shown in Table 2.
|
Scenario |
1. Max CF MI |
2. Max CF MII |
3. Max DCF MI |
4. Max DCF MII |
|
Ore Mined (Mt) |
76.3 |
101.4 |
67.7 |
74.2 |
|
Waste Mined (Mt) |
87.2 |
108.6 |
64.8 |
62.0 |
|
Strip Ratio |
1.14 |
1.07 |
0.96 |
0.84 |
|
Grade Mined (% Sn) |
0.11 |
0.10 |
0.11 |
0.11 |
|
Tin Mined (t) |
83,930 |
102,414 |
75,824 |
80,136 |
|
Recovery (%) |
56.6 |
56.3 |
57.0 |
57.0 |
|
Tin Sold (t) |
47,516 |
57,673 |
43,203 |
45,639 |
|
Total Mine Life (yrs) |
15.3 |
20.3 |
13.5 |
14.8 |
Table 2: Taronga Pit Optimisation Scenarios
These pit optimisations were then used to estimate additional mineralisation that could potentially be mined at the end of the currently planned mine life by simply subtracting the tonnages of ore, tin production and waste in the current pit design from those in the various optimised pit shells.
The estimates for mineralisation and waste remaining were then spread evenly over the revised life of mine extensions assuming a constant processing rate of 5Mt per annum and revised NPVs estimated keeping all other parameters the same. The conceptual results suggest the mine life can be extended between 4 years, (11kt additional tin) using Measured & Indicated resources only, and 11 years, (26kt additional tin) using Measured, Indicated & Inferred resources. The additional tonnes and grade as well as conceptual economics (at US$40,000/t) are shown in Table 3.
|
Scenario |
Max CF MI |
Max CF MII |
Max DCF MI |
Max DCF MII |
|
Added Ore Mined (Mt) |
28.8 |
53.9 |
20.2 |
26.7 |
|
Added Waste Mined (Mt) |
54.4 |
75.8 |
32.0 |
29.2 |
|
Added Strip Ratio |
1.89 |
1.41 |
1.58 |
1.09 |
|
Added Grade Mined (% Sn) |
0.10 |
0.09 |
0.10 |
0.09 |
|
Added Tin Mined (t) |
27,880 |
46,364 |
19,774 |
24,086 |
|
Recovery (%) |
55.1 |
55.0 |
55.8 |
56.0 |
|
Added Tin Sold (t) |
15,355 |
25,512 |
11,042 |
13,478 |
|
Added Mine Life (yrs) |
5.8 |
10.8 |
4.0 |
5.3 |
|
Added Pre-tax NPV (A$M) |
83 |
115 |
75 |
94 |
|
Total NPV (incl. base case) |
372 |
404 |
364 |
383 |
Table 3: Evaluation of Pit Optimisation Scenarios
This suggests that extensions to mine life based on the updated MRE could add between A$75 million and A$115 million to pre-tax NPV, taking Taronga's total pre-tax NPV to between A$364 million and A$404 million at a US$40,000/t tin price.
Only the conservative 4 years, (11kt additional tin) conceptual Phase 2 mine life extension has been assumed in the quoted Combined Economics with the existing Mine Plan. The extension is considered low-risk, subject to future permitting, which for continuation of what would be an operating mine is not expected to be problematic. Detailed pit designs, mine scheduling, and waste dump and tailings facilities designs will be required, but detailed engineering and construction requirements for processing will not be needed.
Including the conservative 4 years projected Phase 2 extension to the life of mine, the combined pre-tax NPV is A$364 million at a US$40,000 tin price and A$826 million at the current spot price.
Table 4 provides a summary of the financial metrics for the standalone Phase 1 and combination with the conceptual Phase 2 life of mine extension at the base price of US$40,000 per tonne and the current spot price.
|
Scenario |
Phase 1 |
Phase 1 plus Life of Mine extension |
Phase 1 |
Phase 1 plus Life of Mine extension |
|
Tin Price (US$/tonne) |
40,000 |
40,000 |
55,675 |
55,675 |
|
Pre-Tax NPV (mAUD) |
292 |
364 |
672 |
826 |
|
Post-Tax NPV (mAUD) |
190 |
246 |
463 |
580 |
|
Pre -Tax IRR (%) |
24.4% |
25.7% |
39.8% |
40.7% |
|
Post-Tax IRR (%) |
19.7% |
21.0% |
32.8% |
33.7% |
|
Payback (months) |
36 |
36 |
24 |
24 |
Table 4: Key financial metrics at different tin price assumptions
The project's NPV is sensitive to the tin price as shown in Figure 1.
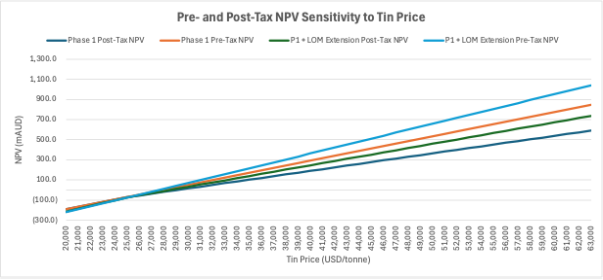
Figure 1: Pre- and Post-Tax NPV sensitivity to Tin Price
Post-tax NPV sensitivity of Phase 1 to other key inputs is shown in Figure 2.
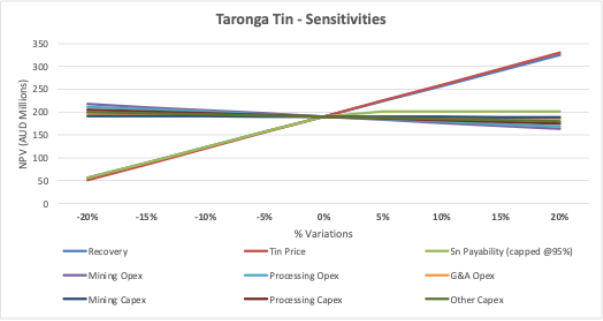
Figure 2: Phase 1 DFS Post-Tax NPV Sensitivities
Geology, Mineral Resources Estimate and Ore Reserve Estimate
The Taronga deposit consists of a series of sub-vertical sheeted quartz-mica-sulphide-cassiterite+/-topaz-flourite veins that vary from 0.1mm to 100mm (dominantly 1-10mm) in width and have an average density of 5 to >20 veins per metre.
Tin occurs dominantly (>90%) as relatively coarse cassiterite (SnO2) that averages 0.3-3mm in size, occasionally to >10mm. The cassiterite is dominantly hosted within the veins, with volumetrically insignificant, very fined grained cassiterite sometimes found in haloes to the veins.
The veins tend to occur in sets, with four main zones identified as Hillside, Hillside Extended, Payback and Payback Extended (Figure 3). The four zones appear to coalesce into a single zone in the northeast (North Pit) area.
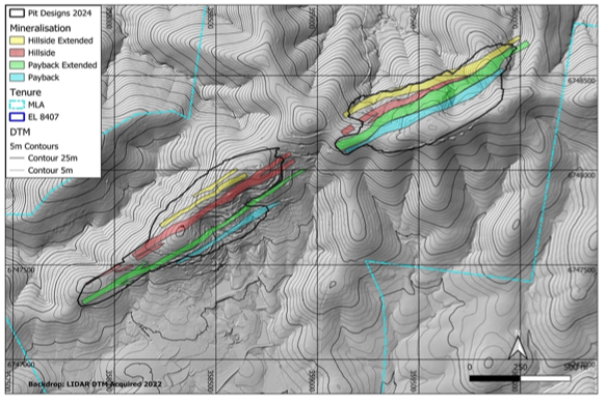
Figure 3: Taronga Tin Project Interpreted Zones of Mineralisation
TMPL commissioned H&S Consultants (H&SC) to complete a Mineral Resource update for the Taronga Tin project (see RNS dated 30 April 2026).
The Taronga database incorporates a substantial amount of drilling completed in three phases:
· 1979-1983 by Newmont primarily diamond drilling 351 holes for 35,063m and
· 2022-2023 a mix of diamond twin and geotechnical holes and Reverse Circulation (RC) exploratory drillholes completed by Taronga Mines Pty Ltd (TMPL), which consisted of 65 holes for 6,003 m.
· 2025 infill and exploration RC drilling by TMPL comprising 97 holes for 7,474m which generally targeted peripheral parts of the deposit in both the North Pit and South Pit areas identified from the 2023 drilling and estimates.
H&SC completed a database validation exercise for the Newmont drilling and considered that the Taronga database is suitable for resource estimation. All geological interpretation and grade interpolation were completed in the Taronga local grid with the resultant block model rotated to MGA94 Zone 56 national grid coordinates for further mining studies.
The updated MRE indicates the successful conversion of a significant proportion of Inferred Resources into the Measured and Indicated categories following the infill and extension drilling campaign completed in 2025. The update was previously reported at a 0.05% Sn cut-off, but based on revised economics, has been re-stated for the DFS using a 0.04% Sn cut-off by H&SC as shown in Table 5.
|
Category |
Mt |
Sn % |
Sn Kt |
Density t/m3 |
|
Measured |
41.8 |
0.13 |
52.5 |
2.72 |
|
Indicated |
54.9 |
0.09 |
49.9 |
2.73 |
|
Inferred |
60.6 |
0.08 |
45.5 |
2.74 |
|
Total |
157.3 |
0.09 |
147.8 |
2.74 |
Table 5: Taronga Updated Mineral Resource Estimate Re-stated at a 0.04% Sn Cut-off (2026)
The main change from the 2023 MRE has been the increase in the Measured and Indicated Resources, with 69% of contained tin now in these higher confidence categories. This increase reflects the reclassification of previously reported Inferred material following the infill drilling and updated geological interpretation.
The Ore Reserve estimate using a 0.05% Sn cut-off for the Taronga Tin Project is provided in Table 6 below. [see RNS dated 13 August 2026]. This is the third JORC Ore Reserve estimate that has been prepared for the Taronga deposit. It follows on from an Ore Reserve estimate prepared in conjunction with the 2024 Taronga Feasibility Study by TMPL using the 2023 MRE prepared by H&SC.
|
Category and Area |
Mt |
Sn % |
kt Sn |
|
Proved Reserves |
|
|
|
|
North Pit |
23 |
0.13 |
31 |
|
South Pit |
8 |
0.14 |
11 |
|
Total Proved Reserves |
31 |
0.13 |
41 |
|
Probable Reserves |
|
|
|
|
North Pit |
8 |
0.09 |
8 |
|
South Pit |
6 |
0.11 |
6 |
|
Total Probable Reserves |
14 |
0.10 |
14 |
|
Proved and Probable Reserves |
|
|
|
|
North Pit |
31 |
0.12 |
38 |
|
South Pit |
13 |
0.13 |
17 |
|
Total Proved and Probable Reserves |
45 |
0.12 |
55 |
Table 6: Taronga Ore Reserves Estimate[4]
Process, Plant Design and Description
The process plant is designed to treat 5.0 Mtpa of primary hard rock ore. The control philosophy incorporates a high level of automation to minimise operator intervention, while retaining the ability for manual override where required.
The crushing circuit is scheduled to operate between 6 am and 6 pm in accordance with environmental approval conditions, while the downstream concentrator operates continuously on a 24 hour per day, seven day per week basis.
The comminution circuit comprises two-stage crushing followed by high pressure grinding rolls operating in closed circuit with wet screening. Front end beneficiation is designed to maximise early cassiterite recovery and reduce the mass flow reporting to the concentrator. This includes scalping and preparation screening, followed by rougher and scavenger jigging. Jig concentrates are reground ahead of spiral concentration, while jig tailings are dewatered and rejected to the coarse tailings stream.
The concentrator flowsheet has been simplified in line with the project development strategy, adopting a single broad size fraction spiral treatment approach. MG12 spirals are utilised as the primary rougher and scavenger units, treating a nominal 20-600 µm feed. Jig concentrate and deslimed preparation screen undersize are combined and conditioned in a stabilised feed system prior to classification and spiral concentration, producing primary concentrate, middlings and final tails.
Downstream processing includes sulphide flotation, followed by concentrate thickening, pressure filtration and bagging. Tailings are treated via thickening and pressure filtration to produce a filter cake suitable for dry stack disposal.
Overall, the simplified spiral-based flowsheet delivers a material reduction in plant complexity, footprint and water demand, while maintaining metallurgical performance. The plant layout retains provision for future integration of ultrafine cassiterite recovery below 38 µm, subject to further testwork and economic justification.
The process plant design for Taronga is based on a metallurgical flowsheet designed for optimum recovery with minimum operating costs. The flowsheet is based upon unit operations that are well proven in industry.
The key criteria for equipment selection are suitability for duty, reliability and ease of maintenance. The plant layout provides ease of access to all equipment for operating and maintenance requirements whilst maintaining a compact footprint that minimises construction costs.
A simplified flow sheet is shown in Figure 4 and general mine layout in Figure 5.
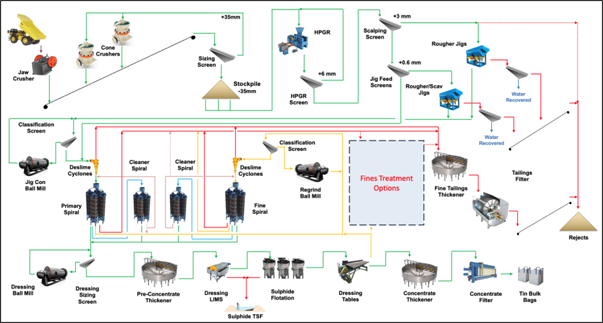
Figure 4: Simplified Taronga Flowsheet
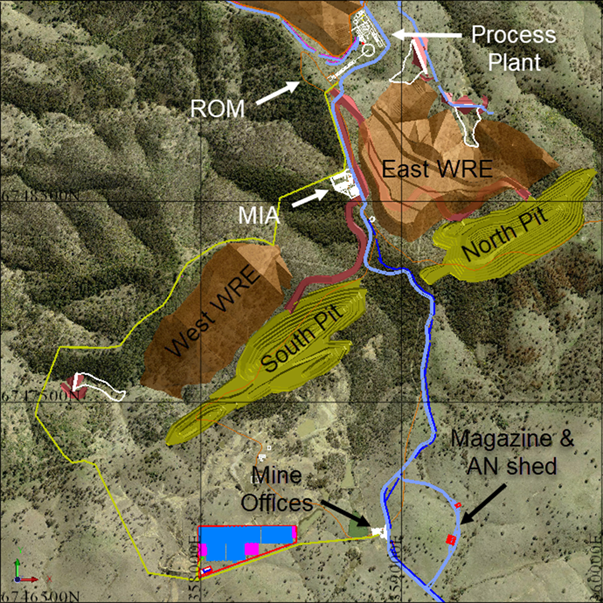
Figure 5: General Mine Layout
Capital Costs
The total pre-production capital cost estimate for the Project is A$297.2 million, comprising A$172.9 million of direct costs, A$81.0 million of indirect costs and an A$43.3 million contingency allowance (17%). The estimate covers the design, supply, construction and commissioning of the 5.0 Mt/a processing plant and its supporting infrastructure, together with the mine pre-production, tailings and co-disposal, water, behind the grid solar facility with gas generators and non-processing facilities. A summary of the pre-production capital cost is shown in Table 7.
|
Item |
A$ million |
|
Mining |
8.0 |
|
Processing |
99.7 |
|
Infrastructure (incl renewable power) |
65.2 |
|
Owners Costs |
13.8 |
|
Ops Mining Management |
6.2 |
|
First Fill & EPCM |
19.8 |
|
Other Indirect Costs |
41.2 |
|
Contingency |
43.3 |
|
TOTAL |
297.2 |
Table 7: Summary of Pre-Production Capital Costs
As the projected conceptual Phase 2 extension is a continuation of mining, the additional capital is limited to requirements for any expansion to the waste rock emplacements (WRE), co-disposal area and residue storage facility. A conservative A$10 million has been included in the economics for the extension for these.
Operating Schedule and Costs
A detailed life of mine schedule for Phase 1 was prepared based on the open cut and WRE designs (Figure 6). This schedule includes the following features:
· Processing plant ramps up over 6 months
· Mining ramps up to match the requirements of the processing plant
· ROM stockpile kept around 100kt to maintain feed supply between pit stages and a maximum size of 200kt
· Peak processing rate of 5Mtpa, peak mining rate of 9.2Mtpa
· Total mine life of 10 years
The mine schedule targets significantly higher than average grade ore to be mined during the first 18 months, improving early cash flow and reducing risk.
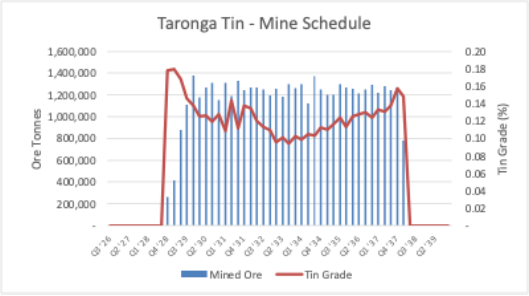
Figure 6: Taronga Tin Project Mine Schedule
Operating cost estimates for Phase 1 are shown in Table 8.
|
Area |
Total LoM cost |
Cost |
Cost |
Cost |
|
|
(AUD million) |
(AUD/t ore) |
(AUD/t Tin produced) |
(USD/t Tin produced) |
|
Mining costs |
323.5 |
7.22 |
10,350 |
7,245 |
|
Processing costs |
265.1 |
5.91 |
8,481 |
5,936 |
|
G&A costs |
68.6 |
1.53 |
2,195 |
1,537 |
|
Total Site Costs |
657.3 |
14.66 |
21,026 |
14,718 |
|
Rehabilitation |
15.0 |
0.33 |
479 |
335 |
|
Royalty |
42.9 |
0.96 |
1,373 |
961 |
|
Selling costs |
117.8 |
2.63 |
3,766 |
2,636 |
|
Total Costs |
832.9 |
18.58 |
26,644 |
18,650 |
Table 8: Summary of Phase 1 LOM Operating Cost per tonne of Tin Sold and Ore Treated
These costs are expected to place Taronga in the lower half of production costs worldwide and provide a significant cash margin at the current tin price (Figure 7). Taronga's projected full cost, including depreciation, is well below the price forecast to induce capacity.
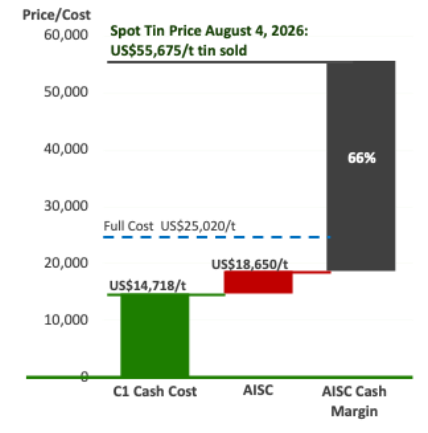
Figure 7: Phase 1 Costs and Margin per tonne at current tin price and exchange rate
Upside Potential
The preliminary pit optimisation scenarios show the potential to further extend the life of mine towards 20 years. In addition to the permitting and detailed pit designs planned for the Phase 2 extension, these scenarios require conversion of Inferred resources.
Table 9 shows the resource estimate for silver and copper mineralisation. The silver and copper mostly report to the sulphide floats that are stored in the Residue Storage Facility (RSF). The range of estimates for the concentration of these metals within the RSF is 100-200g/t Ag and 1-2% Cu, making this a valuable repository of these metals.
|
Category |
Mt |
Cu % |
Ag ppm |
Cu Kt |
Ag Mozs |
Density t/m3 |
|
Inferred |
157.3 |
0.04 |
2.6 |
66.1 |
13.3 |
2.74 |
Table 9: Silver and Copper Mineral Resource Estimate (2026)
TMPL is currently assessing technical and economic options for eventual extraction of these valuable metals.
Provision has been made in the processing plant layout for the possible addition of a fine tin circuit at a later stage to improve recoveries.
A copy of the executive summary can be found on the company website at the following link: https://firsttin.com/results-reports-presentations/
Enquiries:
|
|
|
|
First Tin |
Via SEC Newgate below |
|
Bill Scotting - Chief Executive Officer
|
|
|
Arlington Group Asset Management Limited (Financial Advisor and Joint Broker) |
|
|
Simon Catt
|
+44 (0)20 7389 5016 |
|
Tamesis Partners LLP (Joint Broker) |
+44 (0) 20 3882 2868 |
|
Richard Greenfield / Charlie Bendon |
|
|
|
|
|
Zeus Capital Limited (Joint Broker) |
+44 (0)20 3829 5000 |
|
Harry Ansell / Dan Bristowe / Katy Mitchell
|
|
|
SEC Newgate (Financial Communications) |
|
|
Elisabeth Cowell / George Esmond / Gwen Samuel |
+44 (0)7540 106366 firsttin@secnewgate.co.uk |
Notes to Editors
First Tin PLC is an ethical, reliable, and sustainable tin production company led by a team of renowned tin specialists. The Company is focused on becoming a tin supplier in conflict-free, low political risk jurisdictions through the rapid development of high value, low capex tin assets in Germany and Australia, which have been de-risked significantly, with extensive work undertaken to date.
Tin is a critical metal, vital in any plan to decarbonise and electrify the world, yet Europe and North America have very little supply. Rising demand, together with shortages, is expected to lead tin to experience sustained deficit markets for the foreseeable future.
First Tin's goal is to use best-in-class environmental standards to bring two tin mines into production in three years, providing provenance of supply to support the current global clean energy and technological revolution.
[1] Phase 1 for which the DFS has been updated is based on JORC 2012 compliant Reserves, with the life of mine limited by the basis of the current Development Application. Projected conceptual Phase 2 is a low-risk extension based on updated JORC compliant Measured & Indicated Resources and preliminary pit optimisations. Subject to permitting, detailed pit design and mine planning to enable reserve conversion, the conceptual results suggest the mine life can be extended between 4 years, (11kt additional tin) using measured & indicated resources only, and 11 years, (26kt additional tin) using measured, indicated & inferred resources. Only the conservative 4 years, (11kt additional tin) mine life extension has been assumed here.
[2] AUD:USD 0.70 assumed.
[3] Spot price: LME Bid 4th August 2026 US$55,675 per tonne.
[4] Note: The tonnes and grades shown are stated to a number of significant figures reflecting the confidence of the estimate. The table may nevertheless show apparent inconsistencies between the sum of components and the corresponding rounded totals.
RNS may use your IP address to confirm compliance with the terms and conditions, to analyse how you engage with the information contained in this communication, and to share such analysis on an anonymised basis with others as part of our commercial services. For further information about how RNS and the London Stock Exchange use the personal data you provide us, please see our Privacy Policy.

Latest directors dealings
- 4 hours ago Legal & General Group
- 5 hours ago Rathbones Group
- 5 hours ago Forterra
- 5 hours ago Mitie Group
- 5 hours ago Boku, Inc (DI) Reg S Cat 3/144A