
Final Results
Summary by AI BETAClose X

The following announcement replaces the "Final Results" announcement released on 5 October 2026 at 07:00 under RNS number 5781X. The following corrections have been made in the “Consolidated Statement of Comprehensive Income for the year ended 31 May 2026” the brackets have been removed around the reported figures for basic earnings per share and diluted earnings per share for 2026. All other details remain unchanged. The full amended text is shown below.
This announcement contains inside information for the purposes of Article 7 of the Market Abuse Regulation (EU) 596/2014 as it forms part of UK law by virtue of the European Union (Withdrawal) Act 2018 ("MAR") and is disclosed in accordance with the Company's obligations under Article 17 of MAR
5 October 2026

EnSilica plc
("EnSilica", the "Company" or the “Group”)
Final Results
Record FY26 demonstrated the scalability of EnSilica’s business model
EnSilica plc (AIM: ENSI), a leading fabless microchip maker with a growing portfolio of reusable IP, serving the Space and Communications, Photonics, Industrial, and Automotive markets, is pleased to announce its audited results for the financial year ended 31 May 2026 (“FY26”, “FY 2026” or the “Year”).
Financial Highlights:
|
|
FY26 Audited
|
FY25 Audited |
Change |
|
Total Revenue Chip Supply Revenues |
£27.8m £6.7m |
£18.2m £5.7m |
53% ↑ 16% ↑ |
|
EBITDA Net Operating Cash Flow Cash |
£5.9m* £6.2m £7.6m
|
£0.0m £2.1m £2.0m
|
£5.9m ↑ 195% ↑ 280% ↑
|
|
Lifetime Supply Visibility** |
$375m |
$250m |
50% ↑ |
|
Sales & Opportunities Pipeline*** |
$600m+ |
$400m |
50% ↑ |
* Improved from previous expectations as a result of increased tax credit included within Other income due to a higher than estimated level of qualifying R&D expenditure
** Expected lifetime supply revenues based on customer forecasts
*** Potential new business identified and pursued by the business
- Moved into profitability with a step change improvement in revenue, cash generation, sales conversion and pipeline
- In March, an over-subscribed equity fundraise raised gross proceeds of £10 million to accelerate the growing sales pipeline
- Post year end, the Company secured gross proceeds of £14.9 million in another oversubscribed equity fundraise
Commenting on FY26, CEO Ian Lankshear, said:
"This has been a record year for EnSilica. Our revenues grew 53% to £27.8 million and we generated record EBITDA of £5.9 million, delivering significant growth in our target markets. Importantly, we have evolved from a design services business into a semiconductor design and supply platform, validating the scalability of our model.
We now have five ASICs in volume production generating recurring revenue, with a further fourteen chip programmes in design which we expect to convert into long-term supply revenues over the coming years.
With a growing base of recurring revenue and a clear focus on the high-margin space and satellite communications market, we are confident that EnSilica is well positioned to sustain this momentum into FY27 and beyond."
Operational Highlights:
• Secured a $75 million automotive contract win with a German tier-one supplier, our largest automotive win to date
• Entered into two landmark development contracts with a leading European satellite operator to develop two chips for its next-generation satellite network potentially worth over $50 million from 2030 onwards
• Two tape outs completed in FY26, three tape outs completed in FY27 and a further two tape outs expected to complete in FY27
• As part of the above, the Edge AI ASIC completed production tape-out, marking a key development milestone ahead of volume production as well as releasing US$5m NRE and tape-out fee recognised across FY26 and FY27
• New Space and Communications Semiconductor Centre of Excellence opened in Milan, expanding the Company's engineering footprint in Europe
• In April, the Company began cross trading on the United States OTC market, broadening its investor base
• Five chips now in supply, with a further 14 in design and future supply expected
Outlook
• EnSilica enters FY27 with a strong order book, with more than 80% of anticipated total revenue for FY27 already visible from existing contracts, supply agreements and customer orders
• The space market is expected to grow fivefold by 2030, making it a key tailwind behind our continued growth
• Our ambition remains focussed on increasing recurring supply revenues alongside adding four to five new chip programmes each year, driving revenues towards our medium term annual target of £100m and EBITDA margins towards our 30% target
4 minute video with CEO, Ian Lankshear, discussing FY26 and future prospects
Investor Presentation
An online presentation of the annual results will be held on Tuesday, 13 October 2026 at 11.00 a.m. BST. The presentation will be hosted on the Investor Meet Company ("IMC") platform. Questions can be submitted pre-event via the IMC dashboard up until 9.00 a.m. BST the day before the meeting or at any time during the live presentation.
Investors can sign up to IMC for free and add EnSilica to attend the webcast via:
https://www.investormeetcompany.com/ensilica-plc/register-investor
Annual Report and AGM
The Company's annual report and accounts together with notice of the annual general meeting ("AGM") will be posted to shareholders this week and will be made available on the Company's website.
The Annual General Meeting will be held on 30 October 2026 at 2.00 p.m. GMT at Innovation Centre, 99 Park Drive, Milton Park, Oxfordshire OX14 4RY.
For further information please contact:
|
EnSilica plc Ian Lankshear, Chief Executive Officer Kristoff Rademan, Chief Financial Officer |
via Novella Communications +44 (0)20 3151 7008 |
|
Allenby Capital Limited (Nominated Adviser & Joint Broker) Jeremy Porter / Vivek Bhardwaj (Corporate Finance) Joscelin Pinnington / Tony Quirke (Sales & Corporate Broking)
|
+44 (0)20 3328 5656 |
|
Panmure Liberum Limited (Joint Broker) Edward Mansfield / Will King / Zak Wadud |
+44 (0)20 3100 2000
|
|
Novella Communications (Investor & Financial Public Relations) Tim Robertson / Oliver Norton |
+44 (0)20 3151 7008
|
LEI: 213800R6VXRU7MJTAF04
About EnSilica plc
EnSilica is a fabless, application-specific chipmaker, combining deep domain and system-level expertise with world-class capability in RF, mmWave, mixed-signal and complex digital IC design. The Company serves customers across the space and communications, industrial, and automotive markets, where safety, security and reliability are critical.
The Company’s growing portfolio of reusable IP and silicon platforms underpins a repeatable, scalable delivery model, which reduces development risk, cost and time to market while supporting long-term supply revenues. EnSilica has a strong track record of delivering production-proven silicon to demanding industry standards. Headquartered near Oxford, UK, the Company operates design centres across the UK, India, Brazil and Hungary.
Chairman’s Statement
The financial year to May 2026 was the year EnSilica demonstrated that its business model scales.
During the year we delivered strong growth in both revenues and EBITDA, but the more important shift is structural: EnSilica has moved from a design services business to a semiconductor design and supply platform that is generating clear results.
Producing Application Specific Integrated Circuits involves long lead times, which is why it has taken time to get to this point, but the Company is now firmly on a visible growth trajectory.
This trajectory has been further enhanced by two significant fundraisings. In March 2026 we completed an equity raise of £10 million, and since the year end, in July 2026, a second raise of approximately £14.9 million was completed. Both were oversubscribed and I would like to thank all our new and existing shareholders for their support.
The capital raised is funding the acceleration of our recurring supply revenue base, funding the expansion of our engineering capacity and strengthening EnSilica’s position across its end markets of Space and Satellite Communications, Automotive, Industrial, Photonics and Safe and Secure Silicon.
The past year has shown clear evidence of our model scaling from the growth of our recurring revenue base. We now have five ASICs in volume production, with a further fourteen chip programmes in design that will convert to long-term supply over the coming years. This combination gives the Company clear visibility of how the business will scale over the medium term, while our consistent pace of adding four to five new chip programmes each year underpins our confidence in the longer term growth outlook.
The Board recognises that a key element of our continued success rests on expanding our talent base and ensuring sound governance, and both have remained key priorities throughout the past year.
Our team increased to 204 employees during the year, including the addition of a design centre in Hungary. As we progress, continuing to expand our engineering teams across the UK, Europe, India and Brazil remains a strategic focus for EnSilica, giving us both the confidence to win new business and the engineering strength to deliver on it.
On governance, we have significantly strengthened our cybersecurity defences and increased our focus on the risks and opportunities that AI presents, and we will continue to invest in both of these areas.
Overall, this year has been a pivotal point in EnSilica's development. We are operating in rapidly expanding markets, with a growing base of contracted, recurring supply revenue, underpinning the Board's confidence in delivering further growth, both in the current year and beyond.
Mark Hodgkins
Executive Chair
Chief Executive's Strategic Review
I am pleased to present the Strategic Review for EnSilica plc for the financial year ended 31 May 2026.
FY26 was a record year for EnSilica. Revenues grew 53% to £27.8 million (FY25: £18.2 million) and EBITDA rose to £5.9 million (FY25: £nil), with profitability restored and growth delivered across each of our core markets. Both halves of the year contributed, with the second half the stronger of the two.
More significant than the headline numbers are what sits behind them. EnSilica has moved decisively from a design services business to a semiconductor design-and-supply platform. We now have five ASICs in volume production generating recurring silicon revenue, with a further fourteen chip programmes in design that will convert into recurring supply revenues over the coming years. Lifetime supply visibility, which is the total expected supply revenue already secured under customer contracts, increased 50% during the year to $375 million.
Trading
Recurring supply revenue grew to £6.7 million (FY25: £5.7 million) while the underlying programmes all continue to move towards supply.
|
5 Chips in supply shipping in volume today |
14 Chips in design future supply expected |
4-5 New contracts a year design-and-supply target
|
Our new business pipeline grew 50% to over $600 million, and it did so after $125 million of opportunities converted out of the pipeline and into contracted supply. That combination of conversion and replenishment is the clearest evidence that our market position is strengthening.
The balance sheet was materially strengthened during the year by an oversubscribed £10 million equity raise in March 2026, taking year-end cash to £7.6 million (31 May 2025: £2.0 million); with that capital directly enabling contract wins with an aggregate expected lifetime value of up to $175 million.
Since the year end, we have gone further. In July 2026 we completed a second, oversubscribed equity raise of approximately £14.9 million. The proceeds are being used to accelerate our Satellite Communications ASSP development, strengthen our engineering capacity for our growing satellite communications payload ASIC and photonics controller programmes, and provide additional working capital. The capital is already at work. Two opportunities identified during the July fundraise have been closed: €1.1 million of follow-on orders for our satellite communications ASSP; and a €1.7 million second-phase satellite payload ASIC contract.
EnSilica’s Business Model and Strategic Evolution
EnSilica operates a fabless semiconductor model, providing an end-to-end solution spanning specification, design, qualification, manufacture and volume supply of Integrated Circuits. We focus on the value-add of customising silicon for our customers while outsourcing the capital-intensive fabrication process to leading foundry partners.
We secure upfront payment for Non-Recurring Engineering (NRE) work and, where appropriate, co-invest in chip development in return for high-margin supply or royalty revenues once a device reaches production. This embeds EnSilica in the customer's product for its entire lifetime, typically seven to ten years and longer in automotive and industrial applications, and converts one-off engineering income into a compounding stream of silicon supply revenue.
FY26 is the year that model began to pay. Five ASICs are now in volume supply, our supply-only proposition has matured into a repeatable offering, and supply revenue is set to take an increasing share of the mix as each programme moves into volume production. Every additional programme that reaches production adds wafer volume, margin and operational leverage without a proportionate increase in cost.
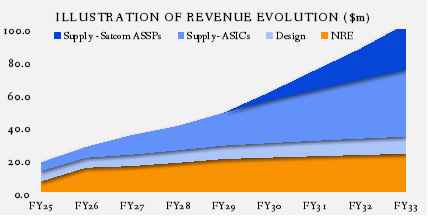
* Revenue evolution chart above is illustrative and should not be taken as a forecast. Actual revenues may differ.
Our growth strategy is unchanged:
‣ Leveraging our IP in all addressable markets.
‣ Scaling the fabless design-and-supply model so that every design win converts into long-life silicon supply, targeting four to five new design-and-supply contracts each year.
‣ Capitalising on demand for custom edge AI and hardened post-quantum cyber security, which is driving the re-design of a generation of industrial, automotive and satellite communications chips.
‣ Developing Application Specific Standard Parts (ASSPs) that can be sold to multiple customers, so that each design adds to a re-usable IP pool rather than serving a single programme.
Our Markets
The global semiconductor market continues to expand towards a projected $1 trillion of annual sales by 2030. The ASIC segment represents around 5% of that total and is concentrated in markets that are either emerging or undergoing fundamental technology change, precisely where custom silicon displaces standard parts. One core capability serves all of our markets, which diversifies both our revenue and our risk.
We are focused on four high-growth verticals, underpinned by a further capability, safe and secure silicon, that is increasingly a requirement in all of them. Market sizes quoted below reflect management analysis of third-party market data:
‣ Space and Satellite Communications: Our leading growth opportunity. The SatCom market is forecast to grow from $98 billion to $223 billion between 2025 and 2033, an 11% compound annual growth rate.
Demand is driven by sovereign and resilient connectivity requirements, falling launch costs enabling mega-constellations, and substantial government and private capital inflows. The most important dynamic for EnSilica sits within that market: on our analysis the serviceable silicon opportunity in user terminals, scales around fivefold between 2025 and 2030 to over $3 billion, as the sector moves from initial deployments today, through a deployment and testing phase around 2028, to mass adoption by 2030.
Terminal volumes, not satellite volumes, are what turn satellite connectivity into a high-volume silicon market, and terminal silicon is where our IP is concentrated. We are therefore developing a family of SatCom Application Specific Standard Parts, funded in part by the July 2026 raise, so that a single chipset can be sold to multiple operators and integrators rather than being tied to one customer programme.
Our work is supported by the European and UK Space Agencies and is beginning to attract customer-funded follow on engagements. In addition our position in payload silicon, established through our selection by AST SpaceMobile, has strengthened further following consolidation among payload suppliers, leaving EnSilica as the key independent European supplier in this domain.
‣ Automotive: Forecast to grow from $77 billion to $137 billion between 2025 and 2030, an 11% compound annual growth rate, driven by electrification, advanced driver assistance and the shift to zonal, software-defined vehicle architectures. This is our longest-established market and the one in which our delivery record is deepest, with over 10 million automotive ASICs shipped and ASIL-compliant functional safety design flows embedded in our design process. During the year we secured a strategically important $75 million supply programme with a European Tier 1 supplier, our largest automotive win to date, which underpins our position as a supplier of safety-critical, long-life silicon to this sector.
‣ Industrial: Forecast to grow from $99 billion to $137 billion between 2025 and 2030, a 7% compound annual growth rate, driven by automation, robotics and smart sensing. Our relationship with Siemens, the leading European industrial OEM, underpins our position as a supplier of high-integrity digital and mixed-signal ASICs to this sector.
‣ Photonics: The newest of our verticals and, on a five-year view, potentially the most significant growth area. It is forecast to grow from $15-20 billion in 2025 to $86-96 billion by 2034, a 20% compound annual growth rate (Fortune Business Insights, May 2026), driven by AI training clusters, hyperscale data centres and telecom networks hitting the power and bandwidth limits of electrical interconnect and move to optical. Photonic engines do not work without electronic control silicon alongside them, and that control ASIC, high-speed mixed-signal, thermally stable and tightly co-designed with the photonics, is precisely the class of device EnSilica builds.
Our anchor engagement is with Oriole Networks Ltd, who selected EnSilica as its ASIC partner in 2024. On 8 June 2026 Oriole announced the deployment of the world's first large-scale AI system running on a pure photonic network. Being the ASIC partner on such a high-profile programme will be helpful in growing our market share as AI infrastructure investment expands. Up to £2.0 million of the July 2026 fundraise will be allocated to additional photonics engineering capacity.
‣ Safe and secure silicon: Legislation including the EU Cyber Resilience Act is raising the minimum-security baseline required of every semiconductor device, not only connected ones. EnSilica owns the core IP that makes secure-by-design silicon possible: classical and post-quantum cryptography accelerators. We combine these with licensed third-party RISC-V CHERI controllers, which offer hardware-enforced memory safety, and with our own functional safety design flows, to deliver a re-usable secure platform.
This turns a regulatory obligation for our customers into a commercial advantage for us.
Operations, Capability and People
Our team grew to 204 during the year, across design centres in the UK, India, Brazil and Hungary, following the acquisition of a Budapest design team that adds depth in automotive and industrial markets. EnSilica is now Europe's largest independent commercial fabless ASIC company and one of only four European members of the TSMC Design Centre Alliance, giving us a direct path from advanced-node design to volume supply and, with our growing re-usable IP portfolio, the credibility to win against far larger competitors.
Delivery quality remains the foundation of the business: over 10 million automotive ASICs have been shipped, with the demonstrable safety and long-life supply disciplines that our industrial and space customers require.
We also invest in the talent pipeline that the industry as a whole depends on. EnSilica supports Tiny Tapeout, the initiative that gives students, academics and early-career engineers the opportunity to see their own designs fabricated on real silicon, and we run graduate and internship programmes alongside university partnerships in both the UK and Brazil. Semiconductor design capability cannot be recruited at short notice; it has to be grown, and building that capability in the regions where our design centres sit is a long-term investment in our own capacity as much as a contribution to the sector.
Outlook
We entered FY27 with around 80% of anticipated revenue already covered by existing contracts, supply agreements and customer orders. We are therefore pleased to re-confirm market guidance of £32 million to £34 million in revenues and EBITDA of £5.5 million to £6.5 million for the year ending 31 May 2027.
Beyond FY27, the fourteen chip programmes currently in design will reach volume production, joined by the four to five new design-and-supply wins we target each year. The convergence of terrestrial and non-terrestrial communications, the drive for resilient and sovereign infrastructure, and tightening security legislation are all structural rather than cyclical, and all play to our strengths. We will continue to invest in R&D in post-quantum cryptography and satellite communications technology, with continued support from the UK Space Agency and the European Space Agency.
We are progressing well in our mission to being recognised as a leading European fabless chip supplier, and we have never had a stronger pipeline of opportunity.
Ian Lankshear
Chief Executive Officer
Chief Financial Officer’s Review
FY26 has been an excellent year for the Group achieving record levels of revenue and EBITDA, completing a successful £10m equity fundraise and delivering strong growth in both lifetime supply volumes from existing customers, and our new business sales pipeline.
Space and communications remains a major growth area for the long term success of the Group, and the key contracts won during the year have enhanced the Group’s position within the global space and satellite market.
EnSilica will continue to target entering into four to five significant new customer design and supply contracts each year, with a focus on space and communications, alongside other key areas like Photonics, Edge AI and Quantum Computing. While growth of chip supply revenues over time is the Group’s primary strategic focus, the consultancy division remains an integral part of the business model, with the Group relying on this income stream to achieve profitability.
The 53% increase in revenues to £27.8 million was primarily driven by a more than doubling of NRE design revenues alongside double digit growth in supply revenues. Group revenue growth also reflects our progress towards our aim of becoming the European 'fabless' semiconductor company of choice for the development and supply of ASICs in space and communications, industrial and automotive applications.
The Group generated £4.9 million of cash from operations, which was supported by an equity raise of £10.0 million (£9.5 million net) and a research and development tax credit (RDEC) of £1.3 million. Cash consumption for the full year was £1.4 million, compared to a cash consumption of £5.3 million in FY25. In conjunction with its customers, the Group continues to co-invest in the development of customer ASICs as well as its own IP and know-how. Alongside the significant increase in NRE design revenues, the Group invested £6.5 million in ASIC design and supply contracts and IP assets with the expectation of achieving future supply or royalty revenue as a result of this investment. During FY26, £6.7 million of revenues from chip supply and royalties were achieved with further growth expected from existing chips in supply as well as contracted chips in development.
Financial Results
A summary of the key financial results for the year is set out in the table below:
|
|
FY 2026 £’m |
FY 2025 £’m |
|
Revenue |
27.8 |
18.2 |
|
Cost of goods |
(18.2) |
(10.9) |
|
Gross profit |
9.6 |
7.3 |
|
Gross margin |
35% |
40% |
|
Other income |
4.2 |
1.6 |
|
Expected credit loss allowance |
- |
(1.8) |
|
Operating expenses |
(7.9) |
(7.1) |
|
EBITDA |
5.9 |
- |
|
Depreciation & amortisation |
(3.0) |
(1.7) |
|
Impairment of assets |
- |
(0.9) |
|
Operating profit/(loss) |
2.9 |
(2.6) |
|
Interest |
(0.7) |
(0.9) |
|
Profit/(loss) before tax |
2.2 |
(3.5) |
|
Tax |
(1.0) |
0.8 |
|
Profit/(loss) for the year |
1.2 |
(2.7) |
Revenues
The Group's revenues for FY26 were £27.8 million, representing a 53% increase over FY25 revenues of £18.2 million, with the growth driven largely by a 155% increase in NRE design revenues and a 16% increase in supply revenues.
The increase in NRE design revenues was largely driven by the six new ASIC development and supply agreements signed in FY25, along with the new contracts started off in FY26.
Growth in chip supply revenues was more subdued than the prior year due to the negative impact of the cybersecurity issue within an automotive customer's supply chain which was previously disclosed but still managed a very respectable 16% double digit growth. FY27 is expected to see further significant growth in chip supply revenues.
The large increase in FY26 revenues has ensured that the Group has returned to double digit cumulative annual growth and made further significant progress towards its vision of becoming a profitable 'fabless' semiconductor business.
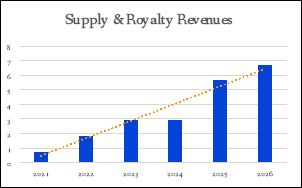
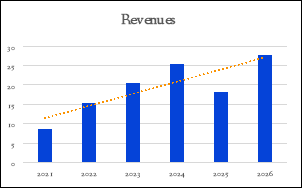
Gross margins in FY26 have decreased by five percentage points from 40% to 35% due to increased development costs of projects for which a large portion of the related grant income was required to be included in Other income rather than Revenues.
Margins are expected to remain stable in FY27 with improved margins from higher chip supply revenues offset by increased activities on grant related development projects.
Other Income
Other income includes income received from the C-LEO UKSA modem grant of £1.7 million, as well as the RDEC tax credit of £2.5 million.
Operating Expenses
Operating expenses were 11% higher, increasing due to operational cost investments made within IT, Quality, Supply chain and facilities as a result of the increased activities of the Group alongside increased revenues.
EBITDA
As a result of the significant increases in revenues and other income partly offset by the expected increases in cost of goods and operational expenses, EBITDA increased to £5.9 million from £nil million in FY25.
Profit After Tax
Interest expense decreased to £0.7 million (FY25: £0.9 million) due to the repayment of loans and lease liabilities whilst taxation increased to an expense of £1.0 million due to deferred tax timing differences and the tax due on the RDEC tax credit.
The net impact of the above is a profit after tax of £1.2 million, £3.9 million higher than the prior year.
Headcount
|
|
31 May 2026 |
31 May 2025 |
31 May 2024 |
|
|
|
|
|
|
Administration |
20 |
17 |
16 |
|
Sales & Marketing |
6 |
6 |
6 |
|
Research, Development & Technical |
172 |
156 |
146 |
|
Average number of employees |
198 |
179 |
168 |
Average Group headcount increased by 11% or 19 employees, reflecting the recruitment of employees to support the increased commercial activities of the Group seen over the last financial year.
Balance sheet
A summary of the balance sheet is set out in the table below:
|
|
31 May 2026 £'m |
31 May 2025 £'m |
|
|
|
|
|
Cash & Equivalents |
7.6 |
2.0 |
|
Intangible Assets |
27.3 |
22.8 |
|
Fixed Assets |
3.5 |
3.4 |
|
Trade & other receivables |
13.9 |
10.1 |
|
Trade & other payables |
(16.6) |
(10.5) |
|
Lease liabilities |
(2.4) |
(2.7) |
|
Loans |
(4.4) |
(5.3) |
The most notable items on the balance sheet as at 31 May 2026 are:
‣ Cash and cash equivalents have increased from £2.0 million to £7.6 million, as a result of the movements described in the cash flow section below.
‣ Fixed assets have increased mainly as a result of an investment in leased offices and IT and Office equipment under IFRS16, offset by the depreciation charge incurred of £0.9 million.
‣ Intangible assets have increased from £22.8 million to £27.3 million at the end of FY26 mainly as a result of the Group co-investing £6.5 million in the development of customer ASICs as well as its own IP and know-how, offset by amortisation of £2.0 million.
‣ Lease liabilities have decreased as a result of capital repayments made during the year. Partially offset by office leases and leases for IT equipment entered into during the year.
‣ As a result of £1.0 million of repayments, bank loans have decreased from £5.3 million at 31 May 2025 to £4.4 million as at 31 May 2026.
Cash Flow
|
|
FY2026 £’m |
FY2025 £’m |
|
EBITDA |
5.9 |
- |
|
Working capital |
(1.0) |
0.9 |
|
Tax received |
1.3 |
1.2 |
|
Net cash flow from operations |
6.2 |
2.1 |
|
Investment in intangibles |
(6.5) |
(5.8) |
|
Capital expenditure |
(0.5) |
(0.7) |
|
Interest paid |
(0.6) |
(0.9) |
|
Cash consumption |
(1.4) |
(5.3) |
|
Loans received |
- |
5.7 |
|
Share issues |
9.5 |
1.2 |
|
Loan and lease payments |
(2.2) |
(4.7) |
|
Movement in the year |
(5.9) |
(3.1) |
The Group generated a much improved EBITDA of £5.9 million, and together with negative working capital movements of £1.0 million and an R&D tax receipt of £1.3 million, generated net cash flow from operations of £6.2 million. £6.5 million was co-invested by the Company in the development of customer ASICs, as well as its own IP and know-how.
The Company incurred capital expenditure of £0.5 million on IT & Office equipment. Net interest paid on loans and leasehold property liabilities amounted to £0.6 million, driven by lower liability balances and interest charges on the Bank of Scotland loan. Cash consumption was £1.4 million, £3.9 million better than the prior year, with the improvements largely driven by the increased revenues and EBITDA generated by the Group.
Cash consumption, together with the net proceeds of an oversubscribed £9.5 million equity fundraise in March 2026, and offset by loans and lease liabilities repaid during the year of £2.2 million resulted in a positive cash flow movement in the year of £5.9 million (£3.1 million negative in FY25).
Financial Outlook
The Group expects FY27 revenues of approximately £32 million to £34 million with revenues for the year being second-half weighted.
The Group currently has good visibility over FY27 revenues with more than 80% coming from contracted customers or contracts in negotiation, and the remainder to be earned from new contract wins with identified customers.
EnSilica also expects to achieve an EBITDA of between £5.5 million and £6.5 million in FY27. Gross margins are expected to remain stable in FY27. Some increases in operating expenses are expected as the Group expands its operations to be able to serve current and expected customer needs.
Post Balance Sheet Events
Post year end, the Company announced that it had raised gross proceeds of £14.9 million (net £14.2 million) in July 2026 through an oversubscribed equity fundraise of 16,358,184 new ordinary shares at 91 pence per share.
Kristoff Rademan
Chief Financial Officer
Financial Statements
Consolidated Statement of Comprehensive Income
for the year ended 31 May 2026
|
|
|
|
|
2026 |
2025 |
|
|
|
|
|
Audited |
Audited |
|
|
Note |
|
|
£'000 |
£'000 |
|
Revenue |
2 |
|
|
27,807 |
18,183 |
|
Cost of sales |
|
|
|
(18,211) |
(10,850) |
|
Gross profit |
|
|
|
9,596 |
7,333 |
|
Other operating income |
|
|
|
4,157 |
1,623 |
|
Impairment of assets |
6,7 |
|
|
- |
(910) |
|
Expected credit loss allowance |
|
|
|
- |
(1,783) |
|
Administrative expenses |
|
|
|
(10,844) |
(8,893) |
|
Operating profit/(loss) |
|
|
|
2,909 |
(2,630) |
|
|
|
|
|
|
|
|
Interest income |
|
|
|
27 |
- |
|
Interest expense |
|
|
|
(677) |
(907) |
|
Profit/(loss) before taxation
|
|
|
|
2,259 |
(3,537) |
|
Taxation |
4 |
|
|
(1,021) |
811 |
|
|
|
|
|
|
|
|
Profit/(loss) for the year |
|
|
|
1,238 |
(2,726) |
|
|
|
|
|
|
|
|
|
|
|
|
|
|
|
Other comprehensive (expense)/ income for the year |
|
|
|
|
|
|
Currency translation differences |
|
|
|
(176) |
49 |
|
|
|
|
|
|
|
|
Total comprehensive loss for the period |
|
|
|
1,062 |
(2,677) |
|
|
|
|
|
|
|
|
Profit/(loss) for the year attributable to: |
|
|
|
|
|
|
Owners of the company |
|
|
|
1,238 |
(2,726) |
|
Non-controlling interests |
|
|
|
- |
- |
|
|
|
|
|
1,238 |
(2,726) |
|
Total comprehensive income/(expense) for the year attributable to: |
|
|
|
|
|
|
Owners of the company |
|
|
|
1,062 |
(2,677) |
|
Non-controlling interests |
|
|
|
- |
- |
|
|
|
|
|
1,062 |
(2,677) |
Financial Statements
Earnings per Share Attributable to the Owners of the Parent During the Period (expressed in pence per share)
|
|
|
|
|
|
|
|
|
|
|
|
2026 |
2025 |
|
|
|
|
|
Audited |
Audited |
|
|
Note |
|
|
pence |
pence |
|
|
|
|
|
|
|
|
Basic earnings per share (pence) |
5 |
|
|
1.23 |
(3.26) |
|
Diluted earnings per share (pence) |
5 |
|
|
1.23 |
(3.26) |
Financial Statements
Consolidated Statement of Financial Position
As at 31 May 2026
|
|
|
|
|
|
| |
|
|
|
|
|
2026 Audited |
2025 Audited | |
|
|
Note |
|
|
£'000 |
£'000 | |
|
Assets |
|
|
|
|
| |
|
Non-current assets |
|
|
|
|
| |
|
Property, plant and equipment |
6 |
|
|
3,491 |
3,373 | |
|
Intangible assets |
7 |
|
|
27,301 |
22,828 | |
|
Total non-current assets |
|
|
|
30,792 |
26,201 | |
|
|
|
|
|
|
| |
|
Current assets |
|
|
|
|
| |
|
Inventories |
|
|
|
1,725 |
439 | |
|
Trade and other receivables |
8 |
|
|
13,866 |
10,107 | |
|
Corporation tax recoverable |
|
|
|
2,189 |
1,363 | |
|
Cash and cash equivalents |
|
|
|
7,560 |
1,963 | |
|
Total current assets |
|
|
|
25,340 |
13,872 | |
|
Total assets |
|
|
|
56,132 |
40,073 | |
|
|
|
|
|
|
| |
|
Current liabilities |
|
|
|
|
| |
|
Borrowings |
9 |
|
|
(3,941) |
(3,862) | |
|
Lease liabilities |
|
|
|
(600) |
(571) | |
|
Trade and other payables |
10 |
|
|
(16,619) |
(10,492) | |
|
Total current liabilities |
|
|
|
(21,160) |
(14,925) | |
|
|
|
|
|
|
| |
|
Non-current liabilities |
|
|
|
|
| |
|
Borrowings |
9 |
|
|
(473) |
(1,422) | |
|
Lease liabilities |
|
|
|
(1,845) |
(2,126) | |
|
Provisions |
|
|
|
(211) |
(235) | |
|
Deferred tax |
|
|
|
(1,004) |
(466) | |
|
Total non-current liabilities |
|
|
|
(3,533) |
(4,249) | |
|
|
|
|
|
|
| |
|
Total liabilities |
|
|
|
(24,693) |
(19,174) | |
|
|
|
|
|
|
| |
|
Net assets |
|
|
|
31,439 |
20,900 | |
|
|
|
|
|
|
| |
|
Equity |
|
|
|
|
| |
|
Issued share capital |
11 |
|
|
177 |
156 | |
|
Share premium account |
|
|
|
25,566 |
16,181 | |
|
Currency differences reserve |
|
|
|
(283) |
(107) | |
|
Retained earnings |
|
|
|
5,979 |
4,670 | |
|
Equity attributable to owners of the Company |
|
|
|
31,439 |
20,900 | |
|
Non-controlling interests |
|
|
|
- |
- | |
|
Total equity |
|
|
|
31,439 |
20,900 | |
|
|
|
|
|
|
|
|
The notes are an integral part of these condensed financial statements.
|
Ian Lankshear |
Kristoff Rademan |
|
CEO |
CFO |
|
EnSilica plc |
EnSilica plc |
Financial Statements
Condensed Consolidated Statement of Changes in Equity
|
|
|
|
Share Capital |
Share premium account |
Currency translation reserve |
Retained earnings |
Total equity |
|
|
|
|
£’000 |
£’000 |
£’000 |
£’000 |
£’000 |
|
At 1 Jun 2024 |
|
|
153 |
14,957 |
(117) |
7,410 |
22,403 |
|
Loss for the period |
|
|
- |
- |
- |
(2,725) |
(2,725) |
|
Other comprehensive expense |
|
|
- |
- |
10 |
(275) |
(265) |
|
Total comprehensive (expense)/income for the period |
|
|
- |
- |
10 |
(3,000) |
(2,990) |
|
Share based payment |
|
|
- |
- |
- |
260 |
260 |
|
Issue of share capital |
|
|
3 |
1,408 |
- |
- |
1,411 |
|
Cost of share issue |
|
|
- |
(184) |
- |
- |
(184) |
|
At 31 May 2025 |
|
|
156 |
16,181 |
(107) |
4,670 |
20,900 |
|
Profit for the period |
|
|
- |
- |
- |
1,238 |
1,238 |
|
Other comprehensive expense |
|
|
- |
- |
(176) |
- |
(176) |
|
Total comprehensive expense for the period |
|
|
- |
- |
(176) |
1,238 |
1,062 |
|
Share based payment |
|
|
- |
- |
- |
71 |
71 |
|
Issue of share capital |
|
|
21 |
9,979 |
- |
- |
10,000 |
|
Cost of share issue |
|
|
- |
(594) |
- |
- |
(594) |
|
At 31 May 2026 |
|
|
177 |
25,566 |
(283) |
5,979 |
31,439 |
Financial Statements
Consolidated Statement of Cash Flows
for the year ended 31 May 2026
|
|
Note |
|
|
2026 Audited |
2025 Audited |
|
|
|
|
|
£'000 |
£'000 |
|
Cash flows from operating activities |
|
|
|
|
|
|
Cash generated from operations |
A |
|
|
4,925 |
933 |
|
Tax received |
|
|
|
1,278 |
1,177 |
|
Net cash generated from operating activities |
|
|
|
6,203 |
2,110 |
|
|
|
|
|
|
|
|
Cash flows from investing activities |
|
|
|
|
|
|
Purchase of property, plant and equipment |
|
|
|
(461) |
(681) |
|
Additions to intangible assets |
|
|
|
(6,454) |
(5,797) |
|
Interest received |
|
|
|
27 |
- |
|
Net cash used in investing activities |
|
|
|
(6,888) |
(6,478) |
|
|
|
|
|
|
|
|
Cash flows from financing activities |
|
|
|
|
|
|
Proceeds from issuance of ordinary shares |
|
|
|
9,456 |
1,228 |
|
Interest paid |
|
|
|
(659) |
(908) |
|
Lease liability payments |
|
|
|
(1,287) |
(309) |
|
Loans and borrowings received |
|
|
|
- |
5,710 |
|
Loans and borrowing repaid |
|
|
|
(967) |
(4,436) |
|
Net cash generated from financing activities |
|
|
|
6,543 |
1,285 |
|
|
|
|
|
|
|
|
Net increase/(decrease) in cash and cash equivalents |
|
|
|
5,858 |
(3,083) |
|
Cash and cash equivalents at beginning of year |
|
|
|
1,963 |
5,156 |
|
Foreign exchange losses |
|
|
|
(261) |
(110) |
|
Cash and cash equivalents at end of period |
B |
|
|
7,560 |
1,963 |
Financial Statements
Notes to the Consolidated Statement of Cash Flows
for the year ended 31 May 2026
A. Cash generated from operations
The reconciliation of profit for the year to cash generated from operations is set out below:
|
|
|
|
2026 |
2025 | ||||
|
|
|
|
£'000 |
£'000 | ||||
|
Profit/(loss) for the year |
|
|
1,238 |
(2,726) | ||||
|
Adjustments for: |
|
|
|
| ||||
|
Depreciation |
|
|
908 |
633 | ||||
|
Amortisation of intangible assets |
|
|
1,979 |
1,038 | ||||
|
Impairment of assets |
|
|
97 |
910 | ||||
|
Share based payments |
|
|
71 |
261 | ||||
|
Net interest costs |
|
|
650 |
908 | ||||
|
Research and development expenditure credit (Other income) |
|
|
(2,488) |
(1,278) | ||||
|
Tax charge/(credit) |
|
|
1,021 |
(811) | ||||
|
|
|
|
3,476 |
(1,065) | ||||
|
Changes in working capital |
|
|
|
| ||||
|
(Increase)/decrease in inventories |
|
|
(1,287) |
313 | ||||
|
Increase in trade and other receivables |
|
|
(3,754) |
(1,718) | ||||
|
Increase in trade and other payables |
|
|
6,128 |
3,373 | ||||
|
Increase in provisions |
|
|
362 |
29 | ||||
|
Cash generated from operations |
|
|
4,925 |
933 | ||||
|
|
|
|
|
|
|
|
|
|
|
|
|
|
|
|
|
|
|
|
B. Analysis of net debt
|
|
At 1 June 2024 |
Cash flow |
Non-cash changes |
At 31 May 2025 | |
|
|
£'000 |
£'000 |
£'000 |
£'000 | |
|
Loans |
(4,015) |
(1,274) |
5 |
(5,284) | |
|
Lease liabilities |
(2,103) |
309 |
(903) |
(2,697) | |
|
Liabilities arising from financing activities |
(6,118) |
(965) |
(898) |
(7,981) | |
|
Cash and cash equivalents |
5,156 |
(3,083) |
(110) |
1,963 | |
|
Net debt |
(962) |
(4,048) |
(1,008) |
(6,018) | |
|
|
|
|
|
|
|
|
|
At 1 June 2025 |
Cash flow |
Non-cash changes |
At 31 May 2026 |
|
|
£'000 |
£'000 |
£'000 |
£'000 |
|
Loans |
(5,284) |
967 |
(97) |
(4,414) |
|
Lease liabilities |
(2,697) |
1,287 |
(1,035) |
(2,445) |
|
Liabilities arising from financing activities |
(7,981) |
2,254 |
(1,132) |
(6,859) |
|
Cash and cash equivalents |
1,963 |
5,858 |
(261) |
7,560 |
|
Net debt |
(6,018) |
8,112 |
(1,393) |
701 |
Financial Statements
Notes to the Condensed Consolidated Financial Statements
For the Year ended 31 May 2026
1. General information
EnSilica plc is a public limited company incorporated in the United Kingdom, listed on the Alternative Investment Market (AIM) of the London Stock Exchange. The Company is domiciled in the United Kingdom, and its registered office is 100 Park Drive, Milton Park, Abingdon, England, OX14 4RY. The consolidated financial statements comprise the Company and its subsidiaries (together referred to as the ‘Group’).
The Company is a leading fabless design house focused on custom ASIC design and supply for OEMs and system houses, as well as IC design services for companies with their own design teams. The Company has world-class expertise in supplying custom RF, mmWave, mixed signal and digital ICs to its international customers in the automotive, industrial, space and communications markets. The Company also offers a broad portfolio of core IP covering cryptography, radar and communications systems. EnSilica has a track record in delivering high quality solutions to demanding industry standards. The Company is headquartered near Oxford, UK and has design centres across the UK, India, Brazil, Hungary and a sales office in Germany.
Basis of preparation
The consolidated financial statements of the Company have been prepared in accordance with UK-adopted International Accounting Standards (IFRS) as issued by the International Accounting Standards Board (IASB) and the Companies Act 2006.
The financial information has been prepared under the historical cost convention unless otherwise specified within these accounting policies. The financial information and the notes to the financial information are presented in thousands of pounds sterling (£’000), the functional and presentation currency of the Group, except where otherwise indicated.
The principal accounting policies adopted in preparation of the financial information are set out below. The policies have been consistently applied to all periods presented, unless otherwise stated.
Judgements made by the Directors in the application of the accounting policies that have a significant effect on the financial information and estimates with significant risk of material adjustment in the next year are discussed below.
Accounting policies
Going concern
For the year ending 31 May 2026, the Group generated revenues of £27.8 million and an operating profit of £2.9 million; and generated net cash flow from operations of £6.2 million. As at 31 May 2026, the Group held cash balances of £7.6 million and the Group’s financing arrangements consisted of a loan of £4.4 million from Bank of Scotland.
In considering the basis of preparation of the financial statements, the Directors have prepared a cash flow forecast for a period of at least 12 months from the date of approval of these financial statements based on the 2027 Board approved budget and forecasts for the financial year 2028. The Directors have undertaken a rigorous assessment of the 2027 budget and 2028 forecast and assessed identified downside risks and mitigating actions. The assumptions around sales, staffing and purchases are based on contracted income and expenditure as well as management’s expectations over the forecast period.
Taking account of the matters described above, the Board has confidence in the Company’s ability to continue as a going concern for the following reasons:
‣ The Company’s ability to continue to be successful in winning new customers and building its brand as demonstrated by securing two satellite contracts with the potential unlocking match funding and a strategically important $75m auto contract,
‣ the Company’s customer contracted order book with more than 80% of revenues for the forecast period being contracted,
‣ A 50% increase in our lifetime supply revenues and potential new business pipeline to $375m and $600m respectively
‣ the £10 million equity fundraise in March 2026 and the £14.9 million equity fundraise in July 2026, and
‣ the Company’s ability to control capital expenditure and lower other operational spend, as necessary.
Taking account of the matters described above, the Directors are confident that the Company will have sufficient funds to continue to meet their liabilities as they fall due for at least 12 months from the date of approval of the financial statements and therefore have prepared the financial statements on a going concern basis.
Accounting policies
Basis of consolidation
The consolidated financial statements comprise the financial statements of the Company and its subsidiaries as at 31 May 2026. Control is achieved when the Group is exposed, or has rights, to variable returns from its involvement with the investee and has the ability to affect those returns through its power over the investee. Specifically, the Group controls an investee if, and only if, the Group has:
- Power over the investee (i.e. existing rights that give it the current ability to direct the relevant activities of the investee)
- Exposure, or rights, to variable returns from its involvement with the investee
-
The ability to use its power over the investee to affect its returns generally, there is a presumption that a majority of voting rights results in control. To support this presumption and when the Group has less than a majority of the voting or similar rights of an investee, the Group considers all relevant facts and circumstances in assessing whether it has power over an investee, including:
- The contractual arrangement(s) with the other vote holders of the investee
- Rights arising from other contractual arrangements
- The Group’s voting rights and potential voting rights. The Group re-assesses whether or not it controls an investee if facts and circumstances indicate that there are changes to one or more of the three elements of control.
Consolidation of a subsidiary begins when the Group obtains control over the subsidiary and ceases when the Group loses control of the subsidiary. Assets, liabilities, income and expenses of a subsidiary acquired or disposed of during the year are included in the consolidated financial statements from the date the Group gains control until the date the Group ceases to control the subsidiary. Profit or loss and each component of OCI are attributed to the equity holders of the parent of the Group and to the non-controlling interests, even if this results in the non-controlling interests having a deficit balance. When necessary, adjustments are made to the financial statements of subsidiaries to bring their accounting policies in line with the Group’s accounting policies. All intra-group assets and liabilities, equity, income, expenses and cash flows relating to transactions between members of the Group are eliminated in full on consolidation. A change in the ownership interest of a subsidiary, without a loss of control, is accounted for as an equity transaction. If the Group loses control over a subsidiary, it derecognises the related assets (including goodwill), liabilities, non-controlling interest and other components of equity, while any resultant gain or loss is recognised in profit or loss. Any investment retained is recognised at fair value.
Critical accounting estimates and judgements
The preparation of the financial information under IFRS requires the use of certain critical accounting assumptions and requires management to exercise its judgement and to make estimates in the process of applying the Company’s accounting policies.
Management bases its estimates on historical experience and on various other assumptions that management believes to be reasonable in the circumstances. The key estimates and judgements used in the preparation of this financial information that could result in a material change in the carrying value of assets or liabilities within the next twelve months are as follows:
Intangible assets – capitalisation, impairment and amortisation of development expenditure
Judgement
The capitalisation of development costs is subject to a degree of judgement in respect of the timing when the commercial viability of new technology and know-how is reached, supported by the results of testing and customer trials, and by forecasts for the overall value and timing of sales which may be impacted by other future factors which could impact the assumptions made. In making their judgements, the Directors considered the carrying values of the intangible assets that are disclosed in note 7.
Estimation
Amortisation commences once management consider that the asset is available for use, i.e. when it is judged to be in the location and condition necessary for it to be capable of operating in the manner intended by management and the cost is amortised over the estimated useful life of the asset based on experience of and future expected customer product cycles and lives. The useful economic lives and residual values are re-assessed annually. They are amended when necessary to reflect current estimates, based on technological advancement, future investments and economic utilisation.
Impairment of non-financial assets
Impairment exists when the carrying value of an asset or cash generating unit exceeds its recoverable amount, which is the higher of its fair value less costs of disposal and its value in use. The fair value less costs of disposal calculation is based on available data from binding sales transactions, conducted at arm’s length, for similar assets or observable market prices less incremental costs of disposing of the asset. The value in use calculation is based on a DCF model. The cash flows are derived from the budget for the next five years and do not include restructuring activities that the Group is not yet committed to or significant future investments that will enhance the performance of the assets of the CGU being tested. The recoverable amount is sensitive to the discount rate used for the DCF model as well as the expected future cash-inflows and the growth rate used for extrapolation purposes. These estimates are most relevant to goodwill and other intangibles with indefinite useful lives recognised by the Group. The key assumptions used to determine the recoverable amount for the different CGUs, including a sensitivity analysis, are disclosed and further explained in Note 7.
Revenue
Estimation
In accordance with the policy on revenue recognition, management are required to judge the percentage of completion of the contract in order to recognise revenues. The overall recognition of revenue will depend upon the nature of the project and whether it is billed on a time and materials basis, or, on a project milestone basis where invoices can only be raised on completion of specific, pre-agreed objectives.
The Company maintains complete and accurate records of employees’ time and expenditure on each project which is regularly assessed to determine the percentage of completion, and thereby whether it is appropriate to recognise revenues.
As it satisfies its performance obligations, the Company recognises revenue and the related contract asset with regards to the customer development contracts. Revenues are recognised on a percentage of completion basis and as such require estimation in terms of the assessment of the correct percentage of completion for that specific contract.
Management judgement is based on a strong track record of successful completion of projects and accurate forecasting of the time required together with the hindsight period available to support the balance sheet date assumptions made.
2. Segmental analysis
The Board continues to define all the Company’s trading as operating in the integrated circuit design market and considers all revenue to relate to the same, one operating segment.
Revenue in respect of the supply of products is recognised at a point in time. Design and related services including income for the use of IP are recognised over the period when services are provided or on a percentage of completion basis.
|
|
|
2026 |
2025 |
|
|
|
£'000 |
£'000 |
|
Recognised at a point in time |
|
|
|
|
Supply of products |
|
6,661 |
5,741 |
|
Recognised over time/on a percentage of completion basis |
|
|
|
|
NRE |
|
15,011 |
5,891 |
|
Consultancy design services |
|
6,135 |
6,551 |
|
|
|
|
|
|
|
|
21,146 |
12,442 |
|
|
|
27,807 |
18,183 |
|
By destination: |
|
|
|
|
UK |
|
10,150 |
4,250 |
|
Rest of Europe |
|
13,315 |
10,893 |
|
Rest of the World |
|
4,342 |
3,040 |
|
Total revenue |
|
27,807 |
18,183 |
The nature of the design services and projects is such that there can be significant customers as a proportion of revenue in any one year but that these may be different customers from year to year. Revenue in 2026 was less concentrated around the largest customers than in 2025. In 2026, the largest contribution made by a single customer was £3.8 million (2025: £4.3m), amounting to 14% (2025: 24%) of revenue. The next largest contribution being £3.3 million (2025: £2.4 million), being 12% (2025: 13%) of revenue.
The Group’s non-current assets comprising investments, tangible and intangible fixed assets and the net assets by geographical location are:
|
|
|
|
31 May 2026 |
|
31 May 2025 |
| ||||||
|
|
|
|
|
Non-current assets |
Net assets |
Non-current assets |
Net assets | |||||
|
|
|
|
|
£'000 |
£'000 |
£'000 |
£'000 | |||||
|
|
|
|
|
|
|
|
| |||||
|
United Kingdom |
|
|
|
30,385 |
30,343 |
25,999 |
20,030 | |||||
|
India |
|
|
|
79 |
376 |
126 |
1,133 | |||||
|
Brazil |
|
|
|
169 |
746 |
76 |
36 | |||||
|
Germany |
|
|
|
- |
(5) |
- |
(299) | |||||
|
Hungary |
|
|
|
159 |
(21) |
- |
- | |||||
|
|
|
|
|
30,792 |
31,439 |
26,201 |
20,900 | |||||
|
|
|
|
|
|
|
|
|
|
| |||
|
|
|
|
|
|
|
|
|
|
|
|
|
|
3. Alternative performance measures
Certain items are included in normal operating costs of the business but are significant cash and non-cash expenses that are separately disclosed because of their size, nature or incidence. It is the Company’s view that excluding them from operating profit gives a better representation of the underlying performance of the business in the year.
The Company’s primary results measure, which is considered by the Directors of EnSilica plc to better represent the underlying and continuing performance of the Company, is EBITDA as set out below. EBITDA is a commonly used measure in which earnings are stated before net finance income, amortisation and depreciation as a proxy for cash generated from trading.
|
|
|
|
2026 |
2025 | ||
|
|
|
|
£'000 |
£'000 |
| |
|
|
|
|
|
|
| |
|
Operating profit/(loss) before interest |
|
|
2,909 |
(2,630) |
| |
|
|
|
|
|
|
| |
|
Depreciation |
|
|
908 |
633 |
| |
|
Amortisation of intangible assets |
|
|
1,979 |
985 |
| |
|
Other amortisation |
|
|
97 |
53 |
| |
|
Impairment of assets |
|
|
- |
910 |
| |
|
EBITDA |
|
|
5,893 |
(49) |
| |
|
|
|
|
|
|
| |
|
|
|
|
|
|
| |
|
|
|
|
|
|
|
|
4. Taxation on profit
|
|
|
2026 |
2025 |
| ||
|
|
|
£'000 |
£'000 |
| ||
|
Current taxation |
|
|
|
| ||
|
UK corporation tax charge |
|
321 |
- |
| ||
|
Foreign tax charge |
|
162 |
88 |
| ||
|
|
|
483 |
88 |
| ||
|
Deferred taxation |
|
|
|
|
| |
|
Origination and reversal of timing differences |
|
538 |
(899) |
| ||
|
Tax charge/(credit) on profit/(loss) |
|
1,021 |
(811) |
| ||
|
|
|
|
|
|
|
|
5. Earnings per share
|
|
|
2026 |
2025 |
|
Profit/(loss) used in calculating Earnings per share (EPS) (£’000) |
|
1,238 |
(2,726) |
|
Average number of shares for basic EPS (‘000s) |
|
100,332 |
83,512 |
|
Basic earnings per share (pence) |
|
1.23 |
(3.26) |
|
Average number of shares for diluted EPS (‘000s) |
|
100,705 |
83,512 |
|
Diluted earnings per share (pence) |
|
1.23 |
(3.26) |
6. Property, plant and equipment
|
|
Right-of-use property |
Leasehold improvements |
Office equipment |
Right-of-use equipment |
Computer equipment |
Total |
| |||||||||||
|
|
£'000 |
£'000 |
£'000 |
£'000 |
£'000 |
£'000 |
| |||||||||||
|
|
|
|
|
|
|
|
| |||||||||||
|
Cost |
|
|
|
|
|
| ||||||||||||
|
At 1 June 2025 |
2,027 |
240 |
269 |
1,801 |
933 |
|
5,270 |
| ||||||||||
|
Additions |
259 |
33 |
177 |
298 |
251 |
|
1,017 |
| ||||||||||
|
Reclasses |
- |
8 |
(8) |
- |
- |
|
- |
| ||||||||||
|
Exchange adjustment |
- |
- |
2 |
- |
11 |
|
13 |
| ||||||||||
|
At 31 May 2026 |
2,286 |
281 |
440 |
2,099 |
1,195 |
|
6,300 |
| ||||||||||
|
|
|
|
|
|
|
|
|
| ||||||||||
|
Depreciation |
|
|
|
|
|
|
|
| ||||||||||
|
At 1 June 2025 |
(629) |
(67) |
(198) |
(347) |
(657) |
|
(1,898) |
| ||||||||||
|
Charge for the year |
(315) |
(27) |
(49) |
(345) |
(172) |
|
(908) |
| ||||||||||
|
Reclasses |
- |
(6) |
6 |
- |
- |
|
- |
| ||||||||||
|
Exchange adjustments |
- |
- |
4 |
- |
(8) |
|
(4) |
| ||||||||||
|
At 31 May 2026 |
(944) |
(100) |
(237) |
(692) |
(837) |
|
(2,810) |
| ||||||||||
|
|
|
|
|
|
|
|
|
| ||||||||||
|
Net book value |
|
|
|
|
|
|
|
| ||||||||||
|
At 31 May 2026 |
1,342 |
181 |
203 |
1,407 |
358 |
|
3,491 |
| ||||||||||
|
At 31 May 2025 |
1,398 |
173 |
71 |
1,454 |
276 |
|
3,372 |
| ||||||||||
|
|
|
|
|
|
|
|
|
| ||||||||||
|
|
|
|
|
|
|
|
|
|
|
|
|
|
|
|
|
|
|
|
7. Intangible assets
|
|
|
|
|
Intellectual property |
| |||||
|
|
|
£'000 |
£'000 |
£'000 |
£'000 | |||||
|
Cost |
|
|
|
|
| |||||
|
At 1 June 2025 |
|
27,034 |
123 |
155 |
27,312 | |||||
|
Additions |
|
6,454 |
- |
- |
6,454 | |||||
|
At 31 May 2026 |
|
33,488 |
123 |
155 |
33,766 | |||||
|
|
|
|
|
|
| |||||
|
Amortisation and impairment |
|
|
|
|
| |||||
|
At 1 June 2025 |
|
(4,372) |
(100) |
(14) |
(4,486) | |||||
|
Charge for the year |
|
(1,941) |
(23) |
(15) |
(1,979) | |||||
|
At 31 May 2026 |
|
(6,313) |
(123) |
(29) |
(6,465) | |||||
|
|
|
|
|
|
| |||||
|
Net book value |
|
|
|
|
| |||||
|
At 31 May 2026 |
|
27,175 |
- |
126 |
27,301 | |||||
|
At 31 May 2025 |
|
22,662 |
23 |
142 |
22,828 | |||||
|
|
|
|
|
|
| |||||
|
|
|
|
|
|
|
|
|
|
|
|
Capitalised development expenditure relates to developed intellectual property in respect of circuit and chip design. The recoverable amount of a cash generating unit (CGU) is assessed using a value in use model across each individual project that forms the intellectual property that has been capitalised. The value in use for each portion is dependent on the expected life cycle of the CGU using a discount factor of 9.8% (2025: 11.5%), being the cost of capital for the CGU.
No intangible asset impairments have been recognised in 2026.
8. Trade and other receivables
|
|
|
2026 |
2025 |
|
Current |
|
£'000 |
£'000 |
|
Trade receivables |
|
3,891 |
5,868 |
|
Other receivables |
|
1,435 |
925 |
|
Prepayments |
|
7,106 |
1,613 |
|
Contract assets |
|
1,434 |
1,702 |
|
Total |
|
13,866 |
10,107 |
9. Borrowings
|
|
|
2026 |
2025 |
|
Current |
|
£'000 |
£'000 |
|
Bank loans |
|
3,941 |
3,862 |
|
Non-current |
|
|
|
|
Bank loans |
|
473 |
1,422 |
|
Total |
|
4,414 |
5,284 |
|
|
2026 |
2025 |
|
Movement in Loans |
£'000 |
£'000 |
|
Opening balance 1 June |
5.284 |
4,015 |
|
Loan received |
- |
6,000 |
|
Interest accrued |
334 |
543 |
|
Interest paid |
(334) |
(531) |
|
Redemption of loans |
- |
(3,567) |
|
Amortisation/(capitalisation) of issue costs |
97 |
(263) |
|
Loan repayments |
(967) |
(913) |
|
Closing balance |
4,414 |
5,284 |
In November 2024, existing borrowings with a carrying value of £3.6 million were redeemed by way of a new Term Loan for £3.0 million, and a Revolving Credit Facility (RCF) of £3.0 million, which was drawn down in 2 tranches. The outstanding loan liability, at 31 May 2026, of £4.4 million is stated net of unamortised loan issue costs of £166,000.
The bank term loan of £3.0 million is secured by fixed and floating charges over the assets of the group and bears interest at rates of 3.5% over the Bank of England Base Rate. It is repayable in monthly instalments over the period to November 2027.
The revolving credit facility of £3.0 million is secured by fixed and floating charges over the assets of the group and bears interest at the Bank of England Base Rate plus 2.5%.
10. Trade and other payables
|
|
|
2026 |
2025 |
|
Current |
|
£'000 |
£'000 |
|
Trade payables |
|
6,994 |
2,745 |
|
Taxation and social security |
|
488 |
1,092 |
|
Other payables |
|
281 |
187 |
|
Accruals |
|
1,287 |
579 |
|
Contract liabilities |
|
7,569 |
5,889 |
|
Total |
|
16,619 |
10,492 |
11. Share capital
|
|
|
|
| |
|
Allotted, called up and fully paid |
|
2026 |
2025 | |
|
|
|
£'000 |
£'000 | |
|
117,877,230 (2025: 96,600,636) ordinary shares of £0.001 each |
|
97 |
97 | |
|
59,190 (2025: 59,190) deferred shares of £1.00 each |
|
59 |
59 | |
|
|
|
156 |
156 | |
|
|
|
|
|
|
On 18 March 2026, the Company announced that it had raised gross proceeds of £9.7 million through the issue of 20,638,297 Ordinary Shares at 47p each, and a further £0.3m through the issue of 638,297 shares via a retail offer placing.
On 17 June 2024, the Company announced that it had raised gross proceeds of £1.1 million through the issue of 2,465,119 Ordinary Shares at 45p each, and a further £0.3m through the issue of 666,589 shares via a retail offer placing.
The 59,190 deferred shares of £1 each do not carry any voting rights.
12. Post balance sheet events
Post year end, the Company announced that it had raised gross proceeds of £14.9 million (net £14.2 million) in July 2026 through an oversubscribed placing of 16,358,184 shares at 91 pence per new Ordinary Share.
13. Related party transactions
During the year the Company undertook transactions with the following related parties:
|
|
|
|
2026 |
2025 |
|
| |||||
|
Name |
Services |
|
|
Transactions during the period |
Balance owing/ (owed) at 31 May 2026 |
Transactions during the year |
Balance owing/ (owed) at 31 May 2025 £'000 |
|
|
| |
|
|
|
| |||||||||
|
|
|
| |||||||||
|
|
|
| |||||||||
|
|
|
| |||||||||
|
|
|
|
|
|
|
|
|
|
|
| |
|
Ensilica India Private Limited |
Semiconductor design services |
|
|
986 |
(1,068) |
658 |
(657) |
|
|
| |
|
EnSilica Do Brasil LTDA |
Semiconductor design services |
|
|
1,728 |
- |
1,357 |
- |
|
|
| |
|
EnSilica GmbH |
Semiconductor sales services |
|
|
303 |
280 |
257 |
(288) |
|
|
| |
|
EnSilica Hungary Kft |
Semiconductor design services |
|
|
902 |
(107) |
- |
- |
|
|
| |
|
|
|
|
|
|
|
|
|
|
|
| |
|
|
|
|
|
|
|
|
|
|
|
|
|
RNS may use your IP address to confirm compliance with the terms and conditions, to analyse how you engage with the information contained in this communication, and to share such analysis on an anonymised basis with others as part of our commercial services. For further information about how RNS and the London Stock Exchange use the personal data you provide us, please see our Privacy Policy.

Latest directors dealings
- 7 minutes ago SIG
- 19 minutes ago Savills
- 59 minutes ago Serco Group
- 1 hour ago Admiral Group
- 1 hour ago Stelrad Group