
Interim Results
Summary by AI BETAClose X

29 September 2026
Ebiquity plc
Unaudited Interim Results for the six months ended 30 June 2026
On track to deliver sustainable profit growth with a realigned cost base and refocused client offerings
Ebiquity plc, the independent authority in marketing effectiveness, announces its interim results for the six months ended 30 June 2026 (“H1 2026”).
“Our interim results represent the first six months of our multi-year strategic plan and I am pleased with the progress we have made.
We have restructured the business, are on track against plan, and are now laser-focused on translating our strategic and operational changes into profit growth.
We continue to operate in a market with significant long-term potential. As we highlighted at our Capital Markets Day in June, only 15% of advertisers currently base budget decisions primarily on effectiveness data. As adoption of evidence-based decision-making increases, we are well positioned to support them. This we are doing through our independent advice, proprietary benchmark data and our growing Marketing Effectiveness offering”.
Ruben Schreurs, Chief Executive Officer
Financial Summary
|
Group |
H1 2026 |
H1 2025 |
Change |
|
|
£m |
£m |
£m |
% |
|
|
Revenue |
36.1 |
37.9 |
(1.8) |
(5%) |
|
Adjusted operating profit1 |
2.3 |
2.6 |
(0.3) |
(10%) |
|
Adjusted operating profit margin (%)1 |
6.5% |
6.8% |
|
(0.3pp) |
|
Adjusted profit before tax1 |
1.8 |
0.4 |
1.4 |
334% |
|
Adjusted earnings/(loss) per Share1 |
0.45p |
(0.40)p |
0.85p |
212% |
|
Statutory operating profit/(loss) |
1.0 |
(6.8) |
7.8 |
114% |
|
Statutory profit/(loss) before tax |
0.4 |
(9.0) |
9.4 |
105% |
|
Statutory loss per share |
(0.30)p |
(7.19)p |
6.9p |
96% |
|
Adjusted cash from operations |
1.7 |
4.6 |
(2.8) |
(62%) |
|
Free cash flow2 |
(1.8) |
0.7 |
(2.5) |
(363%) |
|
Net debt3 |
(14.9) |
(15.0) |
0.1 |
1% |
- Adjusted numbers exclude highlighted items (comprising amortisation of acquired intangibles, acquisition and refinancing costs, severance and reorganisation costs, and other non-recurring items) and are alternative performance measures ('APMs') adopted by the Group. These non-GAAP measures are considered useful in helping to explain the performance of the Group and are consistent with how business performance is measured internally by the Group. Further details of the APMs, including their reconciliation to statutory numbers, are given below.
- Free cash flow is net cash from operating activities per the statutory cash flow, less capital expenditure, net lease payments, and loan fees
- Net Debt excludes restricted cash within the Russian operation (Restricted cash H1 2026 £1.2 million; H1 2025 £1.1 million)
Highlights
• Revenue of £36.1 million, down 5%, reflecting legacy client losses previously reported in 2025.
• Adjusted operating profit of £2.3 million, down 10%, with adjusted operating margin of 6.5% (H1 2025: 6.8%), with lower revenue partly offset by year-on-year cost reductions of £1.5 million.
• Statutory operating profit of £1.0 million, a £7.8 million increase from H1 2025 statutory operating loss of £6.8 million which included a non-cash impairment of the goodwill and intangible assets in the Americas.
• Adjusted profit before tax up £1.4 million (H1 2025: £0.4 million), reflecting cost reductions and lower net financing costs.
• Free cash flow of £(1.8) million (H1 2025: £0.7 million), driven by £2.2 million working capital outflow (H1 2025: £0.3 million inflow).
• Stable financial position, with net debt at 30 June 2026 of £14.9 million.
Outlook
Based on our operational and strategic actions, the benefits of which are starting to take effect, we are confident of our trajectory on the strategic plan that we set out in June 2026. Our adjusted operating profit in the months of July and August 2026 was up on the same periods in the prior year. Our visible revenue is growing and our win rate and new business conversion rate are improving. While the full benefits for the transformation programme will take time to be realised, the progress made in the first half and into the second mean that we are currently on track to meet or exceed market expectations of our profit for the full year.
We remain focused on delivering sustainable organic growth, maintaining cost discipline and investing selectively in the capabilities that will support long-term value creation.
Details of presentation
The executive directors will be hosting a webcast presentation for analysts at 11:30 BST on 29 September 2026. To register please contact alex.campbell@camarco.co.uk.
Enquiries:
|
Ebiquity plc |
+44 (0) 20 7650 9600 |
|
Dorcas Murray, Company Secretary |
|
|
Camarco |
|
|
Ben Woodford |
+44 (0) 7990 653 341 |
|
Geoffrey Pelham-Lane |
+44 (0) 7733 124 226 |
|
Phoebe Pugh |
+44 (0) 7586 714 048 |
|
Alex Campbell |
+44 (0) 7710 230 545 |
|
Cavendish Capital Markets Nominated Advisor and Sole Broker |
+44 (0) 20 7220 0500 |
|
Callum Davidson/George Lawson/Andrea Callaghan – Corporate Finance |
+44 (0) 20 7220 0500
|
|
Julian Morse/Louise Talbot – Sales/ECM
|
|
CEO Review: Half Year Results 2026
H1 2026 was, as expected, a period of transition. We are six months into the execution of our longer-term strategic plan, and the results achieved in the period reflect both the residual effects of decisions taken before this leadership team arrived and the considered restructuring we carried out in Q4 2025. I am pleased with the underlying progress, and I want to be straightforward with shareholders about what the numbers mean.
Financial Performance
Group revenue for H1 2026 was £36.1m, down 5% on H1 2025 (£37.9m), a decline of £1.8m. Adjusted operating profit was £2.3m, down 10% on H1 2025 (£2.6m), a shortfall of £0.3m. Adjusted operating margin was marginally lower at 6.5% (H1 2025: 6.8%), reflecting year-on-year cost reductions of £1.5 million (4%).
What is notable here is how the revenue shortfall flowed through to profit. While the top-line declined by £1.8m, adjusted profit before tax increased to £1.8m, supported by cost actions implemented in 2025 and lower net financing costs. Operating profit came in ahead of our expectations for the period, giving us confidence in the discipline around our cost base going into H2.
The H1 revenue decline was anticipated. It reflects legacy client losses during 2025, the impact of which carried forward into H1 2026, compounded by certain clients deferring project work in response to geopolitical uncertainty. These are real headwinds and we are not dismissing them. There were good client wins in the first half of 2026; while expected to grow, these were not yet at sufficient scale in H1 to offset the impact of prior-year losses in this period.
Strategic Progress
Our strategy, set out in full at the Capital Markets Day on 29 June 2026, targets a return to sustainable profit growth through a combination of operational discipline, commercial momentum and technology deployment. The foundational work is significantly progressed.
In Marketing Effectiveness, we secured contracts in December 2025 alone with an aggregate value exceeding £10m on three-year terms, with further major client wins in H1 2026 across the Americas and in other regions. We serve more than 75 of the world's top 100 advertisers. That is a commercial foundation no competitor can replicate quickly, and it underpins our confidence in the medium-term trajectory.
The market opportunity remains substantial. Only 15% of advertisers currently base budget decisions primarily on effectiveness data. Every shift toward evidence-based decision-making creates demand for what we do, and that structural dynamic is not cyclical.
Operationally, we are embedding the "One Ebiquity" model, in which every client relationship is an entry point to our full portfolio across Transform, Govern and Grow, providing growth through deeper penetration of our exceptional client base. ERAbot, our proprietary AI-driven analysis tool, is now deployed across the business, reducing delivery time and improving output quality as usage increases by over 25% quarter on quarter. We are also preparing to commercialise our benchmark data as a standalone service, which we expect to generate material revenue with limited incremental cost.
Our competitive position rests on four things: independence from media owners and agencies; proprietary benchmark data that compounds with every engagement; an integrated service offering that no single-line competitor can match; and the trust of clients built over many years. These are durable advantages, and they are the reason we can advance this turnaround with confidence.
Outlook
Our planned Q4 2025 restructuring was thorough; we are now through the heaviest part of that work. Commercial momentum is building, our cost base is well-controlled, and the pipeline is strong.
We are fully focused on organic growth, funded from within the business. That disciplines our choices and keeps our focus where it should be: on serving clients well, winning new mandates and delivering on the commitments made at the Capital Markets Day.
The full impact of our operational and strategic changes is beginning to accrue. I am encouraged by our trading performance in the first half and confident of our trajectory to meet or exceed market expectations on profit and deliver a return to sustainable profit growth. Our revenue for FY26 is expected to be stable against FY25, reflecting the transition to new business wins offsetting legacy losses through the restructuring period.
I want to close by recording my thanks to three stakeholder groups. To our clients: your continued trust is the foundation on which everything else is built, and we do not take it for granted. To our global team: the progress described in this review is a direct result of your discipline and commitment, and I am grateful for both. To our shareholders: thank you for your continued support as we execute this plan with care and conviction.
Ruben Schreurs
Chief Executive Officer
29 September 2026
Chief Financial Officer’s Review
|
|
Adjusted results1 |
Highlighted items |
Statutory Results |
Adjusted results1 |
Highlighted items |
Statutory Results |
|
|
H1 2026 |
H1 2026 |
H1 2026 |
H1 2025 |
H1 2025 |
H1 2025 |
|
|
£m |
£m |
£m |
£m |
£m |
£m |
|
Revenue |
36.1 |
— |
36.1 |
37.9 |
— |
37.9 |
|
Project-related costs |
(3.2) |
— |
(3.2) |
(3.3) |
— |
(3.3) |
|
Staff costs |
(24.3) |
(0.5) |
(24.9) |
(25.0) |
(1.3) |
(26.3) |
|
Impairment of goodwill and intangibles |
— |
— |
— |
— |
(8.4) |
(8.4) |
|
Other operating expenses |
(6.2) |
(0.8) |
(7.0) |
(7.0) |
0.4 |
(6.6) |
|
Operating profit/(loss) |
2.3 |
(1.4) |
1.0 |
2.6 |
(9.4) |
(6.8) |
|
Net finance costs |
(0.6) |
— |
(0.6) |
(2.2) |
— |
(2.2) |
|
Profit/(loss) before tax |
1.8 |
(1.4) |
0.4 |
0.4 |
(9.4) |
(9.0) |
|
Tax (charge)/credit |
(1.1) |
0.3 |
(0.8) |
(1.0) |
— |
(1.0) |
|
Profit/(loss) for the period |
0.6 |
(1.0) |
(0.4) |
(0.6) |
(9.4) |
(9.9) |
|
|
|
|
|
|
|
|
|
Adjusted profit margin |
6.5% |
|
|
6.8% |
|
|
|
Adjusted and statutory diluted (loss)/earnings per share (p) |
0.45p |
|
(0.30p) |
(0.40p) |
|
(7.19p) |
1Adjusted numbers exclude highlighted items and are alternative performance measures (‘APMs’) adopted by the Group. These non-GAAP measures are considered useful in helping to explain the performance of the Group and are consistent with how business performance is measured internally by the Group. Further details of the APMs, including their reconciliation to statutory numbers, are given below.
2 Figures are presented in £m and rounded to the nearest £0.1m, as a result, totals may not sum precisely due to rounding.
Revenue: sector headwinds in UK&I and the Americas; APAC returning to growth
H1 2026 revenues of £36.1 million were 5.0% lower than for H1 2025.
Revenue by Region: Three regions declining; one growing
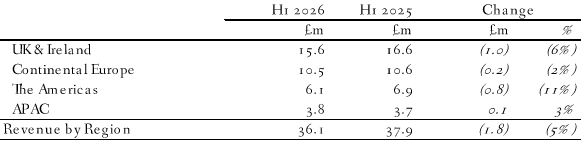
UK&I declined 6% year on year driven by losses in the prior year in the international market within the automotive and pharma sectors impacting the Govern offering. These losses are beginning to be replaced with new client wins particularly in the CPG and Travel & Hospitality sectors.
Continental Europe delivered a mixed performance, with strong growth in Italy (+23%) and Spain (+7%) broadly offsetting softer trading in France, the Nordics and Germany. The Govern offering showed a strong 5% growth predominantly in the Automotive, Technology and Telecom and Travel and Hospitality sectors, which together accounted for £0.6 million growth offsetting softer Transform and Grow revenues.
The Americas declined 11% year on year with the Govern offering driving the reduction, partly offset by encouraging growth in the Transform and Grow offerings. This growth is a result of the strengthened organisational structure implemented in Q4 last year.
APAC revenue shows 3% growth year on year, with strong growth in Transform (+66%) in Australia, Singapore and UAE. This was partly offset by lower revenue in China where macro-economic conditions continue to impact international advertisers, and in Singapore and India in the Govern offering. Travel and Hospitality and Financial Service sectors in the region are contributing the largest growth.
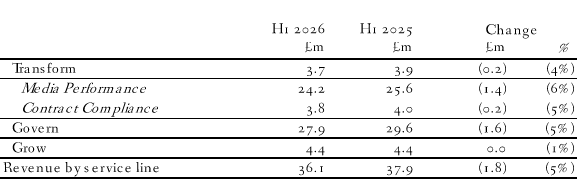
Transform (-4%)
Revenue of £3.7 million declined by 4% due to significant one-off client pitch work in Continental Europe in 2025. This was partly offset with strong growth in the Americas and APAC in Agency Selection Management due to several new logo wins.
Govern (-5%)
Media Performance: Revenue declined by £1.4 million (6%), predominantly due to a £1.2 million downside in the Americas across benchmarking, value track and circle audit products, compounded by downsides in UK&I, and within Singapore and China in APAC. Continental Europe showed a strong 9% growth driven by Italy and Spain.
Contract Compliance: Revenue declined by £0.2 million (5%) driven by non-annual audit cycle clients in Germany, US and China in 2025, partially offset by scope expansions with existing clients and new logos in Australia and UK&I.
Grow (-1%)
Revenue of £4.4 million was broadly in line with the prior year, down less than 1%. Strong new business wins secured towards the end of 2025 and into 2026, particularly in the Americas, are providing positive momentum heading into H2.
Adjusted Operating Profit: margin resilience driven by cost discipline
|
|
Adjusted operating profit |
Adjusted operating profit margin |
|||
|
|
H1 2026 |
H1 2025 |
|
2026 |
2025 |
|
|
£m |
£m |
|
% |
% |
|
UK & Ireland |
3.8 |
4.7 |
|
24.2% |
28.2% |
|
Continental Europe |
1.7 |
1.9 |
|
16.5% |
18.0% |
|
The Americas |
0.5 |
0.6 |
|
7.6% |
9.3% |
|
APAC |
0.3 |
0.1 |
|
8.0% |
4.0% |
|
Unallocated |
(3.9) |
(4.8) |
|
NA |
NA |
|
Adjusted operating profit |
2.3 |
2.6 |
|
6.5% |
6.8% |
Adjusted operating profit (statutory operating profit excluding highlighted items) reduced by £0.3 million to £2.3 million (H1 2025: £2.6 million). The adjusted operating profit margin reduced to 6.5% from 6.8% in the prior period.
Despite revenue headwinds of £1.8m, the impact at an adjusted operating profit level was reduced by cost discipline driving £1.5 million cost savings, principally staff costs (£0.7m) as a result of the H2 2025 redundancy programme plus savings in travel (£0.2m), audit and tax (£0.1m) and forex (£0.2m).
Highlighted items
Highlighted items comprise charges and credits which are highlighted in the income statement, where separate disclosure is considered appropriate in understanding the underlying performance of the business. These are used for the calculation of certain alternative performance measures.
Highlighted items after tax in H1 2026 totalled a charge of £1.0 million 2025 compared with £9.4 million in H1 2025. Excluding the £8.4 million goodwill and intangibles impairment in the prior period, highlighted items were broadly in line year on year.
Highlighted items include the following:
|
|
H1 2026 |
H1 2025 |
|
|
£’m |
£’m |
|
Share option charge |
0.2 |
0.1 |
|
Amortisation of purchased intangibles |
0.1 |
1.0 |
|
Impairment of goodwill and intangible assets |
— |
8.4 |
|
Severance and reorganisation costs |
0.6 |
1.3 |
|
Onerous lease provision/Dilapidations provision |
(0.2) |
0.1 |
|
Revaluation of contingent consideration |
— |
(1.8) |
|
Acquisition and refinancing |
0.7 |
0.2 |
|
Sub-total before tax |
1.4 |
9.4 |
|
Taxation (credit) |
(0.3) |
— |
|
Total highlighted items |
1.0 |
9.4 |
The Group recognised £nil impairment charge in the 6 months to 30 June 2026, with the remaining regional CGU groups demonstrating sufficient headroom when compared against their associated carrying values. Please refer to note 5 for further details. The comparative £8.4 million impairment comprised a goodwill impairment charge of £8.3 million in respect of the Americas regional CGU group, and an R&D intangibles impairment of £0.1 million, whereby a piece of external development was brought in house.
Severance and reorganisation costs of £0.6 million (H1 2025: £1.3 million) primarily relate to the implementation of a consolidation system during the first half of the year. Prior year first-half costs reflected a divisional reorganisation and the departure of a member of the Executive Leadership Team.
The amortisation charge decreased to £0.1 million (H1 2025: £1.0 million), reflecting the full amortisation of customer relationship and contract assets arising from the MMi and MediaPath acquisitions. The remaining purchased intangible asset net book value comprises the GMP licence asset acquired as part of the MediaPath acquisition.
Acquisition and refinancing costs of £0.7 million (H1 2025 £0.2 million) relate in part to the amendment and extension of the Group's revolving credit facility in April 2026. The residual amount relates to a loss on disposal recognised in the period.
Finance costs
H1 2026 net finance costs reduced significantly to £0.6 million from £2.2 million in H1 2025 driven by favourable foreign exchange and lower borrowing costs. Non-cash foreign exchange movements on intercompany balances generated a gain of £0.3 million, compared with a charge of £1.2 million in H1 2025. This was predominantly driven by Sterling strengthening against the Euro and weakening against the US dollar.
The Group's underlying interest expense of £0.9 million was £0.1m lower than £1.0 million the prior year reflecting a reduction in average borrowings and a lower effective interest rate.
Taxation
The statutory tax charge for the period was £0.8 million (H1 2025: £1.0 million). The H1 2026 adjusted effective tax rate of 64.3% represents a significant improvement compared with H1 2025 (237%) and FY2025 (267.2%), driven by Group restructurings implemented in 2025, with the prior period rate also significantly impacted by the derecognition of deferred tax assets in the US.
The adjusted effective tax rate remains above the UK statutory rate due to financing-related tax adjustments, losses arising in certain jurisdictions for which no deferred tax asset is able to be recognised, and the non-recognition of other deferred tax assets in the US, reflecting the current assessment that sufficient future taxable profits are not yet available to support recovery. With continued restructuring projects in progress, the Group expects to continue towards a more stable and sustainable effective tax rate over the medium term.
Earnings per share
Adjusted basic and adjusted diluted earnings per share both increased from a loss of 0.40p at 30 June 2025 to earnings of 0.45p at 30 June 2026. Statutory loss per share was 0.30p (30 June 2025: loss per share of 7.19p) and statutory diluted loss per share was 0.30p (30 June 2025: loss per share of 7.19p).
Dividend
No dividend has been declared for the six months ended 30 June 2026 (2025: £nil).
Statutory operating profit/(loss)
The Group returned to a statutory operating profit of £1.0 million in the current period, compared with a statutory operating loss of £6.8 million in H1 2025. The prior period loss was primarily driven by an £8.3 million impairment charge recognised against goodwill in the Americas, which eliminated the acquired goodwill balance in full.
Statement of financial position and net assets
A non-statutory summary of the Group’s balance sheet at 30 June 2026 and 31 December 2025 is set out below.
|
|
H1 2026 |
FY2025 |
|
|
£m |
£m |
|
Goodwill and intangible assets |
29.9 |
30.0 |
|
Right-of-use assets |
2.1 |
2.1 |
|
Other non-current assets |
1.2 |
1.2 |
|
Net working capital |
7.8 |
6.1 |
|
Lease liabilities |
(2.7) |
(2.8) |
|
Other non-current liabilities |
(0.8) |
(0.5) |
|
Net bank debt |
(13.7) |
(12.0) |
|
Net Assets |
23.8 |
24.0 |
Net assets of £23.8 million at 30 June 2026 decreased by £0.2 million from 31 December 2025. An increase in net bank debt to £13.7 million from £12.0 million was largely offset by a £1.7 million increase in net working capital to £7.8 million.
Net working capital increased to £7.8 million at 30 June 2026 from £6.1 million at 31 December 2025. This reflected higher accrued income, which typically builds during H1 due to project billing patterns, coupled with lower deferred income and is partially offset by lower net trade debtors. The accrued income increase in H1 typically unwinds in H2 as projects progress and are billed during the second half of the year. Conversely, deferred income has historically been lower at H1 and peaked in Q4, due in part to the timing of projects commencing.
Net Debt and Cash Management
Cash management and cash generation remain a key area of focus for the Group. Net debt increased from £13.1 million at 31 December 2025 to £14.9 million at 30 June 2026, principally reflecting the impact of severance payments from the December 2025 restructuring, reorganisation and working capital movements during the first half of the year. Restricted cash held in Russia, which is not freely and immediately available to the Group, is excluded from the net debt measure and amounted to £1.2 million (31 December 2025: £1.1 million).
Free cash flow was an outflow of £1.8 million in H1 2026, compared with an inflow of £0.7 million in H1 2025. The year-on-year movement was primarily driven by an adverse £2.5 million working capital movement from an inflow of £0.3 million in H1 2025 to an outflow of £2.2 million in H1 2026, and higher expenditure on highlighted items, up from £0.7 million in H1 2025 to £1.5 million in H1 2026, partly mitigated by a tax cash inflow in H1 2026 of £0.4 million compared to an outflow of £0.8 million in the prior period.
The Group’s working capital outflow of £2.2 million in H1 2026 compared with an inflow of £0.3 million in H1 2025. The prior year working capital inflow benefitted from a one-off reduction in elevated receivables that had been carried forward from the previous period.
Cash outflows relating to highlighted items increased to £1.5 million (30 June 2025: £0.7 million), primarily reflecting the settlement of severance and reorganisation costs accrued in the prior year, together with investment in the implementation of the Group's new consolidation system and costs associated with the amendment of the Group's banking facilities.
Investment in product development remained broadly stable at £0.8 million, with other capital expenditure unchanged at £0.1 million. Total capital expenditure represented 2.6% of H1 2026 revenue (H1 2025: 2.1%), underlining the Group's ongoing commitment to product innovation and development.
Net Tax receipts of £0.4 million include refunds across the Group for prior year overpayments more than offsetting instalment payments made for the current year.
Net interest paid reduced by £0.1 million to £0.8 million reflecting a reduction in average borrowings and a lower effective interest rate.
The following table reconciles the statutory operating profit to operating cash flow and free cash flow, both of which are defined in the APMs.
|
|
H1 2026 |
H1 2025 |
|
|
£m |
£m |
|
Statutory operating profit |
1.0 |
(6.8) |
|
Add back: Adjusting items |
1.4 |
9.4 |
|
Adjusted operating profit |
2.3 |
2.6 |
|
Depreciation |
0.7 |
0.7 |
|
Amortisation |
0.9 |
1.0 |
|
Adjusted EBITDA1 |
3.9 |
4.3 |
|
Working capital movement2 |
(2.2) |
0.3 |
|
Adjusted cash generated from operations |
1.7 |
4.6 |
|
Adjusted cash conversion % |
74% |
176% |
|
Highlighted items |
(1.5) |
(0.7) |
|
Cash generated from operations |
0.2 |
3.9 |
|
Lease payments and dilapidations |
(0.6) |
(0.6) |
|
Loan fees and hedge instruments |
(0.2) |
(0.1) |
|
Capital expenditure R&D |
(0.8) |
(0.7) |
|
Capital expenditure Other |
(0.1) |
(0.1) |
|
Net interest |
(0.8) |
(0.9) |
|
Taxation |
0.4 |
(0.8) |
|
Free Cash Flow |
(1.8) |
0.7 |
|
Free cash flow conversion |
-78% |
27% |
(1) Adjusted EBITDA represents adjusted operating profit before interest, tax and non-cash items
including depreciation and amortisation.
(2) Working capital movement excludes movements on reorganisation, and acquisition and restructuring accruals or provisions, as the cash flow relating to these amounts is included in other lines in the free cash flow table. The variance between the working capital in the free cash flow table and the Consolidated Cash Flow Statement is driven by the non-cash movement on these items.
The calculation of adjusted cash from operations conversion and free cashflow conversion is as follows:
|
|
Adjusted cash Conversion |
Free cash flow Conversion |
||
|
|
H1 2026 |
H1 2025 |
H1 2026 |
H1 2025 |
|
|
£m |
£m |
£m |
£m |
|
Adjusted cash from operations/Free cash flow |
1.7 |
4.6 |
(1.8) |
0.7 |
|
Adjusted Operating Profit |
2.3 |
2.6 |
2.3 |
2.6 |
|
Adjusted cash/Free cash flow conversion |
74% |
176% |
(78%) |
27% |
Adjusted cash conversion of 74% (H1 2025: 176%) and free cash flow conversion of negative 78% (H1 2025: positive 27%). Both measures are defined in the APMs.
The following table reconciles net cash inflow from operating activities, as shown in the Consolidated Cash Flow statement, to free cash flow:
|
|
H1 2026 |
H1 2025 |
|
|
£m |
£m |
|
Net cash inflow from operating activities per statutory cash flow |
(0.1) |
2.2 |
|
Net repayments of lease liabilities and dilapidations |
(0.6) |
(0.6) |
|
Purchase of property, plant & equipment |
(0.1) |
(0.1) |
|
Purchase of intangible assets |
(0.8) |
(0.7) |
|
Loan fees |
(0.2) |
(0.1) |
|
Free cash flow |
(1.8) |
0.7 |
The following table reconciles free cash flow from operations to net funds flow and net debt, with net debt excluding restricted cash reducing by £0.1 million to £14.9 million year on year:
|
|
H1 2026 |
H1 2025 |
|
|
£m |
£m |
|
Free cash flow |
(1.8) |
0.7 |
|
Net funds flow |
(1.8) |
0.7 |
|
Net debt at 1 January |
(12.0) |
(14.7) |
|
Prepaid loan fees |
0.1 |
— |
|
FX |
— |
0.1 |
|
Net debt |
(13.7) |
(14.0) |
|
Restricted cash |
(1.2) |
(1.1) |
|
Net debt excluding restricted cash |
(14.9) |
(15.0) |
Equity
During the six months to 30 June 2026, the number of ordinary shares in issue decreased by 0.04 million (H1 2025: static) to 141.2 million (30 June 2025: 140.6 million), due to the return of 40,749 shares relating to an amendment to the terms of the securities purchase agreement dated 29 March 2022 relating to the acquisition of Media Management LLC; see note 12 for more details.
Banking Facilities and Indebtedness
In April 2026 the Group completed an amendment and extension of its revolving credit facility with Barclays and NatWest. The facility totals £28 million with no amortisation through to maturity in October 2027. The facility bears variable interest at the SONIA rate plus a margin ranging from 2.75% to 3.35% depending on the Group’s adjusted net leverage ratio. The details are disclosed in note 9.
Kayte Herrity
Chief Financial Officer
Alternative performance measures
In these results we refer to ‘adjusted’ and ‘reported’ results, as well as other non-GAAP alternative performance measures. Further details of highlighted items are set out within the financial statements and the notes to the financial statements.
In the reporting of financial information, the Directors have adopted various alternative performance measures (‘APMs’). The Group includes these non-GAAP measures as they consider them to be both useful and necessary to the readers of the financial statements to help understand the performance of the Group. The Group’s measures may not be calculated in the same way as similarly titled measures reported by other companies and therefore should be considered in addition to IFRS measures. The APMs are consistent with how business performance is measured internally by the Group.
Alternative performance measures used by the Group are detailed in the table below:
|
APM |
Relevant IFRS measure |
Adjustments to reconcile to IFRS measure |
Definition and purpose |
Reference |
|
|
Profit and loss measures |
|
|
|
|
|
|
Net revenue |
Revenue |
Includes project- related costs |
Net revenue is the revenue after deducting external production costs and is reconciled to revenue on the face of the consolidated income statement. |
A1 |
|
|
Adjusted operating profit |
Operating |
Excludes |
Adjusted operating profit is reconciled to its statutory equivalents on the face of the consolidated income statement. This is an important Group performance measure used by the Board and is also a key management incentive metric.
|
A2 |
|
|
Adjusted operating margin |
Operating |
Excludes |
Adjusted operating profit margin is calculated as the operating profit excluding highlighted items divided by revenue.
|
A3 |
|
|
Adjusted profit before tax |
Profit before |
Excludes |
Adjusted profit before tax is reconciled to profit before tax on the face of the consolidated income statement. This is an important Group performance measure used by the Board and allows for the consistent comparison of year on year performance.
|
A4 |
|
|
Adjusted effective rate of tax |
Effective rate |
|
The adjusted effective rate of tax is calculated by comparing the total tax charge for the current year to adjusted profit before taxation. Adjusted profit before taxation excludes highlighted items and their related tax effects. This measure is more representative of the tax rate on the Group's underlying earnings.
|
A4 |
|
|
APM |
Relevant IFRS measure |
Adjustments to reconcile to IFRS measure |
Definition and purpose |
Reference |
|
|
Adjusted profit after tax |
Profit after |
Excludes |
Adjusted profit after tax is reconciled to profit after tax on the face of the consolidated income statement. This is an important Group performance measure used by the Board and allows for the consistent comparison of year on year performance.
|
A4 |
|
|
Adjusted earnings per share |
Earnings |
Excludes |
Adjusted earnings per share is reconciled to statutory earnings per share in note 4. This is an important Group performance measure and allows for the consistent comparison of year on year performance. Furthermore, up to 2024, the Long Term Incentive Plan uses a target based on EPS growth over a three year period. |
Note 4 |
|
|
Balance sheet measures |
|
|
|
|
|
|
Net debt |
None |
Reconciliation of net debt |
Net debt comprises total loans and borrowings, including prepaid loan fees, less cash and cash equivalents. Net debt excludes restricted cash from Ebiquity Russia OOO. This is an important Group performance measure in assessing the strength of the balance sheet. |
A5 |
|
|
Cash flow measures |
|
|
|
|
|
Adjusted cash generated from operations |
Cash flow from operations |
Cash movements relating to highlighted items excluded |
Adjusted cash generated from operations is defined as the cash generated from operations excluding the cash movements relating to the highlighted items. This is an important Group performance measure and allows for the consistent comparison of year on year performance.
|
A6 |
|
Adjusted operating cash flow conversion |
Operating cash flow conversion |
Cash movements relating to highlighted items excluded |
Adjusted operating cash flow conversion is the ratio of the adjusted cash generated from operations divided by the adjusted operating profit, expressed as a percentage. This is an important Group performance measure and allows for the consistent comparison of year on year performance.
|
A6 |
|
Free cash flow |
Cash flow from operations |
Capital expenditure deducted |
Free cash flow is defined as cash flow from operating activities per the statutory cash flow less capital expenditure, less net lease payments, less loan fees. This is used to assess the Group’s ability to generate cash available to debt repayment, acquisitions and other strategic initiatives.
|
A7 |
A1: Reconciliation of net revenue
|
|
H1 2026 £’000 |
H1 2025 £’000 |
|
Revenue |
36,056 |
37,898 |
|
Project- related costs |
(3,236) |
(3,287) |
|
Net revenue |
32,820 |
34,611 |
A2: Reconciliation of adjusted operating profit
|
|
H1 2026 £’000 |
H1 2025 £’000 |
|
Adjusted operating profit |
2,333 |
2,587 |
|
Highlighted items |
(1,360) |
(9,377) |
|
Operating profit/(loss) |
973 |
(6,790) |
A3: Reconciliation of operating profit/(loss) margin
|
|
H1 2026 £’000 |
H1 2025 £’000 |
|
Revenue |
36,056 |
37,898 |
|
Adjusted operating profit (A2) |
2,333 |
2,587 |
|
Adjusted operating profit margin |
6.5% |
6.8% |
|
Operating profit/(loss) (A2) |
973 |
(6,790) |
|
Operating profit/(loss) margin |
2.7% |
(17.9%) |
A4: Reconciliation of adjusted profit before taxation and adjusted effective tax rate
|
|
H1 2026 £’000 |
H1 2025 £’000 |
|
Adjusted profit before taxation |
1,772 |
408 |
|
Highlighted items |
(1,360) |
(9,377) |
|
Profit/(loss) before taxation |
412 |
(8,969) |
|
Breakdown of taxation (charge)/credit |
|
|
|
Before highlighted items |
(1,140) |
(968) |
|
Highlighted items |
311 |
(7) |
|
Taxation charge |
(829) |
(975) |
|
Adjusted profit/(loss) after tax |
632 |
(560) |
|
Highlighted items |
(1,049) |
(9,384) |
|
Loss after tax |
(417) |
(9,944) |
|
Adjusted effective rate of tax |
(64.3%) |
(237.2%) |
|
Effective rate of tax |
(201.2%) |
10.9% |
A5: Reconciliation of net debt
|
|
H1 2026 £’000 |
H1 2025 £’000 |
|
Loans and borrowings |
(22,650) |
(24,000) |
|
Prepaid loan fees |
177 |
96 |
|
Less: cash and cash equivalents |
8,791 |
9,950 |
|
Net debt excluding lease liabilities |
(13,682) |
(13,954) |
|
Restricted cash – Ebiquity Russia OOO |
1,215 |
1,084 |
|
Net debt excluding restricted cash |
(14,897) |
(15,038) |
A6: Reconciliation of adjusted cash flow from operations
|
|
H1 2026 £’000 |
Restated 1 H1 2025 £’000 |
|
Cash generated from operations |
247 |
3,902 |
|
Eliminating cash movements for highlighted items: |
|
|
|
Severance and reorganisation costs |
1,207 |
551 |
|
Acquisition and refinancing costs |
250 |
112 |
|
Onerous lease payments 2 |
25 |
— |
|
Adjusted cash generated from operations |
1,729 |
4,565 |
|
Adjusted operating profit |
2,333 |
2,587 |
|
Adjusted operating cash flow conversion (%) |
74% |
176% |
1 The comparative cash movements for highlighted items have been updated to be calculated consistently with the current year. Previously the cash movements related to in-year highlighted items only, excluding cash payments relating to highlighted items recognised in prior years.
2 These relate to final costs incurred with closing out the New York office lease.
A7: Reconciliation of free cash flow:
|
|
H1 2026 £’000 |
H1 2025 £’000 |
|
Net cash from operating activities |
(122) |
2,202 |
|
Repayments of lease liabilities |
(652) |
(610) |
|
Receipts from lease receivables |
92 |
— |
|
Acquisition payments |
(10) |
— |
|
Purchase of property, plant and equipment |
(120) |
(116) |
|
Purchase of intangible assets |
(800) |
(671) |
|
Bank loan fees paid |
(210) |
(110) |
|
Free cash flow |
(1,822) |
694 |
|
Adjusted operating profit |
2,333 |
2,587 |
|
Free cash flow conversion (%) |
(78%) |
27% |
Interim Consolidated Income Statement
for the six months ended 30 June 2026
|
|
|
|
||||||||||||||||||||||||||||||||||||||||||||||||||||||||||||||||||||||||||||||||||||||||||||||||||||||||||||||||||||||||||||||||||||||||||||||||||||||||||||||||||||||||||||||||||||||||||||||||||||||||||||||||||||||||||||||||||||||||
|
Interim Consolidated Statement of Comprehensive Income for the six months ended 30 June 2026 |
|
|
|
||||||||||||||||||||||||||||||||||||||||||||
|
|
|
|
Interim Consolidated Statement of Financial Position
as at 30 June 2026
|
|
|
Unaudited as at 30 June 2026 |
Unaudited as at 30 June 2025 |
Audited as at 31 December 2025 |
|
|
Note |
£’000 |
£’000 |
£’000 |
|
Non-current assets |
|
|
|
|
|
Goodwill |
5 |
25,805 |
27,052 |
25,759 |
|
Other intangible assets |
6 |
4,079 |
4,737 |
4,192 |
|
Property, plant and equipment |
|
820 |
979 |
870 |
|
Right-of use-assets |
|
2,143 |
2,467 |
2,147 |
|
Deferred tax asset |
|
356 |
833 |
324 |
|
Total non-current assets |
|
33,203 |
36,068 |
33,292 |
|
|
|
|
|
|
|
Current assets |
|
|
|
|
|
Trade and other receivables |
|
24,014 |
26,855 |
23,696 |
|
Lease receivables |
|
— |
160 |
73 |
|
Corporation tax asset |
|
517 |
521 |
1,264 |
|
Cash and cash equivalents |
7 |
8,791 |
9,950 |
10,575 |
|
Total current assets |
|
33,322 |
37,486 |
35,608 |
|
Total assets |
|
66,525 |
73,554 |
68,900 |
|
|
|
|
|
|
|
Current liabilities |
|
|
|
|
|
Trade and other payables |
|
(4,777) |
(5,397) |
(6,283) |
|
Accruals and contract liabilities |
8 |
(10,743) |
(11,054) |
(11,624) |
|
Financial liabilities |
9 |
(62) |
(855) |
(59) |
|
Current tax liabilities |
|
(1,075) |
(1,090) |
(857) |
|
Provisions |
|
— |
— |
(89) |
|
Lease liabilities |
|
(1,057) |
(1,135) |
(1,126) |
|
Total current liabilities |
|
(17,714) |
(19,531) |
(20,038) |
|
|
|
|
|
|
|
Non-current liabilities |
|
|
|
|
|
Accruals and contract liabilities |
8 |
(149) |
— |
— |
|
Financial liabilities |
9 |
(22,473) |
(23,966) |
(22,581) |
|
Provisions |
|
(190) |
(260) |
(192) |
|
Lease liabilities |
|
(1,619) |
(2,087) |
(1,713) |
|
Deferred tax liability |
|
(596) |
(272) |
(338) |
|
Total non-current liabilities |
|
(25,027) |
(26,585) |
(24,824) |
|
Total liabilities |
|
(42,741) |
(46,116) |
(44,862) |
|
Total net assets |
|
23,784 |
27,438 |
24,038 |
|
|
|
|
|
|
|
Equity |
|
|
|
|
|
Ordinary shares |
12 |
35,304 |
35,144 |
35,314 |
|
Share premium |
|
15,552 |
15,552 |
15,552 |
|
Other reserves |
|
4,528 |
3,920 |
4,794 |
|
Accumulated losses |
|
(31,994) |
(27,548) |
(32,014) |
|
Equity attributable to the owners of the parent |
|
23,390 |
27,068 |
23,646 |
|
Non-controlling interests |
|
394 |
370 |
392 |
|
Total equity |
|
23,784 |
27,438 |
24,038 |
Interim Consolidated Statement of Changes in Equity
for the six months ended 30 June 2026
|
|
Ordinary shares |
|
Share premium |
Other reserves |
Accumulated Losses |
Total |
Non controlling interests |
Total equity |
|
|
|
£’000 |
|
£’000 |
£’000 |
£’000 |
£’000 |
£’000 |
£’000 |
|
|
31 December 2024 |
35,143 |
|
15,552 |
2,459 |
(17,734) |
35,420 |
374 |
35,794 |
|
|
Loss for the period |
— |
|
— |
— |
(9,940) |
(9,940) |
(4) |
(9,944) |
|
|
Other comprehensive income |
— |
|
— |
1,462 |
— |
1,462 |
— |
1,462 |
|
|
Total comprehensive income/(expense) for the period |
— |
|
— |
1,462 |
(9,940) |
(8,478) |
(4) |
(8,482) |
|
|
Shares issued for cash |
1 |
|
— |
— |
(1) |
— |
— |
— |
|
|
Share options charge |
— |
|
— |
— |
126 |
126 |
— |
126 |
|
|
30 June 2025 (unaudited) |
35,144 |
|
15,552 |
3,920 |
(27,548) |
27,068 |
370 |
27,438 |
|
|
(Loss)/profit for the period |
— |
|
— |
— |
(4,112) |
(4,112) |
22 |
(4,090) |
|
|
Other comprehensive income |
— |
|
— |
393 |
— |
393 |
— |
393 |
|
|
Total comprehensive income/(expense) for the period |
— |
|
— |
393 |
(4,112) |
(3,719) |
22 |
(3,697) |
|
|
Shares issued for cash |
170 |
|
— |
— |
— |
170 |
— |
170 |
|
|
Share options charge |
— |
|
— |
— |
127 |
127 |
— |
127 |
|
|
Share options exercised and issued out of EBT |
— |
|
— |
480 |
(480) |
— |
— |
— |
|
|
31 December 2025 |
35,314 |
|
15,552 |
4,794 |
(32,014) |
23,646 |
392 |
24,038 |
|
|
(Loss)/profit for the period |
— |
|
— |
— |
(419) |
(419) |
2 |
(417) |
|
|
Other comprehensive expense |
— |
|
— |
(233) |
— |
(233) |
— |
(233) |
|
|
Recycling of translation reserve |
— |
|
— |
(33) |
— |
(33) |
— |
(33) |
|
|
Total comprehensive (expense)/income for the period |
— |
|
— |
(266) |
(419) |
(685) |
2 |
(683) |
|
|
Shares issued for cash |
(10) |
|
— |
— |
— |
(10) |
— |
(10) |
|
|
Share options charge |
— |
|
— |
— |
161 |
161 |
— |
161 |
|
|
Disposal of entities |
— |
|
— |
— |
278 |
278 |
— |
278 |
|
|
30 June 2026 (unaudited) |
35,304 |
|
15,552 |
4,528 |
(31,994) |
23,390 |
394 |
23,784 |
|
Interim Consolidated Cash Flow Statement
for the six months ended 30 June 2026
|
|
|
Unaudited 6 months ended 30 June 2026 |
Unaudited 6 months ended 30 June 2025 |
Audited Year ended 31 December 2025 |
|
|
Note |
£’000s |
£’000s |
£’000 |
|
Cash flows from operating activities |
|
|
|
|
|
Cash generated by operations |
11 |
247 |
3,902 |
10,344 |
|
Finance expenses paid |
|
(836) |
(968) |
(1,929) |
|
Finance income received |
|
54 |
63 |
108 |
|
Hedge interest premium |
|
— |
— |
(32) |
|
Income taxes refunded/(paid) |
|
413 |
(795) |
(2,151) |
|
|
|
|
|
|
|
Net cash from operating activities |
|
(122) |
2,202 |
6,340 |
|
|
|
|
|
|
|
Cash flows from investing activities |
|
|
|
|
|
Acquisition of subsidiaries, net of cash acquired |
|
(10) |
— |
(648) |
|
Purchase of property, plant and equipment |
|
(120) |
(116) |
(191) |
|
Purchase of intangible assets |
|
(800) |
(671) |
(1,618) |
|
Net cash flow from investing activities |
|
(930) |
(787) |
(2,457) |
|
Cash flows from financing activities |
|
|
|
|
|
Proceeds from bank borrowings |
|
— |
— |
650 |
|
Repayment of bank loans |
|
— |
— |
(2,000) |
|
Bank loan fees paid |
|
(210) |
(110) |
(110) |
|
Payments of lease liabilities |
|
(652) |
(610) |
(1,535) |
|
Receipts from lease receivables |
|
92 |
— |
214 |
|
Payment of finance lease |
|
— |
— |
(64) |
|
|
|
|
|
|
|
Net cash flow from financing activities |
|
(770) |
(720) |
(2,845) |
|
|
|
|
|
|
|
Net (decrease)/increase in cash, cash equivalents and bank overdrafts |
|
(1,822) |
694 |
1,038 |
|
Cash, cash equivalents and bank overdrafts at beginning of period |
|
10,575 |
9,143 |
9,143 |
|
Effect of exchange rate changes on cash and cash equivalents |
|
38 |
112 |
394 |
|
Cash, cash equivalents and bank overdrafts at end of period |
7 |
8,791 |
9,950 |
10,575 |
Notes to the interim financial statements for the six months ended 30 June 2026
1. Accounting Policies
Basis of preparation
The condensed consolidated interim financial statements for the six months ended 30 June 2026 have been prepared in accordance with UK adopted International Accounting Standard 34, ‘Interim Financial Reporting’. These interim financial statements should be read in conjunction with the Group’s Annual Report and Accounts for the year ended 31 December 2025, which have been prepared in accordance with UK-adopted international accounting standards (‘IFRS’) in conformity with the requirements of the Companies Act 2006 and the applicable legal requirements of the Companies Act 2006.
The accounting policies adopted in the preparation of the condensed consolidated interim financial statements are consistent with those applied in the preparation of the Group's Annual Report and Accounts for the year ended 31 December 2025. The adoption of any new standards, amendments and interpretations effective from 1 January 2026 has not had a material impact on the Group's condensed consolidated interim financial statements.
The condensed consolidated interim financial statements do not constitute statutory accounts within the meaning of section 434 of the Companies Act 2006. The financial information for the year ended 31 December 2025 has been extracted from the Group's statutory accounts for that year, which have been filed with the Registrar of Companies. The auditor's report on those accounts was unqualified, did not contain an emphasis of matter paragraph and did not contain a statement under sections 498(2) or 498(3) of the Companies Act 2006.
The condensed consolidated interim financial statements have been prepared on a going concern basis. The Group meets its day-to-day working capital requirements through its cash reserves and borrowings, described in notes 7 and 9. At 30 June 2026, the Group had cash balances of £8,791,000, (including restricted cash of £1,215,000) and undrawn bank facilities of £5,350,000.
In assessing the going concern status of the Group and Company, the Directors have considered the Group’s forecasts and projections, taking account of reasonably possible changes in trading performance, and the Group’s cash flows, liquidity, and bank facilities. The Directors have prepared a model to forecast covenant compliance and liquidity for the next 12 months that includes a base case and scenarios that form a severe but plausible downside case.
The base case model assumes growth in revenue and EBITDA based on the Group’s FY2026 6+6 forecast. Growth rate assumptions determined by management are subsequently applied to FY2027 and FY2028. The severe but plausible downside case applies a 5% revenue reduction against the base case, with no cost mitigation. FY2027 applies a revenue reduction of 5% against the base case, with year on year staff cost savings of 0.7%. In this scenario all projected covenants are within covenant limit thresholds and management is satisfied of covenant compliance through the going concern period.
The Directors consider that the Group and Company will have sufficient liquidity within existing bank facilities, totalling £28 million, to meet its obligations during the next 12 months and hence consider it appropriate to prepare the condensed consolidated interim financial statements on a going concern basis.
Russian operation
Following the Russian invasion of Ukraine, the Group has kept the future of its subsidiary in Russia (Ebiquity Russia OOO) under review with a view to divesting its 75.05% shareholding in it. The transaction requires approval from both the Ministry of Digital Development and the Ministry of Finance in Russia and an exit tax is payable. As at 30 June 2026, the application has not progressed. The subsidiary remains part of the Group for these financial statements and given the uncertainty regarding this operation the assets were first impaired in FY 2022 and then further impaired in the Group balance sheet for the year ended 31 December 2023. Its cash balances are also deemed to be restricted cash, see note 7.
In the reporting of financial information, the Directors have adopted various alternative performance measures (‘APMs’). The Group includes these non-GAAP measures as they consider them to be both useful and necessary to the readers of the financial statements to help understand the performance of the Group. The Group’s measures may not be calculated in the same way as similarly titled measures reported by other companies and therefore should be considered in addition to IFRS measures. The APMs are consistent with how business performance is measured internally by the Group. Details of the APMs and their calculations are set in the relevant section above.
2. Segmental reporting
In accordance with IFRS 8, the Executive Directors have identified the operating segments based on the reports they review as the chief operating decision-maker (‘CODM’) to make strategic decisions, assess performance and allocate resources. The operating segments have been aggregated into four reportable segments as follows:
• UK & Ireland (‘UK&I’) - consisting of operations in the United Kingdom and Ireland
• Continental Europe – consisting of operations in France, Iberian Peninsula, Germany, Italy, Russia, the Netherlands, Bulgaria and the Nordic region
• The Americas - consisting of operations in the United States of America, Canada and Latin America
• Asia Pacific (‘APAC’) - consisting of operations in Australia, China, India, Singapore and United Arab Emirates.
The Group reviews its global operations on a regional basis as it allows management to tailor strategies to the unique economic, political, cultural and market dynamics of each region.
The Group’s CODM assesses the performance of the reportable segments based on revenue and adjusted operating profit. This measurement basis excludes the effects of non‑recurring expenditure from the operating segments such as restructuring costs. The measure also excludes the effects of recurring expenditure recorded to highlighted items such as equity-settled share‑based payments, purchased intangible amortisation and transformation related costs. Interest income and expenditure are not allocated to segments, as this type of activity is driven by the central treasury function, which manages the cash position of the Group.
The table below shows Served Revenue for the four reportable segments. Served Revenue comprises external revenue billed directly by each reporting segment, plus revenue that the segment sells but does not bill, and less the revenue that the region bills but does not sell.
|
|
|
|
||
|
H1 2026 £’000 |
H1 2025 £’000 |
£’000 |
% |
|
|
UK & Ireland |
15,601 |
16,603 |
(1,002) |
(6%) |
|
Continental Europe |
10,487 |
10,646 |
(159) |
(2%) |
|
The Americas |
6,131 |
6,908 |
(777) |
(11%) |
|
APAC |
3,837 |
3,741 |
96 |
3% |
|
Served revenue |
36,056 |
37,898 |
(1,842) |
(5%) |
The table below represents revenue by Service Line:
|
|
Revenue by Service Line (unaudited) |
Change |
||
|
|
||||
|
H1 2026 £’000 |
H1 2025 £’000 |
£’000 |
% |
|
|
Transform |
3,680 |
3,851 |
(171) |
(4%) |
|
Media Performance |
24,166 |
25,573 |
(1,407) |
(6%) |
|
Contract Compliance |
3,781 |
3,982 |
(201) |
(5%) |
|
Govern |
27,947 |
29,555 |
(1,608) |
(5%) |
|
Grow |
4,429 |
4,492 |
(63) |
(1%) |
|
Total revenue by service line |
36,056 |
37,898 |
(1,842) |
(5%) |
No single customer (or group of related customers) contributes 10% or more of revenue.
The table below represents adjusted operating profit by reportable segment:
|
|
Adjusted Operating Profit (unaudited) |
Adjusted Operating profit margin (unaudited) |
||
|
|
H1 2026 |
H1 2025 |
H1 2026 |
H1 2025 |
|
|
£’000m |
£’000m |
% |
% |
|
|
|
|
|
|
|
UK & Ireland |
3,774 |
4,684 |
24% |
28% |
|
Continental Europe |
1,726 |
1,915 |
17% |
18% |
|
The Americas |
468 |
643 |
8% |
9% |
|
APAC |
309 |
149 |
8% |
4% |
|
Unallocated |
(3,944) |
(4,804) |
— |
— |
|
Total |
2,333 |
2,587 |
6.5% |
6.8% |
A reconciliation of segment adjusted operating profit to total profit/(loss) before tax is provided below:
|
|
Unaudited H1 2026 |
Unaudited H1 2025 |
|
|
£’000 |
£’000 |
|
Reportable segment adjusted operating profit |
6,277 |
7,391 |
|
Unallocated (costs)/income 1: |
|
|
|
Staff costs 2 |
(1,812) |
(1,887) |
|
Property and IT costs |
(1,221) |
(1,323) |
|
Exchange rate movements |
83 |
(37) |
|
Other administrative expenses |
(994) |
(1,557) |
|
Adjusted operating profit |
2,333 |
2,587 |
|
Highlighted items (note 3) |
(1,360) |
(9,377) |
|
Operating profit/(loss) |
973 |
(6,790) |
|
Net finance costs |
(561) |
(2,179) |
|
Profit/(loss) before tax – Total |
412 |
(8,969) |
- Unallocated (costs)/income comprise central costs that are not considered attributable to the segments.
- These are head office staff costs.
3. Highlighted items
Highlighted items comprise charges and credits which are highlighted in the income statement because separate disclosure is considered relevant in understanding the underlying performance of the business. These are used for the calculation of certain Alternative Performance Measures.
|
|
Unaudited H1 2026 £’000
|
Unaudited H1 2025 £’000 |
|
Share option charge |
150 |
143 |
|
Amortisation of purchased intangibles |
126 |
966 |
|
Impairment of goodwill and intangible assets |
— |
8,429 |
|
Severance and reorganisation costs |
547 |
1,306 |
|
Onerous lease provision/dilapidations provision |
(150) |
146 |
|
Revaluation of contingent consideration |
— |
(1,828) |
|
Acquisition and refinancing costs |
687 |
215 |
|
Total highlighted items before tax |
1,360 |
9,377 |
|
Taxation (credit)/charge |
(311) |
7 |
|
Total highlighted items |
1,049 |
9,384 |
The share option charge of £150,000 (30 June 2025: £143,000) reflects the expense for the period arising from the fair value of share options granted, recognised over the vesting period.
The amortisation charge for purchased intangible assets decreased in the period to £126,000 (30 June 2025: £966,000) due to the customer relationship and contract assets acquired through the acquisitions of MMi and MediaPath being fully amortised in H1 2025. The remaining purchased Intangible amortisation relates to the GMP license asset which was acquired through the acquisition of Media Path.
The Group recognised £nil impairment charge in the 6 months to 30 June 2026, with all regional CGU groups demonstrating sufficient headroom when compared against the carrying value. Please refer to note 5 for further details. The comparative £8,429,000 impairment comprised a goodwill impairment charge of £8,349,000 in respect of the Americas regional CGU group, and an R&D intangibles impairment of £80,000, whereby a piece of external development was brought in house.
Severance and reorganisation costs were £547,000 (30 June 2025: £1,306,000). The 2026 costs primarily relate to the implementation of a new consolidation system. The prior year costs arose from a divisional reorganisation and the departure of a member of the executive leadership team.
The £150,000 provision credit (30 June 2025: charge of £146,000) primarily reflects the release of the New York office dilapidations provision. Following discussions held with the landlord, the obligation was settled for £25,000, and the remaining provision was released, and in addition this balance also includes the derecognition of the related IFRS 16 lease liability upon the cessation of this lease. The prior year charge related to an onerous lease provision recognised in connection with the closure of the St Louis office in the Americas.
The contingent consideration credit of £1,828,000 recognised in the six months ended 30 June 2025 related to the revaluation of contingent consideration payable in respect of a historical acquisition. The related liability was settled in full during 2025.
Acquisition and refinancing costs were £687,000 (30 June 2025: £215,000), of which £442,000 relates to the costs associated with the amendment and extension of the Group’s revolving credit facility in April 2026. The remaining £245,000 relates to a loss recognised in the period.
The total tax credit of £311,000 (H1 2025: charge of £7,000) comprises a current tax credit of £320,000 (H1 2025: charge of £18,000) and a deferred tax charge of £9,000 (H1 2025: credit of £11,000).
4. Earnings per share
The calculation of basic and diluted earnings per share is based on the following data:
|
|
Unaudited H1 2026 |
Unaudited H1 2026 |
|
|
£’000 |
£’000 |
|
Earnings for the purpose of basic earnings per share, being net (loss) attributable to equity holders of the parent |
(419) |
(9,940) |
|
Adjustments: |
|
|
|
Impact of highlighted items (net of tax) 1 |
1,049 |
9,384 |
|
Earnings for the purpose of adjusted earnings per share |
630 |
(556) |
|
|
|
|
|
Number of shares: |
|
|
|
The weighted average number of shares during the period |
|
|
|
– basic |
138,970,471 |
138,312,316 |
|
– dilutive effect of share options |
893,957 |
1,812,662 |
|
– diluted |
139,864,428 |
140,124,978 |
|
Basic (loss) per share |
(0.30) |
(7.19) |
|
Diluted (loss) per share |
(0.30) |
(7.19) |
|
Adjusted basic earnings/(loss) per share 2 |
0.45 |
(0.40) |
|
Adjusted diluted earnings/(loss) per share 2 |
0.45 |
(0.40) |
1 Highlighted items attributable to equity holders of the parent (see note 3), stated net of their total tax impact.
2 Based on adjusted profit after taxation and minority interests.
5. Goodwill
|
|
|
£’000 |
|
Cost |
|
|
|
At 1 January 2026 |
|
49,600 |
|
Foreign exchange differences |
|
300 |
|
At 30 June 2026 |
|
49,900 |
|
Accumulated impairment |
|
|
|
At 1 January 2026 |
|
(23,841) |
|
Impairment charge |
|
— |
|
Foreign exchange differences |
|
(254) |
|
At 30 June 2026 |
|
(24,095) |
|
|
|
|
|
Net book value |
|
|
|
At 30 June 2026 |
|
25,805 |
|
At 31 December 2025 |
|
25,759 |
Impairment trigger
The Group tests goodwill annually for impairment, or more frequently if there are indications that goodwill may be potentially impaired. Goodwill is allocated to the Group’s cash generating units (‘CGUs’) to carry out impairment tests. The Group is managed on a regional basis, and as such, the 13 historical underlying CGUs are aggregated into 4 regional CGU groups: The Americas, United Kingdom, Continental Europe, and APAC. The goodwill and purchased intangibles associated with the Americas regional CGU group were fully impaired at the 31 December 2025 year end.
Management considered internal and external sources of information to determine if there were potential indicators of impairment for each of the remaining regional CGU groups at 30 June 2026. For both Continental Europe and APAC, management identified that there was an indication of potential economic underperformance when comparing the full year outlook against the board approved budget. Both CGU groups have incurred impairment charges in recent financial periods, and as such, management deemed it appropriate to run the full impairment assessment at H1 2026. There were no such indicators of impairment for the United Kingdom CGU group, and as such, the full impairment assessment was not completed for this region.
Impairment assessment
The impairment test involves comparing the carrying value of the CGU to which the goodwill has been allocated to the recoverable amount. The recoverable amount of the remaining CGUs has been determined based on value in use calculations.
Under IFRS, an impairment charge is required for goodwill when the carrying amount exceeds the recoverable amount, defined as the higher of fair value less costs to sell and value in use. Both the Continental Europe and APAC regional CGU groups demonstrated sufficient headroom when compared against the carrying value, which resulted in no impairment charge being recognised at 30 June 2026.
The Group’s remaining carrying value of goodwill by regional CGU at 30 June 2026 was as follows:
|
|
|
|
|
|
|
|
|
|
30 June |
31 December |
|
|
|
|
2026 |
2025 |
|
Regional CGU |
|
£’000 |
£’000 |
|
|
The Americas |
|
— |
— |
|
|
United Kingdom |
|
14,296 |
14,301 |
|
|
Continental Europe |
|
|
9,534 |
9,582 |
|
APAC |
|
|
1,975 |
1,876 |
|
Total |
|
|
25,805 |
25,759 |
Value in use calculations
The key assumptions used in management’s value in use calculations are budgeted operating profit, pre‑tax discount rates and long-term growth rates.
Budgeted operating profit assumptions
To calculate future expected cash flows, management has taken the earnings before interest, tax, depreciation and amortisation (‘EBITDA’) for each of the Regional CGU Groups for the 2026 financial year as per the 2026 forecast. For the 2027 and 2028 financial periods, the forecast EBITDA is based on management’s plans and market expectations. The forecast 2028 balances are taken to perpetuity in the model. The forecasts for 2027 and 2028 use certain assumptions to forecast revenue and operating costs within the Group’s operating segments.
Discount rate assumptions
To calculate the recoverable amount for each regional group of CGUs, the cash flows are discounted at a rate specific to each CGU. The factors considered in calculating the discount rate include the risk-free rate (based on government bond yields), the equity risk premium, the Beta and a smaller quoted company premium. The cash flow forecasts have been discounted at the following pre-tax rates:
|
Regional CGU group |
30 June 2026 |
31 December 2025 |
|
Continental Europe |
13.27%-18.36% |
13.96%-17.26% |
|
APAC |
12.84%-16.34% |
14.48%-16.36% |
Growth rate assumptions
For cash flows beyond the three-year period, a growth rate of 2.0% (2025: 2.0%) has been assumed for all regional CGUs. This rate is based on factors such as economists’ estimates of long-term economic growth in the markets in which the Group operates.
Sensitivity analysis
The Group’s calculations of value in use for the regional CGU groups are sensitive to a number of key assumptions. As such, management have run stress-testing scenarios to determine the impact of assumption changes to pre-tax discount rates, and revenue and cost growth rates.
Management ran a downside scenario, which applied a 5% revenue reduction against the FY2026 base case, with no cost mitigation. FY2027 applied a 5% revenue reduction against the base case, with year on year staff cost savings of 0.7%. The FY2028 projection applied a 5% revenue reduction against the base case, with a year on year staff cost increase of 1.8%. All other inputs and assumptions remained unchanged. The result of this showed no indicative impairment for both the Continental Europe and APAC CGU groups.
The above sensitivities indicate management’s assessment of reasonably plausible, material changes to assumptions.
6. Other intangible assets
|
|
Capitalised development costs |
Computer software |
Purchased intangible assets 1 |
Total intangible assets |
|
|
£’000s |
£’000s |
£’000s |
£’000s |
|
Cost |
|
|
|
|
|
At 1 January 2026 |
13,859 |
1,673 |
11,012 |
26,544 |
|
Additions 2 |
953 |
7 |
— |
960 |
|
Foreign exchange |
— |
(3) |
(4) |
(7) |
|
At 30 June 2026 |
14,812 |
1,677 |
11,008 |
27,497 |
|
|
|
|
|
|
|
|
|
|
|
|
|
Amortisation |
|
|
|
|
|
At 1 January 2026 |
(10,982) |
(1,657) |
(9,713) |
(22,352) |
|
Charge for the period 3 |
(936) |
(10) |
(126) |
(1,072) |
|
Foreign exchange |
— |
2 |
4 |
6 |
|
At 30 June 2026 |
(11,918) |
(1,665) |
(9,835) |
(23,418) |
|
|
|
|
|
|
|
|
|
|
|
|
|
Net book value |
|
|
|
|
|
|
|
|
|
|
|
At 30 June 2026 |
2,894 |
12 |
1,173 |
4,079 |
|
At 31 December 2025 |
2,877 |
16 |
1,299 |
4,192 |
1 Purchased intangible assets is a GMP licence asset with a useful life of 10 years.
2 The consolidated cash flow statement shows £800,000 for these items compared to the additions number above of £960,000 due to some of the current period additions remaining unpaid at the period end.
3 Amortisation is charged within other operating expenses to write off the cost of the intangible assets over their estimated useful lives. The amortisation of purchased intangible assets is included as a highlighted expense, refer to note 3.
7. Cash, cash equivalents, and restricted cash
Cash and cash equivalents include the following for the purposes of the cash flow statement:
|
|
30 June 2026 |
30 June 2025 |
31 December 2025 |
|
|
£’000 |
£’000 |
£’000 |
|
Cash and cash equivalents |
7,576 |
8,866 |
9,489 |
|
Restricted cash 1 |
1,215 |
1,084 |
1,086 |
|
Cash, cash equivalents, and restricted cash |
8,791 |
9,950 |
10,575 |
1 Cash and cash equivalents of £1,215,000 (30 June 2025: £1,084,000) are held in Ebiquity Russia OOO, with restrictions on remittances to certain countries. These balances may not be readily available to the wider Group but can be used to meet Ebiquity Russia OOO’s obligations within Russia as they fall due. This balance has been translated at the spot rate at 30 June 2026 of £1: RUB102.85 (30 June 2025: £1: RUB107.61).
8. Accruals and Contract liabilities
|
|
30 June 2026 |
30 June 2025 |
31 December 2025 |
|
|
£’000 |
£’000 |
£’000 |
|
Accruals and contract liabilities due within one year |
|
|
|
|
Accruals |
4,577 |
4,921 |
4,343 |
|
Contract liabilities 1 |
6,166 |
6,133 |
7,281 |
|
Accruals and Contract liabilities |
10,743 |
11,054 |
11,624 |
|
Non-current liabilities |
|
|
|
|
Contract liabilities 1 |
149 |
— |
— |
|
|
|
|
|
1Contract liabilities relate to amounts invoiced to customers in advance of the satisfaction of a performance obligation.
9. Financial liabilities
|
|
30 June 2026 |
30 June 2025 |
31 December 2025 |
|
|
£’000 |
£’000 |
£’000 |
|
Current |
|
|
|
|
Contingent consideration 1 |
— |
798 |
— |
|
Other financing arrangement 2 |
62 |
57 |
59 |
|
|
62 |
855 |
59 |
|
Non-Current |
|
|
|
|
Bank borrowings |
22,650 |
24,000 |
22,650 |
|
Loan Fees 3 |
(177) |
(96) |
(69) |
|
Other financing arrangement 2 |
— |
62 |
— |
|
|
22,473 |
23,966 |
22,581 |
|
Total financial liabilities |
22,535 |
24,821 |
22,640 |
|
|
|
|
|
|
1 Contingent consideration relates to a historical acquisition and was settled in full in 2025. 2 The financing arrangement is for an IT software licence which expires in Q4 2026. 3 Loan fees were payable on amending the banking facility and are amortised to the income statement on a straight-line basis until the maturity date of the facility in October 2027. |
|
|
|
|
|
Bank Borrowings |
Other financing arrangement |
Total |
||||
|
|
|
£’000 |
£’000 |
£’000 |
||||
|
At 1 January 2026 |
|
22,581 |
59 |
22,640 |
||||
|
Paid |
|
(210) |
— |
(210) |
||||
|
Amortised in income statement |
|
102 |
3 |
105 |
||||
|
At 30 June 2026 |
|
22,473 |
62 |
22,535 |
||||
|
|
|
|
|
|
||||
|
|
|
|
|
|
||||
All bank borrowings are held jointly with Barclays and NatWest. During April 2026 the revolving credit facility was amended and extended. The revised facility is for £28.0 million and matures in October 2027. There are no annual reductions in the facility. £22.65 million had been drawn as at 30 June 2026 (30 June 2025: £24.0 million). The drawings are repayable on the maturity of the facility.
The facility may be used for deferred consideration payments on past acquisitions, to fund future potential acquisitions, and for general working capital requirements. The quarterly covenants are as follows:
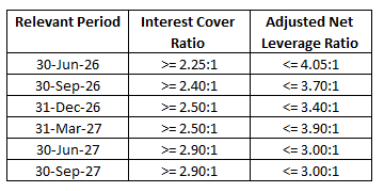
Loan arrangement fees of £210,000 were settled in the period; £177,000 of these fees remain on the statement of financial position as at 30 June 2026, (30 June 2025: £96,000). These fees are offset against the term loan and are amortised over the period of the loan.
The facility bears variable interest at the SONIA rate plus a margin ranging from 2.75% to 3.35%, depending on the Group’s adjusted net leverage ratio.
The undrawn amount of the revolving credit facility is liable to a fee of 40% of the prevailing margin. The Group may elect to prepay all or part of the outstanding loan, by giving five business days’ notice.
All amounts owing to the bank are guaranteed by way of fixed and floating charges over the current and future assets of the Group. As such, a composite guarantee has been given by all significant subsidiary companies in the UK, Ireland, USA, France, Germany, Denmark and Sweden.
10. Dividends
No dividend was declared or paid for the six months ended 30 June 2026 (30 June 2025: £nil).
11. Cash generated from operations
|
|
Unaudited 6 months ended 30 June 2026 |
Unaudited 6 months ended 30 June 2025 |
Audited Year ended 31 December 2025 |
|
£’000 |
£’000 |
£’000 |
|
|
Profit/(loss) before taxation |
412 |
(8,969) |
(12,061) |
|
Adjustments for: |
|
|
|
|
Depreciation |
650 |
723 |
1,479 |
|
Impairment of right of use assets |
— |
— |
10 |
|
Amortisation (note 6) |
1,072 |
1,941 |
3,105 |
|
Loan fees written off |
55 |
100 |
100 |
|
Loss on disposal |
245 |
1 |
2 |
|
Unrealised foreign exchange (gain)/loss |
(341) |
1,186 |
1,380 |
|
Provision adjustments |
(177) |
146 |
150 |
|
Impairment of goodwill & Intangibles |
— |
8,429 |
10,120 |
|
Share option charges |
161 |
126 |
253 |
|
Finance income |
(56) |
(72) |
(125) |
|
Finance expenses |
962 |
1,057 |
2,160 |
|
MtM revaluations on derivatives |
— |
— |
32 |
|
Contingent consideration revaluations |
— |
(1,828) |
(1,799) |
|
Operating cash inflow before movements in working capital and provisions |
2,983 |
2,839 |
4,806 |
|
(Increase)/decrease in trade and other receivables |
(256) |
2,908 |
5,815 |
|
Decrease in trade and other payables (including accruals and contract liabilities) |
(2,480) |
(1,869) |
(307) |
|
Movement in provisions |
— |
24 |
30 |
|
Working capital and provisions |
(2,736) |
1,063 |
5,538 |
|
Cash generated from operations |
247 |
3,902 |
10,344 |
12. Share Capital
|
|
|
Nominal |
|
|
Number |
value |
|
|
of shares |
£’000 |
|
Allotted, called up, and fully paid |
|
|
|
At 1 January 2025 – ordinary shares of 25p |
140,572,122 |
35,143 |
|
Shares issued |
679,158 |
170 |
|
Share options exercised |
5,000 |
1 |
|
At 31 December 2025 – ordinary shares of 25p |
141,256,280 |
35,314 |
|
Shares returned |
(40,749) |
(10) |
|
At 30 June 2026 – ordinary shares of 25p |
141,215,531 |
35,304 |
Ordinary shares carry voting rights and are entitled to share in the profits of the Company (dividends).
The 679,158 shares issued during 2025 relate to the discharge of the final contingent consideration payable for the acquisition of Media Management LLC in 2022.
In March 2026 the Company entered into an amendment to the terms of the securities purchase agreement dated 29 March 2022 relating to the acquisition of the whole of the issued share capital of Media Management LLC (‘MMi Acquisition’). To ensure that ordinary shares issued in part payment of the deferred consideration due in respect of the MMi Acquisition (‘Earn-Out Shares’) were not issued at the market price then prevailing of 23.5p per ordinary share, this amendment agreement sets the nominal value of the ordinary shares as the minimum price for such Earn-Out Shares and adjusts the cash element of the deferred consideration accordingly. Pursuant to the amendment agreement, 40,749 Earn‑Out Shares were returned to the Company for nil consideration and cancelled.
At the period end, 7,917,129 share options were outstanding (30 June 2025: 10,457,269).
13. Related party transactions
The Group has a related party relationship with its subsidiaries and key management personnel, including Directors and Executive Committee members.
Transactions between the Company and its subsidiaries, or between subsidiaries, have been eliminated on consolidation and are not disclosed in this note.
Transactions with companies related to key management personnel
There were no such transactions with companies related to key management personnel in the period to 30 June 2026 or in the comparative period to 30 June 2025.
RNS may use your IP address to confirm compliance with the terms and conditions, to analyse how you engage with the information contained in this communication, and to share such analysis on an anonymised basis with others as part of our commercial services. For further information about how RNS and the London Stock Exchange use the personal data you provide us, please see our Privacy Policy.

Latest directors dealings
- 26 minutes ago Smiths Group
- 41 minutes ago Kingfisher
- 41 minutes ago Renishaw
- 51 minutes ago Arbuthnot Banking Group
- 1 hour ago JPMorgan Emerging Markets Growth & Income plc