
Final Results
Summary by AI BETAClose X

|
One Waterside Drive Arlington Business Park Reading Berks RG7 4SW
15 July 2026
|
|

COHORT PLC
("Cohort" or "the Group")
PRELIMINARY RESULTS
FOR THE YEAR ENDED 30 APRIL 2026
Record revenue and adjusted operating profit, ahead of expectations
Cohort plc today announces its audited results for the financial year ended 30 April 2026.
|
|
2026
|
2025
|
%
|
|
Revenue |
£306.4m |
£270.0m |
13 |
|
Adjusted operating profit1 |
£36.3m |
£27.5m |
32 |
|
Adjusted earnings per share2 |
61.9p |
54.4p |
14 |
|
Net funds3 |
£2.2m |
£5.3m |
|
|
Order intake |
£314.2m |
£284.7m |
10 |
|
Order book (closing) |
£618.8m |
£616.4m |
|
|
Proposed final dividend per share |
12.10p |
11.05p |
10 |
|
Total dividend per share |
17.90p |
16.30p |
10 |
|
Statutory
|
2026
|
2025
|
%
|
|
Statutory profit before tax |
£32.6m |
£25.6m |
27 |
|
Basic earnings per share |
52.2p |
45.1p |
16 |
Highlights - Record revenue, adjusted operating profit and closing order book:
· Adjusted operating profit of £36.3m (2025: £27.5m) on revenue of £306.4m (2025: £270.0m). Improved net margin of 11.8% (2025: 10.2%).
· Adjusted earnings per share up by 14%.
· Order intake up by 10% at £314.2m (2025: £284.7m), again exceeding revenue for the year.
· Record order book of £618.8m with deliveries extending out to 2037.
· Dividend growth of 10%; the dividend has been increased every year since the Group's IPO in 2006.
Operational Highlights
· Sensors and Effectors delivered a flat revenue performance, and the resulting adjusted operating profit was slightly lower than in 2024/25.
· Communications and Intelligence delivered a much stronger profit performance on a 27% increase in revenue, including a strong first full year contribution from EM Solutions.
· Banking facility renewed just before the year end, tripling the size of our facility to £175m, with an additional £50m accordion, providing significant financial flexibility to fund investment and growth.
Looking forward - Record order book and encouraging pipeline underpinning growth expectations:
· Record closing order book underpins 83% of current market revenue expectations for 2026/27. Following contract wins since the year end, this now stands at 88%.
· Encouraging pipeline of order opportunities for the current year, providing a positive outlook for organic growth in the years ahead and supporting our mid-term aim to improve net margins to a mid-teens percentage.
· As stated in the 2025 Preliminary Results, we continue to target double-digit earnings growth in each of 2026/27 and the subsequent two years.
· In the same period, and with the increased working capital variability reflecting more significant project milestones, we expect to generate cashflow of around £120m before capital expenditure and dividends.
1 Excludes amortisation of other intangible assets, research and development expenditure credits, exceptional costs and non-trading exchange differences, including marking forward exchange contracts to market.
2 Excludes amortisation of other intangible assets, exceptional costs and non-trading exchange differences, including marking forward exchange contracts to market.
3 Cash and cash equivalents less bank borrowings excluding IFRS 16 lease liabilities.
Andrew Thomis, Chief Executive of Cohort plc, said:
"Cohort continues to see strong demand for our products and services from both our domestic and export customers, reflecting our strong and relevant offerings in NATO Europe and elsewhere. Overall demand has been driven by the conflicts in Ukraine and the Middle East, persistent tensions in the Asia-Pacific Region and pressure from the United States administration on the other members of NATO to increase their defence spending. We are also encouraged by the UK DIP's emphasis on relevant technology areas including the hybrid navy, Atlantic Bastion, and protection of underwater infrastructure.
Our trading performance and earnings were ahead of consensus market expectations, driven by very strong performance in our Communications and Intelligence division. Order intake continued at the high levels we have seen over the last three years, and the resulting record order book of almost £620m gives us a solid base for 2026/27 and beyond. We see good prospects for further order intake in the year ahead, providing a solid platform to continue our growth momentum."
A meeting is being held today for institutional analysts, hosted by Andy Thomis, Chief Executive, and Simon Walther, Finance Director, from 09.00 for a 09:30 start (UK times). Please contact MHP via cohort@mhpgroup.com if you wish to attend.
For those unable to attend in person, there will be a recording of the presentation available on Cohort's website after the meeting: https://www.cohortplc.com/investors/results-reports-presentations
Investor Presentations
Chief Executive Andy Thomis and Finance Director Simon Walther will be presenting at an investor webinar hosted by Equity Development on Friday, 17th July at 15:00. Registration is free and questions can be submitted during the presentation which will, if possible, be addressed at the end of it. A recording will also be made available afterwards.
To attend the event, please register at https://us06web.zoom.us/webinar/register/WN_Ky1mhd4WSGGQz6tXEF6TGA#/registration
ENDS
For further information please contact:
|
Cohort plc |
0118 909 0390 |
|
|
Andrew Thomis, Chief Executive |
|
|
|
Simon Walther, Finance Director Kellie Young, Group Head of Investor Communications and Events |
|
|
|
|
|
|
|
Investec Bank Plc (Financial Adviser, Nominated Adviser, and Corporate Broker) |
020 7597 5970 |
|
|
Carlton Nelson, Christopher Baird, Charlotte Young |
|
|
|
|
|
|
|
MHP |
07817 458804 |
|
|
Reg Hoare, Ollie Hoare, Hugo Harris |
||
NOTES TO EDITORS
Cohort plc (www.cohortplc.com) is the parent company of seven innovative, agile and responsive businesses based in the UK, Australia, Germany and Portugal, providing a wide range of services and products for domestic and export customers in defence and related markets.
Cohort (AIM: CHRT) was admitted to London's Alternative Investment Market in March 2006. It has headquarters in Reading, Berkshire and employs in total over 1,700 staff there and at its other operating company sites across the UK, Australia, Germany, and Portugal.
The group reports through two segments - Communications and Intelligence, and Sensors and Effectors:
Communications and Intelligence
· EID designs and manufactures advanced communications systems for naval and military customers. Cohort acquired a majority stake in June 2016. www.eid.pt
· EM Solutions designs, assembles, tests, and supports satellite communications on-the-move terminals for defence and government customers. Acquired by Cohort in January 2025. www.emsolutions.com.au
· MASS is a specialist data technology company serving the defence and security markets, focused on electronic warfare, digital services, and training support. Acquired by Cohort in August 2006. www.mass.co.uk
· MCL designs, sources, and supports advanced electronic and surveillance technology for UK end users including the MoD and other government agencies. MCL has been part of the Group since July 2014. www.marlboroughcomms.com
Sensors and Effectors
· Chess Dynamics offers surveillance, tracking and fire-control systems to the defence and security markets. Chess has been part of the Group since December 2018. www.chess-dynamics.com
· ELAC SONAR supplies advanced digital sonar systems and underwater communications to global customers in the naval marketplace. Acquired by Cohort in December 2020. www.elac-sonar.de
· SEA delivers and supports technology-based products for the defence market. Acquired by Cohort in October 2007. www.sea.co.uk
Chief Executive's Report
Demand, especially from international markets, continues to grow
"Cohort continues to see strong demand for our products and services from both domestic and export customers."
Andrew Thomis
Group Chief Executive
Introduction
Following a record 2024/25 the Group saw a further increase in performance for 2025/26, delivering record revenue and adjusted operating profit and earnings per share. A year of strong order intake, a record closing order book and a positive net cash position at the year end provide the Group with a solid platform to continue its growth momentum.
Overall, our trading performance and earnings were ahead of consensus market expectations, driven by a very strong performance in our Communications and Intelligence division. Order intake continued at the high levels we have seen over the last three years, and the resulting record order book of just under £620m gives us a solid base for 2026/27 and beyond. Cohort continues to see strong demand for our products and services from both domestic and export customers. We see good prospects for further order intake in the year ahead.
Market context
The continuing war in Ukraine, persistent tensions in the Asia-Pacific region and the recent conflict in the Middle East have combined to create a strong impetus for defence spending across the globe. This has been accelerated by the policies of the United States administration, which has pressed the other members of NATO to increase their defence spending plans. The NATO summit in June 2025 set a target for members of at least 3.5% of GDP to be spent on core defence by 2035, compared with the prior target of 2.0%. US policies towards Canada and Denmark have led them and other countries to seek to reduce their reliance on US defence equipment, resulting in increasing demand for UK and European technology.
Our European allies are increasing their defence spending rapidly, with 2025 defence expenditure for the region growing some 14% compared to the prior year, and Germany's defence expenditure exceeding 2% of GDP for the first time since the early 1990s. Our revenues from NATO Europe have continued to grow. The UK also recognises the need to invest in proactive deterrence of potential threats and has recently announced a Defence Investment Plan (DIP) that includes an additional £15 billion of funding. This goes only some way towards meeting the UK's needs but provides a foundation to build on towards the ambition set out by the Strategic Defence Review.
At Cohort, we are encouraged by the DIP's emphasis on relevant technology areas including the hybrid navy, Atlantic Bastion and protection of underwater infrastructure. The commitment to funding for the development of weapon and sensor payloads for uncrewed vessels under AUKUS Pillar 2 is also welcome. The DIP announcement included a new £50bn export facility that we see as positive news and that will support growth and employment within the UK defence industry.
In Australia and Canada, we have seen increasing demand for naval systems. Activity in both Southeast Asia and South America continues to be robust, again dominated by demand for naval systems. We expect that the recent conflict in the Middle East will also drive increased investment in defence for this region, both for naval systems and countermeasures against drones and missile threats. The Group has strong and relevant offerings in these areas.
Our continuing expansion in export and overseas domestic markets has resulted in the Group's proportion of revenue derived from the UK MOD reducing to 40% (2025: 50%), the lowest since Cohort was founded twenty years ago. The UK remains our largest market, but this diversification of the Group's sources of revenue provides us with access to growing markets and reflects our strong product offering and our international market presence.
Performance overview
The Group achieved a record adjusted operating profit of £36.3m (2025: £27.5m) on record revenue of £306.4m (2025: £270.0m), ahead of market expectations, representing increases of 32% and 13% respectively on the prior year. The growth was driven by the full-year contribution of EM Solutions and good performance by MASS in the Communications and Intelligence division, with performance in the Sensors and Effectors division a little behind that achieved in 2024/25. Adjusted earnings per share increased by 14% to 61.9p (2025: 54.4p).
The Group's IFRS operating profit of £34.6m (2025: £26.1m) is after amortisation of intangible assets, exceptional items, research and development credits and movements on foreign exchange, including marking foreign exchange contracts to market.
The Group's closing net funds of £2.2m (2025: £5.3m) reflected very strong operating cash flow in the second half of the financial year, turning around a £32.5m net debt position at 31 October 2025. In the course of the year we completed the build of ELAC SONAR's new facility in Germany, part of a total capital expenditure for the year of £18m (2025: £13m) and saw an increase in working capital, especially on the Italian sonar project and satellite communications programme for the Royal Australian Navy.
The Group delivered another year of strong order intake, winning £314.2m of orders (2025: £284.7m), representing just over 1.0x full year revenue (2025: 1.1x). That has resulted in a record closing order book of £618.8m (2025: £616.4m).
Revenue delivery from our strong order book now stretches out to 2037. This reflects the significant naval orders the Group has secured over the last few years, which are typically long-term in nature. We expect our future order book to extend even further as naval investment around the world continues.
In the land domain, we are seeing increased demand for drone and counter-drone systems, driven by the Ukraine conflict and, more recently, by events in the Middle East. The attacks on shipping in the Straits of Hormuz show that drone defence is not only needed in the land environment. Other areas of increased demand include secure communications and electronic warfare.
The proportion of the Group's revenue derived from maritime customers, 65% in 2026 (2025: 53%), continues to grow. The sales to land and maritime domains now account for over 84% of the Group revenue (2025: 80%). As expected, our non-defence revenue, which was around 6% of the Group's overall revenue for the last few years, has fallen to just over 1% in 2025/26 and we expect this to remain at a low level.
Strategic progress
The Group's strategic objective is to deliver earnings growth both organically and through acquisition. In pursuit of this aim we have invested in product development, facilities and acquisitions. We have also recruited a Chief Operating Officer at Group level, Chris Axcell, who has joined us from a senior role at Leonardo. Chris's role will be to support all our businesses on matters related to operations and production, increasingly important areas as our production volumes continue to grow. He will also take day-to-day responsibility for the Group's relationship with the leaders of certain of our businesses, freeing me to spend more time on other aspects of the Chief Executive role.
Strategic highlights in the past year include the following.
Product development
As demand for maritime systems has grown, the Group has invested in new products in several different areas, an investment supplemented by customer-funded development contracts. Total expenditure on research and development in 2025/26 was £31.1m (2024/25 £20.1m). EID has completed the development of the seventh generation of its Integrated Communications Control System, which is now being supplied to the Portuguese Navy. ELAC SONAR has developed and demonstrated its Enlitor system for detection of threats to underwater infrastructure and is completing the development of its Erazor product, which is designed to neutralise such threats. EM Solutions has commenced the design of a new multi-band, multi-orbit satellite terminal aimed at the large market of mid-sized naval ships.
Facilities investment
Growing demand has created a need for renewal, expansion or replacement of several Group facilities. ELAC SONAR's new facility at Holtenau, Kiel was completed in 2024/25. At a cost of £21m, and completed on time and to budget, this provides a significantly improved environment for ELAC SONAR's engineering teams and a flexible production space well-suited to ELAC SONAR's complex operations. We are at the planning stage for a new single building for Chess Dynamics' operations in Horsham, currently split over 13 separate buildings. The new facility will significantly increase production capacity and simplify operations. EID is in negotiations with its landlord at Lazarim, Portugal, to implement significant enhancements to its facility, improving the working environment and increasing production capacity. We have also invested in ERP systems to improve efficiency at Chess and EID.
Acquisitions
The Group acquired EM Solutions and ITS in 2024/25. At EM Solutions we have recruited a number of new senior employees including a finance director and a sales director. Having inherited a dual-MD structure, we have appointed John Logan as the sole managing director. EM Solutions participates in the Group's quarterly executive meetings and has formed a partnership with EID to support its products in Portugal.
The Group reviewed a number of acquisition opportunities in 2025/26, which did not meet our criteria. We continue to review new opportunities and, where appropriate, discuss these with the asset owners.
Capital allocation
Our capital allocation policy reflects our strategic investment activities, set out above, and shareholder return. The three elements of our capital allocation policy are:
1. Investment in research and development, and the capital requirements of the business, to support our continued organic growth. A combined investment of £49m in 2025/26 (2024/25: £34m).
2. Complementary acquisitions driving growth in core areas where the Group can leverage industry knowledge. We did not execute any new transactions in 2025/26, but our new bank facility enhances our ability to deliver this strand of our strategy.
3. A progressive dividend policy. We recognise that whilst we aim to achieve earnings growth, dividends are important to many of our shareholders. Our dividend policy also sends a clear signal that we are both profitable and cash-generative business. Subject to approval of the final dividend at the Group's AGM, a further increase of 10% will be implemented this year. The Group has increased its dividend every year since IPO in 2006.
The Group has seen significant movements in working capital through the year, with an operating outflow of £29.1m in the first half-year offset by an inflow of £43.7m in the second half. As the Group takes on larger contracts, with commensurately large associated payments and receipts, we expect this trend to continue. In the past 5 years the Group has generated an overall operating cash flow of £142m, applying this to capital purchases (£45m), own funded research and development (£16m), acquisitions (£41m, net of share placing proceeds) and dividends (£30m). Our newly renegotiated £175m bank facility enables us to manage these fluctuations, as well as providing access to funding to support growth.
Outlook
We continue to see strong demand, driven by conflict in Ukraine and the Middle East, persistent tensions in the Asia-Pacific Region and the policies of the United States administration. Revenue from NATO Europe has increased significantly in the year, driven by increasing defence budgets.
Our order book underpins approximately £264m of 2026/27 revenue (2025/26: £230m), representing 83% of consensus expectations for the year. Following contract wins since the start of the financial year that cover now stands at 88%.
The Group's operating margin improved to 11.8% this year (2025: 10.2%) and we expect this to continue to improve in the coming year to low-teens percentage and onwards to our target of mid-teens percentage by the end of this decade.
With the underpinning of our strong order book, we continue to target double-digit earnings growth in each of 2026/27 and the subsequent two years. In the same period, we expect to generate cashflow before capital expenditure and dividends of around £120m.
Andrew Thomis
Group Chief Executive
Operating review
Communications and Intelligence
Highlights
· Revenue - £158.9m (2025: £124.9m)
· Adjusted Operating Profit - £32.4m (2025: £21.1m)
· Net Cashflow generated from operations - £36.1m (2025: £24.2m)
· Order intake - £186.0m (2025: £136.3m)
· Headcount - 709 (2025: 641)
Progress
Communications and Intelligence delivered a much stronger profit performance on a 25% increase in revenue. This was due to a strong full year contribution from EM Solutions with a net margin of over 25%. MASS also grew by nearly 20%, achieving annual revenue of over £50m for the first time and a net margin of 20%. EID had a very good year of securing orders, enhancing its long-term revenue visibility, but its operating performance was slightly behind last year's due to delays in completing a project for the Portuguese Army. We expect this to be resolved in the coming financial year. MCL's performance was behind its record 2024/25 performance, reverting to a more typical volume level, but still delivering a result which was ahead of our expectations.
Order intake at Communications and Intelligence was stronger than last year, representing 117% of its annual revenue for 2025/26 (2025: 109%). MASS's order intake, at over £50m, was significantly stronger than last year. EM Solutions' order intake was £50.3m in the year, a similar level to its revenue. A very strong performance was also achieved at EID where order intake at £48.7m was 220% of its revenue.
This division saw orders ultimately intended for UK MOD of £60.1m (2025: £81.6m). This is dominated by MCL and MASS. The other significant order intake in this division was from Portugal of £39.6m (2025: £45.2m) at EID and £19.6m from Australia at EM Solutions. Orders from other European countries (driven by EM Solutions with significant orders from the Netherlands and Norwegian defence ministries) accounted for £34.4m (2025: £4.4m) and orders from Asia Pacific and Africa amounted to £23.0m (2025: nil).
Outlook
The Communications and Intelligence division enters 2026/27 with £127.8m (2025: £104.7m) of its revenue on order. The pipeline of opportunities remains strong with opportunities in Australia, Portugal, other NATO Europe markets and the Middle East. We expect the division to grow again in the coming year, delivering a net margin close to 20%.
Sensors and Effectors
Highlights
· Revenue - £147.5m (2025: £145.1m)
· Adjusted Operating Profit - £10.5m (2025: £12.7m)
· Net Cashflow generated from operations - £3.4m (2025: £42.9m)
· Order intake - £128.2m (2025: £148.4m)
· Headcount - 986 (2025: 959)
Progress
The Sensors and Effectors division delivered a flat revenue performance and the resulting adjusted operating profit was slightly lower than in 2024/25. Revenue was higher at Chess and ELAC SONAR, whilst SEA was lower following the disposal of its Transport business in June 2025.
The lower net profit in this division was due to several factors:
1. In SEA, a weaker mix due to disposal of the Transport business and some low margin legacy projects. We expect to complete the majority of the latter in the first half of 2026/27.
2. We continued to recognise margin at a level appropriate to the development phase of the sonar suite for new Italian submarines. We expect to complete the delivery of the first boat systems by the end of the 2026 calendar year. At that stage we may be able to begin to retire some risk and recognise a higher margin on the project.
3. Chess delivered a small profit, slightly better than its breakeven performance in 2024/25, but below our expectations for the year. Further changes were made to the senior management team in the second half of the financial year and we expect Chess to start to deliver a better net margin in 2026/27, although mostly in the second half.
Order intake at Sensors and Effectors was 89% of its 2025/26 annual revenue (2025: 102%).
Chess won significant orders for European customers, both for counter-drone systems and naval control systems. SEA won orders in the Maritime domain, especially for torpedo launcher systems and Krait arrays, all in export markets. UK order intake was £41.3m (2025: £40.8m), and from other domestic markets (namely Germany) was £11.7m, whilst export orders totalled £75.3m (2025: £93.0m). We continue to see good prospects in the Maritime domain for our products, especially in export markets, as well as our domestic markets.
In the Land domain, order intake was dominated by export (41%, 2025: 26%), much of it being European, especially from Chess which secured around £21m (2025: £28m) of European export orders with good prospects into future years.
Outlook
Looking forward, this division is well underpinned for 2026/27 with £135.9m (2025: £124.6m) of revenue on order at 30 April 2026. The significant order book and good prospects give us confidence that this division will grow in the coming year, improving its net margin to above 10%.
The recent operating performance of this division has been below our expectations, mostly due to Chess. We have made changes and with support from the Group's newly appointed Chief Operating Officer, we expect Chess's performance to improve materially in the next few years. We plan to invest around £15m in a new facility for Chess, close to its current site in Horsham, to enable it to improve operational efficiency and to deliver the expanding demand we expect, especially for counter-drone systems. This move is likely to complete in the second half of 2027/28.
The pipeline for this division remains strong with prospects in NATO Europe, both land and maritime systems, as well as naval systems in Southeast Asia and South America.
Andrew Thomis
Group Chief Executive
Financial review
Record operating performance
"Record revenue, adjusted operating profit and earnings per share. Record closing order book stretches out to 2037."
Simon Walther
Finance Director
Introduction
2025/26 was another record year for the Group. We achieved over £300m of revenue and order intake and delivered close to 12% net margin, a key step on our objective of mid-teens net margin by the end of this decade. The Group's banking facility was renewed just before the year end, tripling the size of our facility and widening our supporting banks from three to seven. This provides the Group with significant financial flexibility to finance its organic investment and acquisitive growth.
Revenue analysis
The Group reports its segmental revenue through its two divisions, Communications and Intelligence and Sensors and Effectors.
In the tables below we also provide revenue breakdowns by:
1. Market (and geography);
2. Product or service; and
3. User domain, i.e. Maritime, Land, Air and Space, Joint and Strategic, Cyber and Security, or Other
The Group revenue is dominated by defence and security customers with £303.0m (2025: £255.6m) delivered to these markets, 99% of Group revenue (2025: 95%).
The growth in Group revenue has been driven by an increase in export activity, and deliveries to our domestic customers in Germany and Australia, the latter reflecting a full year of ownership of EM Solutions. UK MOD revenue decreased to £123.6m (2025: £134.0m), and as a proportion of Group revenue was 40% (2025 50%).
Export defence revenue grew by 27% (2025: 22%), increasing as a proportion of overall revenue from 32% last year to 36% this year.
The Group continues to derive the largest proportion of its revenue from products (hardware and/or software). The increase in the absolute revenue this year was driven by a full year contribution by EM Solutions offsetting the expected reduction at MCL from its record deliveries last year. The services proportion of the Group's revenue decreased from last year due to the continued increase in product sales. In absolute terms, service revenue increased very slightly to £63.5m (2025: £62.6m), 21% of Group revenue (2025: 23%). In the past, the service revenue for the Group was around 40%, but this has continued to fall as a proportion of the Group revenue as the product and systems activity has increased. We continue to work on increasing the support and services work across the Group.
The Group's statutory gross margin percentage was slightly higher than last year at just over 34%. The main cause of the increase was a stronger mix in Communications and Intelligence, particularly a full year contribution from EM Solutions and improved mix at MASS.
The Group's revenue is dominated by Maritime and Land, at 84% of Group revenue (2025: 81%). The growth in Maritime is due to increase in exports in Sensors and Effectors, and a full year contribution from EM Solutions. Land domain revenue decreased in absolute terms, due to the lower contribution from MCL, only partially offset by higher counter-drone activity and deliveries to the Portuguese Army. Joint and Strategic at 5% (2025: 5%) was slightly higher in absolute terms. The majority of the revenue in this domain is support to the UK's Joint Warfare capability. Going forward, we expect the Maritime domain to remain dominant and continue to grow. We also expect Land to grow as we ramp up delivery of counter-drone systems.
Revenue by market and geography
|
|
Communications and Intelligence |
Sensors |
Group |
|||||
|
2026 |
2025 |
2026 |
2025 |
2026 |
2026 |
2025 |
2025 |
|
|
Direct to UK MOD |
52.9 |
77.5 |
29.9 |
17.8 |
82.8 |
27 |
95.3 |
36 |
|
Indirect to UK MOD where the Group acts as a |
9.6 |
6.6 |
31.2 |
32.1 |
40.8 |
13 |
38.7 |
14 |
|
Total UK defence |
62.5 |
84.1 |
61.1 |
49.9 |
123.6 |
40 |
134.0 |
50 |
|
UK security |
8.6 |
5.9 |
- |
- |
8.6 |
3 |
5.9 |
2 |
|
UK other (non-defence and security) |
- |
0.1 |
1.3 |
7.9 |
1.3 |
|
8.0 |
|
|
Total UK |
71.1 |
90.1 |
62.4 |
57.8 |
133.5 |
|
147.9 |
|
|
Australia defence and security |
28.8 |
4.8 |
6.2 |
3.0 |
35.0 |
12 |
7.8 |
3 |
|
Portuguese defence and security |
16.5 |
17.6 |
- |
- |
16.5 |
5 |
17.6 |
7 |
|
German defence and security |
- |
0.1 |
8.3 |
2.9 |
8.3 |
3 |
3.0 |
1 |
|
Total non-UK domestic defence and security |
45.3 |
22.5 |
14.5 |
5.9 |
59.8 |
20 |
28.4 |
11 |
|
Export defence and security |
|
|
|
|
|
|
|
|
|
- Other European countries |
26.9 |
3.2 |
38.9 |
34.9 |
65.8 |
|
38.1 |
|
|
- Asia Pacific and Africa |
10.7 |
5.9 |
18.0 |
27.9 |
28.7 |
|
33.8 |
|
|
- North and South America |
2.8 |
2.7 |
13.7 |
12.7 |
16.5 |
|
15.4 |
|
|
Total export defence and security |
40.4 |
11.8 |
70.6 |
75.5 |
111.0 |
36 |
87.3 |
33 |
|
Non-UK other (non-defence and security) |
2.1 |
0.5 |
- |
5.9 |
2.1 |
|
6.4 |
|
|
|
158.9 |
124.9 |
147.5 |
145.1 |
306.4 |
100 |
270.0 |
100 |
Revenue by type of deliverable
|
|
Year ended 30 April 2026 |
Year ended 30 April 2025 |
||
|
£m |
% |
£m |
% |
|
|
Product |
242.9 |
79 |
207.4 |
77 |
|
Communications and Intelligence |
105.3 |
34 |
80.4 |
30 |
|
Sensors and Effectors |
137.6 |
45 |
127.0 |
47 |
|
|
|
|
|
|
|
Services |
63.5 |
21 |
62.6 |
23 |
|
Communications and Intelligence |
53.6 |
17 |
44.5 |
16 |
|
Sensors and Effectors |
9.9 |
4 |
18.1 |
7 |
|
|
|
|
|
|
|
Total revenue |
306.4 |
100 |
270.0 |
100 |
Revenue by user domain
|
|
Year ended 30 April 2026 |
Year ended 30 April 2025 |
||
|
£m |
% |
£m |
% |
|
|
Maritime |
199.8 |
65 |
142.4 |
53 |
|
Land |
58.6 |
19 |
76.0 |
28 |
|
Air & Space |
21.2 |
7 |
17.2 |
6 |
|
Joint & Strategicd |
14.7 |
5 |
14.1 |
5 |
|
Cyber and Information |
8.6 |
3 |
5.9 |
2 |
|
Other |
3.5 |
1 |
14.3 |
6 |
|
|
|
|
|
|
|
Total revenue |
306.4 |
100 |
270.0 |
100 |
Operational outlook
Order intake and order book
|
|
Order intake |
Order book |
||
|
2026 |
2025 |
2026 |
2025 |
|
|
Communications and Intelligence |
186.0 |
136.3 |
229.5 |
202.4 |
|
Sensors and Effectors |
128.2 |
148.4 |
389.3 |
414.0 |
|
|
314.2 |
284.7 |
618.8 |
616.4 |
The increase in the Group's order book reflects the strong order intake, the second highest order intake for the Group in a financial year, with a surplus of orders over revenue.
The 2025/26 order intake was 103% (2025: 105%) of the Group's revenue for the year.
The external consensus forecast revenue on order (order cover) for the coming year was 83% (2025: 83%) at 30 April 2026. This had risen to 88% in July 2026.
The Group's order intake and order book are the contracted values with customers and do not include any value attributable to frameworks or other arrangements where no enforceable contract exists. The order intake and order book take account of contractual changes to existing orders including extensions, variations and cancellations.
Order intake
Over the last five years orders delivered in-year from the order book held at the beginning of the year compared to consensus revenue were as follows:
|
|
Order book at beginning of financial year |
Consensus revenue on order at beginning of financial year |
Consensus revenue for the financial year |
Revenue delivered in financial year |
|
|
£m |
% |
£m |
£m |
|
2025/26 |
616.4 |
83 |
275.8 |
306.4 |
|
2024/25 |
518.7 |
92 |
200.0 |
270.0 |
|
2023/24 |
329.1 |
80 |
178.6 |
202.5 |
|
2022/23 |
291.0 |
78 |
163.6 |
182.7 |
|
2021/22 |
242.4 |
64 |
154.6 |
137.8 |
Delivery of the Group's order book into revenue
The table below shows the expected delivery of future revenue from the current order book.
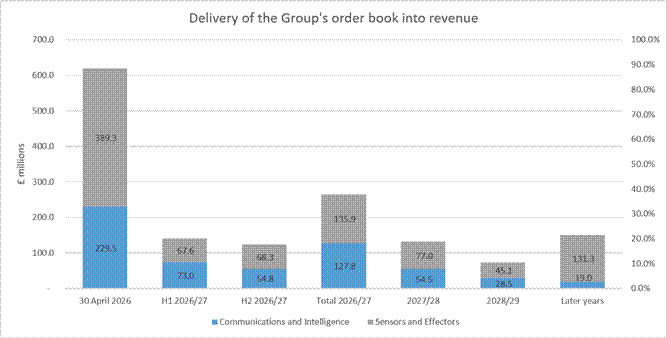
Cohort's order book has grown again following a year of record deliveries. The order book for Sensors and Effectors is both larger and longer than for Communications and Intelligence, in line with the division's greater proportion of long-term projects for naval customers. In Communications and Intelligence, the longevity of the order book is dominated by the multi-year support contracts for the UK MOD, communication systems for the Portuguese Navy and satellite communications terminals for the Royal Australian Navy.
The short-term nature of some of the business in Communications and Intelligence, especially the product delivery of MCL and MASS's shorter duration contracts in training and cyber, mean that this division will typically enter a financial year with less of its forecast revenue on order. We do expect to see some increase in the longevity of this division's order book in the coming year with prospects of long-term orders for EID and EM Solutions, examples of which were secured this year.
Sensors and Effectors has a number of large multi-year programmes, both for delivery and support, with work now stretching out to 2037. The prospects for this division to further increase the size of the order book in the coming year are good, both in the UK and especially export markets.
The Group's businesses are not dependent upon a single critical order to achieve their respective revenue targets for 2026/27.
Funding resource
On 30 April 2026, the Group's cash and readily available credit was £177.2m (2025: £55.3m), following the renewal of the Group's bank facility which completed on 29 April 2026. The facility duration is five years to April 2031 with the option to extend to April 2033 via two one-year extensions. It comprises a revolving credit facility (RCF) of £125m with two drawn term loans of c£25m denominated respectively in Australian dollars and euros. The facility also includes an option (accordion) for a further £50m. The facility provides the Group with a flexible arrangement to draw down for acquisitions and to cover increasing operating requirements. The Group's banking covenants were all passed for the year ended 30 April 2026. Looking forward, we expect to pass our banking covenants out to 31 July 2027 and beyond.
The facility is available to all members of the Group outside of Portugal and is fully secured over the Group's assets.
The Group's net funds at 30 April 2026 were £2.2m (30 April 2025: £5.3m), reflecting a marked improvement from the Group's H1 position at 31 October 2025 (net debt of £32.5m) as working capital build-up began to be delivered, albeit at a slower pace than anticipated.
In summary, the Group's cash performance in 2025/26 was as follows:
|
|
2026 |
2025 |
|
Adjusted operating profit |
36.3 |
27.5 |
|
Depreciation and other non-cash operating movements |
5.9 |
4.2 |
|
Working capital movement |
(25.3) |
20.1 |
|
|
16.9 |
51.8 |
|
Sale of Transport business |
5.9 |
- |
|
Acquisition of ITS (including costs) |
- |
(3.1) |
|
Acquisition of EM Solutions (including costs) |
- |
(80.9) |
|
Placing |
- |
41.0 |
|
Tax, dividends, capital expenditure, interest and other investments |
(25.8) |
(26.6) |
|
Decrease in funds |
(3.0) |
(17.8) |
The Group has maintained its progressive dividend policy, increasing its dividend this year by 10% to a total dividend paid and payable of 17.9 pence per share (2025: 16.3 pence). The last five years' annual dividends, growth rate, earnings cover and cash cover are as follows:
|
|
Dividend |
Growth over |
Earnings cover |
Cash cover |
|
2026 |
17.9 |
10 |
3.5 |
1.4 |
|
2025 |
16.3 |
10 |
3.3 |
6.9 |
|
2024 |
14.8 |
10 |
2.9 |
3.7 |
|
2023 |
13.4 |
10 |
2.7 |
3.0 |
|
2022 |
12.2 |
10 |
2.6 |
3.9 |
During the year the working capital of the Group increased significantly as work on larger contracts, primarily in the Naval domain, progressed.
Tax
The Group's tax charge for the year ended 30 April 2026 of £8.3m (2025: charge of £6.0m) was at a rate of 25.5% (2025: 23.4%) of profit before tax. This includes a current year corporation tax charge of £7.2m (2025: £7.1m), a prior year corporation tax credit of £0.7m (2025: £0.4m) and a deferred tax charge of £1.8m (2025: £0.7m credit).
The Group's overall tax rate of 25.5% was above the standard UK corporation tax rate of 25.0% (2025: 25.0%) due to a higher contribution from Australia (30%), partially offset by R&D credits.
The Group has reported research and development expenditure credits (RDEC) for the UK in accordance with IAS 20 and shown the credit of £3.6m (2025: £3.3m) in cost of sales and adjusted the tax charge accordingly. The RDEC has been reversed in reporting the adjusted operating profit for the Group to ensure comparability of operating performance year on year.
Looking forward, the Group's effective current tax rate (excluding the impact of RDEC reporting) for 2026/27 is estimated at 20% compared with 16% of the pre-RDEC adjusted operating profit less interest for 2025/26. The Group maintains a cautious approach to R&D tax credit claims for tax periods that are still open (2024/25 and 2025/26) as well as the potential outcome of a tax audit in Portugal.
Adjusted earnings per share
The adjusted earnings per share (EPS) of 61.9 pence (2025: 54.4 pence) are reported in addition to the basic earnings per share and exclude the effect of amortisation of intangible assets, exceptional items and foreign exchange movements, including marking forward exchange contracts to market, all net of tax.
The adjusted earnings per share exclude non-controlling interest of EID (20%). The reconciliation from last year to this year is as follows:
|
|
Adjusted operating profit £m |
Adjusted earnings per share |
|
Year ended 30 April 2025 |
27.5 |
54.44 |
|
100% owned businesses throughout the year ended 30 April 2026 |
9.7 |
17.77 |
|
Impact of businesses with minority holding |
(0.9) |
(1.32) |
|
Change in tax rate (excluding RDEC): 16.1% (2025: 12.6%) |
|
(2.81) |
|
Other movements including interest and higher weighted average share capital |
|
(6.15) |
|
Year ended 30 April 2026 |
36.3 |
61.93 |
|
Increase from 2025 to 2026 |
32% |
14% |
The adjustments to the basic EPS in respect of exchange movements and other intangible asset amortisation of EID only reflect that proportion of the adjustment that is applicable to the equity holders of the parent.
The Group's statutory operating profit of £34.6m (2025: £26.1m) reflects the amortisation of other intangible assets, a £5.9m non-cash charge in 2026 (2025: £3.0m), research and development credit (RDEC) of £3.6m (2025: £3.3m) which in turn is offset by a higher tax charge and an exceptional gain of £0.5m (2025: £1.7m charge) in respect of SEA's disposal of its Transport division. The Group also reported a non-cash foreign exchange gain of less than £0.1m (2025: £0.1m) arising from marking forward exchange contracts to market.
Accounting policies
There were no significant accounting policy changes in 2025/26.
Simon Walther
Finance Director
Consolidated income statement
for the year ended 30 April 2026
|
|
Notes |
2026 £'000 |
2025 £'000 |
|
Revenue |
2 |
306,387 |
270,043 |
|
Cost of sales |
|
(202,044) |
(179,618) |
|
Gross profit |
|
104,343 |
90,425 |
|
Administrative expenses |
|
(69,697) |
(64,323) |
|
Operating profit |
2 |
34,646 |
26,102 |
|
Comprising: |
|
|
|
|
Adjusted operating profit |
2 |
36,291 |
27,475 |
|
Amortisation of other intangible assets (included in administrative expenses) |
|
(5,868) |
(3,032) |
|
Research and development expenditure credits (RDEC) (included in cost of sales) |
|
3,636 |
3,255 |
|
Credit on forward exchange contracts and loans (included in cost of sales) |
|
42 |
138 |
|
Exceptional items (included in administrative expenses): |
|
|
|
|
- Cost of acquisition of EM Solutions |
|
- |
(1,635) |
|
- Cost of acquisition of ITS |
|
- |
(99) |
|
- Gain on sale of SEA Transport |
|
545 |
- |
|
|
|
34,646 |
26,102 |
|
Finance income |
|
455 |
1,125 |
|
Finance costs |
|
(2,507) |
(1,599) |
|
Profit before tax |
|
32,594 |
25,628 |
|
Income tax charge |
3 |
(8,313) |
(6,008) |
|
Profit for the year |
|
24,281 |
19,620 |
|
Attributable to: |
|
|
|
|
Equity shareholders of the parent |
|
23,903 |
19,249 |
|
Non-controlling interests |
|
378 |
371 |
|
|
|
24,281 |
19,620 |
|
|
Notes |
Pence |
Pence |
|
Earnings per share |
|
|
|
|
Basic |
4 |
52.23 |
45.07 |
|
Diluted |
4 |
51.29 |
44.25 |
|
|
|
|
|
|
Adjusted earnings per share |
|
|
|
|
Basic |
4 |
61.93 |
54.44 |
|
Diluted |
4 |
60.82 |
53.46 |
|
|
|
|
|
|
Dividends per share paid and proposed in respect of the year |
|
|
|
|
Interim |
|
5.80 |
5.25 |
|
Final |
|
12.10 |
11.05 |
|
|
|
17.90 |
16.30 |
Consolidated and Company statement of financial position
as at 30 April 2026
|
|
Notes |
Group |
Company |
||
|
2026 £'000 |
2025 £'000 |
2026 £'000 |
2025 £'000 |
||
|
Assets |
|
|
|
|
|
|
Non-current assets |
|
|
|
|
|
|
Goodwill |
|
80,940 |
81,424 |
- |
- |
|
Other intangible assets |
|
47,854 |
49,087 |
- |
- |
|
Right of use asset |
|
9,027 |
9,688 |
924 |
284 |
|
Investment property |
|
1,254 |
- |
- |
- |
|
Property, plant and equipment |
|
42,332 |
31,009 |
402 |
43 |
|
Investment in subsidiaries |
|
- |
- |
127,882 |
129,466 |
|
Amounts due from subsidiaries |
|
- |
- |
83,710 |
64,529 |
|
Deferred tax assets |
|
5,218 |
5,153 |
783 |
907 |
|
Restricted cash |
|
316 |
3,198 |
- |
- |
|
|
|
186,941 |
179,559 |
213,701 |
195,229 |
|
Current assets |
|
|
|
|
|
|
Inventories |
|
47,990 |
52,081 |
- |
- |
|
Trade and other receivables |
|
129,854 |
89,110 |
1,249 |
1,460 |
|
Current tax assets |
|
6,664 |
6,495 |
- |
- |
|
Derivative financial instruments |
|
15 |
45 |
- |
- |
|
Cash and cash equivalents |
|
49,581 |
74,646 |
- |
- |
|
|
|
234,104 |
222,377 |
1,249 |
1,460 |
|
Total assets |
|
421,045 |
401,936 |
214,950 |
196,689 |
|
Liabilities |
|
|
|
|
|
|
Current liabilities |
|
|
|
|
|
|
Trade and other payables |
|
(138,820) |
(126,579) |
(3,530) |
(5,116) |
|
Current tax liabilities |
|
(6,746) |
(3,708) |
(1,414) |
- |
|
Derivative financial instruments |
|
(224) |
(190) |
- |
- |
|
Lease liability |
|
(2,142) |
(2,313) |
(157) |
(118) |
|
Bank borrowings |
|
- |
(36,986) |
(25,761) |
(30,714) |
|
Provisions |
|
(15,946) |
(18,549) |
- |
- |
|
|
|
(163,878) |
(188,325) |
(30,862) |
(35,948) |
|
Non-current liabilities |
|
|
|
|
|
|
Deferred tax liabilities |
|
(4,055) |
(2,309) |
- |
- |
|
Lease liability |
|
(6,806) |
(7,166) |
(810) |
(182) |
|
Bank borrowings |
|
(47,364) |
(32,410) |
(47,364) |
(32,410) |
|
Provisions |
|
(7,884) |
(8,445) |
- |
- |
|
Retirement benefit obligations |
|
(2,823) |
(3,189) |
- |
- |
|
|
|
(68,932) |
(53,519) |
(48,174) |
(32,592) |
|
Total liabilities |
|
(232,810) |
(241,844) |
(79,036) |
(68,540) |
|
Net assets |
|
188,235 |
160,092 |
135,914 |
128,149 |
|
Equity |
|
|
|
|
|
|
Share capital |
|
4,702 |
4,668 |
4,702 |
4,668 |
|
Share premium account |
|
74,774 |
72,954 |
74,774 |
72,954 |
|
Own shares |
|
(6,252) |
(7,411) |
(6,252) |
(7,411) |
|
Share option reserve |
|
4,476 |
4,663 |
3,489 |
3,769 |
|
Retained earnings |
|
108,717 |
83,732 |
59,201 |
54,169 |
|
Total equity attributable to the equity shareholders of the parent |
|
186,417 |
158,606 |
135,914 |
128,149 |
|
Non-controlling interests |
|
1,818 |
1,486 |
- |
- |
|
Total equity |
|
188,235 |
160,092 |
135,914 |
128,149 |
Consolidated statement of changes in equity
for the year ended 30 April 2026
|
Group |
Attributable to the equity shareholders of the parent |
|||||||
|
Share capital £'000 |
Share premium account £'000 |
Own shares £'000 |
Share option reserve £'000 |
Retained earnings £'000 |
Total £'000 |
Non-controlling interests £'000 |
Total equity £'000 |
|
|
At 1 May 2024 |
4,161 |
32,157 |
(4,569) |
2,859 |
74,066 |
108,674 |
1,166 |
109,840 |
|
Profit for the year |
- |
- |
- |
- |
19,249 |
19,249 |
371 |
19,620 |
|
Other comprehensive expense for the year |
- |
- |
- |
- |
(3,624) |
(3,624) |
(51) |
(3,675) |
|
Total comprehensive income for the year |
- |
- |
- |
- |
15,625 |
15,625 |
320 |
15,945 |
|
Transactions with owners of Group and non-controlling interests, recognised directly in equity |
|
|
|
|
|
|
|
|
|
Issue of new shares |
507 |
40,797 |
- |
- |
- |
41,304 |
- |
41,304 |
|
Equity dividends |
- |
- |
- |
- |
(6,476) |
(6,476) |
- |
(6,476) |
|
Vesting of Restricted Shares |
- |
- |
- |
- |
133 |
133 |
- |
133 |
|
Own shares purchased |
- |
- |
(3,998) |
- |
- |
(3,998) |
- |
(3,998) |
|
Own shares settled |
- |
- |
889 |
- |
- |
889 |
- |
889 |
|
Net loss on settling own shares |
- |
- |
267 |
- |
(267) |
- |
- |
- |
|
Share-based payments |
- |
- |
- |
1,375 |
- |
1,375 |
- |
1,375 |
|
Deferred tax adjustment in respect of share-based payments |
- |
- |
- |
1,080 |
- |
1,080 |
- |
1,080 |
|
Transfer of share option reserve on vesting of options |
- |
- |
- |
(651) |
651 |
- |
- |
- |
|
At 30 April 2025 |
4,668 |
72,954 |
(7,411) |
4,663 |
83,732 |
158,606 |
1,486 |
160,092 |
|
Profit for the year |
- |
- |
- |
- |
23,903 |
23,903 |
378 |
24,281 |
|
Other comprehensive expense for the year |
- |
- |
- |
- |
8,146 |
8,146 |
(46) |
8,100 |
|
Total comprehensive income for the year |
- |
- |
- |
- |
32,049 |
32,049 |
332 |
32,381 |
|
Transactions with owners of Group and non-controlling interests, recognised directly in equity |
|
|
|
|
|
|
|
|
|
Issue of new shares |
34 |
1,820 |
- |
- |
- |
1,854 |
- |
1,854 |
|
Equity dividends |
- |
- |
- |
- |
(7,703) |
(7,703) |
- |
(7,703) |
|
Vesting of Restricted Shares |
- |
- |
- |
- |
73 |
73 |
- |
73 |
|
Own shares purchased |
- |
- |
- |
- |
- |
- |
- |
- |
|
Own shares settled |
- |
- |
1,066 |
- |
- |
1,066 |
- |
1,066 |
|
Net loss on settling own shares |
- |
- |
93 |
- |
(93) |
- |
- |
- |
|
Share-based payments |
- |
- |
- |
897 |
- |
897 |
- |
897 |
|
Deferred tax adjustment in respect of share-based payments |
- |
- |
- |
(425) |
- |
(425) |
- |
(425) |
|
Transfer of share option reserve on vesting of options |
- |
- |
- |
(659) |
659 |
- |
- |
- |
|
At 30 April 2026 |
4,702 |
74,774 |
(6,252) |
4,476 |
108,717 |
186,417 |
1,818 |
188,235 |
Consolidated cash flow statement
for the year ended 30 April 2026
|
|
Notes |
Group |
|
|
2026 £'000 |
2025 £'000 |
||
|
Net cash inflow from operating activities |
5 |
11,290 |
51,184 |
|
Cash flows from investing activities |
|
|
|
|
Interest received |
|
455 |
1,125 |
|
Purchases of property, plant and equipment |
|
(17,624) |
(13,182) |
|
Receipt for disposal of transport business, net of cash acquired |
|
5,892 |
- |
|
Payment for acquisition of subsidiaries, net of cash acquired |
|
- |
(81,589) |
|
Net cash used in investing activities |
|
(11,277) |
(93,646) |
|
Cash flows from financing activities |
|
|
|
|
Issue of new shares |
|
1,854 |
2,058 |
|
Share placement net of associated transaction costs |
|
- |
39,246 |
|
Dividends paid |
|
(7,703) |
(6,476) |
|
Purchase of own shares |
|
- |
(3,998) |
|
Settlement of own shares |
|
1,066 |
889 |
|
Drawdown of borrowings |
|
14,608 |
16,780 |
|
Repayment of lease liabilities |
|
(2,517) |
(2,317) |
|
Net cash from financing activities |
|
7,308 |
46,182 |
|
Net increase in cash and cash equivalents |
|
7,321 |
3,720 |
|
Represented by: |
|
|
|
|
Cash and cash equivalents brought forward |
|
38,511 |
39,667 |
|
Net increase in cash and cash equivalents |
|
7,321 |
3,720 |
|
Foreign exchange loss |
|
3,749 |
(4,876) |
|
Cash and cash equivalents carried forward |
|
49,581 |
38,511 |
|
|
At 1 May 2025 £'000 |
Effect of foreign exchange rate changes £'000 |
Cash flow £'000 |
At 30 April 2026 £'000 |
|
Net funds reconciliation |
|
|
|
|
|
Group |
|
|
|
|
|
Cash and bank |
74,646 |
3,749 |
(28,814) |
49,581 |
|
Bank overdrafts |
(36,135) |
- |
36,135 |
- |
|
Cash and cash equivalents |
38,511 |
3,749 |
7,321 |
49,581 |
|
Loan |
(33,261) |
505 |
(14,608) |
(47,364) |
|
Net funds |
5,250 |
4,254 |
(7,457) |
2,217 |
Notes to the financial statements
for the year ended 30 April 2026
1. BASIS OF PREPARATION
The audited summary financial information contained within this preliminary report has been prepared using accounting policies consistent with UK Adopted International Accounting Standards. The financial information contained in this announcement does not constitute statutory accounts as defined in Section 434 of the Companies Act 2006. The financial information has been extracted from the financial statements for the year ended 30 April 2026, which have been approved by the Board of Directors and on which the auditors have reported without qualification. The financial statements will be delivered to the Registrar of Companies after the Annual General Meeting.
At 30 April 2026, the Group's cash and readily available credit was £177.2m (2025: £55.3m). A very high proportion of our ultimate customers are governments or government agencies, with a clear need to invest in defence and security.
The Directors have a reasonable expectation that the Group has adequate resources to continue in operational existence for the foreseeable future. Thus, they continue to adopt the going concern basis in preparing the annual financial statements.
The preliminary announcement was approved by the Board and authorised for issue on 15 July 2026.
Copies of the Annual Report and accounts for the year ended 30 April 2026 will be posted to shareholders on 20 August 2026 and will be available on the Company's website (www.cohortplc.com) from that date.
2. SEGMENTAL ANALYSIS
For management and reporting purposes, the Group, during the year ended 30 April 2026, operated through its two trading divisions: Communications and Intelligence, and Sensors and Effectors. These divisions are the basis on which the Company reports its primary business segment information in accordance with IFRS 8. Whilst each division internally reports by reference to the sectors it sells to, these are considered by the Board to have similar economic characteristics in terms of the nature of the services and their customer base and therefore disaggregated information is not regularly reported to the Board. On this basis, the Board, which is deemed to be the chief operating decision maker, considers each trading division a separate reporting segment.
All are UK operations with the exception of EID, which is based in Portugal; EM Solutions, which is based in Australia; and ELAC SONAR, which is based in Germany. All operations are continuing. Inter-segment sales are charged at arm's length rates.
Unallocated corporate expenses are the costs of the Cohort plc head office including the remuneration of the Cohort plc Board.
Business segment information about these divisions is presented below:
|
2026 |
Communications and Intelligence £'000 |
Sensors and |
Eliminations and Central £'000 |
Group £'000 |
|
Revenue |
|
|
|
|
|
External revenue |
158,927 |
147,460 |
- |
306,387 |
|
Inter-segment revenue |
75 |
1 |
(76) |
- |
|
|
159,002 |
147,461 |
(76) |
306,387 |
|
Adjusted operating profit |
32,401 |
10,543 |
(6,653) |
36,291 |
|
(Charge)/credit on forward exchange contracts (included in cost of sales) |
(127) |
80 |
89 |
42 |
|
Sale of SEA Transport |
- |
545 |
- |
545 |
|
Amortisation of other intangible assets |
(5,097) |
(771) |
- |
(5,868) |
|
Research and development expenditure credits (RDEC) |
664 |
3,132 |
(160) |
3,636 |
|
Operating profit |
27,841 |
13,529 |
(6,724) |
34,646 |
|
Finance cost (net of income) |
(2,274) |
(1,624) |
1,846 |
(2,052) |
|
Profit before tax |
25,567 |
11,905 |
(4,878) |
32,594 |
|
Income tax charge |
|
|
|
(8,313) |
|
Profit after tax |
|
|
|
24,281 |
|
2026 Other information |
Communications and Intelligence £'000 |
Sensors and |
Central £'000 |
Group £'000 |
|
Capital additions |
1,462 |
15,737 |
424 |
17,623 |
|
Depreciation of property, plant and equipment |
1,608 |
2,972 |
54 |
4,634 |
|
Depreciation of right of use assets |
1,115 |
1,641 |
117 |
2,873 |
|
2026 Balance sheet |
Australia £'000 |
Portugal £'000 |
Germany £'000 |
UK £'000 |
Group £'000 |
Communications and Intelligence £'000 |
Sensors and Effectors |
Eliminations £'000 |
Group £'000 |
|
Assets |
|
|
|
|
|
|
|
|
|
|
Segment assets |
44,134 |
23,279 |
63,146 |
100,229 |
230,788 |
90,488 |
153,335 |
(13,035) |
230,788 |
|
Goodwill and other intangible assets |
79,325 |
2,292 |
8,380 |
38,797 |
128,794 |
98,830 |
29,964 |
- |
128,794 |
|
Current tax asset |
|
|
|
|
|
|
|
|
6,664 |
|
Deferred tax asset |
|
|
|
|
|
|
|
|
5,218 |
|
Cash |
|
|
|
|
|
|
|
|
49,581 |
|
Consolidated total assets |
123,459 |
25,571 |
71,526 |
139,026 |
359,582 |
189,318 |
183,299 |
|
421,045 |
|
Liabilities |
|
|
|
|
|
|
|
|
|
|
Segment liabilities |
(16,572) |
(26,362) |
(46,297) |
(85,414) |
(174,645) |
(70,068) |
(117,843) |
13,266 |
(174,645) |
|
Current tax liability |
|
|
|
|
|
|
|
|
(6,746) |
|
Deferred tax liability |
|
|
|
|
|
|
|
|
(4,055) |
|
Bank borrowings |
|
|
|
|
|
|
|
|
(47,364) |
|
Consolidated total liabilities |
(16,572) |
(26,362) |
(46,297) |
(85,414) |
(174,645) |
(70,068) |
(117,843) |
|
(232,810) |
The above figures include 100% of EID. The non-controlling interest of 20.00% is reported separately in the income statement and Group reserves.
|
2025 |
Communications and Intelligence £'000 |
Sensors and Effectors £'000 |
Eliminations and Central £'000 |
Group £'000 |
|
Revenue |
|
|
|
|
|
External revenue |
124,891 |
145,152 |
- |
270,043 |
|
Inter-segment revenue |
75 |
238 |
(313) |
- |
|
|
124,966 |
145,390 |
(313) |
270,043 |
|
Adjusted operating profit |
21,095 |
12,654 |
(6,274) |
27,475 |
|
(Charge)/credit on forward exchange contracts and bank loans (included in cost of sales) |
(124) |
189 |
73 |
138 |
|
Costs of acquisition of EM Solutions |
(1,635) |
- |
- |
(1,635) |
|
Costs of acquisition of ITS |
(99) |
- |
- |
(99) |
|
Amortisation of other intangible assets |
(1,893) |
(1,139) |
- |
(3,032) |
|
Research and development expenditure credits (RDEC) |
564 |
2,691 |
- |
3,255 |
|
Operating profit |
17,908 |
14,395 |
(6,201) |
26,102 |
|
Finance cost (net of income) |
(380) |
(1,061) |
967 |
(474) |
|
Profit before tax |
17,528 |
13,334 |
(5,234) |
25,628 |
|
Income tax charge |
|
|
|
(6,008) |
|
Profit after tax |
|
|
|
19,620 |
|
2025 Other information |
Communications and Intelligence £'000 |
Sensors and Effectors £'000 |
Central £'000 |
Group £'000 |
|
Capital additions |
1,517 |
11,652 |
13 |
13,182 |
|
Depreciation of property, plant and equipment |
1,045 |
2,126 |
28 |
3,199 |
|
Depreciation of right of use assets |
629 |
1,529 |
114 |
2,272 |
|
2025 Balance sheet |
Australia £'000 |
Portugal £'000 |
Germany £'000 |
UK £'000 |
Group £'000 |
Communications and Intelligence £'000 |
Sensors and Effectors £'000 |
Eliminations £'000 |
Group £'000 |
|
Assets |
|
|
|
|
|
|
|
|
|
|
Segment assets |
29,567 |
26,370 |
42,122 |
86,963 |
185,022 |
82,079 |
118,089 |
(15,146) |
185,022 |
|
Goodwill and other intangible assets |
76,276 |
2,254 |
8,788 |
43,193 |
130,511 |
96,068 |
34,443 |
- |
130,511 |
|
Current tax asset |
|
|
|
|
|
|
|
|
6,495 |
|
Deferred tax asset |
|
|
|
|
|
|
|
|
5,262 |
|
Cash |
|
|
|
|
|
|
|
|
74,646 |
|
Consolidated total assets |
105,843 |
28,624 |
50,910 |
130,156 |
315,533 |
178,147 |
152,532 |
|
401,936 |
|
Liabilities |
|
|
|
|
|
|
|
|
|
|
Segment liabilities |
(13,281) |
(21,202) |
(30,700) |
(84,768) |
(149,951) |
(56,680) |
(108,728) |
15,457 |
(149,951) |
|
Current tax liability |
|
|
|
|
|
|
|
|
(3,708) |
|
Deferred tax liability |
|
|
|
|
|
|
|
|
(18,809) |
|
Bank borrowings |
|
|
|
|
|
|
|
|
(69,396) |
|
Consolidated total liabilities |
(13,281) |
(21,202) |
(30,700) |
(84,768) |
(149,951) |
(56,680) |
(108,728) |
|
(241,844) |
The above figures include 100% of EID. The non-controlling interest of 20.00% is reported separately in the income statement and Group reserves.
For the purposes of monitoring segment performance and allocating resource between segments, the Group's Chief Executive monitors the tangible, intangible and financial assets attributable to each segment.
All assets and liabilities are allocated to reportable segments with the exception of central cash and bank borrowings, current tax and deferred tax assets and liabilities.
Goodwill and other intangible assets are allocated to reportable segments.
Geographical segments
For an analysis of the Group's revenue by geographical location of the customer, please refer to the "Revenue by market and geography" table in the Financial review.
All Group assets, tangible and intangible, are located in the UK with the exceptions of EID, which is located in Portugal; ELAC SONAR, which is based in Germany; and EM Solutions, which is based in Australia.
Market segments
The Group's revenue by market sector is as follows:
|
|
2026 % |
2025 % |
|
Maritime |
65% |
53% |
|
Land |
19% |
28% |
|
Cyber and Information |
3% |
2% |
|
Air and Space |
7% |
6% |
|
Joint and Strategic |
5% |
5% |
|
Other |
1% |
6% |
|
|
100% |
100% |
For an analysis of the Group's total revenue, broken down by type of deliverable, please refer to the "Revenue by type of deliverable" table in the Financial review.
Product includes bespoke product, customised systems and sub-systems and is hardware and/or software. Services include operational support and training.
Revenue by IFRS 15 classification
|
|
Year ended |
Year ended |
||
|
£m |
% |
£m |
% |
|
|
Point in time |
136.6 |
45% |
141.6 |
52% |
|
Over time |
169.8 |
55% |
128.4 |
48% |
|
Total revenue |
306.4 |
100% |
270.0 |
100% |
Major customers
Revenue from major customers included in the Group's business segments for the year ended 30 April 2026 is as follows:
|
|
2026 |
2025 |
||||||||
|
UK MOD £'000 |
BAE Systems £'000 |
Australian DoD £'000 |
Portuguese MOD £'000 |
Leonardo £'000 |
UK MOD £'000 |
Portuguese MOD £'000 |
BAE Systems £'000 |
Leonardo £'000 |
New Zealand MOD £'000 |
|
|
Communications and Intelligence |
52,867 |
9,087 |
27,183 |
16,504 |
- |
77,524 |
17,593 |
1,895 |
- |
- |
|
Sensors and Effectors |
29,980 |
20,243 |
- |
- |
15,210 |
17,765 |
- |
20,029 |
16,778 |
11,306 |
|
|
82,847 |
29,330 |
27,183 |
16,504 |
15,210 |
95,289 |
17,593 |
21,924 |
16,778 |
11,306 |
3. INCOME TAX CHARGE
|
|
2026 £'000 |
2025 £'000 |
|
Current tax charge/(credit): |
|
|
|
UK corporation tax: in respect of this year |
5,045 |
6,239 |
|
UK corporation tax: in respect of prior years |
(669) |
(377) |
|
Australian corporation tax: in respect of this year |
2,602 |
448 |
|
Australian corporation tax: in respect of prior years |
(116) |
- |
|
Germany corporation tax: in respect of this year |
(389) |
351 |
|
Germany corporation tax: in respect of prior years |
98 |
- |
|
Portugal corporation tax: in respect of this year |
(500) |
(298) |
|
Portugal corporation tax: in respect of prior years |
- |
(10) |
|
Other foreign corporation tax: in respect of this year |
465 |
(4) |
|
|
6,536 |
6,349 |
|
Deferred tax charge/(credit): |
|
|
|
In respect of this year |
576 |
618 |
|
In respect of prior years |
1,201 |
(959) |
|
|
1,777 |
(341) |
|
|
8,313 |
6,008 |
The corporation tax is calculated at 25.0% (2025: 25.0%) of the estimated taxable profit for the year, as disclosed to the right.
The deferred tax includes a credit of £849,000 in respect of amortisation of other intangible assets (2025: £647,000), and a credit of £12,000 (2025: £16,000 charge) in respect of marking forward exchange contracts to market at the year end.
The tax charge for the year is reconciled to profit per the Consolidated income statement for the year ended 30 April 2026 as follows:
|
|
2026 £'000 |
2025 £'000 |
|
Profit before tax on continuing operations |
32,594 |
25,628 |
|
Tax at the UK corporation tax rate of 25.0% (2025: 25.0%) |
8,149 |
6,407 |
|
Tax effect of expenses/credits that are not deductible/are deductible in determining taxable profit |
1,517 |
(204) |
|
Tax effect of R&D tax credits in Portugal |
(675) |
(695) |
|
Tax effect of exceptional items that are not recognised in determining taxable profit |
150 |
353 |
|
Tax effect of other items |
(438) |
1,300 |
|
Tax effect of net impact of statutory deduction for share options exercised |
(1,013) |
43 |
|
Tax effect of foreign tax rates |
523 |
224 |
|
Tax effect of deferred tax movement on share options to be exercised |
(414) |
(74) |
|
Tax effect of other prior year adjustments |
514 |
(1,346) |
|
Tax charge for the year |
8,313 |
6,008 |
The UK corporation tax for the year ended 30 April 2026 is 25.0% (2025: 25.0%). The Portuguese corporation tax rate calculated for the year ended 30 April 2026 is 31.0% (2025: 31.0%) and the German corporation tax rate calculated for the year ended 30 April 2026 is 31.6% (2025: 31.6%). The Australian corporation tax rate for the year ended 30 April 2026 is 30.0% (2025: 30.0%).
In addition, a deferred tax credit of £96,000 (2025: credit of £1,080,000) was recognised directly in equity in respect of share options.
4. EARNINGS PER SHARE
The earnings per share are calculated as follows:
|
|
2026 |
2025 |
||||
|
Weighted average number of shares Number |
Earnings £'000 |
Earnings per share Pence |
Weighted average number of shares Number |
Earnings |
Earnings per share Pence |
|
|
Basic earnings (net profit attributable to equity holders of Cohort plc) |
45,767,387 |
23,903 |
52.23 |
42,712,549 |
19,249 |
45.07 |
|
Share options |
836,128 |
|
|
784,652 |
|
|
|
Diluted earnings |
46,603,515 |
23,903 |
51.29 |
43,497,201 |
19,249 |
44.25 |
The basic earnings per share are calculated by dividing the profit attributable to equity holders of the parent company (Cohort plc) by the weighted average number of ordinary shares in issue during the year. The diluted earnings per share are calculated by dividing the profit attributable to equity holders of the parent company by the weighted average number of shares in issue during the year as adjusted for the effects of potentially dilutive share options.
The weighted average number of shares for the years ended 30 April 2026 and 30 April 2025 is after deducting the own shares, which are held by the Cohort Employee Benefit Trust.
In addition, the adjusted earnings per share of the Group are calculated in a similar manner to the basic earnings per share with the adjustments to the basic earnings as shown below:
|
|
|
2026 |
2025 |
||||
|
Weighted average number of shares Number |
Earnings £'000 |
Earnings per share Pence |
Weighted average number of shares Number |
Earnings £'000 |
Earnings per share Pence |
||
|
Basic earnings |
|
45,767,387 |
23,903 |
52.23 |
42,712,549 |
19,249 |
45.07 |
|
Charge on forward exchange contracts and loans at the yearend (net of tax credit of £9,000 (2025: £34,000)) |
|
- |
(31) |
- |
- |
(103) |
- |
|
Cost of acquisition of EM Solutions |
|
- |
- |
- |
- |
1,635 |
- |
|
Cost of acquisition of ITS |
|
- |
- |
- |
- |
99 |
- |
|
Gain on sale of SEA Transport |
|
- |
(545) |
- |
- |
- |
- |
|
Amortisation of other intangible assets |
|
- |
5,019 |
- |
- |
2,374 |
- |
|
Adjusted earnings |
|
45,767,387 |
28,346 |
61.93 |
42,712,549 |
23,254 |
54.44 |
|
Share options |
|
836,128 |
- |
- |
784,652 |
- |
- |
|
Diluted adjusted earnings |
|
46,603,515 |
28,346 |
60.82 |
43,497,201 |
23,254 |
53.46 |
The adjusted earnings are in respect of continuing operations. The research and development expenditure credit (RDEC) has no effect on adjusted earnings per share.
The following table shows the adjustment to earnings in respect of amortisation of other intangible assets for calculating the adjusted earnings per share.
|
|
2026 |
2025 |
||||||||
|
Amortisation of other intangible assets (note 9) £'000 |
Deferred tax credit thereon £'000 |
Net £'000 |
Non-controlling interest £'000 |
Attributable to equity shareholders of the Group £'000 |
Amortisation of other intangible assets (note 9) £'000 |
Deferred tax credit thereon £'000 |
Net £'000 |
Non-controlling interest £'000 |
Attributable to equity shareholders of the Group £'000 |
|
|
EID |
- |
- |
- |
- |
- |
70 |
(16) |
54 |
(11) |
43 |
|
EM Solutions |
4,772 |
(494) |
4,278 |
- |
4,278 |
1,011 |
(297) |
714 |
- |
714 |
|
MCL |
325 |
(81) |
244 |
- |
244 |
812 |
(203) |
609 |
- |
609 |
|
ELAC SONAR |
562 |
(211) |
351 |
- |
351 |
893 |
(280) |
613 |
- |
613 |
|
JSK (SEA) |
209 |
(63) |
146 |
- |
146 |
246 |
149 |
395 |
- |
395 |
|
|
5,868 |
(849) |
5,019 |
- |
5,019 |
3,032 |
(647) |
2,385 |
(11) |
2,374 |
5. NET CASH FROM OPERATING ACTIVITIES
|
|
Group |
|
|
2026 £'000 |
2025 £'000 |
|
|
Profit for the year |
24,281 |
19,620 |
|
Adjustments for: |
|
|
|
Income tax charge |
4,677 |
6,008 |
|
Depreciation of property, plant and equipment |
4,634 |
3,199 |
|
Depreciation of right of use assets |
2,873 |
2,272 |
|
Amortisation of other intangible assets and goodwill |
5,868 |
3,032 |
|
Net finance expense |
2,052 |
474 |
|
Derivative financial instruments and other non-trading exchange movements |
(42) |
(138) |
|
Share-based payment |
1,198 |
698 |
|
Increase in provisions |
3,386 |
3,857 |
|
Operating cash flows before movements in working capital |
48,927 |
39,022 |
|
Decrease/(Increase) in inventories |
6,677 |
(7,133) |
|
Increase in receivables |
(49,785) |
(8,851) |
|
Increase in payables |
9,304 |
35,203 |
|
|
(33,804) |
19,219 |
|
Cash generated from operations |
15,123 |
58,241 |
|
Income taxes paid |
(1,326) |
(5,459) |
|
Interest paid |
(2,507) |
(1,598) |
|
Net cash inflow from operating activities |
11,290 |
51,184 |
Interest paid includes the interest element of lease liabilities under IFRS 16 of £500,000 (2025: £334,000).
RNS may use your IP address to confirm compliance with the terms and conditions, to analyse how you engage with the information contained in this communication, and to share such analysis on an anonymised basis with others as part of our commercial services. For further information about how RNS and the London Stock Exchange use the personal data you provide us, please see our Privacy Policy.

Latest directors dealings
- 1 day ago City of London Investment Group
- 1 day ago Kooth
- 1 day ago THG
- 1 day ago Origin Enterprises (CDI)
- 1 day ago Kingfisher