
Preliminary Results
Summary by AI BETAClose X

Preliminary Results for the year ended 31 July 2026
29 September 2026
Mike Morgan, Chief Executive, said:
"In FY 2026 we have made significant progress against our strategic priorities to simplify, optimise and grow the business. We have taken decisive action: exiting non-core activities and repositioning business lines; taking out costs; returning to growth, and sharpening our focus on our specialist lending markets in which we have expertise. In so doing we have established a stronger foundation for future growth, operating leverage and returns.
We continue to make good progress on costs as we track ahead of schedule, delivering c.£36 million of annualised cost savings in FY 2026 against a target of c.£25 million. As execution continues through FY 2027, we expect to realise further benefits of our cost initiatives, supporting sustainable growth, driving operating leverage and positioning us to deliver further efficiency in the future.
Loan book growth accelerated through the second half of FY 2026 as the benefits of our strategic actions became increasingly evident across the business. With all divisions delivering growth in the final quarter, we enter FY 2027 with confidence to achieve our target of 5-10% p.a. growth through the cycle.
Capital (CET1 ratio) remains elevated at 14.1% against a medium-term target range of 12-13%, with capacity to absorb Basel 3.1 from 1 January 2027, and to support growth opportunities across all divisions. During the year, we added c.£165 million to our provision in relation to the FCA's motor finance consumer redress scheme, which now stands at c.£320 million. As we await further clarity on the outcome, our focus remains on the execution of our strategy.
We are now a simpler, more focused specialist bank, better positioned to serve customers, invest in growth and enhance returns for shareholders. The progress we have made this year gives me confidence in our strategy and I remain fully committed to returning the group to double-digit returns by FY 2028, rising thereafter."
Key Financials1
Unless otherwise stated, all metrics refer to continuing operations only
|
|
2026 £ million |
2025 £ million |
Change % |
|
Operating loss before tax |
(60.3) |
(122.4) |
(51) |
|
Adjusted operating profit2 |
120.3 |
144.3 |
(17) |
|
Profit from discontinued operations, net of tax3 |
2.0 |
49.2 |
(96) |
|
Loss attributable to shareholders and other equity owners (continuing and discontinued operations) |
(63.4) |
(77.9) |
(19) |
|
|
|
|
|
|
Adjusted basic earnings per share (continuing operations)2,4 |
47.5p |
59.3p |
|
|
Basic (loss)/earnings per share (continuing operations)4 |
(58.5)p |
(99.8)p |
|
|
Basic (loss)/earnings per share (continuing and discontinued operations)3,4 |
(57.1)p |
(66.9)p |
|
|
|
|
|
|
|
Ordinary dividend per share |
- |
- |
|
|
Return on opening equity5 |
4.9% |
6.2% |
|
|
Return on average tangible equity5 |
5.5% |
7.1% |
|
|
Net interest margin |
6.9% |
7.2% |
|
|
Bad debt ratio |
1.0% |
1.0% |
|
|
Expense/income ratio |
67% |
65% |
|
|
|
31 July 2026 |
31 July 2025 |
Change |
|
Loan book6 |
£9.5bn |
£9.5bn |
- |
|
Net asset value ("NAV") per share (continuing and discontinued operations) |
£9.7 |
£10.3 |
|
|
Tangible net asset value ("TNAV") per share (continuing and discontinued operations) |
£8.7 |
£9.1 |
|
|
CET1 capital ratio (continuing and discontinued operations)7 |
14.1% |
13.8% |
|
|
Tier 1 capital ratio (continuing and discontinued operations)7 |
16.3% |
15.8% |
|
|
Total capital ratio (continuing and discontinued operations)7 |
19.1% |
17.8% |
|
|
1. |
Please refer to definitions on pages 23 to 25. |
|
2. |
Adjusted measures are presented on a basis consistent with prior periods and exclude any exceptional and adjusting items which do not reflect underlying trading performance. Current adjusting items include: customer remediation provisions, unwind of time value discount, and operational or legal costs incurred in relation to an event that is deemed to be adjusting, Close Brewery Rentals Limited ("CBRL") which was sold in the year, Close Brothers Vehicle Hire ("CBVH") which is in wind-down, restructuring costs and amortisation of intangible assets on acquisition. There are no exceptional items presented in these financial results. Please refer to the Basis of presentation on page 5 for further information, and the tables on page 10 for details on the reconciliation between adjusted and statutory measures. |
|
3. |
Discontinued operations relate to Close Brothers Asset Management and Winterflood, which have been classified as "discontinued operations" in the group's income statement for the 2025 and 2026 financial years in line with the requirements of IFRS 5. The related assets and liabilities were classified as held for sale on the group's balance sheet at 31 July 2025. Please refer to Note 20 "Discontinued operations and assets and liabilities classified as held for sale". |
|
4. |
Refer to Note 4 "Earnings per Share" for the calculation of basic and adjusted earnings per share. |
|
5. |
Return on average tangible equity, defined as adjusted operating profit less tax and AT1 coupons divided by average total shareholders' equity, excluding intangible assets and AT1, for continuing operations. See footnote 7 on page 10 for further details. |
|
6. |
Loan book includes operating lease assets of £1.1 million (31 July 2025: £1.3 million) and excludes £130.0 million (31 July 2025: £165.0 million) of operating lease assets related to CBVH, which is in wind-down, and £nil (31 July 2025: £41.0 million) of operating lease assets related to CBRL, sold on 31 August 2025. |
|
7. |
IFRS 9 transitional arrangements ceased to apply and therefore had no impact on regulatory capital at 31 July 2026. Capital ratios at 31 July 2025 shown after applying IFRS 9 transitional arrangements and the Capital Requirements Regulation ("CRR") transitional and qualifying own funds arrangements in force at the time. Without their application, at 31 July 2025 the CET1 capital ratio would be 13.7%, tier 1 capital ratio 15.7% and total capital ratio 17.8%. |
Strategic Highlights
|
• |
We completed the sales of Close Brewery Rentals Limited and Winterflood in August and December 2025 respectively, largely completing the simplification of the group. The run-off of Close Brothers Vehicle Hire and the repositioning of Premium Finance towards commercial lines are progressing well, in line with plans |
|
• |
Our transformation programme has delivered c.£36 million of annualised cost savings in the 2026 financial year, ahead of schedule and substantially higher than the c.£25 million latest target. We now expect to exceed £60 million of annualised cost savings by the end of the 2027 financial year |
|
• |
Planning for the next phase of restructuring is well underway, focusing on the development of shared enterprise-wide services and digital adoption. We continued to develop technology, data and AI capabilities, with the aim of improving efficiency, reducing costs and enhancing customer experience |
|
• |
We continued to optimise our balance sheet position and successfully issued a number of debt transactions during the year |
|
• |
Repositioning the business and focusing on new growth initiatives has led to growth resuming during the second half of the year, with all divisions delivering loan book growth in the final quarter. Growth remains diversified across our specialist businesses, giving us confidence in achieving our target of 5-10% p.a. growth through the cycle |
Financial Performance
|
• |
Adjusted operating profit of £120.3 million (2025: £144.3 million), with the repositioning of our business and current market conditions resulting in lower income. RoTE of 5.5% (2025: 7.1%) |
|
• |
Adjusted operating income decreased 6% to £642.9 million (2025: £681.2 million), with a net interest margin of 6.9% (2025: 7.2%), in line with guidance, reflecting business repositioning and mix impacts as we focus on risk-adjusted returns |
|
• |
The loan book was flat at £9.5 billion (31 July 2025: £9.5 billion). On an underlying basis1 the loan book increased 2% year-on-year and 4% in the second half |
|
• |
Adjusted operating expenses reduced to £430.9 million (2025: £445.1 million), materially better than guidance, reflecting strong cost discipline and accelerated delivery of cost initiatives |
|
• |
Adjusted impairment losses on financial assets of £91.7 million (2025: £91.8 million), with a stable bad debt ratio of 1.0% (2025: 1.0%) reflecting the implementation of an updated IFRS 9 model for the Motor Finance book, offset by an increase in individually assessed provisions on a small number of facilities in Property, including legacy cases |
|
• |
Additional provision of £164.7 million in the year in relation to motor finance commissions. Our provision remains unchanged since the Q3 2026 trading update at c.£320 million |
|
• |
CET1 capital ratio of 14.1% (31 July 2025: 13.8%), remaining above the medium-term target range of 12-13% and including the impact of the c.£320 million provision in relation to motor finance commissions |
|
• |
Given the continued uncertainty regarding the outcome of the legal challenges to the FCA's motor finance consumer redress scheme and any potential financial impact, the group will not pay a final dividend on its ordinary shares for the 2026 financial year |
|
• |
The progress achieved this year reinforces our confidence in the delivery of our target of double-digit return on tangible equity by the 2028 financial year, rising thereafter |
Guidance
|
We have delivered the 2026 financial year targets originally set out at the 2025 results and are now providing new guidance for the 2027 financial year to support delivery of our 2028 financial year and medium-term objectives. |
|
1. |
Underlying loan book excludes the planned reduction in the personal lines book of Premium Finance and run-off of the legacy Republic of Ireland Motor Finance business. |
FY 2027 guidance
|
• |
Loan book: We expect underlying loan book growth of 5-10%, subject to market conditions |
|
|
|
- |
Following the withdrawal from selected personal lines relationships in Premium Finance, our planned exit broker cohort will be substantially run-off by the end of the 2027 financial year, impacting growth by c.1% / c.£100 million |
|
• |
Net interest margin: All else equal, we expect the net interest margin to be slightly below FY 2026 reflecting a further c.0.1% impact from mix, including Premium Finance repositioning |
|
|
• |
Costs: We expect adjusted operating expenses of c.£430 million in FY 2027, with cost savings broadly offsetting inflation and selective investment to support growth |
|
|
• |
Adjusting items: We continue to expect restructuring costs of c.£30-40 million in FY 2027 |
|
|
• |
Adjusting items: Other motor finance commissions related costs, broadly similar to FY 2026 (2026: £7.7 million) |
|
|
• |
Cost savings: We now expect to exceed £60 million of annualised cost savings by the end of FY 2027 |
|
|
• |
Bad debt ratio: We expect the bad debt ratio to remain below our long-term average of 1.2% |
|
|
• |
Capital: We expect the CET1 capital ratio to operate within the medium-term target range of 12-13%, after absorbing the impact of Basel 3.1 and loan book growth |
|
|
• |
RoTE: Modest increase on FY 2026, as we continue to deliver the optimisation stage of the strategy |
|
Medium-term guidance
|
• |
Loan book: We expect loan book growth of 5-10%, through the cycle |
|
• |
Net interest margin: We expect the net interest margin to remain slightly below 7% |
|
• |
Costs: We now expect adjusted operating expenses to be at the lower end of the £410-430 million range in the 2028 financial year |
|
• |
Expense/income ratio: We continue to target an expense/income ratio of below 60% by FY 2028, demonstrating the scalability of the group's operating model as growth returns |
|
• |
Bad debt ratio: We expect the bad debt ratio to remain below our long-term average of 1.2% |
|
• |
Capital: We expect the CET1 capital ratio to operate within the medium-term target range of 12-13% |
|
• |
RoTE: We continue to target double-digit RoTE by FY 2028, rising thereafter |
Shareholder distributions
We remain committed to the resumption of shareholder distributions at an appropriate time and will reassess our options as greater certainty emerges regarding motor finance commissions, taking into account the group's future capital needs and shareholder feedback.
Presentation
A virtual presentation to analysts and investors will be held today at 9.30 am BST followed by a Q&A session.
A webcast and dial-in facility will be available by registering at:
https://webcasts.closebrothers.com/results/2026preliminaryresults
Enquiries
|
Maritz Carvalho |
Close Brothers Group plc |
020 3857 6063 |
|
Sam Cartwright |
H/Advisors |
07827 254 561 |
About Close Brothers
Close Brothers is a UK specialist banking group providing lending and deposit taking. We employ approximately 2,500 people, principally in the United Kingdom and Ireland. Close Brothers Group plc is listed on the London Stock Exchange.
Basis of presentation
Results are presented both on a statutory and an adjusted basis to aid comparability between periods. Adjusted measures are presented on a basis consistent with prior periods and exclude any exceptional and adjusting items which do not reflect underlying trading performance. Current adjusting items include customer remediation provisions, unwind of the time value discount, and operational or legal costs incurred in relation to an event that is deemed to be adjusting, Close Brewery Rentals Limited ("CBRL") which was sold in the year, Close Brothers Vehicle Hire ("CBVH") which is in wind-down, restructuring costs and amortisation of intangible assets on acquisition. There are no exceptional items presented in these financial results.
Discontinued operations relate to Close Brothers Asset Management ("CBAM") and Winterflood Securities ("Winterflood"), which were classified as discontinued operations in the group's income statement in the 2025 and 2026 full year results. Winterflood's assets and liabilities were classified as held for sale on the group balance sheet at 31 July 2025. The sale of CBAM completed on 28 February 2025, and the sale of Winterflood completed on 1 December 2025; therefore no assets or liabilities in respect of these businesses remain on the balance sheet at 31 July 2026. The sale of CBRL completed on 31 August 2025. The assets and liabilities of this business were classified as held for sale on the group balance sheet at 31 July 2025. No assets or liabilities in respect of this business remain on the balance sheet at 31 July 2026.
Chief Executive's Statement
I am encouraged by the progress we have made in delivering our strategy over the past 12 months. From the start of the financial year with the successful appeal of the "Hopcraft" case at the Supreme Court and the conclusions of the Financial Conduct Authority ("FCA") on their Market Study Review into Premium Finance, through to the sales of Winterflood Securities and Brewery Rentals, the 2026 financial year has been a year of progress and change, resulting in significant repositioning of the group as a focused specialist lender. Our transformation activities have gained real momentum, with cost savings delivered ahead of schedule. The underlying loan book returned to growth, with all divisions growing in the final quarter. We have laid the foundations for improved returns in the future.
Nonetheless, our return on average tangible equity ("RoTE") of 5.5% for FY 2026 remains below both last year and where we expect Close Brothers to operate over the medium term. While the comparison to prior year is impacted by the repositioning, simplification and refocus we have undertaken, we recognise that improved returns must be demonstrated through performance. With growth building across our divisions, and the benefits of strategic actions increasingly coming through, we are well positioned to build on this progress through FY 2027, and remain confident in achieving our target of double-digit returns by FY 2028, rising thereafter.
Financial performance reflects delivery of FY 2026 targets
Overall, adjusted operating profit reduced 17% to £120.3 million (2025: £144.3 million) and return on average tangible equity reduced 160 basis points (bps) to 5.5% (2025: 7.1%), primarily driven by lower income reflecting both the repositioning of the business and prevailing market conditions.
The loan book was flat over the year, as a modest reduction in the first half was offset by growth in the second. On an underlying basis, the loan book increased 2% year on year, and 4% in the second half. All divisions grew in the fourth quarter.
The net interest margin was 6.9% (2025: 7.2%), in line with guidance, and credit performance remained resilient, with a bad debt ratio of 1.0% (2025: 1.0%), in line with prior year and guidance of below the long-term average of 1.2%.
Adjusted operating expenses of £430.9 million (2025: £445.1 million) were better than guidance, primarily driven by the acceleration of cost initiatives into the current year.
On a statutory basis, we reported a pre-tax loss of £60.3 million (2025: pre-tax loss of £122.4 million) reflecting a number of adjusting items, notably the increase in our motor finance provision to c.£320 million (31 July 2025: £165.0 million), as well as restructuring costs and other adjusting items outlined in further detail on page 12.
Our CET1 capital ratio remains strong at 14.1% (2025: 13.8%), comfortably ahead of both our medium-term target range of 12-13% and the applicable regulatory minimum.
We have maintained a strong funding position with a 12-month average liquidity coverage ratio ("LCR") of 1,113% (2025: 1,012%) as we continue to optimise the balance sheet, supported by a number of debt transactions in the second half of the financial year.
During the year, we increased our provision in respect of motor finance commissions by £164.7 million, and it now stands at c.£320 million. While we recognise the ongoing uncertainty posed by the legal challenges to the FCA's redress scheme, we continue to prepare for the delivery of redress under the scheme as well as preparing for the possibility of alternative scenarios that could arise from the legal challenges. As we await clarity on the outcome, our focus remains on the execution of our strategy.
Delivering on our strategic priorities
In FY 2026 we have continued to deliver on our strategic priorities to simplify, optimise and grow the business, reinforcing our confidence in achieving our target of double-digit returns by the 2028 financial year, rising thereafter.
We substantially concluded our simplification agenda with the sales of Winterflood Securities and Brewery Rentals both completing in the first half of the financial year. We are progressing with the run-off of the Vehicle Hire business, and the repositioning of our Premium Finance business towards commercial lines will be substantially complete in FY 2027.
At the start of the financial year, we initiated our transformation programme, which has now gained real momentum. In the first year we have delivered c.£36 million of annualised cost savings, substantially ahead of the c.£25 million target, and now expect to exceed £60 million of annualised cost savings by the end of the 2027 financial year primarily through streamlining of businesses and functions, increased use of outsourcing and offshoring, and reduction in our property footprint and third-party spend. In addition, we are now well into planning for the next stage of restructuring activity, with a focus on developing shared enterprise-wide services.
We are also continuing to develop our capabilities in AI and automation, where we see significant potential to improve efficiency, as well as develop proposition enhancements, growth enablers and solutions to improve the customer journey. To date, our AI and automation focus has been on developing and implementing practical solutions which deliver immediate benefits. Over time, we see scope for additional cost savings and loan book growth reflecting the deployment of AI, automation and digital solutions across the business.
Loan book growth has returned in the second half, and notwithstanding challenging market conditions, all our divisions delivered positive growth in the fourth quarter. Over the year, the loan book was up 2% on an underlying basis and flat overall, reflecting the planned run-off of certain Premium Finance personal lines brokers and our legacy Motor Finance business in Ireland. In addition to our core loan book performance, we are demonstrating our ability to convert targeted opportunities into scalable, high-quality growth across the divisions. This includes deals such as: Property Finance's £20 million Revolving Credit Facility with award-winning developer, gs8; innovative Asset Finance lending supporting SME growth in emerging clean-energy markets; and Premium Finance's strategic partnership with JMG, a top-30 UK insurance broker, covering approximately £500 million of gross underwritten assets.
We continue to see significant growth opportunities through a combination of overall market growth, share gains and new business initiatives. We are already seeing positive momentum in a number of our businesses: the Invoice Finance book grew 8% overall; Motor Finance grew 9% supported by strong growth in Ireland; and we have seen good momentum in a number of Asset Finance markets including Ireland. While the Property development market remains challenging, we are seeing acceleration of growth in the Build-to-Rent and across some regional territories.
As part of this, we are seeing an ongoing shift to larger transactions which typically have a lower net interest margin, but deliver high credit quality and attractive returns.
Overall, we see growth now trending towards our target of 5-10% p.a. through the cycle.
We are also continuing to optimise our balance sheet position, while maintaining prudent capital, funding and liquidity. The diversity of our funding base has helped to mitigate cost pressure in the deposit market, benefiting both from the breadth of our deposit offering and a number of debt transactions issued during the year. We have also started building contingent collateral, allowing us to further optimise the level and maturity of funding, while remaining in line with both our internal risk appetite and regulatory requirements.
Given the continued uncertainty regarding the outcome of the legal challenges to the FCA's motor finance consumer redress scheme and any potential financial impact, the group will not pay a final dividend on its ordinary shares for the 2026 financial year. We remain committed to the resumption of shareholder distributions at an appropriate time and will reassess our options as greater certainty emerges regarding motor finance commissions, taking into account the group's future capital needs and shareholder feedback.
Crucially, notwithstanding a period of unprecedented change, our most recent employee opinion survey shows that colleague engagement remains strong, supported by an active programme of internal communication and a number of new internal engagement forums.
Looking ahead
We enter the new financial year with confidence and remain focused on delivering sustainable growth and long-term value for our stakeholders. Although the external environment remains uncertain, we believe the group is well positioned to benefit from the opportunities available in our chosen markets. Demand for specialist lending and trusted banking services remains resilient, and we continue to see attractive growth prospects across our divisions.
FY 2027 will be an important year in demonstrating the benefits of the strategic changes we have made, as growth continues to build across the portfolio, and the impact of our cost actions increasingly come through. With continued investment through FY 2027 to support demand and fuel growth, we expect this to result in a modest improvement in returns.
As cost savings are more fully realised, and growth continues to accumulate, we expect FY 2028 to reflect the benefits of our strategy with greater operational leverage, enhanced efficiency and the accumulation of growth supporting double-digit returns.
As we move into the next stage of delivery of the group's strategy, we are making a number of changes to roles and responsibilities within the Executive Committee. Effective 1 October 2026, Matt Roper has been appointed to the newly created role of Chief Banking Officer with responsibility for the group's lending activities across Commercial, Retail and Property. Phil Hooper remains Chief Executive of Property, and Ian Cowie moves into the newly created role of Chief Operating Officer. I am in no doubt that these changes will help create greater focus on driving growth across our lending activities and strengthening our enterprise operating model.
It is with this confidence, we are reiterating our medium-term guidance and I remain fully committed to the targets we have set. I am confident that we are in the right businesses, have the right team, and have the early momentum to continue delivering on our strategy and to achieve our target of double-digit returns by 2028, rising thereafter.
Mike Morgan
Chief Executive
Financial overview
Summary group income statement1
|
|
2026 £ million |
2025 £ million |
Change % |
|
Adjusted operating income |
642.9 |
681.2 |
(6) |
|
Adjusted operating expenses |
(430.9) |
(445.1) |
(3) |
|
Adjusted impairment losses on financial assets |
(91.7) |
(91.8) |
- |
|
Adjusted operating profit |
120.3 |
144.3 |
(17) |
|
Commercial |
90.9 |
112.2 |
(19) |
|
Retail |
17.4 |
18.9 |
(8) |
|
Property |
49.0 |
67.2 |
(27) |
|
Group (central functions) |
(37.0) |
(54.0) |
(31) |
|
Adjusting items: |
|
|
|
|
Provision in relation to motor finance commissions |
(164.7) |
(165.0) |
- |
|
Other motor finance commissions related costs2 |
(7.7) |
(18.7) |
(59) |
|
Provision in relation to early settlements in Motor Finance |
(1.3) |
(33.0) |
(96) |
|
Restructuring costs |
(14.3) |
(2.3) |
n/a |
|
Amortisation of intangible assets on acquisition |
(0.2) |
(0.2) |
- |
|
Operating profit/(loss) from Close Brewery Rentals Limited3 |
6.8 |
(4.1) |
(266) |
|
Operating profit/(loss) from Close Brothers Vehicle Hire4 |
0.8 |
(43.4) |
(102) |
|
Operating loss before tax |
(60.3) |
(122.4) |
(51) |
|
Tax |
(5.1) |
(4.7) |
9 |
|
Loss after tax from continuing operations |
(65.4) |
(127.1) |
(49) |
|
|
|
|
|
|
Discontinued operations5: |
|
|
|
|
Close Brothers Asset Management |
1.1 |
63.9 |
(98) |
|
Winterflood |
0.9 |
(14.7) |
(106) |
|
Loss after tax (continuing and discontinued operations) |
(63.4) |
(77.9) |
(19) |
|
Attributable to: |
|
|
|
|
Shareholders |
(85.7) |
(100.2) |
(14) |
|
Other equity owners |
22.3 |
22.3 |
- |
|
Loss after tax attributable to shareholders and other equity owners |
(63.4) |
(77.9) |
(19) |
|
|
|
|
|
|
Adjusted basic earnings per share (continuing operations)1,6 |
47.5p |
59.3p |
|
|
Basic (loss)/earnings per share (continuing operations)6 |
(58.5)p |
(99.8)p |
|
|
Basic (loss)/earnings per share (continuing and discontinued operations)5,6 |
(57.1)p |
(66.9)p |
|
|
Ordinary dividend per share |
- |
- |
|
|
Return on opening equity |
4.9% |
6.2% |
|
|
Return on average tangible equity7 |
5.5% |
7.1% |
|
|
1. |
Income Statement presented includes continuing and discontinued operations. Adjusted measures are presented on a basis consistent with prior periods and exclude any exceptional and adjusting items which do not reflect underlying trading performance. Current adjusting items include: customer remediation provisions, unwind of the time value discount, and operational or legal costs incurred in relation to an event that is deemed to be adjusting, CBRL which was sold in the year, CBVH which is in wind-down, restructuring costs and amortisation of intangible assets on acquisition. There are no exceptional items presented in these financial results. Please refer to the Basis of presentation on page 5 for further information, and the tables below for details on the reconciliation between adjusted and statutory measures. |
|
2. |
Motor finance commissions related complaints handling, operational and legal costs, and unwind of the time value discount, partially offset by insurance recoveries. |
|
3. |
The sale of CBRL completed on 31 August 2025 and a gain of £6.4 million has been recognised. Please refer to Note 20 "Discontinued operations and assets and liabilities classified as held for sale". |
|
4. |
CBVH business is in wind-down. |
|
5. |
Discontinued operations relate to Close Brothers Asset Management and Winterflood, which have been classified as "discontinued operations" in the group's income statement for the 2025 and 2026 financial years in line with the requirements of IFRS 5. The related assets and liabilities were classified as held for sale on the group's balance sheet at 31 July 2025. Please refer to Note 20 "Discontinued operations and assets and liabilities classified as held for sale". |
|
6. |
Refer to Note 4 "Earnings per share" for the calculation of basic and adjusted basic earnings per share. |
|
7. |
Return on average tangible equity uses adjusted operating profit after tax from continuing operations, less AT1 coupons (2026: £71.3 million, 2025: £88.7 million). Average tangible equity excludes discontinued operations. Average tangible equity is calculated based on closing equity per the balance sheet (2026: £1,651.6 million, 2025: £1,735.5 million), less AT1 (2026 and 2025: £197.6 million), less intangibles (2026: £155.0 million, 2025: £166.3 million), less CBAM and WINS tangible equity (2026: £nil, 2025: £90.6 million). |
Reconciliation from adjusted to statutory income statement
|
|
|
Adjusting items reconciling adjusted to statutory performance |
|
|
||||||
|
Summary income statement for the year ended 31 July 2026 |
Adjusted £ million |
Provision in relation to motor finance commissions £ million |
Other motor finance commissions related costs £ million |
Provision in relation to early settlements in Motor Finance £ million |
Restructuring costs £ million |
Amortisation of intangible assets on acquisition £ million |
Close Brewery Rentals Limited (sold) £ million |
Close Brothers Vehicle Hire (in wind-down) £ million |
Total adjusting items £ million |
Statutory £ million |
|
Operating income |
642.9 |
- |
(10.7) |
(1.3) |
- |
- |
7.2 |
12.9 |
8.1 |
651.0 |
|
Operating expenses |
(430.9) |
(164.7) |
3.0 |
- |
(14.3) |
(0.2) |
(0.4) |
(12.0) |
(188.6) |
(619.5) |
|
Impairment losses on financial assets |
(91.7) |
- |
- |
- |
- |
- |
- |
(0.1) |
(0.1) |
(91.8) |
|
Operating profit/(loss) before tax |
120.3 |
(164.7) |
(7.7) |
(1.3) |
(14.3) |
(0.2) |
6.8 |
0.8 |
(180.6) |
(60.3) |
|
|
|
Adjusting items reconciling adjusted to statutory performance |
|
|
||||||
|
Summary income statement for the year ended 31 July 2025 |
Adjusted £ million |
Provision in relation to motor finance commissions £ million |
Other motor finance commissions related costs £ million |
Provision in relation to early settlements in Motor Finance £ million |
Restructuring costs £ million |
Amortisation of intangible assets on acquisition £ million |
Close Brewery Rentals Limited loss (sold) £ million |
Close Brothers Vehicle Hire loss (in wind-down) £ million |
Total adjusting items £ million |
Statutory £ million |
|
Operating income |
681.2 |
- |
- |
- |
- |
- |
5.9 |
(27.6) |
(21.7) |
659.5 |
|
Operating expenses |
(445.1) |
(165.0) |
(18.7) |
(33.0) |
(2.3) |
(0.2) |
(9.8) |
(15.0) |
(244.0) |
(689.1) |
|
Impairment losses on financial assets |
(91.8) |
- |
- |
- |
- |
- |
(0.2) |
(0.8) |
(1.0) |
(92.8) |
|
Operating profit/(loss) before tax |
144.3 |
(165.0) |
(18.7) |
(33.0) |
(2.3) |
(0.2) |
(4.1) |
(43.4) |
(266.7) |
(122.4) |
Statutory operating loss
The group reported a statutory operating loss before tax of £60.3 million (2025: £122.4 million). Underlying operating profit was more than offset by £180.6 million of adjusting items, predominantly the £164.7 million increase in provision in relation to motor finance commissions during the year.
Adjusted operating profit
Adjusted operating profit decreased 17% to £120.3 million (2025: £144.3 million), reflecting the reduction in income from the repositioning of our business and prevailing market conditions. The operating loss in Group (central functions), which includes the central functions such as finance, legal and compliance, risk and human resources, reduced to £37.0 million (2025: £54.0 million), primarily driven by a reduction in legal and professional costs.
Return on opening equity reduced to 4.9% (2025: 6.2%) and return on average tangible equity reduced to 5.5% (2025: 7.1%) primarily reflecting the reduction in adjusted operating profit. We remain committed to achieving our target of double-digit RoTE by the 2028 financial year, rising thereafter.
Adjusted operating income
Adjusted operating income decreased 6% to £642.9 million (2025: £681.2 million), driven by the repositioning of our businesses, including the wind-down of Novitas and the planned reduction of personal lines in Premium Finance. Income also reflects a lower underlying net interest margin and average loan book, reflecting the impact of prevailing market conditions, particularly on our Property Finance book.
The net interest margin across the lending divisions declined to 6.9% (2025: 7.2%), in line with guidance, with the reduction primarily reflecting the repositioning of the business and changes in mix, including the wind-down of Novitas, repositioning of Premium Finance and the focus on larger deals with attractive risk-adjusted returns. All else equal, we expect the net interest margin in the 2027 financial year to be slightly below FY 2026 reflecting further c.0.1% impact from mix, including Premium Finance repositioning.
Group (central functions) reported income of £(8.2) million (2025: £(11.7) million), representing the net cost of group funding, which was lower than the prior year due to higher interest earned on cash balances.
Adjusted operating expenses
Adjusted operating expenses reduced 3% to £430.9 million (2025: £445.1 million), better than guidance of c.£450 million, reflecting strong cost discipline and the acceleration of cost-saving initiatives. Through our transformation programme, we have delivered c.£36 million of annualised cost savings, substantially ahead of our c.£25 million target, through lower staff costs, which include the benefits of offshoring, a reduction in adviser costs, lower third-party spend and a reduced property footprint.
Expenses in Group (central functions) reduced 32% to £28.8 million (2025: £42.3 million) primarily reflecting lower legal and professional fees.
Overall, the group's expense/income ratio increased to 67% (2025: 65%), reflecting the lower income in the period. The compensation ratio marginally increased to 35% (2025: 34%), notwithstanding a reduction in variable compensation.
We now expect to exceed £60 million of annualised savings by the end of the 2027 financial year, primarily through streamlining of businesses and functions, increased use of outsourcing and offshoring, and reduction in our property footprint and third-party spend. In addition, we are now well into planning for the next stage of restructuring activity, with a focus on developing shared enterprise-wide services and further deployment of AI, automation and digital solutions.
We expect the group's adjusted operating expenses to be c.£430 million in the 2027 financial year, with cost savings broadly offsetting inflation and selective investment to support growth, and at the lower end of the £410-430 million range in the 2028 financial year.
Adjusted impairment charges and IFRS 9 provisioning
Adjusted impairment charges remained stable at £91.7 million (2025: £91.8 million), equivalent to a bad debt ratio of 1.0% (2025: 1.0%). The impairment charge reflects an increase in individually assessed provisions in Property on a small number of facilities, including legacy cases, which was partially offset by the implementation of an updated IFRS 9 model which recognises the evolving composition and behaviour of the Motor Finance book. The bad debt ratio remains comfortably below our long-term average of 1.2%. Overall, provision coverage was broadly unchanged at 2.7% (31 July 2025: 2.6%).
Since the 2025 financial year end, we have updated the macroeconomic scenarios we source from Moody's Analytics to reflect the latest available information. The weightings assigned to the scenarios remain unchanged.
Whilst we have not seen a significant impact on credit performance outside of a small number of facilities in Property, we continue to monitor closely the evolving impacts of inflation and cost of living on our customers. We remain confident in the quality of our loan book, which is predominantly secured or structurally protected, prudently underwritten, diverse, and supported by the deep expertise of our people. We expect the bad debt ratio for the 2027 financial year to remain below our long-term average of 1.2%.
Adjusting items
We recognised £180.6 million of adjusting items in 2026 (2025: £266.7 million).
During the year, we increased our provision in relation to motor finance commissions by c.£135 million in October 2025 and c.£30 million in April 2026, resulting in an income statement charge of £164.7 million, bringing the total provision to c.£320 million. At 31 July 2026, the provision decreased slightly to £318.5 million, reflecting further cost utilisation, partially offset by an unwinding of the discount relating to the time value of money.
Our provisioning approach reflects the rules outlined in FCA Policy Statement PS26/3: Motor Finance Consumer Redress Scheme (the "scheme"), which was published on 30 March 2026. While there are aspects of the scheme that we disagree with, in order to provide an orderly resolution for all parties, Close Brothers decided not to challenge the scheme.
There have been four legal challenges, with parts of the scheme currently suspended by the Upper Tribunal on terms agreed between the FCA and the challengers, and therefore delaying calculation or payment of redress owed under the scheme. Notwithstanding this, we continue to gather additional data, progress complaints and prepare operationally as we await the outcome of the challenges. The ultimate cost to the group remains subject to the outcome of the legal challenges to the scheme and any further legal, regulatory or industry developments, including court claims and complaints from consumers.
In addition, we have incurred a charge of £7.7 million largely reflecting the unwind of the time value discount and other legal costs, partially offset by insurance recoveries.
We recognised £7.6 million of operating profit from the group's rentals businesses, Close Brewery Rentals Limited ("CBRL") (sold 31 August 2025), and Close Brothers Vehicle Hire ("CBVH") (in wind-down), primarily reflecting the £6.4 million gain on disposal of CBRL.
We incurred £14.3 million (2025: £2.3 million) of restructuring costs, primarily relating to redundancy and associated costs. We expect to incur c.£30-40 million in the 2027 financial year.
The charge of £1.3 million (2025: £33.0 million) in respect of the provision in relation to early settlements in Motor Finance is the unwind of the time value discount in the year.
Tax
The tax expense in 2026 was £5.1 million (2025: £4.7 million). The effective tax rate for the period was (8.5)% (2025: (3.8)%), including the £164.7 million provision charge (£147.0 million net of tax) in relation to motor finance commissions (2025: including the £165.0 million provision charge (£155.7 million net of tax) in relation to motor finance commissions and the £33.0 million (£30.3 million net of tax) provision for the proactive customer remediation programme in relation to early settlement of loans in Motor Finance). Excluding the provisions, the effective tax rate would have been approximately 22% (2025: approximately 22%). Please refer to Note 3 "Tax" for further details on the group's taxation.
Discontinued operations
On 1 December 2025, we completed the sale of Winterflood Securities to Marex Group plc.
Following completion of the disposal of Winterflood, there are no assets or liabilities classified as held for sale on the balance sheet at 31 July 2026, and minimal impact through the income statement.
Winterflood delivered total profit after tax of £0.9 million (2025: loss after tax of £14.7 million).
For further information on the discontinued operations, refer to Note 20 "Discontinued operations and assets and liabilities classified as held for sale".
Earnings per share
Adjusted basic earnings per share ("AEPS") for continuing operations decreased to 47.5p (2025: 59.3p) and basic earnings per share ("EPS") for continuing operations increased to (58.5)p (2025: (99.8)p).
Basic earnings per share for continuing and discontinued operations increased to (57.1)p (2025: (66.9)p).
Both the adjusted and basic EPS calculations include the payment of the coupon related to the Fixed Rate Resetting Additional Tier 1 Perpetual Subordinated Contingent Convertible Securities ("AT1"), at an annual rate of 11.125%, in December 2025 and May 2026, amounting to £22.3 million. The associated coupon is deducted from retained earnings, reducing the profit attributable to ordinary shareholders.
Dividend
Given the continued uncertainty regarding the outcome of the legal challenges to the FCA's motor finance consumer redress scheme and any potential financial impact, the group will not pay a final dividend on its ordinary shares for the 2026 financial year. We remain committed to the resumption of shareholder distributions at an appropriate time and will reassess our options as greater certainty emerges regarding motor finance commissions, taking into account the group's future capital needs and shareholder feedback.
Summary group balance sheet
|
|
31 July |
31 July |
|
Loans and advances to customers and operating lease assets1 |
9,594.3 |
9,625.7 |
|
Treasury assets2 |
1,758.7 |
2,770.4 |
|
Assets classified as held for sale3 |
- |
934.0 |
|
Other assets |
705.4 |
741.8 |
|
Total assets |
12,058.4 |
14,071.9 |
|
Deposits by customers |
7,876.2 |
8,799.3 |
|
Borrowings4 |
1,886.7 |
2,188.3 |
|
Liabilities classified as held for sale3 |
- |
773.4 |
|
Other liabilities |
643.9 |
575.4 |
|
Total liabilities |
10,406.8 |
12,336.4 |
|
Equity5 |
1,651.6 |
1,735.5 |
|
Total liabilities and equity |
12,058.4 |
14,071.9 |
|
1. |
Includes operating lease assets of £131.1 million (31 July 2025: £166.3 million). |
|
2. |
Treasury assets comprise cash and balances at central banks and non-cash high quality liquid assets ("HQLAs") held to support the group. |
|
3. |
Assets and liabilities relating to CBRL and discontinued operation Winterflood were classified as held for sale on the group's balance sheet at 31 July 2025. Please refer to Note 20 "Discontinued operations and assets and liabilities classified as held for sale". |
|
4. |
Borrowings comprise debt securities in issue, loans and overdrafts from banks and subordinated loan capital. |
|
5. |
Equity includes the group's £200.0 million Fixed Rate Reset Perpetual Subordinated Contingent Convertible Securities (AT1 securities), net of £2.4 million transaction costs, which are classified as an equity instrument under IAS 32. |
The group maintained a strong balance sheet and continues to take a prudent approach to managing its financial resources. The fundamental structure of the balance sheet remains unchanged, with most of the assets and liabilities relating to our lending divisions. Loans and advances to customers and operating lease assets make up the majority of assets. Other items on the group's balance sheet include treasury assets, with intangibles, property, plant and equipment, and prepayments included as other assets. Liabilities are predominantly made up of customer deposits and both secured and unsecured borrowings to fund the loan book.
Total assets reduced to £12.1 billion (31 July 2025: £14.1 billion), primarily due to a 37% reduction in treasury assets reflecting a planned reduction in excess liquidity and the completion of the sales of Winterflood and CBRL, which no longer feature on the group balance sheet.
Total liabilities reduced to £10.4 billion (31 July 2025: £12.3 billion), due to a 10% decrease in customer deposits reflecting our lower funding requirement in the 2026 financial year, and the completion of the sales of Winterflood and CBRL.
Total equity was broadly flat at £1.7 billion at 31 July 2026 (31 July 2025: £1.7 billion).
The group's return on assets excluding discontinued operations was 0.6% (31 July 2025: 0.7%).
Group Capital
|
|
31 July 2026 £ million |
31 July 2025 £ million |
|
Common Equity Tier 1 capital |
1,266.1 |
1,348.1 |
|
Tier 1 capital |
1,466.1 |
1,548.1 |
|
Total capital |
1,716.1 |
1,748.1 |
|
Risk weighted assets |
8,971.8 |
9,798.5 |
|
Common Equity Tier 1 capital ratio1 |
14.1% |
13.8% |
|
Tier 1 capital ratio1 |
16.3% |
15.8% |
|
Total capital ratio1 |
19.1% |
17.8% |
|
Leverage ratio2 |
13.5% |
12.9% |
|
1. |
IFRS 9 transitional arrangements ceased to apply and therefore had no impact on regulatory capital at 31 July 2026. Capital ratios at 31 July 2025 shown after applying IFRS 9 transitional arrangements and the Capital Requirements Regulation ("CRR") transitional and qualifying own funds arrangements in force at the time. Without their application, at 31 July 2025 the CET1 capital ratio would be 13.7%, tier 1 capital ratio 15.7% and total capital ratio 17.8%. |
|
2. |
The leverage ratio is calculated as tier 1 capital as a percentage of non-risk-weighted total exposures, adjusted for certain capital deductions, including intangible assets, and off-balance sheet exposures. |
Movements in capital and other regulatory metrics
The CET1 capital ratio increased from 13.8% to 14.1%, mainly driven by the recognition of other profits attributable to shareholders (c.80bps), and total credit risk RWA reduction (c.70bps), predominately related to loan book RWA reduction (c.50bps). The sale of Winterflood contributed c.50bps. These benefits were partially offset by the additional provision in relation to motor finance commissions (-c.150bps) and AT1 coupon payments in the year (-c.20bps).
CET1 capital decreased 6% to £1,266.1 million (31 July 2025: £1,348.1 million), primarily driven by the £147.0 million net of tax provision in relation to motor finance commissions, AT1 coupon payments of £22.3 million, partially offset by the recognition of the group's other profits attributable to shareholders in the year of £82.5 million.
Tier 1 capital decreased by 5% and total capital decreased by 2% to £1,466.1 million and £1,716.1 million respectively (31 July 2025: £1,548.1 million and £1,748.1 million respectively), reflecting the same movements in relation to CET1 capital. Total capital also reflects a £50 million increase in Tier 2 capital as the group issued £250 million Fixed Rate Subordinated Tier 2 Notes and conducted a tender offer for £200 million Fixed Rate Subordinated Notes.
RWAs decreased 8% to £9.0 billion (31 July 2025: £9.8 billion), driven by a reduction in credit risk RWAs (£568.5 million), operational risk RWAs (£158.1 million) and market risk RWAs (£114.0 million).
The decline in credit risk RWAs was driven by a £350.3 million decrease in loan book RWAs across the Property and Premium Finance businesses mainly due to lower loan book balances and also reflecting the beneficial impact of the ENABLE Build Guarantee Scheme within the Property business. In addition, other credit risk RWAs decreased by £204.3 million, largely due to reductions in Novitas receivables, operating lease exposures, and prepayments together with the disposals of Winterflood and Brewery Rentals.
The reduction in operational risk and market risk RWAs was primarily driven by the Winterflood disposal.
As a result, CET1, tier 1 and total capital ratios were 14.1% (31 July 2025: 13.8%), 16.3% (31 July 2025: 15.8%) and 19.1% (31 July 2025: 17.8%), respectively.
The applicable CET1, tier 1 and total capital ratio requirements, including capital requirements directive ("CRD") buffers but excluding any applicable PRA buffer, were 10.3%, 12.3% and 14.9%, respectively, at 31 July 2026, following the regular periodic review of our capital requirements. Accordingly, our CET1 capital headroom of c.380bps is significantly above the applicable requirements, despite the impact of the post-tax £147.0 million provision charge in relation to motor finance commissions.
The leverage ratio, which is a transparent measure of capital strength not affected by risk weightings, increased to 13.5% (31 July 2025: 12.9%).
Capital outlook
We currently estimate that the implementation of Basel 3.1 on 1 January 2027 will result in a reduction in the group's CET1 capital ratio of approximately 80bps with the minimum CET1 capital requirement reducing by c.40bps, reflecting the PRA's Pillar 2a SME Lending Adjustment, which was introduced to mitigate the impact of the removal of the Pillar 1 SME support factor under the Basel 3.1 framework. On a pro forma basis, this would reduce the group's CET1 capital ratio as at 31 July 2026 to 13.3%, against the minimum CET1 capital requirement of 9.9%, resulting in overall CET1 capital headroom of c.340bps.
In monetary terms, the impact on the group's overall CET1 capital headroom is minimal.
In the medium-term, we expect to operate within our guidance range of 12-13%, as we generate capital, target balance sheet growth and resume shareholder distributions, at an appropriate time.
We continue to make positive progress in our preparations for a transition to the IRB approach. Following the submission of our initial application to the PRA in December 2020, the firm received positive feedback from the PRA on Phase II of its application in December 2025, which is currently being progressed by management.
Group funding1
|
|
31 July 2026 £ million |
31 July 2025 £ million |
|
Customer deposits |
7,876.2 |
8,799.3 |
|
Secured funding |
479.0 |
1,077.4 |
|
Unsecured funding2,3 |
1,406.8 |
1,109.4 |
|
Equity |
1,651.6 |
1,735.5 |
|
Total available funding |
11,413.6 |
12,721.6 |
|
Total available funding as a percentage of loan book4 |
119% |
132% |
|
Average maturity of funding allocated to loan book5 |
20 months |
18 months |
|
1. |
Numbers relate to core funding and exclude working capital facilities at the business level. |
|
2. |
Unsecured funding excludes £0.9 million (31 July 2025: £1.5 million) of non-facility overdrafts included in borrowings. |
|
3. |
Includes £250.0 million of funds raised via a senior unsecured bond with a five-year tenor by Close Brothers Group plc, the group's holding company, in June 2023, with proceeds currently used for general corporate purposes. |
|
4. |
Total funding as a percentage of loan book includes £131.1 million (31 July 2025: £207.3 million, of which £41.0 million for CBRL were classified as held for sale) of operating lease assets in the loan book figure. |
|
5. |
Simple weighted average of the applicable funding allocated to the loan book. The applicable funding excludes equity (except AT1 instruments) and deducts funding held for liquidity purposes. |
The Treasury function is focused on managing funding and liquidity to support the lending divisions, as well as managing interest rate risk. Our funding draws on a wide range of wholesale and deposit markets including several public debt securities at both group and operating company level, as well as public and private secured funding programmes and a diverse mix of customer deposits. This broad funding base reduces concentration risk and ensures we can adapt our position through the cycle.
We have maintained a prudent maturity profile, with the average maturity of funding allocated to the loan book at 20 months (31 July 2025: 18 months), ahead of the average loan book maturity at 16 months (31 July 2025: 15 months). The increase in the average maturity of funding allocated to the loan book reflects our access to unsecured funding markets with the issuance of a £250 million Tier 2 bond in February 2026 and a £250 million senior unsecured bond in June 2026.
Total funding decreased 10% to £11.4 billion (31 July 2025: £12.7 billion), which accounted for 119% (31 July 2025: 132%) of the loan book at the balance sheet date, as we sought to optimise funding and reduce liquidity from the elevated levels held during the recent period of uncertainty. The average cost of funding1 across our lending divisions reduced to 4.6% (2025: 5.4%) primarily reflecting the lower base rate in the year and active management of our funding base.
|
1. |
The cost of funding across our lending divisions interest expense (excluding relevant allocations to CBRL and CBVH) for the 2026 financial year was £436.1 million (31 July 2025: £520.8 million). |
The ongoing investment in our Savings capability, franchise and product offering has allowed us to significantly grow and diversify our retail deposit base in recent years. We have a suite of savings products available, providing us with optionality to access segments of the deposit market as needed, whilst providing a platform for future growth. As a proportion of total funding, our retail deposits have grown from 27% at the end of the 2022 financial year to account for 57% in 2026 (31 July 2025: 54%). Continued growth and diversification of our offering creates opportunity to further optimise funding cost and maturity in future years.
Over the year, customer deposits decreased 10% to £7.9 billion (31 July 2025: £8.8 billion) as we sought to optimise the pricing and level of deposit funding following strong growth in recent years, and reflect our lower funding requirements. Retail customer deposits decreased 4% to £6.6 billion (31 July 2025: £6.8 billion), with non-retail deposits reducing 32% to £1.3 billion (31 July 2025: £2.0 billion), in line with our funding plan. Across our funding base, only 10% of total deposits are available on demand and 56% have at least three months to maturity. At 31 July 2026 approximately 92% of retail deposits were protected by the Financial Services Compensation Scheme.
Secured funding decreased 56% to £0.5 billion (31 July 2025: £1.1 billion) following the repayment of an existing Motor Finance securitisation facility and a reduction on renewal of our Premium Finance securitisation facility, reflecting lower funding requirements and actions taken to optimise the liquidity position. Concurrently, the bank issued and retained a listed motor securitisation transaction, Orbita 2026-1. This resulted in the creation of £744 million Class A notes, which provide a significant increase to the group's contingent collateral pool, providing scope for further balance sheet optimisation.
Unsecured funding, which includes senior unsecured and subordinated bonds, increased 27% to £1.4 billion (31 July 2025: £1.1 billion), primarily reflecting the £250 million unsecured bond issuance in June 2026.
Moody's ratings for the group and CBL (Bank deposit rating), affirmed on 17 April 2026, are Baa2/P2 and A3/P2 respectively, with a negative outlook. Fitch Ratings ("Fitch") for both the group and CBL are BBB/F3, affirmed on 15 December 2025, with a negative outlook. Our credit ratings remain robust, and we retain strong access to funding markets.
Group liquidity
|
|
31 July 2026 £ million |
31 July 2025 £ million |
|
Cash and balances at central banks |
1,190.7 |
1,917.0 |
|
Sovereign and central bank debt |
340.1 |
601.6 |
|
Supranational, sub-sovereigns and agency ("SSA") bonds |
144.0 |
146.2 |
|
Covered bonds |
83.9 |
105.6 |
|
Treasury assets |
1,758.7 |
2,770.4 |
The group continues to ensure it is comfortably ahead of both internal risk appetite and regulatory requirements.
During the initial uncertainty regarding the outcome of the FCA's review of historical motor finance commission arrangements, we had deliberately maintained an elevated level of liquidity, which we have reduced to a more normal level over the year. Accordingly, treasury assets reduced 37% to £1.8 billion (31 July 2025: £2.8 billion). The majority of our treasury assets continue to be held on deposit with the Bank of England.
We have significantly increased our contingent collateral portfolio to £1.2 billion (31 July 2025: £0.2 billion)1 driven principally by the issuance of a public motor finance securitisation, Orbita 2026-1, which we retained in full, and we continue to maintain drawdown capacity at the Bank of England via pre-positioned loans.
We regularly assess and stress test the group's liquidity requirements and continue to materially exceed the liquidity coverage ratio ("LCR") regulatory requirements, with a 12-month average LCR to 31 July 2026 of 1,113% (31 July 2025: 1,012%). In addition to internal measures, we monitor funding risk based on the CRR rules for the net stable funding ratio ("NSFR"). The four-quarter average NSFR to 31 July 2026 was 144.0% (31 July 2025: 145.9%), well above regulatory requirements and internal risk appetite.
|
1. |
Contingent collateral portfolios are reported as gross values and exclude any applicable funding haircuts. |
Business Review
Commercial
|
|
2026 £ million |
2025 £ million |
Change % |
|
Adjusted operating income |
307.0 |
315.6 |
(3) |
|
Adjusted operating expenses |
(189.2) |
(185.6) |
2 |
|
Adjusted impairment losses on financial assets |
(26.9) |
(17.8) |
51 |
|
Adjusted operating profit |
90.9 |
112.2 |
(19) |
|
Adjusted operating profit, pre provisions for impairment losses |
117.8 |
130.0 |
(9) |
|
Adjusting items: |
|
|
|
|
Restructuring costs |
(7.2) |
(1.4) |
n/a |
|
Operating profit/(loss) from Close Brewery Rentals Limited1 |
6.8 |
(4.1) |
(266) |
|
Operating profit/(loss) from Close Brothers Vehicle Hire |
0.8 |
(43.4) |
(102) |
|
Statutory operating profit |
91.3 |
63.3 |
44 |
|
|
|
|
|
|
Net interest margin |
6.4% |
6.6% |
|
|
Expense/income ratio |
62% |
59% |
|
|
Bad debt ratio |
0.6% |
0.4% |
|
|
Closing loan book and operating lease assets2 |
4,886.2 |
4,729.3 |
3 |
|
1. |
The sale of CBRL completed on 31 August 2025 and a gain of £6.4 million has been recognised. Please refer to Note 20 "Discontinued operations and assets and liabilities classified as held for sale". |
|
2. |
Operating lease assets of £1.1 million (31 July 2025: £1.3 million). |
Commercial lends to more than 28,000 small and medium-sized enterprises through our in-house teams, where loans are originated via our direct sales force or introduced by third-party distribution channels. Asset Finance provides commercial asset financing, hire purchase and leasing solutions for a diverse range of assets and sectors. Invoice Finance provides debt factoring, invoice discounting and asset-based lending to SMEs and corporates.
The Commercial division has made good strategic progress during the year and is carrying healthy momentum into the 2027 financial year. Simplification activities are now largely complete through the winding down of Novitas, the sale of CBRL, winding down CBVH and other sub-scale products and a simplification of the federated divisional structure. Considerable progress has been made on the optimisation initiatives, with restructuring activity and an increased focus on harnessing automation and AI to both enhance efficiency and enable further growth.
The Commercial loan book grew 3% over the year, with 6% growth in the second half. We are benefiting from diversification across the division, with some areas including Asset Finance Ireland and Invoice Finance already delivering in line with our 5-10% target range. Our diversified business model and growing presence in Ireland provide additional avenues for sustainable expansion and we remain focused on growing selectively through disciplined execution and differentiated customer service.
Adjusted operating profit for Commercial decreased to £90.9 million (2025: £112.2 million), mainly driven by lower income and an increase in impairment charges, as well as the impact of Novitas on the prior year.
On a statutory basis, operating profit increased to £91.3 million (2025: £63.3 million), benefiting from the gain on sale of CBRL and non-recurrence of the CBVH impairment charge in the prior year, partially offset by restructuring costs.
Adjusted operating income decreased to £307.0 million (2025: £315.6 million) reflecting the wind-down of the Novitas book and lower behavioural fees in Asset Finance, as well as a decrease in net interest income in Invoice Finance. The net interest margin reduced marginally to 6.4% (2025: 6.6%) driven by Invoice Finance, reflecting a competitive market environment and lower average base rates during the year.
Adjusted operating expenses increased 2% to £189.2 million (2025: £185.6 million), as continued investment in technology was partially offset by the non-recurrence of Novitas expenses and lower staff costs in Asset Finance. The Commercial expense/income ratio increased to 62% (2025: 59%).
Adjusted impairment charges increased to £26.9 million (2025: £17.8 million), with the prior year benefiting from an impairment credit in respect of Novitas. This corresponded to a bad debt ratio of 0.6% (2025: 0.4%) and a stable provision coverage ratio of 1.5% (31 July 2025: 1.5%). Excluding Novitas, impairment charges increased to £27.7 million (2025: £24.6 million) reflecting loan book growth, with overall credit performance stable.
We expect the impact from Novitas to be minimal in the 2027 financial year.
Retail
|
|
2026 £ million |
2025 £ million |
Change % |
|
Adjusted operating income |
226.4 |
246.7 |
(8) |
|
Adjusted operating expenses |
(179.8) |
(183.3) |
(2) |
|
Impairment losses on financial assets |
(29.2) |
(44.5) |
(34) |
|
Adjusted operating profit |
17.4 |
18.9 |
(8) |
|
Adjusted operating profit, pre provisions for impairment losses |
46.6 |
63.4 |
(26) |
|
Adjusting items: |
|
|
|
|
Provision in relation to motor finance commissions |
(164.7) |
(165.0) |
- |
|
Other motor finance commissions related costs1 |
(7.7) |
(18.7) |
(59) |
|
Provision in relation to early settlements in Motor Finance |
(1.3) |
(33.0) |
(96) |
|
Restructuring costs |
(5.6) |
(0.6) |
n/a |
|
Amortisation of intangible assets on acquisition |
(0.2) |
(0.2) |
- |
|
Statutory operating loss |
(162.1) |
(198.6) |
(18) |
|
|
|
|
|
|
Net interest margin |
7.9% |
8.3% |
|
|
Expense/income ratio |
79% |
74% |
|
|
Bad debt ratio |
1.0% |
1.5% |
|
|
Closing loan book2 |
2,820.8 |
2,878.9 |
(2) |
|
1. |
Motor finance commissions-related complaints handling, operational and legal costs, and unwind of the time value discount, partially offset by insurance recoveries. |
|
2. |
The Motor Finance loan book includes £7.7 million (31 July 2025: £32.1 million) relating to the legacy Republic of Ireland Motor Finance business, which is in run-off following the cessation of our previous partnership in the Republic of Ireland from 30 June 2022. |
Retail provides finance to individuals and businesses through a network of intermediaries. Motor Finance provides several products at point of sale in a dealership, or online via a broker, which allow consumers to buy vehicles from over 3,500 retailers in the UK and Ireland. Premium Finance works with c.1,100 insurance brokers in the UK and Ireland and helps make insurance payments more manageable for individuals and businesses, by allowing them to spread the cost over fixed instalments. The Savings business provides simple and straightforward savings products to businesses and individuals.
We continue to make significant progress delivering our strategic pillars in Retail. In 2025, we announced a repositioning to focus the growth of our Premium Finance business towards commercial lines insurance premium finance where we see strongest risk-adjusted returns and long-term growth potential, and to reduce our emphasis on personal lines insurance premium finance. The repositioning is in its final stages with an associated remaining portfolio of c.£100 million to be substantially run-off by the end of the 2027 financial year. The run-off of our legacy Republic of Ireland Motor Finance business is now largely complete.
Our Optimise initiatives have encompassed offshoring select non-specialist customer activities and implementing programmes focused on automation and digitisation, allowing for a more efficient approach to service delivery.
We are seeing good growth in Motor Finance with the loan book increasing 9% in the year. We have seen particularly strong growth in the Irish business and have launched dealer forecourt funding during the year, broadening our product offering and supporting future growth opportunities. Premium Finance continued to focus on growth in the commercial market including a strategic partnership with JMG, a top 30 UK insurance broker. While competition remains strong, favourable market dynamics and emerging opportunities provide confidence for continued progress into the 2027 financial year and beyond.
We welcomed the publication of the FCA Premium Finance Market Study and its conclusions in February 2026, which align with our existing approach and bring clarity and stability to the premium finance market.
Adjusted operating profit for Retail modestly reduced to £17.4 million (2025: £18.9 million) as a reduction in income, partly due to the planned withdrawal from selected personal lines business in Premium Finance, was largely offset by a Motor Finance impairment provision release.
We recognised adjusting items of £179.5 million (2025: £217.5 million) during the year, largely driven by the increase in provision in relation to motor finance commissions. Please refer to Note 13 "Other liabilities" for further details on the group's provisioning assessment.
On a statutory basis, Retail delivered an operating loss of £162.1 million (2025: £198.6 million) reflecting the additional provision in respect of motor finance commissions.
Adjusted operating income decreased 8% to £226.4 million (2025: £246.7 million), reflecting the planned withdrawal from selected personal lines relationships in Premium Finance as well as deflation of insurance premiums, partly offset by strong growth in the Irish Motor Finance business. The net interest margin decreased to 7.9% (2025: 8.3%), primarily reflecting the change in mix towards Motor Finance as a result of the repositioning of the Premium Finance business.
Adjusted operating expenses reduced 2% to £179.8 million (2025: £183.3 million) driven by offshoring benefits including lower staff costs, partly offset by increased costs in Ireland as we scale the business. The expense/income ratio increased to 79% (2025: 74%) reflecting the reduction in income.
Impairment charges decreased to £29.2 million (2025: £44.5 million), primarily driven by the implementation of an updated IFRS 9 model which recognises the evolving composition and behaviour of the Motor Finance book1, and improved credit performance in Premium Finance. The bad debt ratio reduced to 1.0% (2025: 1.5%), with the provision coverage ratio decreasing to 3.0% (31 July 2025: 3.2%).
Property
|
|
2026 £ million |
2025 £ million |
Change % |
|
Operating income |
117.7 |
130.6 |
(10) |
|
Adjusted operating expenses |
(33.1) |
(33.9) |
(2) |
|
Impairment losses on financial assets |
(35.6) |
(29.5) |
21 |
|
Adjusted operating profit |
49.0 |
67.2 |
(27) |
|
Adjusted operating profit, pre provisions for impairment losses |
84.6 |
96.7 |
(13) |
|
Adjusting items: |
|
|
|
|
Restructuring costs |
(1.4) |
(0.3) |
n/a |
|
Statutory operating profit |
47.6 |
66.9 |
(29) |
|
|
|
|
|
|
Net interest margin |
6.5% |
6.9% |
|
|
Expense/income ratio |
28% |
26% |
|
|
Bad debt ratio |
2.0% |
1.5% |
|
|
Closing loan book |
1,757.3 |
1,852.5 |
(5) |
Property provides residential development finance, bridging finance and investment loans to experienced property developers and investors across mainland UK and Northern Ireland, through its two brands, Close Brothers Property Finance and Commercial Acceptances. Property Finance lends to over 500 professional property developers with a focus on small to medium-sized residential developments, with Commercial Acceptances lending to c.400 developers, investors and traders.
|
1. |
For further information please refer to Note 1 "Basis of preparation and accounting policies". |
Property delivered a resilient performance in what remained a transitional year for the business, as we continued to broaden our proposition and position the franchise for sustainable growth. While our core Build-to-Sell market faces challenges, including planning system complexity, elevated construction costs and lower purchaser demand, the business continues to be supported by strong customer relationships, disciplined underwriting and deep market expertise, including a strong performance from Commercial Acceptances in a highly competitive market.
Alongside this, we made good strategic progress in diversifying the business and building new growth opportunities. We increased our focus on larger corporate borrowers within Build-to-Sell, expanded our Structured Finance offering and continued to strengthen our regional presence through targeted hires. We also launched new lending propositions, including Revolving Credit Facility and CA Revolve products, designed to meet evolving customer needs and broaden our addressable market.
Our diversification strategy is beginning to generate encouraging momentum taking us into the 2027 financial year. In Build-to-Rent, just after the year end, we completed our largest transaction to date, valued at £67.2 million. Our Build-to-Rent pipeline across single-family and multi-family housing remains healthy, with a number of opportunities expected to convert in the coming months. Although the Build-to-Sell loan book is expected to remain broadly stable in the near term, growth across our diversified business initiatives and increasing demand from larger, well-capitalised partners provide confidence in our ability to deliver sustainable growth over the medium term.
Adjusted operating profit declined 27% to £49.0 million (2025: £67.2 million), as challenging conditions in the Build-to-Sell market have led to softer demand and lower loan balances, and reflecting increased impairment charges on a small number of facilities. Before provisions for impairment losses, adjusted operating profit reduced 13% to £84.6 million (2025: £96.7 million).
On a statutory basis, Property delivered an operating profit of £47.6 million (2025: £66.9 million).
Operating income declined 10% to £117.7 million (2025: £130.6 million), driven by the reduction in the loan book, as low drawdowns were more than offset by repayments levels, alongside reduced fee yields. The net interest margin reduced to 6.5% (2025: 6.9%), reflecting the change in business mix towards larger, lower-margin lending at attractive returns, as well as reduced fee yields and lower average base rates during the year.
Adjusted operating expenses decreased 2% to £33.1 million (2025: £33.9 million), reflecting lower staff costs. The expense/income ratio increased to 28% (2025: 26%).
Impairment charges increased to £35.6 million (2025: £29.5 million), primarily due to increased individually assessed provisions on a small number of facilities, including legacy cases, driven by development specific issues, build cost inflation and a subdued sales market. As a result, the bad debt ratio increased to 2.0% (2025: 1.5%) and the provision coverage ratio rose to 5.6% (31 July 2025: 4.2%). The Property book is predominantly secured, with conservative loan-to-value ratios. 72% of loans are to repeat customers.
Group (central functions)
|
|
2026 £ million |
2025 £ million |
Change % |
|
Operating income |
(8.2) |
(11.7) |
(30) |
|
Operating expenses |
(28.8) |
(42.3) |
(32) |
|
Operating loss |
(37.0) |
(54.0) |
(31) |
|
Adjusting items: |
|
|
|
|
Restructuring costs |
(0.1) |
- |
n/a |
|
Statutory operating loss |
(37.1) |
(54.0) |
(31) |
The operating loss from Group (central functions), which includes the central functions such as finance, legal and compliance, risk and human resources, reduced to £37.0 million (2025: £54.0 million), better than guidance of c.£45-50 million. The negative income represents the net cost of group funding, which was lower in the year, reflecting higher interest earned on group cash balances. The reduction in operating expenses primarily reflects the non-recurrence of legal and professional fees associated with the impact of the FCA's review of motor finance commissions.
Loan book analysis
|
|
31 July 2026 £ million |
31 July 2025 £ million |
Change % |
|
Commercial |
4,886.2 |
4,729.3 |
3 |
|
Asset Finance1 |
3,642.2 |
3,580.4 |
2 |
|
Invoice Finance |
1,244.0 |
1,148.9 |
8 |
|
Retail |
2,820.8 |
2,878.9 |
(2) |
|
Motor Finance2 |
2,169.7 |
1,993.5 |
9 |
|
Premium Finance3 |
651.1 |
885.4 |
(26) |
|
Property |
1,757.3 |
1,852.5 |
(5) |
|
Closing loan book and operating lease assets4 |
9,464.3 |
9,460.7 |
- |
|
1. |
Asset Finance totals exclude £130.0 million (31 July 2025: £165.0 million) of operating lease assets related to CBVH which is in wind-down, and £nil (31 July 2025: £41.0 million) of operating lease assets related to CBRL which was sold in the year. Asset Finance includes £312.2 million (31 July 2025: £289.4 million) of loans in relation to Asset Ireland, previously reported within Invoice Finance. |
|
2. |
The Motor Finance loan book includes £7.7 million (31 July 2025: £32.1 million) relating to the Republic of Ireland Motor Finance business, which is in run-off following the cessation of our previous partnership in the Republic of Ireland from 30 June 2022. |
|
3 |
The Premium Finance loan book includes £105.5 million (31 July 2025: £288.8 million) of brokers within the exit cohort as part of the planned reduction in the personal lines book of Premium Finance. |
|
4. |
Includes operating lease assets of £1.1 million (31 July 2025: £1.3 million). |
The loan book was flat in the year at £9.5 billion (31 July 2025: £9.5 billion), although growth accelerated in the second half (2% decline in the loan book in H1 2026 versus 2% growth in H2 2026), reflecting the strategic actions we have taken to reposition our business.
On an underlying basis, excluding the planned reduction in the personal lines book of Premium Finance and run-off of the legacy Republic of Ireland Motor Finance business, the loan book increased 2% in the year, and grew 4% in the second half, building good momentum as we enter 2027. All of our divisions grew in the final quarter, notwithstanding the prevailing market conditions in some of our markets.
Through our simplification actions, we have repositioned the business to focus on core markets where we see a strong and sustainable market opportunity. We continue to target 5-10% p.a. growth through the cycle through a combination of overall market growth, share gains and new business initiatives.
The Commercial loan book increased 3% to £4.9 billion (31 July 2025: £4.7 billion), with good growth across both Asset Finance and Invoice Finance. Invoice Finance grew 8%, with strong new business volumes, particularly in the second half of the year. Asset Finance grew 2%, with both the Irish and Wholesale Finance portfolios performing particularly well. In the Commercial division, we continue to pursue organic growth in our core markets where we have developed strong relationships and expertise, for example in emerging clean-energy markets. We are also targeting new products and sectors such as commercial mortgages and through our repositioned intermediated Asset Finance business.
The Retail loan book declined to £2.8 billion (31 July 2025: £2.9 billion) on a reported basis, although the underlying loan book grew 6%. The Motor Finance loan book grew strongly, up 9%, with good new business volumes across the business and particularly strong growth in Ireland. The Premium Finance loan book reduced 26% reflecting the planned reduction of a number of personal lines broker relationships in line with our strategic repositioning of the business. Excluding the exiting brokers, Premium Finance declined 9%, driven by market-wide insurance premium deflation. At 31 July 2026, the Premium Finance loan book included £105.5 million (31 July 2025: £288.8 million) of brokers within the exit cohort as part of the planned reduction in the personal lines book, with these exiting brokers expected to substantially run-off during the course of the 2027 financial year.
In Retail, we are renewing our focus on growing in the commercial lines market and supporting our brokers to write larger and more complex business in Premium Finance, while in Motor Finance, we are expanding our reach and distribution of Motor Finance, particularly in Ireland.
The Property loan book decreased 5% to £1.8 billion (31 July 2025: £1.9 billion) as low drawdowns were more than offset by repayment levels, reflecting industry-wide challenges in the Build-to-Sell market as housing delivery across the UK remains constrained due to planning delays, build cost pressures and labour shortages, whilst demand continues to be limited by cost-of-living pressures. We have expanded our regional presence and launched a new cash flow-led product in our bridging business, whilst also now offering a Revolving Credit Facility to our larger customers. We continue to see significant opportunities for providing development loans for the delivery of Build-to-Rent and Purpose-Built Student Accommodation, and are further building our market position in these sectors, with a £67.2 million Build-to-Rent facility already completed in the 2027 financial year.
Definitions
Additional Tier 1 ("AT1") capital: Additional regulatory capital that along with CET1 capital makes up a bank's or banking group's Tier 1 regulatory capital. Includes the group's perpetual subordinated contingent convertible securities classified as other equity instruments under IAS 32
Adjusted: Adjusted measures are presented on a basis consistent with prior periods and exclude any exceptional and adjusting items which do not reflect underlying trading performance
Adjusted earnings per share ("AEPS"): Adjusted operating profit less tax and AT1 coupons divided by basic weighted average number of ordinary shares in issue
Applicable requirements: Applicable capital ratio requirements consist of the Pillar 1 requirement as defined by the CRR, the Pillar 2a requirement set by the PRA, and the capital conservation buffer and countercyclical buffer as defined by the PRA Rulebook. Any applicable PRA buffer is excluded
Artificial Intelligence ("AI"): The capability of computer systems to perform tasks that normally require human intelligence, including learning, analysis, decision-making, and content generation
Average loan size: The average balance outstanding calculated as the gross loans and advances to customers divided by number of the loans in issue
Average maturity of funding allocated to the loan book: Simple weighted average of the applicable funding allocated to the loan book. The applicable funding excludes equity (except AT1 instruments) and deducts funding held for liquidity purposes
Bad debt ratio: (Adjusted) impairment losses in the year as a percentage of average net loans and advances to customers and operating lease assets excluding Vehicle Hire, which is in wind-down, and Brewery Rentals, classified as held for sale on the group's 31 July 2025 balance sheet, now sold
Basic earnings per share ("EPS"): Total profit attributable to ordinary shareholders divided by basic weighted average number of ordinary shares in issue
Basic earnings per share ("EPS") continuing operations: Operating profit from continuing operations less tax and AT1 coupons, divided by basic weighted average number of ordinary shares in issue
Capital Requirements Directive ("CRD"): European Union regulation implementing the Basel III requirements in Europe, alongside CRR II
Capital Requirements Regulation ("CRR"): Regulation 575/2013/EU, as it forms part of the assimilated law of the United Kingdom
CET1 capital ratio: Measure of the group's CET1 capital as a percentage of risk weighted assets, as required by CRR
Common equity tier 1 ("CET1") capital: Measure of capital as defined by the CRR. CET1 capital consists of the highest quality capital including ordinary shares, related share premium account, retained earnings and other reserves, less goodwill and certain intangible assets and other regulatory adjustments
Compensation ratio: Total staff costs as a percentage of adjusted operating income
Consolidated gain on disposal: The profit or loss recognised on the sale of a subsidiary or business, calculated as proceeds received less related costs and the carrying amount of net assets and goodwill disposed
Contingent deferred consideration: A portion of the purchase price on an acquisition that is payable at a future date and is dependent on the occurrence of specified future events or conditions
Cost of funds: Interest expense incurred to support lending activities excluding Vehicle Hire and Brewery Rentals divided by the average net loans and advances to customers and operating lease assets excluding Vehicle Hire and Brewery Rentals
Discounting: The process of determining the present value of future payments
Dividend per share ("DPS"): Comprises the final dividend proposed for the respective year, together with the interim dividend declared and paid in the year
Effective interest rate ("EIR"): The interest rate at which revenue is recognised on loans and discounted to their carrying value over the life of the financial asset
Effective tax rate ("ETR"): Tax on operating profit/(loss) as a percentage of operating profit/(loss) on ordinary activities before tax
Expected credit loss ("ECL"): The unbiased probability-weighted average credit loss determined by evaluating a range of possible outcomes and future economic conditions
Expense/income ratio: (Adjusted) operating expenses divided by (adjusted) operating income
Financial Conduct Authority ("FCA"): A financial regulatory body in the UK, regulating financial firms and maintaining integrity of the UK's financial market
Forbearance: Forbearance occurs when a customer is experiencing financial difficulty in meeting their financial commitments and a concession is granted, by changing the terms of the financial arrangement, which would not otherwise be considered
Gross carrying amount: Loan book before expected credit loss provision
High quality liquid assets ("HQLAs"): Assets which qualify for regulatory liquidity purposes, including Bank of England deposits and sovereign and central bank debt
Internal ratings based ("IRB") approach: A supervisor-approved method using internal models, rather than standardised risk weightings, to calculate regulatory capital requirements for credit risk
International Accounting Standards ("IAS"): Older set of standards issued by the International Accounting Standards Council, setting up accounting principles and rules for preparation of financial statements. IAS are being superseded by IFRS
International Financial Reporting Standards ("IFRS"): Globally accepted accounting standards issued by the IFRS Foundation and the International Accounting Standards Board
Leverage ratio: Tier 1 capital as a percentage of non-risk-weighted total exposures, adjusted for certain capital deductions, including intangible assets, and off-balance sheet exposures
Liquidity coverage ratio ("LCR"): Measure of the group's HQLAs as a percentage of expected net cash outflows over the next 30 days in a stressed scenario
Long-term bad debt ratio: Long-term bad debt ratio is calculated using IAS 39 until the change to IFRS 9 in FY19. Long-term average bad debt ratio of 1.2% based on the average bad debt ratio for FY08-FY26, excluding Novitas from FY21 onwards and Rentals businesses from FY24
Net asset value ("NAV") per share: Total assets less total liabilities and AT1, divided by the number of ordinary shares in issue excluding own shares
Net interest margin ("NIM"): (Adjusted) operating income for the lending divisions, divided by average net loans and advances to customers and operating lease assets excluding Vehicle Hire and Brewery Rentals
Net stable funding ratio ("NSFR"): Regulatory measure of the group's weighted funding as a percentage of weighted assets
Probability of default ("PD"): Probability that a customer will default on their loan
Prudential Regulation Authority ("PRA"): A financial regulatory body, responsible for regulating and supervising banks and other financial institutions in the UK
Return on assets: Adjusted operating profit less tax and AT1 coupons divided by average total assets for continuing operations at the balance sheet date and prior year
Return on average tangible equity ("RoTE"): Adjusted operating profit, less tax and AT1 coupons, divided by average total shareholders' equity, excluding intangible assets and AT1, for continuing operations
Return on opening equity ("RoE"): Adjusted operating profit less tax and AT1 coupons divided by opening equity for continuing operations, excluding AT1
Risk weighted assets ("RWAs"): A measure of the amount of a bank's exposures, adjusted for risk in line with the CRR. It is used in determining the capital requirement for a financial institution
Significant increase in credit risk ("SICR"): An assessment of whether credit risk has increased significantly since initial recognition of a loan using a range of triggers. Accounts which have experienced a significant increase in credit risk will be allocated to Stage 2
Standardised approach: Generic term for regulator-defined approaches for calculating credit, operational and market risk capital requirements as set out in the CRR
Subordinated debt: Represents debt that ranks below, and is repaid after claims of, other secured or senior debt owed by the issuer
Tangible net asset value ("TNAV") per share: Total assets less total liabilities, AT1 and intangible assets, divided by the number of ordinary shares in issue excluding own shares
Term funding: Funding with a remaining maturity greater than 12 months
Tier 2 capital: Additional regulatory capital that along with Tier 1 capital makes up a bank's total regulatory capital. Includes qualifying subordinated debt
Total funding as percentage of loan book: Total funding divided by net loans and advances to customers and operating lease assets
Typical loan maturity: Term of loan measured per contract with customer at loan's inception
Consolidated income statement
For the year ended 31 July 2026
|
|
Note |
2026 £ million |
2025 £ million |
|
Interest income |
|
1,002.7 |
1,111.7 |
|
Interest expense |
|
(464.2) |
(542.9) |
|
|
|
|
|
|
Net interest income |
|
538.5 |
568.8 |
|
Fee and commission income |
|
94.4 |
103.5 |
|
Fee and commission expense |
|
(17.1) |
(16.7) |
|
Other income |
|
101.3 |
118.5 |
|
Depreciation of operating lease assets and other direct costs |
9 |
(66.1) |
(84.6) |
|
Impairment of operating lease assets |
9 |
- |
(30.0) |
|
|
|
|
|
|
Non-interest income |
|
112.5 |
90.7 |
|
Operating income |
|
651.0 |
659.5 |
|
|
|
|
|
|
Provision in relation to motor finance commissions |
13 |
(164.7) |
(165.0) |
|
Other motor finance commissions related costs, net of insurance recoveries |
13 |
3.0 |
(18.7) |
|
Provision in relation to early settlements in Motor Finance |
13 |
- |
(33.0) |
|
Restructuring costs |
13 |
(14.3) |
(2.3) |
|
Other administrative expenses |
|
(443.5) |
(470.1) |
|
|
|
|
|
|
Total administrative expenses |
|
(619.5) |
(689.1) |
|
Impairment losses on financial assets |
6 |
(91.8) |
(92.8) |
|
Total operating expenses |
|
(711.3) |
(781.9) |
|
Operating loss before tax |
|
(60.3) |
(122.4) |
|
Tax |
3 |
(5.1) |
(4.7) |
|
Loss after tax from continuing operations |
|
(65.4) |
(127.1) |
|
Profit from discontinued operations, net of tax |
20 |
2.0 |
49.2 |
|
Loss after tax |
|
(63.4) |
(77.9) |
|
|
|
|
|
|
Attributable to |
|
|
|
|
Shareholders |
|
(85.7) |
(100.2) |
|
Other equity owners |
11 |
22.3 |
22.3 |
|
|
|
(63.4) |
(77.9) |
|
From continuing operations |
|
|
|
|
Basic earnings per share |
4 |
(58.5) p |
(99.8)p |
|
Diluted earnings per share |
4 |
(58.5) p |
(99.8)p |
|
From continuing and discontinued operations |
|
|
|
|
Basic earnings per share |
4 |
(57.1) p |
(66.9)p |
|
Diluted earnings per share |
4 |
(57.1) p |
(66.9)p |
|
|
|
|
|
|
Interim dividend per share |
5 |
- |
- |
|
Final dividend per share |
5 |
- |
- |
Consolidated statement of comprehensive income
For the year ended 31 July 2026
|
|
Note |
2026 £ million |
2025 £ million |
|
Loss after tax |
|
(63.4) |
(77.9) |
|
|
|
|
|
|
Items that may be reclassified to income statement |
|
|
|
|
Currency translation (losses)/gains |
|
(0.3) |
0.5 |
|
Losses on cash flow hedging |
|
(4.5) |
(12.7) |
|
Gains/(losses) on financial instruments classified at fair value through other comprehensive income |
|
2.3 |
(4.2) |
|
Tax relating to items that may be reclassified |
|
0.8 |
4.3 |
|
|
|
(1.7) |
(12.1) |
|
|
|
|
|
|
Items that will not be reclassified to income statement |
|
|
|
|
Defined benefit pension scheme losses |
|
- |
(0.1) |
|
Tax relating to items that will not be reclassified |
|
- |
- |
|
|
|
- |
(0.1) |
|
Other comprehensive expense, net of tax |
|
(1.7) |
(12.2) |
|
|
|
|
|
|
Total comprehensive loss |
|
(65.1) |
(90.1) |
|
|
|
|
|
|
Attributable to |
|
|
|
|
Shareholders |
|
(87.4) |
(112.4) |
|
Other equity owners |
11 |
22.3 |
22.3 |
|
|
|
(65.1) |
(90.1) |
Consolidated balance sheet
At 31 July 2026
|
|
Note |
31 July 2026 £ million |
31 July 2025 £ million |
|
Assets |
|
|
|
|
Cash and balances at central banks |
|
1,190.7 |
1,917.0 |
|
Loans and advances to banks |
|
224.6 |
161.7 |
|
Loans and advances to customers |
6 |
9,463.2 |
9,459.4 |
|
Debt securities |
7 |
571.1 |
859.2 |
|
Derivative financial instruments |
|
93.3 |
103.1 |
|
Intangible assets |
8 |
155.0 |
166.3 |
|
Property, plant and equipment |
9 |
165.4 |
209.4 |
|
Current tax assets |
|
55.6 |
44.2 |
|
Deferred tax assets |
3 |
27.9 |
31.0 |
|
Prepayments, accrued income and other assets |
|
111.6 |
186.6 |
|
Assets classified as held for sale |
20 |
- |
934.0 |
|
Total assets |
|
12,058.4 |
14,071.9 |
|
|
|
|
|
|
Liabilities |
|
|
|
|
Deposits by banks |
10 |
20.3 |
88.1 |
|
Deposits by customers |
10 |
7,876.2 |
8,799.3 |
|
Loans and overdrafts from banks |
10 |
0.9 |
1.5 |
|
Debt securities in issue |
10 |
1,636.0 |
1,991.3 |
|
Derivative financial instruments |
|
90.0 |
104.7 |
|
Provisions for liabilities and charges |
13 |
364.4 |
210.3 |
|
Accruals, deferred income and other liabilities |
|
169.2 |
172.3 |
|
Subordinated loan capital |
10 |
249.8 |
195.5 |
|
Liabilities directly associated with assets classified as held for sale |
20 |
- |
773.4 |
|
Total liabilities |
|
10,406.8 |
12,336.4 |
|
|
|
|
|
|
Equity |
|
|
|
|
Called up share capital |
|
38.0 |
38.0 |
|
Retained earnings |
|
1,445.1 |
1,532.3 |
|
Other equity instrument |
11 |
197.6 |
197.6 |
|
Other reserves |
|
(29.1) |
(32.4) |
|
|
|
|
|
|
Total shareholders' and other equity owners' equity |
|
1,651.6 |
1,735.5 |
|
|
|
|
|
|
Total equity |
|
1,651.6 |
1,735.5 |
|
|
|
|
|
|
Total equity and liabilities |
|
12,058.4 |
14,071.9 |
The consolidated financial statements on pages 26 to 65 were approved and authorised for issue by the Board of Directors on 29 September 2026 and signed on its behalf by:
|
Michael B. Morgan |
Fiona McCarthy |
|
Chief Executive |
Group Chief Finance Officer |
Registered number: 520241
Consolidated statement of changes in equity
For the year ended 31 July 2026
|
|
|
|
|
Other reserves |
Total attributable to shareholders and other equity owners £ million |
Total equity £ million |
|||
|
|
Called up share capital £ million |
Retained earnings £ million |
Other equity instrument £ million |
FVOCI reserve £ million |
Share-based payments reserve £ million |
Exchange movements reserve £ million |
Cash flow hedging reserve £ million |
||
|
At 1 August 2024 |
38.0 |
1,634.4 |
197.6 |
(5.3) |
(33.8) |
(1.4) |
13.0 |
1,842.5 |
1,842.5 |
|
|
|
|
|
|
|
|
|
|
|
|
Loss for the year |
- |
(77.9) |
- |
- |
- |
- |
- |
(77.9) |
(77.9) |
|
Other comprehensive (expense)/income |
- |
(0.1) |
- |
(3.0) |
- |
0.1 |
(9.2) |
(12.2) |
(12.2) |
|
Total comprehensive (expense)/income for the year |
- |
(78.0) |
- |
(3.0) |
- |
0.1 |
(9.2) |
(90.1) |
(90.1) |
|
Shares purchased |
- |
- |
- |
- |
(1.6) |
- |
- |
(1.6) |
(1.6) |
|
Shares released |
- |
- |
- |
- |
9.2 |
- |
- |
9.2 |
9.2 |
|
Coupon paid on other equity instrument (Note 11) |
- |
(22.3) |
- |
- |
- |
- |
- |
(22.3) |
(22.3) |
|
Other movements |
- |
(1.8) |
- |
- |
(0.4) |
- |
- |
(2.2) |
(2.2) |
|
|
|
|
|
|
|
|
|
|
|
|
At 31 July 2025 |
38.0 |
1,532.3 |
197.6 |
(8.3) |
(26.6) |
(1.3) |
3.8 |
1,735.5 |
1,735.5 |
|
|
|
|
|
|
|
|
|
|
|
|
Loss for the year |
- |
(63.4) |
- |
- |
- |
- |
- |
(63.4) |
(63.4) |
|
Other comprehensive income/(expense) |
- |
- |
- |
1.6 |
- |
(0.1) |
(3.2) |
(1.7) |
(1.7) |
|
Total comprehensive (expense)/income for the year |
- |
(63.4) |
- |
1.6 |
- |
(0.1) |
(3.2) |
(65.1) |
(65.1) |
|
Shares purchased |
- |
- |
- |
- |
- |
- |
- |
- |
- |
|
Shares released |
- |
- |
- |
- |
4.2 |
- |
- |
4.2 |
4.2 |
|
Coupon paid on other equity instrument (Note 11) |
- |
(22.3) |
- |
- |
- |
- |
- |
(22.3) |
(22.3) |
|
Other movements |
- |
(1.7) |
- |
- |
0.8 |
- |
- |
(0.9) |
(0.9) |
|
Income tax |
- |
0.2 |
- |
- |
- |
- |
- |
0.2 |
0.2 |
|
|
|
|
|
|
|
|
|
|
|
|
At 31 July 2026 |
38.0 |
1,445.1 |
197.6 |
(6.7) |
(21.6) |
(1.4) |
0.6 |
1,651.6 |
1,651.6 |
Consolidated cash flow statement
For the year ended 31 July 2026
|
|
Note |
2026 £ million |
2025 £ million |
|
Net cash (outflow)/inflow from operating activities |
15(a) |
(804.7) |
241.2 |
|
|
|
|
|
|
Net cash inflow/(outflow) from investing activities |
|
|
|
|
Purchase of: |
|
|
|
|
Property, plant and equipment |
|
(2.9) |
(5.3) |
|
Intangible assets - software |
|
(25.7) |
(24.5) |
|
Subsidiaries, net of cash acquired |
15(b) |
- |
(0.5) |
|
Sale of: |
|
|
|
|
Equity shares held for investment |
|
- |
1.8 |
|
Subsidiaries, net of cash disposed |
15(c) |
122.5 |
104.0 |
|
|
|
93.9 |
75.5 |
|
|
|
|
|
|
Net cash (outflow)/inflow before financing activities |
|
(710.8) |
316.7 |
|
|
|
|
|
|
Financing activities |
|
|
|
|
Purchase of own shares for employee share award schemes |
|
- |
(1.6) |
|
Interest paid on subordinated loan capital and debt financing |
|
(23.1) |
(23.4) |
|
Issuance of subordinated loan capital |
|
248.9 |
- |
|
Redemption of subordinated loan capital |
|
(198.4) |
- |
|
Payment of lease liabilities |
|
(7.2) |
(12.1) |
|
AT1 coupon payment |
|
(22.3) |
(22.3) |
|
|
|
|
|
|
Net (decrease)/increase in cash |
|
(712.9) |
257.3 |
|
Cash and cash equivalents at beginning of year |
|
2,101.8 |
1,844.5 |
|
|
|
|
|
|
Cash and cash equivalents at end of year |
15(d) |
1,388.9 |
2,101.8 |
|
|
|
|
|
|
Cash and cash equivalents per the balance sheet |
|
1,388.9 |
2,046.8 |
|
Cash and cash equivalents within the assets of the disposal group classified as held for sale |
20 |
- |
55.0 |
|
|
|
1,388.9 |
2,101.8 |
The Notes
1. Basis of preparation and accounting policies
The financial information contained in this unaudited announcement does not constitute the statutory accounts for the years ended 31 July 2026 or 31 July 2025 within the meaning of section 435 of the Companies Act 2006, but is derived from those accounts. The accounting policies used are consistent with those set out in the Annual Report 2025.
The results of discontinued operations are shown as: a single amount on the face of the consolidated income statement comprising the post-tax profit or loss of discontinued operations; and post-tax gain or loss recognised either on measurement to fair value less costs to sell or on the disposal of the discontinued operation.
A discontinued operation is a cash generating unit ("CGU") or a group of CGUs that either has been disposed of, or is classified as held for sale, and represents a separate major line of business or geographical area of operations, is part of a single coordinated plan to dispose of a separate major line of business or geographical area of operations or is a subsidiary acquired exclusively with a view to resale.
Intercompany transactions between continuing and discontinued operations have been eliminated on consolidation in the consolidated income statement.
Disposal groups are classified as held for sale when their carrying amounts will be recovered principally through a sale rather than continuing use, and the sale is highly probable within 12 months. They are measured at the lower of carrying amount and fair value less costs to sell, with impairment losses, as needed, recognised in the income statement on initial classification and subsequent remeasurement. Financial assets and liabilities within a disposal group continue to be measured under IFRS 9.
The financial statements are prepared on a going concern basis. Whilst the financial information has been prepared in accordance with the recognition and measurement criteria of International Financial Reporting Standards ("IFRS"), this announcement does not itself contain sufficient information to comply with IFRS.
The financial information for the year ended 31 July 2026 has been derived from the financial statements of Close Brothers Group plc for that year. Statutory accounts for 2025 have been delivered to the Registrar of Companies and those for 2026 will be delivered following the company's Annual General Meeting. The group's auditor, PricewaterhouseCoopers LLP, will report on the 2026 accounts: their report is expected to be unqualified, and is not expected to draw attention to any matters by way of emphasis or contain statements under Section 498(2) or (3) of the Companies Act 2006.
Going concern
The Directors have assessed whether they consider it appropriate that the company and the group adopt the going concern basis of accounting in preparing the financial statements. For the purposes of going concern, the Directors have reviewed the group's strategic plan to December 2027, being 15 months from the date of approval of the financial statements. This is in line with the assessment period (15 months) reviewed as part of the FY 2025 going concern assessment and is in excess of IAS 1 and UK Corporate Governance Code requirements of at least 12 months.
As part of the Directors' consideration of the appropriateness of adopting the going concern basis, a range of forward-looking scenario analyses have been considered. These include the 3 Year Strategic Plan ("3YSP") presented to the Board in July, a "realistic downside" scenario, "stressed downside" scenario, and the 2025 Internal Liquidity Adequacy Assessment Process ("ILAAP") and 2025 Internal Capital Adequacy Assessment Process ("ICAAP"). These were reviewed together with a number of key risks which are set out in the 2026 Annual Report, within the Risk Report under the heading Principal risks: Funding and liquidity risk on pages 91 to 92 and Capital risk on pages 72 to 74.
The Financial Conduct Authority ("FCA") review of historical motor finance commission arrangements and the subsequent publication of its motor finance consumer redress scheme continues to be a key area of focus in the 2026 financial year. The group recognised a further provision of £165 million relating to motor finance commissions in the 2026 financial year. This provision reflects management's best estimate of the cost of the FCA scheme as published, per IAS 37, and represents a move from a probability weighted approach to a single-scenario provision. This provision has since been reviewed, considering recent developments including confirmation that the Upper Tribunal hearings are expected to commence in either December 2026 or February 2027. Based on further analysis, whilst alternative outcomes remain plausible, the Directors have concluded that the existing provision continues to be appropriate. Nevertheless, the group recognises the need to plan for a range of possible outcomes, and continues to prioritise maintaining a strong capital position, balance sheet, and prudent approach to managing its financial resources. Further details on motor finance commissions are outlined on pages 55 to 56.
The group's realistic downside going concern scenario builds on the 3YSP, and overlays subdued loan book growth, lower-than-expected cost savings and higher bad debts. The stressed downside scenario builds upon this, with further reduced cost savings, higher bad debts, as well as an additional hypothetical conduct event provision in 2027.
The modelling output of the stressed downside scenario highlights the resilient capital position, with the group's capital ratios in excess of minimum regulatory requirements and capacity to absorb losses and increases in RWAs beyond the impacts modelled, strengthened by available management actions.
The two stress testing scenarios modelled for the group's most recent ICAAP, approved by the Board in January 2026, were used to provide additional context for the Directors alongside the going concern assessment.
Under all assessed scenarios, the group continues to operate with sufficient levels of capital for the next 15 months from the date of approval of the financial statements, with the group's capital ratios in excess of minimum regulatory requirements.
Separately from managing the group capital position, the group adopts a conservative approach to funding and liquidity risk and seeks to maintain a funding and liquidity position characterised by sustaining a diverse range of funding sources and holding a prudent level of high-quality liquidity. As such, the weighted average maturity of its funding is longer than the weighted average maturity of its lending portfolio. The Board reviewed these factors when concluding upon going concern.
These objectives form the basis for the group Funding and Liquidity Risk Appetite Statement, approved annually by the Board, which outlines the levels of funding and liquidity risk that the group is willing to assume.
As part of the liquidity management process, the bank also uses a suite of internally developed liquidity stress scenarios to monitor its potential liquidity exposure daily and determine its HQLA requirements. This ensures that the bank remains within risk appetite and identifies potential areas of vulnerability. These stresses are formally approved by the ALCO, GRCC and Board and cover both idiosyncratic and market-wide stresses. The bank adopts the most severe stress to determine the amount of liquidity it needs to hold. At 31 July 2026, the bank held sufficient liquidity resources to meet the applicable stress.
In conclusion, the Directors have determined that they have a reasonable expectation that the company and the group, as a whole, have adequate resources to continue as a going concern for a period of at least 12 months from the date of approval of the financial statements. Accordingly, they continue to adopt the going concern basis in preparing the Annual Report.
Critical accounting judgements and estimates
The reported results of the group are sensitive to the judgements, estimates and assumptions that underlie the application of its accounting policies and preparation of its financial statements. UK company law and IFRS require the Directors, in preparing the group's financial statements, to select suitable accounting policies, apply them consistently and make judgements, estimates and assumptions that are reasonable.
The group's estimates and assumptions are based on historical experience and reasonable expectations of future events and are reviewed on an ongoing basis. Actual results in the future may differ from the amounts estimated due to the inherent uncertainty.
The group's critical accounting judgements, made in applying its accounting policies, and the key sources of estimation uncertainty that may have a significant risk of causing a material adjustment within the next financial year, are set out below.
The impact of climate change on the group's judgements, estimates and assumptions has been considered in preparing these financial statements. While no material impact has been identified, climate risk continues to be monitored on an ongoing basis.
Critical accounting judgements
The critical accounting judgements of the group, which relate to expected credit loss provisions under IFRS 9 and motor finance commissions, are as follows. These were also critical accounting judgements in the prior year albeit the judgement relating to motor finance commissions has been updated in line with the latest developments:
|
• |
establishing the criteria for a significant increase in credit risk; |
|
• |
determining the appropriate definition of default; and |
|
• |
determining the affected customers in the motor finance commissions provisioning assessment, and applying a single, best estimate scenario rather than a probability weighted multi-scenario approach. |
Information on the first two accounting judgements can be found below, while further information on the third judgement can be found in Note 13.
Significant increase in credit risk
Assets are transferred from Stage 1 to Stage 2 when there has been a significant increase in credit risk since initial recognition. Typically, the group assesses whether a significant increase in credit risk has occurred based on a quantitative and qualitative assessment, with a "30 days past due" backstop.
Due to the diverse nature of the group's lending businesses, the specific indicators of a significant increase in credit risk vary by business and may include some or all of the following factors:
|
• |
quantitative assessment: the lifetime probability of default ("PD") has increased by more than an agreed threshold relative to the equivalent at origination. Thresholds are based on a fixed number of risk grade movements which are bespoke to each business to ensure that the increased risk since origination is appropriately captured; |
|
• |
qualitative assessment: events or observed behaviour indicate credit deterioration. This includes a wide range of information that is reasonably available, including individual credit assessments of the financial performance of borrowers as appropriate during routine reviews, plus forbearance and watch list information; or |
|
• |
backstop criteria: the "30 days past due" backstop is met. |
Definition of default
The definition of default is an important building block for expected credit loss models and is considered a key judgement. A default is considered to have occurred if any unlikeliness to pay criterion is met or when a financial asset meets a "90 days past due" backstop. While some criteria are factual (e.g. administration, insolvency or bankruptcy), others require a judgemental assessment of whether the borrower has financial difficulties which are expected to have a detrimental impact on their ability to meet contractual obligations. A change in the definition of default may have a material impact on the expected credit loss provision.
Key sources of estimation uncertainty
The key sources of estimation uncertainty of the group, which relate to expected credit loss provisions, value in use calculations, and motor finance commissions, are as follows. These were also sources of estimation uncertainty in the prior year except the estimates relating to individually assessed expected credit loss provisions. In addition, the estimates relating to motor finance commissions have been updated in line with the latest developments:
|
• |
forward-looking macroeconomic information incorporated into expected credit loss models; |
|
• |
adjustments by management to model calculated expected credit losses due to limitations in the group's expected credit loss models or input data, which may be identified through ongoing model monitoring and validation of models; |
|
• |
expected credit loss provisions assessed on an individual, rather than collective, basis, with assumptions made in relation to the timing and value of future cash flows under multiple probability-weighted scenarios; |
|
• |
estimate of future cash flow forecasts in the calculation of value in use for the testing of goodwill and other non-financial assets for impairment in relation to the group's cash generating units, in particular Motor Finance and Asset Finance and Leasing; |
|
• |
estimates of the expected rental incomes and disposal values in the calculation of value in use for the operating lease assets of Close Brothers Vehicle Hire; and |
|
• |
estimates and assumptions applied in the calculation of the provision relating to motor finance commissions. These assumptions are customer claim rates and the costs to administer the scheme. Claim rate is defined as the estimated cost of customer remediation (based on customer engagement with redress invitation) as a percentage of the estimated cost of the eligible in-scope population. |
Forward-looking information
Determining expected credit losses under IFRS 9 requires the incorporation of forward-looking macroeconomic information that is reasonable, supportable and includes assumptions linked to economic variables that impact losses in each portfolio. The introduction of macroeconomic information introduces additional volatility to provisions.
In order to calculate forward-looking provisions, economic scenarios are sourced from Moody's Analytics. These cover a range of plausible economic paths that are used in conjunction with PD, EAD and LGD parameters for each portfolio to assess expected credit loss provisions across a range of conditions. An overview of these scenarios using key macroeconomic indicators is provided on pages 34 to 36. Ongoing benchmarking of the scenarios to other economic providers is carried out monthly to provide management with comfort on Moody's Analytics scenario paths.
Five different projected economic scenarios are currently considered to cover a range of possible outcomes. These include a baseline scenario, which reflects the best view of future economic events. In addition, one upside scenario and three downside scenario paths are defined relative to the baseline. Management assigns the scenarios a probability weighting to reflect the likelihood of specific scenarios, and therefore loss outcomes, materialising, using a combination of quantitative analysis and expert judgement.
The impact of forward-looking information varies across the group's lending businesses because of the differing sensitivity of each portfolio to specific macroeconomic variables. This is reflected through the development of bespoke macroeconomic models that recognise the specific response of each business to the macroeconomic environment.
The modelled impact of macroeconomic scenarios and their respective weightings is reviewed by business experts in relation to stage allocation and coverage ratios at the individual and portfolio level, incorporating management's experience and knowledge of customers, the sectors in which they operate, and the assets financed.
This includes assessment of the reaction of the ECL in the context of the prevailing and forecast economic conditions, for example where currently higher interest rates and inflationary conditions exist compared to recent periods.
Economic forecasts have evolved over the course of 2026 and reflect the mixed external backdrop observed in the year. Forecasts deployed in IFRS 9 macroeconomic models are updated on a monthly basis. At 31 July 2026, the latest baseline scenario forecasts gross domestic product ("GDP") growth of 1.0% in calendar year 2026 and an average base rate of 3.8% across the same period. Consumer Price Index ("CPI") inflation is forecast to be 3.2% in calendar year 2026 in the baseline scenario, with 4.7% forecast in the protracted downside scenario over the same period.
At 31 July 2026, the scenario weightings were: 30% upside, 32.5% baseline, 20% mild downside, 10.5% moderate downside and 7% protracted downside. As economic forecasts are considered to recognise developments in the macroeconomic environment appropriately, no change has been made to the weightings ascribed to the scenarios since 31 July 2025.
Given the current economic uncertainty, further analysis has been undertaken to assess the appropriateness of the five scenarios used. This included benchmarking the baseline scenario to consensus economic views, as well as consideration of an additional forecast related to stagflation, which could be considered as an alternative downside scenario.
Compared to the scenarios in use in the expected credit losses calculation, the stagflation scenario includes a longer period of higher interest rates coupled with a shallower but extended impact on GDP. Due to the relatively short tenor of the portfolios, the stagflation scenario is considered to be of less relevance than those deployed. This is supported by the fact that, due to the higher severity of recessionary factors in the existing scenarios, using the stagflation scenario instead of the moderate or protracted downside scenario would result in lower expected credit losses.
The final scenarios deployed reflect a marginally worsened UK economic outlook relative to 31 July 2025, primarily due to persistent concerns linked to the conflict in Iran and associated supply chain pressures. Under the baseline scenario, UK headline CPI inflation is forecast to rise from current levels before resuming its moderating trend towards the Bank of England's 2% target in 2027. Following recent decisions to hold rates at 3.75%, the Bank of England base rate is only expected to start reducing from 2027 onwards in all scenarios. House price outlook has deteriorated, reflecting a challenging year for the housing market that featured volatile mortgage rate movements and subdued activity in the context of wider political and macroeconomic uncertainty. Unemployment rate forecasts have marginally deteriorated, recognising increases observed since 31 July 2025. Conversely, the GDP outlook has improved as the UK economy demonstrated some signs of resilience over the year. While GDP forecasts have strengthened, we consider that there remains a material level of uncertainty that could negatively impact UK economic growth in the near term. In recognition of this, we are holding adjustments to reflect this increased potential for losses at 31 July 2026 (see the "Use of adjustments" section for further detail).
The following tables show economic assumptions within each scenario, and the weighting applied to each at 31 July 2026. The metrics shown are key UK economic indicators, chosen to describe the economic scenarios. These are the main metrics used to set scenario paths, which then influence a wide range of additional metrics that are used in expected credit loss models. The first tables show the forecasts of the key metrics for the scenarios utilised for calendar years 2026 and 2027. The subsequent tables show averages and peak-to-trough ranges for the same key metrics over the five-year period from 2026 to 2030.
Scenario forecasts and weights
|
|
Baseline |
|
Upside (strong) |
|
Downside (mild) |
|
Downside (moderate) |
|
Downside (protracted) |
|||||
|
|
2026 |
2027 |
|
2026 |
2027 |
|
2026 |
2027 |
|
2026 |
2027 |
|
2026 |
2027 |
|
At 31 July 2026 |
|
|
|
|
|
|
|
|
|
|
|
|
|
|
|
UK GDP growth |
1.0% |
1.5% |
|
1.8% |
4.2% |
|
0.3% |
(1.5)% |
|
0.1% |
(2.9)% |
|
0.0% |
(3.9)% |
|
UK unemployment |
5.2% |
5.1% |
|
5.0% |
4.5% |
|
5.4% |
5.6% |
|
5.5% |
7.2% |
|
5.6% |
8.4% |
|
UK HPI growth |
1.2% |
1.9% |
|
7.6% |
12.0% |
|
(1.9)% |
(3.8)% |
|
(3.7)% |
(10.3)% |
|
(5.6)% |
(17.4)% |
|
BoE base rate |
3.8% |
3.3% |
|
3.8% |
3.5% |
|
3.8% |
2.9% |
|
3.8% |
2.8% |
|
3.7% |
2.4% |
|
UK CPI inflation |
3.2% |
2.0% |
|
3.2% |
2.1% |
|
3.8% |
(0.2)% |
|
4.2% |
(2.2)% |
|
4.7% |
(2.9)% |
|
Weighting |
32.5% |
|
30% |
|
20% |
|
10.5% |
|
7% |
|||||
|
|
Baseline |
|
Upside (strong) |
|
Downside (mild) |
|
Downside (moderate) |
|
Downside (protracted) |
|||||
|
|
2025 |
2026 |
|
2025 |
2026 |
|
2025 |
2026 |
|
2025 |
2026 |
|
2025 |
2026 |
|
At 31 July 2025 |
|
|
|
|
|
|
|
|
|
|
|
|
|
|
|
UK GDP growth |
1.1% |
1.0% |
|
1.9% |
3.7% |
|
0.4% |
(1.9)% |
|
0.2% |
(3.4)% |
|
0.1% |
(4.3)% |
|
UK unemployment |
4.7% |
4.7% |
|
4.5% |
4.1% |
|
4.8% |
5.2% |
|
5.0% |
6.8% |
|
5.1% |
8.0% |
|
UK HPI growth |
3.3% |
3.2% |
|
9.9% |
13.4% |
|
0.2% |
(2.6)% |
|
(1.6)% |
(9.2)% |
|
(3.6)% |
(16.4)% |
|
BoE base rate |
4.2% |
3.2% |
|
4.3% |
3.5% |
|
4.1% |
2.4% |
|
4.1% |
1.8% |
|
3.9% |
1.3% |
|
UK CPI inflation |
3.1% |
2.0% |
|
3.2% |
2.1% |
|
2.1% |
0.3% |
|
1.7% |
(0.6)% |
|
1.3% |
(1.1)% |
|
Weighting |
32.5% |
|
30% |
|
20% |
|
10.5% |
|
7% |
|||||
Notes:
UK GDP growth: National Accounts Annual Real Gross Domestic Product, Seasonally Adjusted - year-on-year change (%).
UK unemployment: ONS Labour Force Survey, Seasonally Adjusted - Average (%).
UK HPI growth: Average nominal house prices, Land Registry, Seasonally Adjusted - Q4-to-Q4 change (%).
BoE base rate: Bank of England base rate - Average (%).
UK CPI inflation: ONS, All items, annual inflation - Q4-to-Q4 change (%).
|
|
Five-year average (calendar years 2026 to 2030) |
||||
|
|
Baseline |
Upside |
Downside |
Downside |
Downside (protracted) |
|
At 31 July 2026 |
|
|
|
|
|
|
UK GDP growth |
1.6% |
2.4% |
1.2% |
0.8% |
0.5% |
|
UK unemployment |
5.0% |
4.4% |
5.2% |
7.0% |
7.9% |
|
UK HPI growth |
1.8% |
3.4% |
0.1% |
(1.7)% |
(4.4)% |
|
BoE base rate |
3.0% |
3.1% |
2.6% |
2.1% |
1.7% |
|
UK CPI inflation |
2.2% |
2.3% |
1.8% |
1.3% |
1.1% |
|
Weighting |
32.5% |
30.0% |
20.0% |
10.5% |
7.0% |
|
|
Five-year average (calendar years 2025 to 2029) |
||||
|
|
Baseline |
Upside |
Downside |
Downside |
Downside (protracted) |
|
At 31 July 2025 |
|
|
|
|
|
|
UK GDP growth |
1.6% |
2.3% |
1.1% |
0.8% |
0.7% |
|
UK unemployment |
4.7% |
4.1% |
4.9% |
6.7% |
7.6% |
|
UK HPI growth |
2.5% |
4.2% |
0.8% |
(1.0)% |
(3.5)% |
|
BoE base rate |
3.0% |
3.1% |
2.7% |
2.0% |
1.5% |
|
UK CPI inflation |
2.2% |
2.3% |
1.6% |
1.2% |
0.9% |
|
Weighting |
32.5% |
30.0% |
20.0% |
10.5% |
7.0% |
Notes:
UK GDP growth: National Accounts Annual Real Gross Domestic Product, Seasonally Adjusted - CAGR (%).
UK unemployment: ONS Labour Force Survey, Seasonally Adjusted - Average (%).
UK HPI growth: Average nominal house prices, Land Registry, Seasonally Adjusted - CAGR (%).
BoE base rate: Bank of England base rate - Average (%).
UK CPI inflation: ONS, All items, annual inflation - CAGR (%).
|
|
Five-year period (calendar year 2026 to 2030) |
|||||||||
|
|
Baseline |
Upside (strong) |
Downside (mild) |
Downside (moderate) |
Downside (protracted) |
|||||
|
|
Peak |
Trough |
Peak |
Trough |
Peak |
Trough |
Peak |
Trough |
Peak |
Trough |
|
At 31 July 2026 |
|
|
|
|
|
|
|
|
|
|
|
UK GDP growth |
8.5% |
0.6% |
12.6% |
0.6% |
6.0% |
(1.7)% |
4.3% |
(3.2)% |
2.5% |
(4.4)% |
|
UK unemployment |
5.4% |
4.9% |
5.1% |
4.1% |
5.8% |
4.9% |
7.7% |
5.0% |
9.0% |
5.0% |
|
UK HPI growth |
9.2% |
0.2% |
22.1% |
0.2% |
0.6% |
(5.8)% |
0.5% |
(16.5)% |
0.5% |
(25.4)% |
|
BoE base rate |
3.8% |
2.5% |
3.8% |
2.5% |
3.8% |
1.6% |
3.8% |
1.0% |
3.8% |
0.7% |
|
UK CPI inflation |
3.4% |
1.7% |
3.4% |
1.9% |
4.6% |
(0.8)% |
5.0% |
(2.2)% |
5.4% |
(2.9)% |
|
Weighting |
32.5% |
30% |
20% |
10.5% |
7% |
|||||
|
|
Five-year period (calendar year 2025 to 2029) |
|||||||||
|
|
Baseline |
Upside (strong) |
Downside (mild) |
Downside (moderate) |
Downside (protracted) |
|||||
|
|
Peak |
Trough |
Peak |
Trough |
Peak |
Trough |
Peak |
Trough |
Peak |
Trough |
|
At 31 July 2025 |
|
|
|
|
|
|
|
|
|
|
|
UK GDP growth |
8.2% |
0.7% |
12.3% |
0.7% |
5.7% |
(2.1)% |
4.0% |
(3.8)% |
3.6% |
(5.0)% |
|
UK unemployment |
4.8% |
4.5% |
4.7% |
3.8% |
5.2% |
4.5% |
7.5% |
4.5% |
8.8% |
4.5% |
|
UK HPI growth |
13.2% |
1.5% |
27.8% |
1.5% |
4.3% |
(3.1)% |
2.2% |
(12.6)% |
2.2% |
(22.0)% |
|
BoE base rate |
4.6% |
2.5% |
4.6% |
2.5% |
4.6% |
1.8% |
4.6% |
1.0% |
4.6% |
0.6% |
|
UK CPI inflation |
3.4% |
1.9% |
3.4% |
2.0% |
3.4% |
(0.5)% |
3.4% |
(1.2)% |
3.4% |
(2.1)% |
|
Weighting |
32.5% |
30% |
20% |
10.5% |
7% |
|||||
Notes:
UK GDP growth: Maximum and minimum quarterly GDP as a percentage change from start of period (%).
UK unemployment: Maximum and minimum unemployment rate (%).
UK HPI growth: Maximum and minimum average nominal house price as a percentage change from start of period (%).
BoE base rate: Maximum and minimum Bank of England base rate (%).
UK CPI inflation: Maximum and minimum inflation rate over the five-year period (%).
These periods have been included as they demonstrate the short, medium and long-term outlooks for the key macroeconomic indicators which form the basis of the scenario forecasts. The portfolio has an average residual maturity of 16 months, with 99% of loan value having a maturity of five years or less.
The following charts represent the quarterly forecast data included in the above tables incorporating actual metrics up to 31 July 2026. The dark blue line shows the baseline scenario, while the other lines represent the various upside and downside scenarios.
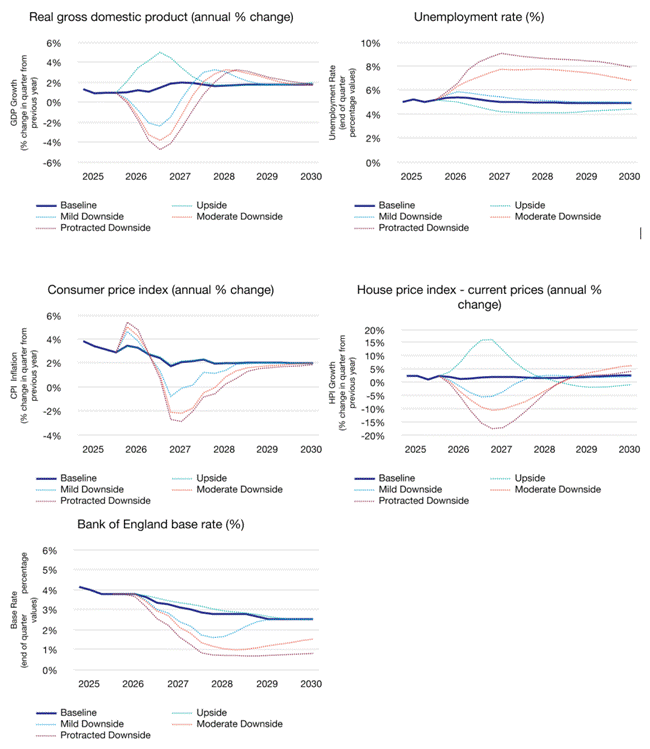
Scenario sensitivity analysis
The expected credit loss provision is sensitive to judgements and estimations made with regard to the selection and weighting of multiple economic scenarios. As a result, management has assessed and considered the sensitivity of the provision as follows:
|
• |
For the majority of the portfolios, the modelled expected credit loss provision has been recalculated under the upside strong and downside protracted scenarios described above, applying a 100% weighting to each scenario in turn. The change in provision requirement is driven by the movement in risk metrics under each scenario and resulting impact on stage allocation. |
|
|
• |
Expected credit losses based on a simplified approach, which do not utilise a macroeconomic model and require expert judgement, are excluded from the sensitivity analysis. |
|
|
• |
In addition to the above, key considerations for the sensitivity analysis are set out below, by segment: |
|
|
|
- |
In Retail, the sensitivity analysis does not apply further stress to the expected credit loss provision on loans and advances to customers in Stage 3, because the measurement of expected credit losses is considered more sensitive to credit factors specific to the borrower than macroeconomic scenarios. |
|
|
- |
In Property, the sensitivity analysis excludes individually assessed provisions which are deemed more sensitive to credit factors than the macroeconomic scenarios. |
Based on the above analysis, at 31 July 2026, application of 100% weighting to the upside strong scenario would decrease the expected credit loss by £20.9 million whilst application of 100% weighting to the protracted downside scenario would increase the expected credit loss by £37.9 million, driven by the aforementioned changes in risk metrics and stage allocation of the portfolios.
When performing sensitivity analysis there is a high degree of estimation uncertainty. On this basis, 100% weighted expected credit loss provisions presented for the upside and downside scenarios should not be taken to represent the lower or upper range of possible and actual expected credit loss outcomes. The recalculated expected credit loss provision for each of the scenarios should be read in the context of the sensitivity analysis as a whole and in conjunction with the disclosures provided in Note 6. The modelled impact presented is based on gross loans and advances to customers at 31 July 2026; it does not incorporate future changes relating to performance, growth or credit risk. In addition, given the change in the macroeconomic conditions, underlying modelled provisions and methodology, and refined approach to adjustments, comparison between the sensitivity results at 31 July 2026 and 31 July 2025 is not appropriate.
The economic environment remains uncertain and future impairment charges may be subject to further volatility, including from updates to macroeconomic variable forecasts impacted by sustained cost-of-living pressures, changes in fiscal policy, trade-related uncertainty (including the impact of tariffs), and ongoing geopolitical conflicts.
Use of adjustments
Limitations in the group's expected credit loss models or input data may be identified through ongoing model monitoring and validation of models. In certain circumstances, management make appropriate adjustments to model-calculated expected credit losses. These adjustments are based on management judgements or quantitative back-testing to ensure expected credit loss provisions adequately reflect all known information. These adjustments are generally determined by considering the attributes or risks of a financial asset which are not captured by existing expected credit loss model outputs. Management adjustments are actively monitored, reviewed and incorporated into future model developments where applicable.
Macroeconomic forecasts continue to react to a range of external factors including changes in the UK's economic policy, in particular following the change in Prime Minister, inflationary pressures, the ongoing conflicts in Ukraine and the Middle East, and uncertainty from tariffs. In response, our use of adjustments has evolved.
In particular, adjustments have been held during the financial year in response to earlier improvements in macroeconomic forecasts that resulted in releases in modelled provisions. A number of these releases were considered premature or counterintuitive by management and adjustments were made as a result. Portfolio performance has been closely monitored during the financial year under review, over which modelled provisions have increased and external forecasts have appropriately responded to the evolving external conditions. As a result, previously held adjustments have been unwound in recognition of the portfolio and models appropriately reacting to changes in the external environment. Notwithstanding this, new macroeconomic adjustments linked to elevated uncertainty around the UK's near-term GDP growth outlook have been applied, and remain under close review by management.
The overall value of adjustments has decreased since 31 July 2025, due to comparatively lower values for the new macroeconomic adjustments, as well as a net reduction in adjustments relating to individual customers where, in management's judgement, modelled provisions did not adequately reflect expected credit losses.
The approach to adjustments continues to reflect the use of expert management judgement which incorporates management's experience and knowledge of customers, the areas in which they operate, and the underlying assets financed.
The need for adjustments will continue to be monitored as new information emerges which might not be recognised in existing models.
At 31 July 2026, £(0.3) million (31 July 2025: £4.0 million) of the expected credit loss provision was attributable to adjustments, which reflects the net offsetting position of positive and negative adjustments depending on the adjustment purpose or model requirement. Adjustments include £1.1 million held to reflect forward-looking economic uncertainty (31 July 2025: £2.1 million).
2. Segmental analysis
The Directors manage the group by class of business and present the segmental analysis on that basis. The group's activities are presented in three (2025: three) operating segments: Commercial, Retail and Property.
In the segmental reporting information that follows, Group consists of central functions as well as various non-trading head office companies and consolidation adjustments and is set out in order that the information presented reconciles to the consolidated income statement. The Group balance sheet primarily includes treasury assets and liabilities comprising cash and balances at central banks, debt securities, customer deposits and other borrowings.
Businesses continue to charge market prices for the limited services rendered to other parts of the group. Funding charges allocated to the segments take into account commercial demands. More than 90% of the group's activities, revenue and assets are located in the UK.
|
|
Commercial £ million |
Retail £ million |
Property £ million |
Group £ million |
Continuing operations £ million |
Discontinued operations1 £ million |
Total £ million |
|
Summary income statement for the year ended 31 July 2026 |
|
|
|
|
|
|
|
|
Net interest income/(expense) |
233.4 |
197.2 |
116.6 |
(8.7) |
538.5 |
- |
538.5 |
|
Other non-interest income |
93.7 |
17.2 |
1.1 |
0.5 |
112.5 |
- |
112.5 |
|
|
|
|
|
|
|
|
|
|
Operating income/(expense) |
327.1 |
214.4 |
117.7 |
(8.2) |
651.0 |
- |
651.0 |
|
Provision in relation to motor finance commissions |
- |
(164.7) |
- |
- |
(164.7) |
- |
(164.7) |
|
Other motor finance commissions related costs, net of insurance recoveries |
- |
3.0 |
- |
- |
3.0 |
- |
3.0 |
|
Restructuring costs |
(7.2) |
(5.6) |
(1.4) |
(0.1) |
(14.3) |
- |
(14.3) |
|
Other administrative expenses |
(177.8) |
(161.2) |
(29.7) |
(25.9) |
(394.6) |
- |
(394.6) |
|
Depreciation and amortisation |
(23.8) |
(18.8) |
(3.4) |
(2.9) |
(48.9) |
- |
(48.9) |
|
Impairment losses on financial assets |
(27.0) |
(29.2) |
(35.6) |
- |
(91.8) |
- |
(91.8) |
|
|
|
|
|
|
|
|
|
|
Total operating expenses |
(235.8) |
(376.5) |
(70.1) |
(28.9) |
(711.3) |
- |
(711.3) |
|
|
|
|
|
|
|
|
|
|
Operating profit/(loss) before tax from continuing operations |
91.3 |
(162.1) |
47.6 |
(37.1) |
(60.3) |
- |
(60.3) |
|
Operating profit before tax from discontinued operations |
- |
- |
- |
- |
- |
2.6 |
2.6 |
|
|
|
|
|
|
|
|
|
|
External operating income/(expense) |
327.9 |
228.2 |
122.4 |
(27.5) |
651.0 |
- |
651.0 |
|
Inter segment operating (expense)/income |
(0.8) |
(13.8) |
(4.7) |
19.3 |
- |
- |
- |
|
|
|
|
|
|
|
|
|
|
Segment operating income/(expense) |
327.1 |
214.4 |
117.7 |
(8.2) |
651.0 |
- |
651.0 |
|
1. |
Discontinued operations comprise Winterflood Securities sold on 1 December 2025 and Close Brothers Asset Management sold on 28 February 2025. See Note 20. |
Other non-interest income of £112.5 million (2025: £120.7 million) includes other income of £101.3 million (2025: £118.5 million), which predominantly relates to the operating lease assets rental income of Close Brothers Vehicle Hire (which is in wind-down) and Close Brewery Rentals Limited (which was sold in August 2025). In the current period, other income also includes a gain on disposal of Close Brewery Rentals Limited of £6.4 million - please refer to Note 20 for more information.
As set out in Note 20 "Discontinued operations and assets and liabilities classified as held for sale", on 25 July 2025, the group announced the sale of Winterflood Securities, an execution services and securities business, to Marex Group plc. The sale completed on 1 December 2025 and its financial results are presented within this note as discontinued operations.
|
|
Commercial £ million |
Retail £ million |
Property £ million |
Group2 £ million |
Continuing operations £ million |
Discontinued operations £ million |
Total £ million |
|
Summary balance sheet information at 31 July 2026 |
|
|
|
|
|
|
|
|
Total assets¹ |
5,016.2 |
2,820.8 |
1,757.3 |
2,464.1 |
12,058.4 |
- |
12,058.4 |
|
Total liabilities |
- |
- |
- |
10,406.8 |
10,406.8 |
- |
10,406.8 |
|
1. |
Total assets for the operating segments comprise the loan book and operating lease assets only in line with the reporting to the Chief Operating Decision Maker and the requirements of IFRS 8 "Operating Segments". |
|
2. |
Balance sheet includes £2,428.7 million assets and £10,139.4 million liabilities (excluding intercompany balances) primarily relating to the treasury balances described in the second paragraph of this note. |
Equity is allocated across the group as set out below. The equity of Commercial, Retail and Property, which is managed as a whole rather than on a segmental basis, reflects loan book and operating lease assets of £9,594.3 million, in addition to assets and liabilities of £2,430.3 million and £10,494.3 million respectively, primarily comprising treasury balances which are included within the Group column above. The remaining difference relates to assets and liabilities of the Group central functions.
|
Equity at 31 July 2026 |
Operating segments £ million |
Group £ million |
Continuing operations £ million |
Discontinued operations £ million |
Total £ million |
|
Equity |
1,530.3 |
121.3 |
1,651.6 |
- |
1,651.6 |
|
|
Commercial |
Retail |
Property |
Group |
Continuing |
Discontinued |
Total |
|
Other segment information for the year ended 31 July 2026 |
|
|
|
|
|
|
|
|
Employees (average number)¹ |
1,350 |
1,092 |
166 |
90 |
2,698 |
95 |
2,793 |
|
1. |
Commercial, Retail and Property segments include a central function headcount allocation. The company's average number of employees is equivalent to the Group number. |
|
|
Commercial £ million |
Retail £ million |
Property £ million |
Group £ million |
Continuing operations £ million |
Discontinued operations1 £ million |
Total £ million |
|
Summary income statement for the year ended 31 July 2025 |
|
|
|
|
|
|
|
|
Net interest income/(expense) |
228.1 |
224.5 |
128.3 |
(12.1) |
568.8 |
- |
568.8 |
|
Impairment of operating lease assets |
(30.0) |
- |
- |
- |
(30.0) |
- |
(30.0) |
|
Other non-interest income |
95.8 |
22.2 |
2.3 |
0.4 |
120.7 |
- |
120.7 |
|
|
|
|
|
|
|
|
|
|
Operating income/(expense) |
293.9 |
246.7 |
130.6 |
(11.7) |
659.5 |
- |
659.5 |
|
|
|
|
|
|
|
|
|
|
Provision in relation to motor finance commissions |
- |
(165.0) |
- |
- |
(165.0) |
- |
(165.0) |
|
Other motor finance commissions related costs, net of insurance recoveries |
- |
(18.7) |
- |
- |
(18.7) |
- |
(18.7) |
|
Provision in relation to early settlements in Motor Finance |
- |
(33.0) |
- |
- |
(33.0) |
- |
(33.0) |
|
Restructuring costs |
(1.4) |
(0.6) |
(0.3) |
- |
(2.3) |
- |
(2.3) |
|
Other administrative expenses |
(183.6) |
(163.5) |
(29.4) |
(39.5) |
(416.0) |
- |
(416.0) |
|
Depreciation and amortisation |
(26.8) |
(20.0) |
(4.5) |
(2.8) |
(54.1) |
- |
(54.1) |
|
Impairment losses on financial assets |
(18.8) |
(44.5) |
(29.5) |
- |
(92.8) |
- |
(92.8) |
|
|
|
|
|
|
|
|
|
|
Total operating expenses |
(230.6) |
(445.3) |
(63.7) |
(42.3) |
(781.9) |
- |
(781.9) |
|
|
|
|
|
|
|
|
|
|
Operating profit/(loss) before tax from continuing operations |
63.3 |
(198.6) |
66.9 |
(54.0) |
(122.4) |
- |
(122.4) |
|
Operating profit before tax from discontinued operations |
- |
- |
- |
46.3 |
46.3 |
4.9 |
51.2 |
|
|
|
|
|
|
|
|
|
|
External operating income/(expense) |
491.4 |
364.3 |
215.1 |
(411.3) |
659.5 |
- |
659.5 |
|
Inter segment operating (expense)/income |
(197.5) |
(117.6) |
(84.5) |
399.6 |
- |
- |
- |
|
|
|
|
|
|
|
|
|
|
Segment operating income/(expense) |
293.9 |
246.7 |
130.6 |
(11.7) |
659.5 |
- |
659.5 |
|
1. |
Discontinued operations comprise Winterflood Securities sold on 1 December 2025 and Close Brothers Asset Management sold on 28 February 2025. See Note 20. |
|
|
Commercial £ million |
Retail £ million |
Property £ million |
Group² £ million |
Continuing operations £ million |
Discontinued operations3 £ million |
Total £ million |
|
Summary balance sheet information at 31 July 2025 |
|
|
|
|
|
|
|
|
Total assets¹ |
4,894.3 |
2,878.9 |
1,852.5 |
3,567.3 |
13,193.0 |
878.9 |
14,071.9 |
|
Total liabilities |
- |
- |
- |
11,548.1 |
11,548.1 |
788.3 |
12,336.4 |
|
1. |
Total assets for the operating segments comprise the loan book and operating lease assets only in line with the reporting to the Chief Operating Decision Maker and the requirements of IFRS 8 "Operating Segments". |
|
2. |
Balance sheet includes £3,521.9 million assets and £11,556.2 million liabilities primarily relating to the treasury balances described in the second paragraph of this note. The remaining difference relates to the assets and liabilities of the Group central functions. |
|
3. |
Discontinued operations on the balance sheet comprise Winterflood Securities. See Note 20. The assets and liabilities of Winterflood Securities presented in this table include intercompany balances for the purposes of segmental reporting. |
Equity is allocated across the group as set out below. The equity of Commercial, Retail and Property, which is managed as a whole rather than on a segmental basis, reflects loan book and operating lease assets of £9,625.7 million, in addition to assets and liabilities of £3,521.9 million and £11,556.2 million respectively primarily comprising treasury balances which are included within the Group column above. The remaining difference relates to the assets and liabilities of the group central functions.
|
Equity at 31 July 2025 |
Operating segments £ million |
Group £ million |
Continuing operations £ million |
Discontinued operations £ million |
Total £ million |
|
Equity |
1,591.4 |
53.5 |
1,644.9 |
90.6 |
1,735.5 |
|
|
Commercial |
Retail |
Property |
Group |
Continuing operations |
Discontinued operations |
Total |
|
Other segment information for the year ended 31 July 2025 |
|
|
|
|
|
|
|
|
Employees (average number)¹ |
1,417 |
1,154 |
172 |
88 |
2,831 |
765 |
3,596 |
|
1. |
Commercial, Retail and Property segments include a central function headcount allocation. The company's average number of employees is equivalent to the Group number. |
3. Tax
|
|
2026 £ million |
2025 £ million |
|
Tax charged/(credited) to the income statement |
|
|
|
Current tax: |
|
|
|
UK corporation tax |
0.5 |
15.0 |
|
Foreign tax |
1.6 |
1.0 |
|
Adjustments in respect of previous years |
(1.2) |
(1.3) |
|
|
0.9 |
14.7 |
|
Deferred tax: |
|
|
|
Deferred tax charge/(credit) for the current year |
2.2 |
(11.6) |
|
Adjustments in respect of previous years |
2.0 |
1.6 |
|
|
|
|
|
|
5.1 |
4.7 |
|
|
|
|
|
Tax on items not charged/(credited) to the income statement |
|
|
|
Current tax relating to: |
|
|
|
Acquisitions and disposals |
- |
3.7 |
|
Defined benefit pension scheme |
0.1 |
- |
|
Deferred tax relating to: |
|
|
|
Cash flow hedging |
(1.3) |
(3.5) |
|
Defined benefit pension scheme |
(0.1) |
- |
|
Financial instruments classified as fair value through other comprehensive income |
0.7 |
(1.2) |
|
Share-based payments |
(0.2) |
- |
|
Currency translation (losses)/gains |
(0.2) |
0.4 |
|
Acquisitions and disposals |
- |
1.7 |
|
|
|
|
|
|
(1.0) |
1.1 |
|
|
|
|
|
Reconciliation to tax expense |
|
|
|
UK corporation tax for the period at 25% (2025: 25%) on operating loss |
(15.1) |
(30.6) |
|
Disallowable items and other permanent differences1 |
25.0 |
40.6 |
|
Banking surcharge |
- |
- |
|
Tax relief on coupon on other equity instruments |
(5.6) |
(5.6) |
|
Prior period tax provision |
0.8 |
0.3 |
|
|
|
|
|
|
5.1 |
4.7 |
|
1. |
Disallowable items and other permanent differences largely relate to the non-deductible provision in relation to motor finance commissions. |
The standard UK corporation tax rate for the financial year is 25.0% (2025: 25.0%). An additional 3.0% (2025: 3.0%) surcharge applies to banking company profits as defined in legislation, but only above a threshold amount which is not exceeded by the current year banking company profits. The effective tax rate of (8.5)% (2025: (3.8)%), which relates to a £5.1 million charge on an operating loss before tax of £60.3 million, differs to the UK corporation tax rate primarily due to disallowable expenditure, which more than offsets the tax relief on coupons on the group's AT1 instrument.
The UK government has implemented the Pillar 2 global minimum tax rate of 15% and a UK domestic minimum top-up tax. The jurisdictions in relation to which Pillar 2 tax liabilities are expected to potentially arise for the group are the Republic of Ireland, Jersey and Guernsey. The current tax charge for the period includes £0.2 million (2025: £nil) in respect of Pillar 2 income taxes. The group has adopted the IAS 12 exemption from recognition and disclosure regarding the impact on deferred tax assets and liabilities arising from this legislation.
Movements in deferred tax assets and liabilities were as follows:
|
|
Capital allowances £ million |
Pension scheme £ million |
Share-based payments and deferred compensation £ million |
Impairment losses £ million |
Cash flow hedging £ million |
Intangible assets £ million |
Other £ million |
Total £ million |
|
Group |
|
|
|
|
|
|
|
|
|
At 1 August 2024 |
5.1 |
(0.2) |
7.2 |
6.0 |
(5.0) |
(2.1) |
3.3 |
14.3 |
|
Credit/(charge) to the income statement |
8.3 |
0.1 |
(1.0) |
(0.6) |
- |
- |
1.6 |
8.4 |
|
(Charge)/credit to other comprehensive income |
(0.4) |
- |
- |
- |
3.5 |
- |
1.2 |
4.3 |
|
Disposals |
(0.1) |
- |
(3.2) |
- |
- |
1.6 |
- |
(1.7) |
|
Reclassification to assets held for sale |
6.2 |
- |
(0.8) |
- |
- |
- |
0.3 |
5.7 |
|
At 31 July 2025 |
19.1 |
(0.1) |
2.2 |
5.4 |
(1.5) |
(0.5) |
6.4 |
31.0 |
|
|
|
|
|
|
|
|
|
|
|
(Charge)/credit to the income statement |
(2.0) |
- |
0.1 |
(1.1) |
- |
- |
(1.2) |
(4.2) |
|
Credit/(charge) to other comprehensive income |
0.2 |
0.1 |
- |
- |
1.3 |
- |
(0.7) |
0.9 |
|
Credit to equity |
- |
- |
0.2 |
- |
- |
- |
- |
0.2 |
|
At 31 July 2026 |
17.3 |
- |
2.5 |
4.3 |
(0.2) |
(0.5) |
4.5 |
27.9 |
The group's deferred tax asset comprises £4.6 million (31 July 2025: £5.7 million) due within one year and £23.3 million (31 July 2025: £25.3 million) due after more than one year.
As the group has been and is expected to continue to be consistently taxpaying, the full deferred tax assets have been recognised. However, deferred tax assets of £0.3 million (31 July 2025: £0.5 million) have not been recognised in respect of certain carried forward tax losses. It is currently uncertain whether the group will be able to utilise these losses.
4. Earnings per share
The calculation of basic earnings per share is based on the profit attributable to shareholders and the number of basic weighted average shares. When calculating the diluted earnings per share, the weighted average number of shares in issue is adjusted for the effects of all dilutive share options and awards.
|
Continuing operations |
2026 |
2025 |
|
Basic |
(58.5)p |
(99.8)p |
|
Diluted |
(58.5)p |
(99.8)p |
|
Adjusted basic1 |
47.5p |
59.3p |
|
Adjusted diluted1 |
47.5p |
59.3p |
|
Discontinued operations2 |
|
|
|
Basic |
1.4p |
32.9p |
|
Diluted |
1.4p |
32.9p |
|
Continuing and discontinued operations |
|
|
|
Basic |
(57.1) p |
(66.9)p |
|
Diluted |
(57.1) p |
(66.9)p |
|
1. |
Excludes the adjusting items set out in the table below and the associated tax effect. |
|
2. |
Discontinued operations comprise Winterflood Securities sold on 1 December 2025 and Close Brothers Asset Management sold on 28 February 2025. See Notes 2 and 20. |
|
|
2026 £ million |
2025 £ million |
|
Loss attributable to shareholders |
(85.7) |
(100.2) |
|
Less profit from discontinued operations, net of tax1 |
(2.0) |
(49.2) |
|
Loss attributable to shareholders on continuing operations |
(87.7) |
(149.4) |
|
Provision in relation to motor finance commissions |
164.7 |
165.0 |
|
Other motor finance commissions related costs, net of insurance recoveries |
(3.0) |
18.7 |
|
Discount unwind in relation to the provisions for motor finance commissions and early settlements in Motor Finance2 |
12.0 |
- |
|
Provision in relation to early settlements in Motor Finance |
- |
33.0 |
|
Gain on disposal of Close Brewery Rentals Limited |
(6.4) |
- |
|
Restructuring costs |
14.3 |
2.3 |
|
Amortisation of intangible assets on acquisition |
0.2 |
0.2 |
|
Operating (profit)/loss before tax of Close Brewery Rentals Limited |
(0.4) |
4.1 |
|
Operating (profit)/loss before tax of Close Brothers Vehicle Hire |
(0.8) |
43.4 |
|
Tax effect of adjustments |
(21.6) |
(28.6) |
|
|
|
|
|
Adjusted profit attributable to shareholders on continuing operations |
71.3 |
88.7 |
|
1. |
Discontinued operations comprise Winterflood Securities sold on 1 December 2025 and Close Brothers Asset Management sold on 28 February 2025. See Notes 2 and 20. |
|
2. |
Refer to Note 13 for further information. |
The tax rate on adjusting items is 12.0% (2025: 10.7%), which differs to the standard UK corporation tax rate for the financial year of 25.0% (2025: 25.0%). This is primarily due to £100.4 million (2025: £150.0 million) of the provisions in relation to motor finance commissions and early settlements in Motor Finance comprising disallowable expenditure, partly offset by the gain on disposal of Close Brewery Rentals Limited being exempt from corporation tax.
|
|
2026 million |
2025 million |
|
Average number of shares |
|
|
|
Basic weighted |
150.0 |
149.7 |
|
Effect of dilutive share options and awards |
1.9 |
0.2 |
|
|
|
|
|
Diluted weighted |
151.9 |
149.9 |
5. Dividends
|
|
2026 £ million |
2025 £ million |
|
For each ordinary share |
|
|
|
Final dividend for previous financial year paid in November 2025: £nil (November 2024: £nil) |
- |
- |
|
Interim dividend for current financial year paid in April 2026: £nil (April 2025: £nil) |
- |
- |
|
|
|
|
|
|
- |
- |
Given the continued uncertainty regarding the outcome of the legal challenges to the FCA's motor finance consumer redress scheme and any potential financial impact, the group will not pay a final dividend on its ordinary shares for the 2026 financial year. We remain committed to the resumption of shareholder distributions at an appropriate time and will reassess our options as greater certainty emerges regarding motor finance commissions, taking into account the group's future capital needs and shareholder feedback.
6. Loans and advances to customers
(a) Maturity and classification analysis of loans and advances to customers
The following tables set out the maturity and IFRS 9 classification analysis of loans and advances to customers. At 31 July 2026, loans and advances to customers with a maturity of two years or less was £7,255.5 million (31 July 2025: £7,346.3 million) representing 74.6% (31 July 2025: 75.7%) of total gross loans and advances to customers:
|
|
On demand £ million |
Within three months £ million |
Between three months and one year £ million |
Between one and two years £ million |
Between two and five years £ million |
After more than five years £ million |
Total gross loans and advances to customers £ million |
Impairment provisions £ million |
Total net loans and advances to customers £ million |
|
At 31 July 2026 |
87.1 |
2,889.9 |
2,360.5 |
1,918.0 |
2,330.6 |
141.5 |
9,727.6 |
(264.4) |
9,463.2 |
|
At 31 July 2025 |
85.1 |
2,984.1 |
2,512.4 |
1,764.7 |
2,220.7 |
142.1 |
9,709.1 |
(249.7) |
9,459.4 |
|
|
31 July 2026 £ million |
31 July 2025 £ million |
|
Gross loans and advances to customers |
|
|
|
Held at amortised cost |
9,717.2 |
9,697.3 |
|
Held at fair value through profit or loss |
10.4 |
11.8 |
|
|
|
|
|
|
9,727.6 |
9,709.1 |
(b) Loans and advances to customers held at amortised cost and impairment provisions by stage
Gross loans and advances to customers held at amortised cost by stage and the corresponding impairment provisions and provision coverage ratios are set out below:
|
|
|
Stage 2 |
|
|
||
|
|
Stage 1 £ million |
Less than 30 days past due £ million |
Greater than or equal to 30 days past due £ million |
Total £ million |
Stage 3 £ million |
Total £ million |
|
At 31 July 2026 |
|
|
|
|
|
|
|
Gross loans and advances to customers held at amortised cost |
|
|
|
|
|
|
|
Commercial |
3,686.6 |
1,112.3 |
27.7 |
1,140.0 |
120.5 |
4,947.1 |
|
Retail |
2,713.1 |
106.1 |
15.8 |
121.9 |
72.7 |
2,907.7 |
|
Property |
1,515.6 |
7.4 |
59.7 |
67.1 |
279.7 |
1,862.4 |
|
|
|
|
|
|
|
|
|
|
7,915.3 |
1,225.8 |
103.2 |
1,329.0 |
472.9 |
9,717.2 |
|
Impairment provisions |
|
|
|
|
|
|
|
Commercial |
19.7 |
16.0 |
2.5 |
18.5 |
34.2 |
72.4 |
|
Retail |
29.9 |
10.4 |
3.9 |
14.3 |
42.7 |
86.9 |
|
Property |
5.5 |
0.1 |
0.9 |
1.0 |
98.6 |
105.1 |
|
|
|
|
|
|
|
|
|
|
55.1 |
26.5 |
7.3 |
33.8 |
175.5 |
264.4 |
|
Provision coverage ratio |
|
|
|
|
|
|
|
Commercial |
0.5% |
1.4% |
9.0% |
1.6% |
28.4% |
1.5% |
|
Retail |
1.1% |
9.8% |
24.7% |
11.7% |
58.7% |
3.0% |
|
Property |
0.4% |
1.4% |
1.5% |
1.5% |
35.3% |
5.6% |
|
|
|
|
|
|
|
|
|
|
0.7% |
2.2% |
7.1% |
2.5% |
37.1% |
2.7% |
|
|
|
Stage 2 |
|
|
||
|
|
Stage 1 £ million |
Less than 30 days past due £ million |
Greater than or equal to 30 days past due £ million |
Total £ million |
Stage 3 £ million |
Total £ million |
|
At 31 July 2025 |
|
|
|
|
|
|
|
Gross loans and advances to customers held at amortised cost |
|
|
|
|
|
|
|
Commercial |
3,717.5 |
925.1 |
39.0 |
964.1 |
108.1 |
4,789.7 |
|
Retail |
2,611.1 |
252.6 |
15.1 |
267.7 |
95.2 |
2,974.0 |
|
Property |
1,585.6 |
15.7 |
43.5 |
59.2 |
288.8 |
1,933.6 |
|
|
|
|
|
|
|
|
|
|
7,914.2 |
1,193.4 |
97.6 |
1,291.0 |
492.1 |
9,697.3 |
|
Impairment provisions |
|
|
|
|
|
|
|
Commercial |
21.7 |
10.8 |
5.2 |
16.0 |
35.8 |
73.5 |
|
Retail |
25.3 |
13.9 |
2.7 |
16.6 |
53.2 |
95.1 |
|
Property |
3.6 |
1.0 |
- |
1.0 |
76.5 |
81.1 |
|
|
|
|
|
|
|
|
|
|
50.6 |
25.7 |
7.9 |
33.6 |
165.5 |
249.7 |
|
Provision coverage ratio |
|
|
|
|
|
|
|
Commercial |
0.6% |
1.2% |
13.3% |
1.7% |
33.1% |
1.5% |
|
Retail |
1.0% |
5.5% |
17.9% |
6.2% |
55.9% |
3.2% |
|
Property |
0.2% |
6.4% |
-% |
1.7% |
26.5% |
4.2% |
|
|
|
|
|
|
|
|
|
|
0.6% |
2.2% |
8.1% |
2.6% |
33.6% |
2.6% |
In Commercial, the impairment coverage ratio was stable at 1.5% (31 July 2025: 1.5%), reflecting offsetting impacts of stage migrations, write-offs, model calibrations and strong new business levels during the financial year.
In Retail, the provision coverage ratio reduced to 3.0% (31 July 2025: 3.2%), reflecting model changes during the year which were partially offset by impacts of enduring macroeconomic pressures that have seen higher but stable levels of arrears and forbearance in the Motor Finance business as a result of persistent cost-of-living challenges for customers.
In Property, the provision coverage ratio increased to 5.6% (31 July 2025: 4.2%), primarily as a result of increased provisions on a small number of facilities, including legacy cases, during the financial year. These provision increases reflect updated estimates in the context of challenging market conditions as a result of build cost inflation and a subdued sales market.
(c) Adjustments
By their nature, limitations in the group's expected credit loss models or input data may be identified through ongoing model monitoring and validation of models. In certain circumstances, management make appropriate adjustments to model-calculated expected credit losses. Adjustments have been identified as a key source of estimation uncertainty as set out in Note 1 "Basis of preparation and accounting policies".
(d) Reconciliation of loans and advances to customers held at amortised cost and impairment provisions
Reconciliation of gross loans and advances to customers and associated impairment provisions are set out below.
New financial assets originate in Stage 1 only, and the amount presented represents the value at origination.
Subsequently, a loan may transfer between stages, and the presentation of such transfers is based on a comparison of the loan at the beginning of the year (or at origination if this occurred during the year) and the end of the year (or just prior to final repayment or write off).
Repayments relating to loans which transferred between stages during the year are presented within the transfers between stages lines. Such transfers do not represent overnight reclassification from one stage to another. All other repayments are presented in a separate line.
ECL model methodologies may be updated or enhanced from time to time and the impacts of such changes are presented on a separate line.
Enhancements to our model suite are a contributory factor to ECL movements and such factors have been taken into consideration when assessing any required adjustments to modelled output and ensuring appropriate provision coverage levels.
A loan is written off when there is no reasonable expectation of further recovery following realisation of all associated collateral and available recovery actions against the customer.
|
|
Stage 1 £ million |
Stage 2 £ million |
Stage 3 £ million |
Total £ million |
|
Gross loans and advances to customers held at amortised cost |
|
|
|
|
|
At 1 August 2025 |
7,914.2 |
1,291.0 |
492.1 |
9,697.3 |
|
New financial assets originated |
5,699.3 |
- |
- |
5,699.3 |
|
Transfers to Stage 1 |
309.0 |
(399.5) |
(9.7) |
(100.2) |
|
Transfers to Stage 2 |
(1,219.2) |
1,035.8 |
(13.0) |
(196.4) |
|
Transfers to Stage 3 |
(210.1) |
(166.9) |
285.6 |
(91.4) |
|
|
|
|
|
|
|
Net transfer between stages and repayments¹ |
(1,120.3) |
469.4 |
262.9 |
(388.0) |
|
Repayments while stage remained unchanged and final repayments |
(4,596.5) |
(432.8) |
(185.3) |
(5,214.6) |
|
Changes to model methodologies2 |
22.7 |
4.2 |
(26.9) |
- |
|
Write offs |
(4.1) |
(2.8) |
(69.9) |
(76.8) |
|
|
|
|
|
|
|
At 31 July 2026 |
7,915.3 |
1,329.0 |
472.9 |
9,717.2 |
|
1. |
Repayments (net of further advances) relate only to financial assets which transferred between stages during the year. Other repayments (net of further advances) are shown in the line below. |
|
2. |
Changes relate to the updated model deployed for the Motor Finance business - see "Critical accounting judgements" in Note 1 for more information. |
|
|
Stage 1 £ million |
Stage 2 £ million |
Stage 3 £ million |
Total £ million |
|
Gross loans and advances to customers held at amortised cost |
|
|
|
|
|
At 1 August 2024 |
8,410.5 |
1,128.8 |
725.5 |
10,264.8 |
|
New financial assets originated |
5,766.1 |
- |
- |
5,766.1 |
|
Transfers to Stage 1 |
200.4 |
(289.4) |
(5.2) |
(94.2) |
|
Transfers to Stage 2 |
(1,381.4) |
1,112.6 |
(4.5) |
(273.3) |
|
Transfers to Stage 3 |
(274.4) |
(146.1) |
321.9 |
(98.6) |
|
|
|
|
|
|
|
Net transfer between stages and repayments1 |
(1,455.4) |
677.1 |
312.2 |
(466.1) |
|
Repayments while stage remained unchanged and final repayments |
(4,852.2) |
(464.3) |
(223.7) |
(5,540.2) |
|
Changes to model methodologies |
48.3 |
(48.3) |
- |
- |
|
Write offs |
(3.1) |
(2.3) |
(321.9) |
(327.3) |
|
|
|
|
|
|
|
At 31 July 2025 |
7,914.2 |
1,291.0 |
492.1 |
9,697.3 |
|
1. |
Repayments (net of further advances) relate only to financial assets which transferred between stages during the year. Other repayments (net of further advances) are shown in the line below. |
The gross carrying amount before modification of loans and advances to customers which were modified during the year while in Stage 2 or 3 was £218.8 million (2025: £259.5 million). £nil (2025: £0.1 million) was recognised as a result of these modifications. The gross carrying amount at 31 July 2026 of modified loans and advances to customers which transferred from Stage 2 or 3 to Stage 1 during the year was £13.0 million (31 July 2025: £20.9 million).
|
|
Stage 1 £ million |
Stage 2 £ million |
Stage 3 £ million |
Total £ million |
|
Impairment provisions on loans and advances to customers held at amortised cost |
|
|
|
|
|
At 1 August 2025 |
50.6 |
33.6 |
165.5 |
249.7 |
|
New financial assets originated |
45.4 |
- |
- |
45.4 |
|
Transfers to Stage 1 |
2.2 |
(8.1) |
(3.1) |
(9.0) |
|
Transfers to Stage 2 |
(12.2) |
38.5 |
(4.0) |
22.3 |
|
Transfers to Stage 3 |
(3.2) |
(17.0) |
82.3 |
62.1 |
|
|
|
|
|
|
|
Net remeasurement of expected credit losses arising from transfer of stages and repayments1 |
(13.2) |
13.4 |
75.2 |
75.4 |
|
Repayments and ECL movements while stage remained unchanged and final repayments |
(24.3) |
(11.7) |
8.4 |
(27.6) |
|
Changes to model methodologies2 |
0.1 |
1.1 |
(15.7) |
(14.5) |
|
Charge to the income statement |
8.0 |
2.8 |
67.9 |
78.7 |
|
Write offs |
(3.5) |
(2.6) |
(57.9) |
(64.0) |
|
|
|
|
|
|
|
At 31 July 2026 |
55.1 |
33.8 |
175.5 |
264.4 |
|
1. |
Repayments (net of further advances) relate only to financial assets which transferred between stages during the year. Other repayments (net of further advances) are shown in the line below. |
|
2 |
Changes relate to the updated model deployed for the Motor Finance business - see "Critical accounting judgements" in Note 1 for more information. |
|
|
Stage 1 £ million |
Stage 2 £ million |
Stage 3 £ million |
Total £ million |
|
Impairment provisions on loans and advances to customers held at amortised cost |
|
|
|
|
|
At 1 August 2024 |
52.2 |
31.3 |
362.3 |
445.8 |
|
New financial assets originated |
46.0 |
- |
- |
46.0 |
|
Transfers to Stage 1 |
1.1 |
(4.3) |
(1.0) |
(4.2) |
|
Transfers to Stage 2 |
(13.4) |
30.6 |
(1.4) |
15.8 |
|
Transfers to Stage 3 |
(4.3) |
(11.4) |
88.0 |
72.3 |
|
Net remeasurement of expected credit losses arising from transfer of stages and repayments1 |
(16.6) |
14.9 |
85.6 |
83.9 |
|
Repayments and ECL movements while stage remained unchanged and final repayments |
(29.5) |
(10.9) |
27.0 |
(13.4) |
|
Changes to model methodologies |
1.4 |
0.5 |
(0.4) |
1.5 |
|
Charge to the income statement |
1.3 |
4.5 |
112.2 |
118.0 |
|
Write offs |
(2.9) |
(2.2) |
(309.0) |
(314.1) |
|
|
|
|
|
|
|
At 31 July 2025 |
50.6 |
33.6 |
165.5 |
249.7 |
|
1. |
Repayments (net of further advances) relate only to financial assets which transferred between stages during the year. Other repayments (net of further advances) are shown in the line below. |
|
|
2026 £ million |
2025 £ million |
|
Impairment losses relating to loans and advances to customers held at amortised cost: |
|
|
|
Charge to income statement arising from movement in impairment provisions |
78.7 |
118.0 |
|
Amounts written off and expensed directly to income statement and other costs, net of discount unwind on Stage 3 loans to interest income, and recoveries |
13.8 |
(29.9) |
|
|
92.5 |
88.1 |
|
Impairment (credit)/losses relating to other financial assets |
(0.7) |
4.7 |
|
|
|
|
|
Impairment losses on financial assets recognised in income statement |
91.8 |
92.8 |
Impairment losses on financial assets of £91.8 million (2025: £92.8 million) include an impairment credit of £0.8 million in relation to Novitas (2025: impairment credit of £6.8 million). Stage 3 gross loans and associated expected credit loss provisions written off in the year in relation to Novitas were £2.3 million (2025: £247.2 million) and £2.3 million (2025: £247.2 million) respectively.
The contractual amount outstanding at 31 July 2026 on financial assets that were written off during the period and are still subject to recovery activity is £26.0 million (31 July 2025: £27.1 million).
(e) Finance lease and hire purchase agreement receivables
|
|
31 July 2026 £ million |
31 July 2025 £ million |
|
Net loans and advances to customers comprise |
|
|
|
Hire purchase agreement receivables |
3,768.3 |
3,613.4 |
|
Finance lease receivables |
1,035.7 |
945.6 |
|
Other loans and advances |
4,659.2 |
4,900.4 |
|
|
|
|
|
|
9,463.2 |
9,459.4 |
The following table shows a reconciliation between gross investment in finance lease and hire purchase agreement receivables included in the net loans and advances to customers table above to present value of minimum lease and hire purchase payments.
|
|
31 July 2026 £ million |
31 July 2025 £ million |
|
Gross investment in finance leases and hire purchase agreement receivables due: |
|
|
|
One year or within one year |
2,029.8 |
1,983.2 |
|
>One to two years |
1,606.6 |
1,535.1 |
|
>Two to three years |
1,198.9 |
1,155.3 |
|
>Three to four years |
729.6 |
647.7 |
|
>Four to five years |
253.7 |
225.0 |
|
More than five years |
43.4 |
41.2 |
|
|
5,862.0 |
5,587.5 |
|
Unearned finance income |
(923.8) |
(884.5) |
|
|
|
|
|
Present value of minimum lease and hire purchase agreement payments |
4,938.2 |
4,703.0 |
|
|
|
|
|
Of which due: |
|
|
|
One year or within one year |
1,698.9 |
1,661.0 |
|
>One to two years |
1,352.5 |
1,292.2 |
|
>Two to three years |
1,013.8 |
974.2 |
|
>Three to four years |
618.4 |
547.9 |
|
>Four to five years |
216.8 |
191.9 |
|
More than five years |
37.8 |
35.8 |
|
|
4,938.2 |
4,703.0 |
|
Impairment provisions |
(134.2) |
(144.0) |
|
|
|
|
|
Net hire purchase agreement receivables and finance lease receivables |
4,804.0 |
4,559.0 |
The aggregate cost of assets acquired for the purpose of letting under finance leases and hire purchase agreements was £8,035.0 million (2025: £7,848.3 million). The average effective interest rate on finance leases approximates to 12.2% (2025: 12.4%). The present value of minimum lease and hire purchase agreement payments reflects the fair value of finance lease and hire purchase agreement receivables before deduction of impairment provisions.
7. Debt securities
|
|
Fair value through profit or loss £ million |
Fair value through other comprehensive income £ million |
Amortised cost £ million |
Total £ million |
|
Sovereign and central bank debt |
- |
340.1 |
- |
340.1 |
|
Supranational, sub-sovereigns and agency ("SSA") bonds |
- |
144.0 |
- |
144.0 |
|
Covered bonds |
- |
83.9 |
- |
83.9 |
|
Other debt securities |
0.6 |
- |
2.5 |
3.1 |
|
|
|
|
|
|
|
At 31 July 2026 |
0.6 |
568.0 |
2.5 |
571.1 |
|
|
Fair value through profit or loss £ million |
Fair value through other comprehensive income £ million |
Amortised cost £ million |
Total £ million |
|
Sovereign and central bank debt |
- |
601.6 |
- |
601.6 |
|
Supranational, sub-sovereigns and agency ("SSA") bonds |
- |
146.2 |
- |
146.2 |
|
Covered bonds |
- |
105.6 |
- |
105.6 |
|
Other debt securities |
1.1 |
- |
4.7 |
5.8 |
|
|
|
|
|
|
|
At 31 July 2025 |
1.1 |
853.4 |
4.7 |
859.2 |
£449.0 million (31 July 2025: £486.1 million) of debt securities measured at fair value through other comprehensive income are due in one year or after one year.
Movements on the book value of sovereign and central bank debt comprise:
|
|
2026 £ million |
2025 £ million |
|
Sovereign and central bank debt at 1 August |
601.6 |
383.7 |
|
Additions |
412.0 |
512.4 |
|
Redemptions |
(675.0) |
(299.1) |
|
Currency translation differences |
(0.9) |
2.2 |
|
Movement in value |
2.4 |
2.4 |
|
|
|
|
|
Sovereign and central bank debt at 31 July |
340.1 |
601.6 |
Movements on the book value of SSA bonds comprise:
|
|
2026 £ million |
2025 £ million |
|
SSA bonds at 1 August |
146.2 |
145.5 |
|
Currency translation differences |
(0.2) |
0.4 |
|
Movement in value |
(2.0) |
0.3 |
|
|
|
|
|
SSA bonds at 31 July |
144.0 |
146.2 |
Movements on the book value of covered bonds comprise:
|
|
2026 £ million |
2025 £ million |
|
Covered bonds 1 August |
105.6 |
187.7 |
|
Additions |
- |
15.5 |
|
Redemptions/disposals |
(21.0) |
(97.4) |
|
Currency translation differences |
(0.2) |
0.5 |
|
Movement in value |
(0.5) |
(0.7) |
|
|
|
|
|
Covered bonds at 31 July |
83.9 |
105.6 |
8. Intangible assets
|
|
Goodwill £ million |
Software £ million |
Intangible assets on acquisition £ million |
Total £ million |
|
Cost |
|
|
|
|
|
At 1 August 2024 |
150.8 |
348.7 |
57.4 |
556.9 |
|
Additions |
- |
25.6 |
- |
25.6 |
|
Disposals |
- |
(6.1) |
- |
(6.1) |
|
Disposal of subsidiaries1 |
(46.9) |
(16.6) |
(51.7) |
(115.2) |
|
Reclassification to assets held for sale2 |
(67.7) |
(20.4) |
- |
(88.1) |
|
|
|
|
|
|
|
At 31 July 2025 |
36.2 |
331.2 |
5.7 |
373.1 |
|
Additions |
- |
25.5 |
- |
25.5 |
|
Disposals |
(1.3) |
(13.4) |
- |
(14.7) |
|
|
|
|
|
|
|
At 31 July 2026 |
34.9 |
343.3 |
5.7 |
383.9 |
|
|
|
|
|
|
|
Accumulated amortisation and impairments |
|
|
|
|
|
At 1 August 2024 |
47.9 |
195.3 |
47.7 |
290.9 |
|
Amortisation charge for the year |
- |
38.3 |
0.8 |
39.1 |
|
Impairment charge for the year |
16.6 |
2.0 |
- |
18.6 |
|
Disposals |
- |
(5.3) |
- |
(5.3) |
|
Disposal of subsidiaries1 |
(3.5) |
(9.2) |
(46.0) |
(58.7) |
|
Reclassification to assets held for sale2 |
(58.9) |
(18.9) |
- |
(77.8) |
|
|
|
|
|
|
|
At 31 July 2025 |
2.1 |
202.2 |
2.5 |
206.8 |
|
Amortisation charge for the year |
- |
35.3 |
0.2 |
35.5 |
|
Disposals |
(1.3) |
(12.1) |
- |
(13.4) |
|
|
|
|
|
|
|
At 31 July 2026 |
0.8 |
225.4 |
2.7 |
228.9 |
|
|
|
|
|
|
|
Net book value at 31 July 2026 |
34.1 |
117.9 |
3.0 |
155.0 |
|
|
|
|
|
|
|
Net book value at 31 July 2025 |
34.1 |
129.0 |
3.2 |
166.3 |
|
|
|
|
|
|
|
Net book value at 1 August 2024 |
102.9 |
153.4 |
9.7 |
266.0 |
|
1. |
Close Brothers Asset Management was sold to Oaktree Capital Management, L.P. on 28 February 2025 - see Note 20. |
|
2. |
Intangible assets relating to Winterflood Securities and Close Brewery Rentals have been reclassified to assets held for sale - see Note 20. |
Software includes assets under development of £26.4 million (31 July 2025: £30.6 million).
Intangible assets on acquisition relate to customer relationships and are amortised over a period of 17 years.
In the 2026 financial year, £35.5 million (2025: £37.4 million) of the amortisation charge, relating to continuing operations, is included in the consolidated income statement within other administrative expenses. The residual is included within profit from discontinued operations, net of tax in the consolidated income statement.
Impairment tests for goodwill and other intangible assets
Overview
At 31 July 2026, goodwill has been allocated to seven (31 July 2025: eight) individual cash generating units ("CGUs"). All seven relate to the Commercial, Retail and Property operating segments, previously collectively known as the Banking division. At 31 July 2025, the eighth CGU related to the Winterflood Securities division ("Winterflood"). However, as disclosed in Note 20, the group completed the sale of Winterflood on 1 December 2025 and therefore the CGU and associated goodwill have been derecognised from the balance sheet.
Goodwill is allocated to the CGU in which the historical acquisition occurred and hence the goodwill originated. Goodwill impairment reviews are carried out at least annually by assessing the recoverable amount of the group's CGUs, which is the higher of fair value less costs to sell and value in use.
Methodology
The recoverable amounts for all CGUs are measured based on value in use. A value in use calculation uses discounted cash flow forecasts based on three-year strategic plans. The value in use calculations are sensitive primarily to changes in the assumptions for future cash flows, which include consideration for future capital requirements and appropriate allocation of overhead costs, as well as discount rates.
The most relevant assumptions underlying management's strategic plans for the CGUs, which are based on past experience and forecast market conditions, are expected loan book growth rates, net return on loan book, future costs and future capital requirements. While these assumptions are relevant to management's plans, they may not all be key assumptions in the goodwill impairment test. In addition, while the CGUs are not individually regulated, for the purposes of an impairment assessment, theoretical capital requirements have been taken into consideration in calculating a CGU's value in use and carrying value to ensure that capital constraints on free cash flows are appropriately reflected and the carrying value is on a comparable basis.
Beyond the group's three-year planning horizon, estimates of future cash flows in the fourth and fifth years, and longer where appropriate, are made by management with due consideration given to the relevant assumptions set out above. After the final year, a terminal value is calculated using an annual growth rate of 2%, which is consistent with the UK government's long-term inflation target.
The cash flows are discounted using a pre-tax estimated weighted average cost of capital. The methodology used to derive the discount rates is fundamentally consistent with the prior year and the discount rates used are also broadly consistent with the prior year. However, they differ across the CGUs, reflecting the nature of the CGUs' business and the current market returns appropriate to the CGU that investors would require for a similar asset.
Assessment overview
The results of the review performed for the year ended 31 July 2026 demonstrate that goodwill is not impaired. This conclusion is underpinned by a number of assumptions as described above, with the future cash flow forecasts in the value in use calculations of the Motor Finance and Asset Finance and Leasing ("AF&L") CGUs identified as key sources of estimation uncertainty.
Assessment of CGUs
The Motor Finance CGU, which includes goodwill of £3.0 million (31 July 2025: £3.0 million) and other intangible assets of £6.8 million (31 July 2025: £10.7 million), relates to the group's UK Motor Finance business. Cash flows for this CGU have been estimated for seven years to ensure an appropriate terminal value and value in use are calculated given a period of strategic change in the shorter term. The value in use of Motor Finance excludes the £318.5 million (31 July 2025: £163.9 million) balance sheet provision in relation to motor finance commissions and £31.3 million (31 July 2025: £33.0 million) provision in relation to early settlements, both as described in Note 13, in line with the requirements of IAS 36.
The key source of estimation uncertainty within the Motor Finance value in use calculation relates to the expected future cash flows, which include consideration for the CGU's strategic growth plans, as well as forecast costs and capital charge. Management's future growth expectations are in part dependent on assumptions relating to funding, capital and customer demand.
The value in use of Motor Finance is calculated to be 135% (31 July 2025: 133%) of carrying value, which represents a headroom of £60 million (31 July 2025: £53 million). To demonstrate the sensitivity to lower cash flows or a delay in future growth, a 36% (31 July 2025: 33%) reduction in the annual cash flows to perpetuity would result in the full reduction of the available headroom. Separately, the pre-tax discount rate used is 16.0% (31 July 2025: 14.9%) and an absolute increase of 3.4% (31 July 2025: 2.5%) in the pre-tax discount rate would result in the full reduction of the available headroom.
The AF&L CGU includes goodwill of £9.8 million (31 July 2025: £9.8 million), which is significant in comparison to total goodwill. The value in use of AF&L is calculated to be 152% (31 July 2025: 122%) of carrying value. The value in use calculation is also dependent on management's assumptions for future cash flows. To demonstrate the sensitivity to cash flows, a 10% reduction in the annual cash flows to perpetuity would result in a 22% (31 July 2025: 46%) reduction in the available headroom.
These scenarios for Motor Finance and AF&L are a demonstration of sensitivity only and do not represent management's base case scenarios where, as stated, value in use remains above carrying value. In addition, the sensitivities do not include all possible management actions which may affect the cash flow and capital forecasts of the CGUs.
9. Property, plant and equipment
|
|
Leasehold property £ million |
Fixtures, fittings and equipment £ million |
Assets held under operating leases £ million |
Motor vehicles £ million |
Right of use assets¹ £ million |
Total £ million |
|
Group |
|
|
|
|
|
|
|
Cost |
|
|
|
|
|
|
|
At 1 August 2024 |
22.4 |
65.1 |
441.9 |
0.4 |
92.9 |
622.7 |
|
Additions |
3.2 |
2.7 |
40.3 |
- |
10.3 |
56.5 |
|
Disposals |
(13.3) |
(4.2) |
(75.9) |
- |
(26.5) |
(119.9) |
|
Disposal of subsidiaries2 |
(5.1) |
(6.8) |
- |
- |
(7.5) |
(19.4) |
|
Reclassification to assets held for sale3 |
(0.7) |
(21.9) |
(80.1) |
(0.1) |
(19.1) |
(121.9) |
|
|
|
|
|
|
|
|
|
At 31 July 2025 |
6.5 |
34.9 |
326.2 |
0.3 |
50.1 |
418.0 |
|
Additions |
0.1 |
4.5 |
21.4 |
- |
3.4 |
29.4 |
|
Disposals |
(2.8) |
(3.5) |
(78.3) |
(0.1) |
(8.1) |
(92.8) |
|
|
|
|
|
|
|
|
|
At 31 July 2026 |
3.8 |
35.9 |
269.3 |
0.2 |
45.4 |
354.6 |
|
|
|
|
|
|
|
|
|
Accumulated depreciation and impairments |
|
|
|
|
|
|
|
At 1 August 2024 |
17.0 |
36.6 |
174.0 |
0.3 |
45.2 |
273.1 |
|
Depreciation and impairment charges for the year |
1.3 |
8.2 |
78.3 |
- |
13.3 |
101.1 |
|
Disposals |
(13.0) |
(4.1) |
(53.3) |
- |
(25.1) |
(95.5) |
|
Disposal of subsidiaries2 |
(3.2) |
(4.7) |
- |
- |
(3.4) |
(11.3) |
|
Reclassification to assets held for sale3 |
(0.6) |
(13.8) |
(39.1) |
(0.1) |
(5.2) |
(58.8) |
|
|
|
|
|
|
|
|
|
At 31 July 2025 |
1.5 |
22.2 |
159.9 |
0.2 |
24.8 |
208.6 |
|
Depreciation and impairment charges for the year |
0.3 |
4.8 |
37.4 |
- |
8.3 |
50.8 |
|
Disposals |
(0.1) |
(3.4) |
(59.1) |
(0.1) |
(7.5) |
(70.2) |
|
|
|
|
|
|
|
|
|
At 31 July 2026 |
1.7 |
23.6 |
138.2 |
0.1 |
25.6 |
189.2 |
|
|
|
|
|
|
|
|
|
Net book value at 31 July 2026 |
2.1 |
12.3 |
131.1 |
0.1 |
19.8 |
165.4 |
|
|
|
|
|
|
|
|
|
Net book value at 31 July 2025 |
5.0 |
12.7 |
166.3 |
0.1 |
25.3 |
209.4 |
|
|
|
|
|
|
|
|
|
Net book value at 1 August 2024 |
5.4 |
28.5 |
267.9 |
0.1 |
47.7 |
349.6 |
|
1. |
Right of use assets primarily relate to the group's leasehold properties. |
|
2. |
Close Brothers Asset Management was sold to Oaktree Capital Management, L.P. on 28 February 2025 - see Note 20. |
|
3. |
Property, plant and equipment relating to Winterflood Securities and Close Brewery Rentals were reclassified to assets held for sale - see Note 20. |
Assets held under operating leases primarily relate to vehicles owned by the group's Vehicle Hire business, which is part of the Commercial operating segment. At 31 July 2026, the carrying value of the operating lease assets in relation to this business was £130.0 million (31 July 2025: £165.0 million). As disclosed in the prior year, the group has decided to exit this business over time.
The operating lease assets have been assessed for impairment with the value in use ("VIU") calculated based on management's exit plan. The VIU of the assets represents the recoverable amount and it approximates their carrying value, therefore, no impairment or reversal of impairment has been identified (2025: £30.0 million impairment charge).
The key sources of estimation uncertainty in the VIU calculation relate to the expected rental incomes and disposal values of the vehicles. At 31 July 2026, a 7.5% absolute increase or decrease in expected rental incomes would increase or decrease the recoverable amount by £8.4 million or £1.6 million respectively (31 July 2025: decrease or increase the impairment charge by £10.2 million or £10.3 million respectively).
Separately, a 10% absolute increase or decrease in the disposal values would increase or decrease the recoverable amount by £6.7 million or £0.5 million respectively (31 July 2025: 15% absolute increase or decrease in the disposal values would decrease or increase the impairment charge by £12.7 million or £13.2 million respectively).
For sensitivity decreases in the recoverable amount in the current year, where the fair value is higher than the reduced value in use, the decrease in recoverable amount is capped at the fair value.
10. Financial liabilities
|
|
On demand £ million |
Within three months £ million |
Between three months and one year £ million |
Between one and two years £ million |
Between two and five years £ million |
After more than five years £ million |
Total £ million |
|
Deposits by banks |
20.3 |
- |
- |
- |
- |
- |
20.3 |
|
Deposits by customers |
838.9 |
2,634.1 |
2,982.7 |
931.2 |
489.3 |
- |
7,876.2 |
|
Loans and overdrafts from banks |
0.9 |
- |
- |
- |
- |
- |
0.9 |
|
Debt securities in issue |
- |
332.6 |
36.2 |
269.8 |
749.0 |
248.4 |
1,636.0 |
|
Subordinated loan capital¹ |
- |
7.5 |
(0.2) |
(0.2) |
(0.9) |
243.6 |
249.8 |
|
|
|
|
|
|
|
|
|
|
At 31 July 2026 |
860.1 |
2,974.2 |
3,018.7 |
1,200.8 |
1,237.4 |
492.0 |
9,783.2 |
|
1. |
Comprises an issuance of £250.0 million with a contractual maturity date of 2036 and optional prepayment date of 2031. |
|
|
On demand £ million |
Within three months £ million |
Between three months and one year £ million |
Between one and two years £ million |
Between two and five years £ million |
After more than five years £ million |
Total £ million |
|
Deposits by banks |
9.3 |
78.8 |
- |
- |
- |
- |
88.1 |
|
Deposits by customers |
1,161.4 |
2,640.3 |
3,533.7 |
852.9 |
611.0 |
- |
8,799.3 |
|
Loans and overdrafts from banks |
1.5 |
- |
- |
- |
- |
- |
1.5 |
|
Debt securities in issue |
- |
56.5 |
124.1 |
974.2 |
503.2 |
333.3 |
1,991.3 |
|
Subordinated loan capital¹ |
- |
1.4 |
(0.3) |
- |
- |
194.4 |
195.5 |
|
|
|
|
|
|
|
|
|
|
At 31 July 2025 |
1,172.2 |
2,777.0 |
3,657.5 |
1,827.1 |
1,114.2 |
527.7 |
11,075.7 |
|
1. |
Comprises an issuance of £200.0 million with a contractual maturity date of 2031 and optional prepayment date of 2026. |
Assets pledged and received as collateral
The group pledges assets for repurchase agreements and securities borrowing agreements which are generally conducted under terms that are customary to standard borrowing contracts.
The group maintains access to the Bank of England's Sterling Monetary Framework, including a reserves account.
The group has securitised without recourse and restrictions £1,570.4 million (31 July 2025: £1,544.8 million) of its insurance premium and motor loan receivables in return for cash and asset-backed securities in issue of £1,443.1 million (31 July 2025: £1,323.4 million), of which £964.1 million (31 July 2025: £245.9 million) is retained by the group.
As the group has retained exposure to substantially all the risks and rewards of the above receivables, including credit, interest rate, prepayment and other risks, it continues to recognise these assets in loans and advances to customers on its consolidated balance sheet.
The majority of loans and advances to customers are secured against specific assets. Consistent and prudent lending criteria are applied across the whole loan book with emphasis on the quality of the security provided.
11. Other equity instrument
Other equity instrument comprises the group's £200.0 million Fixed Rate Reset Perpetual Subordinated Contingent Convertible Securities, or Additional Tier 1 capital ("AT1"), issued on 29 November 2023. These AT1 securities are classified as an equity instrument under IAS 32 "Financial Instruments: Presentation" with the proceeds recognised in equity net of transaction costs of £2.4 million.
These securities carry a coupon of 11.125%, payable semi-annually on 29 May and 29 November of each year, and have a first reset date on 29 May 2029. Two coupon payments totalling £22.3 million were made in the year. The securities include, among other things, a conversion trigger of 7.0% Common Equity Tier 1 capital ratio and are callable any time in the six-month period prior to and including the first reset date or on each reset date occurring every five years thereafter.
12. Capital
|
|
31 July 2026 £ million |
31 July 2025 £ million |
|
CET1 capital |
|
|
|
Shareholders' equity per balance sheet |
1,651.6 |
1,735.5 |
|
Regulatory adjustments to CET1 capital |
|
|
|
Contingent convertible securities recognised as AT1 capital1 |
(197.6) |
(197.6) |
|
Intangible assets, net of associated deferred tax liabilities |
(154.5) |
(176.1) |
|
Foreseeable AT1 coupon charges2 |
(3.8) |
(3.8) |
|
Cash flow hedging reserve |
(0.6) |
(3.8) |
|
Pension asset, net of associated deferred tax liabilities |
- |
(0.1) |
|
Prudent valuation adjustment |
(0.6) |
(1.0) |
|
Securitisation positions which can alternatively be subject to a 1,250% risk weight3 |
(25.8) |
(11.3) |
|
Deferred tax assets that rely on future profitability |
(2.6) |
- |
|
IFRS 9 transitional arrangements4 |
- |
6.3 |
|
CET1 capital |
1,266.1 |
1,348.1 |
|
Additional Tier 1 capital |
200.0 |
200.0 |
|
Total Tier 1 capital |
1,466.1 |
1,548.1 |
|
Tier 2 capital - subordinated debt |
250.0 |
200.0 |
|
Total regulatory capital |
1,716.1 |
1,748.1 |
|
|
|
|
|
RWAs |
|
|
|
Credit and counterparty credit risk |
8,309.8 |
8,864.4 |
|
Operational risk |
662.0 |
820.1 |
|
Market risk5 |
- |
114.0 |
|
|
8,971.8 |
9,798.5 |
|
|
|
|
|
CET1 capital ratio |
14.1% |
13.8% |
|
Tier 1 capital ratio |
16.3% |
15.8% |
|
Total capital ratio |
19.1% |
17.8% |
|
1. |
The contingent convertible securities are classified as an equity instrument for accounting but treated as AT1 for regulatory capital purposes, see Note 11. |
|
2. |
Under CRR Article 26, a deduction for foreseeable charges has been recognised at 31 July 2026 and 31 July 2025. The deduction at 31 July 2026 reflects charges for the coupon on the group's contingent convertible securities. |
|
3. |
Under CRR Article 36, a deduction for securitisations positions, which are subject to a 1,250% risk weight, but alternatively are allowed to be deducted from CET1, has been recognised at 31 July 2026. For more information on this securitisation with the British Business Bank, refer to the Banking Commercial section of the Financial overview. The deduction is applicable from 31 July 2026 (31 July 2025: £11.3 million). |
|
4. |
IFRS 9 transitional arrangements no longer applied as at 31 July 2026 and therefore had no effect on regulatory capital. In FY25, the CET1 ratio benefited by 0.1 percentage points from these arrangements, with the ratio reducing from 13.8% to 13.7% on a fully loaded basis. |
|
5. |
The group applies CRR Article 351 de minimis exemption, under which foreign exchange positions below the prescribed threshold are excluded from market risk own funds requirements. |
The following table shows the movement in CET1 capital during the year:
|
|
31 July 2026 £ million |
31 July 2025 £ million |
|
CET1 capital at 1 August |
1,348.1 |
1,374.8 |
|
Loss in the period attributable to shareholders |
(63.4) |
(77.9) |
|
AT1 coupon charges |
(22.3) |
(22.3) |
|
IFRS 9 transitional arrangements |
(6.3) |
(5.8) |
|
Decrease in intangible assets, net of associated deferred tax liabilities |
21.6 |
87.8 |
|
Deferred tax assets that rely on future profitability |
(2.6) |
- |
|
Other movements in reserves recognised for CET1 capital |
5.0 |
2.4 |
|
Other movements in adjustments from CET1 capital |
(14.0) |
(10.9) |
|
|
|
|
|
CET1 capital at 31 July |
1,266.1 |
1,348.1 |
13. Other liabilities
Provisions are made for claims and other items which arise in the normal course of business. Claims may arise in respect of legal and regulatory matters, while other items largely relate to property dilapidations and employee benefits. A provision is recognised where it is determined that there is a legal or constructive present obligation arising from a past event, payment is probable, and the amount can be estimated reliably. The timing and/or outcome of these claims and other items are uncertain.
Provision in relation to motor commissions
In the previous financial year, a detailed assessment against IAS 37 "Provisions, Contingent Liabilities and Contingent Assets" determined that the criteria for a provision had been met and a provision of £165.0 million was recognised at 31 January 2025 based on a range of probability-weighted redress scenarios. At 31 July 2025, the provision held on the balance sheet decreased slightly to £163.9 million, reflecting some utilisation in relation to costs, partly offset by an unwinding of the discount relating to the time value of money.
Following the publication of the Financial Conduct Authority's ("FCA") consultation paper on 7 October 2025, which proposed an industry-wide redress scheme in respect of motor finance commissions, the group carried out a review of the potential financial impact of the proposed scheme, resulting in an additional income statement charge of £135.0 million in October 2025, increasing the total charge to £300.0 million based on a probability weighted multi-scenario approach.
Following the publication of FCA Policy Statement PS26/3: Motor finance consumer redress scheme ("the scheme") on 30 March 2026, the group increased its provision to £320.0 million, which resulted in an additional income statement charge of £29.7 million. The previously published provision of £300.0 million had reduced due to cost utilisation, partly offset by an unwinding of the discount relating to the time value of money. The £320.0 million provision reflected the group's best estimate of the cost of the scheme as published, including an assumption of delayed implementation due to legal challenges to the scheme brought by a number of parties. While there are aspects of the scheme that the group disagrees with, in order to provide an orderly resolution for all parties, Close Brothers decided not to challenge the scheme.
At 31 July 2026, the provision decreased slightly to £318.5 million, reflecting further cost utilisation, partly offset by an unwinding of the discount relating to the time value of money, and remains the group's best estimate under IAS 37. As set out in Note 1 "Basis of preparation and accounting policies", the provision requires critical accounting judgements to be made, namely determining the affected customers and applying a single scenario based on the scheme as published to calculate the group's best estimate of the provision, in contrast to the probability weighted multi-scenario approach taken in the prior year. A key assumption underpinning the use of a single scenario is that all cases would go through the scheme, as opposed to alternate means.
In addition, other assumptions have been applied in the calculation of the provision, with certain assumptions representing key sources of estimation uncertainty. These relate to customer claim rates and costs to administer the scheme. Changes in these and other assumptions may result in material changes to the estimated provision. The key data points and assumptions are as follows:
|
• |
c.720k UK regulated motor finance loans written between 6 April 2007 and 1 November 2024 qualifying for redress under the scheme. This includes c.640k loans written under Discretionary Commission Arrangements ("DCAs") and a further c.80k non-DCA loans which are likely to meet the "tied" arrangements and/or "high commission" criteria as defined by the FCA; |
|
• |
an average redress payment of c.£500 per customer, including compensatory interest; |
|
• |
an estimated claim rate under the scheme of 75%, in line with the FCA's assumption. A 5% absolute increase or decrease in the assumed claim rate would result in a £17 million increase or decrease in the estimated provision; |
|
• |
an estimated delivery cost of £63 million. This excludes £26 million of costs already incurred against the existing provision at 31 July 2026. A 10% absolute increase or decrease in the assumed delivery costs would result in a £6 million increase or decrease in the estimated provision; and |
|
• |
customer remediation is expected to commence during the 2027 calendar year and complete in the 2028 calendar year, resulting in a time value discount of £17 million. |
The estimated provision is the outcome of a thorough assessment, representing the group's current evaluation based on available information, although is subject to the outcome of the legal challenges to the scheme and any further legal, regulatory or industry developments including court claims and complaints from consumers. Therefore, the ultimate cost to the group could be materially higher or lower than the provision taken. The group continues to gather additional data, progress complaints and prepare operationally as we await the outcome of the legal challenges.
During the year, the group incurred an expense of £7.7 million (2025: £18.7 million) in relation to motor finance commissions. This includes the unwinding of the time value discount in relation to the provision (recognised within interest expense) and legal costs and fees that do not directly relate to the potential redress exercise for which the provision was created, partly offset by associated insurance recoveries. In the prior period, these expenses also included complaints handling costs incurred before the provision was established. These costs, as well as the provision described above, do not reflect underlying trading performance and therefore have been presented as separate adjusting items and excluded from adjusted operating profit by management.
Provision in relation to early settlements in Motor Finance
As disclosed in the prior year, following the identification of historical deficiencies in certain operational processes related to early settlement of loans in the Motor Finance business, the group recognised a provision of £33.0 million at 31 July 2025 in relation to a proactive customer remediation programme to be implemented by the group.
At 31 July 2026, the provision held was £31.3 million, reflecting some utilisation in relation to costs, partly offset by an unwinding of the discount relating to the time value of money, and it continues to reflect management's best estimate of the cost of remediation in relation to impacted customers. The provision includes compensatory interest and associated administrative costs based on the information currently available. The data and provision will be refined as the scope and design of the remediation programme are finalised. Remediation is expected to commence towards the end of the 2026 calendar year.
14. Contingent liabilities
In the normal course of the group's business, there may be other contingent liabilities relating to complaints, legal proceedings or regulatory reviews. These cases are not currently expected to have a material impact on the group.
15. Consolidated cash flow statement reconciliation
|
|
2026 £ million |
2025 £ million |
|
(a) Reconciliation of operating loss before tax to net cash inflow from operating activities |
|
|
|
Operating loss before tax from continuing operations |
(60.3) |
(122.4) |
|
Operating profit before tax from discontinued operations |
2.6 |
51.2 |
|
Tax paid |
(12.2) |
(28.1) |
|
Depreciation, amortisation and impairment |
87.6 |
159.4 |
|
Impairment losses on financial assets |
91.8 |
92.7 |
|
Provision in relation to motor finance commissions excluding cash paid |
145.1 |
161.4 |
|
Other motor finance commissions related costs, net of insurance recoveries and excluding cash paid in relation to motor finance commissions |
0.7 |
5.6 |
|
Provision in relation to early settlements in Motor Finance excluding cash paid |
(2.6) |
33.0 |
|
Restructuring costs excluding cash paid |
6.2 |
- |
|
Gain on disposal of CBAM excluding cash paid in relation to transaction costs |
(1.0) |
(67.6) |
|
Gain on disposal of Winterflood Securities excluding cash paid in relation to transaction costs |
(4.5) |
- |
|
Gain on disposal of Brewery excluding cash paid in relation to transaction costs |
(6.6) |
- |
|
Amortisation of de-designated cash flow hedges |
(2.0) |
(11.4) |
|
Cash inflow/(outflow) arising from changes in: |
|
|
|
Interest receivable and prepaid expenses |
29.8 |
4.8 |
|
Net settlement balances and trading positions |
(25.8) |
3.8 |
|
Net money broker loans against stock advanced |
26.8 |
(7.7) |
|
Interest payable and accrued expenses |
4.1 |
(0.8) |
|
|
|
|
|
Net cash inflow from trading activities |
279.7 |
273.9 |
|
Cash inflow/(outflow) arising from changes in: |
|
|
|
Loans and advances to banks not repayable on demand |
5.5 |
1.4 |
|
Loans and advances to customers |
(104.1) |
196.8 |
|
Assets let under operating leases |
(5.7) |
(20.3) |
|
Sovereign and central bank debt |
263.0 |
(213.3) |
|
Covered bonds |
21.5 |
81.9 |
|
Deposits by banks |
(68.0) |
(52.1) |
|
Deposits by customers |
(923.2) |
100.1 |
|
Loans and overdrafts from banks |
(3.9) |
(148.8) |
|
Debt securities in issue (net) |
(366.6) |
(18.4) |
|
Derivative financial instruments (net) |
- |
1.0 |
|
Other assets less other liabilities1 |
97.1 |
39.0 |
|
|
|
|
|
Net cash (outflow)/inflow from operating activities |
(804.7) |
241.2 |
|
|
|
|
|
(b) Analysis of net cash outflow in respect of the purchase of subsidiaries |
|
|
|
Purchase of subsidiaries, net of cash acquired |
- |
(0.5) |
|
|
|
|
|
(c) Analysis of net cash inflow in respect of the sale of subsidiaries |
|
|
|
Cash consideration received from the disposal of Winterflood Securities |
103.7 |
- |
|
Cash consideration received from the disposal of Close Brewery Rentals Limited |
8.1 |
- |
|
Cash consideration received from the disposal of Close Brothers Asset Management |
- |
146.4 |
|
Total cash consideration received |
111.8 |
146.4 |
|
Cash received in respect of amounts owed by disposed entities, net of cash and cash equivalents disposed of |
10.7 |
(42.4) |
|
|
122.5 |
104.0 |
|
|
|
|
|
(d) Analysis of cash and cash equivalents2 |
|
|
|
Cash and balances at central banks |
1,190.8 |
1,917.2 |
|
Loans and advances to banks |
198.1 |
184.6 |
|
|
|
|
|
|
1,388.9 |
2,101.8 |
|
1. |
Net cash inflow includes £55.6 million received for an insurance settlement relating to the loans and advances to customers of Novitas (2025: £27.2 million), £29.6 million interest expense on Group subordinated loan capital and debt financing reclassified to financing activities (2025: £24.5 million) and £12.0 million discount unwind in relation to the provisions for motor finance commissions and early settlements in Motor Finance (2025: £nil). |
|
2. |
Excludes £26.4 million (2025: £31.9 million) of cash reserve accounts and cash held in trust. |
During the year ended 31 July 2026, the non-cash changes on debt financing amounted to £27.2 million (31 July 2025: £32.2 million) arising largely from interest accretion and fair value hedging movements.
16. Fair value of financial assets and liabilities
The fair values of the group's subordinated loan capital and debt securities in issue are set out below.
|
|
31 July 2026 |
|
31 July 2025 |
||
|
|
Fair value £ million |
Carrying value £ million |
|
Fair value £ million |
Carrying value £ million |
|
Subordinated loan capital |
251.1 |
249.8 |
|
193.5 |
195.5 |
|
Debt securities in issue |
1,651.1 |
1,636.0 |
|
2,013.2 |
1,991.3 |
The fair value of gross loans and advances to customers at 31 July 2026 is estimated to be £9,525.5 million (31 July 2025: £9,543.4 million), with a carrying value of £9,463.2 million (31 July 2025: £9,459.4 million). The fair value of deposits by customers is estimated to be £7,856.7 million (31 July 2025: £8,798.2 million), with a carrying value of £7,876.2 million (31 July 2025: £8,799.3 million). These estimates are based on highly simplified assumptions and inputs including estimated future cash flows and discount rates and may differ to actual amounts received or paid. The differences between fair value and carrying value are not considered to be significant, and are consistent with management's expectations given the nature of the business and the short average tenor of the instruments.
The group holds financial instruments that are measured at fair value subsequent to initial recognition. Each instrument has been categorised within one of three levels using a fair value hierarchy that reflects the significance of the inputs used in making the measurements. These levels are based on the degree to which the fair value is observable.
The instruments included within the three levels, the valuation methodologies and the most significant inputs are consistent with those described in Note 24 of the 2026 Annual Report. The group believes that there is no reasonably possible change to the inputs used in the valuation of these positions which would have a material effect on the group's consolidated income statement.
The tables below show the classification of financial instruments held at fair value into the valuation hierarchy.
|
|
Level 1 £ million |
Level 2 £ million |
Level 3 £ million |
Total £ million |
|
At 31 July 2026 |
|
|
|
|
|
Assets |
|
|
|
|
|
Loans and advances to customers held at FVTPL |
- |
- |
10.4 |
10.4 |
|
Debt securities: |
|
|
|
|
|
Sovereign and central bank debt |
340.1 |
- |
- |
340.1 |
|
SSA bonds |
144.0 |
- |
- |
144.0 |
|
Covered bonds |
83.9 |
- |
- |
83.9 |
|
Derivative financial instruments |
- |
88.5 |
4.8 |
93.3 |
|
Contingent consideration1 |
- |
- |
22.1 |
22.1 |
|
Other assets |
- |
- |
0.6 |
0.6 |
|
|
|
|
|
|
|
|
568.0 |
88.5 |
37.9 |
694.4 |
|
Liabilities |
|
|
|
|
|
Derivative financial instruments |
- |
84.7 |
5.3 |
90.0 |
|
|
|
|
|
|
|
|
- |
84.7 |
5.3 |
90.0 |
|
1. |
Contingent consideration relates to the disposal of Close Brothers Asset Management on 28 February 2025. See Note 20. |
|
|
Level 1 £ million |
Level 2 £ million |
Level 3 £ million |
Total £ million |
|
At 31 July 2025 |
|
|
|
|
|
Assets |
|
|
|
|
|
Loans and advances to customers held at FVTPL |
- |
- |
11.8 |
11.8 |
|
Debt securities: |
|
|
|
|
|
Sovereign and central bank debt |
601.6 |
- |
- |
601.6 |
|
SSA bonds |
146.2 |
- |
- |
146.2 |
|
Covered bonds |
105.6 |
- |
- |
105.6 |
|
Derivative financial instruments |
- |
99.1 |
4.0 |
103.1 |
|
Contingent consideration1 |
- |
- |
21.1 |
21.1 |
|
Other assets |
- |
- |
1.1 |
1.1 |
|
|
|
|
|
|
|
|
853.4 |
99.1 |
38.0 |
990.5 |
|
Liabilities |
|
|
|
|
|
Derivative financial instruments |
- |
100.5 |
4.2 |
104.7 |
|
|
|
|
|
|
|
|
- |
100.5 |
4.2 |
104.7 |
|
1. |
Contingent consideration relates to the disposal of Close Brothers Asset Management on 28 February 2025. See Note 20. |
During the year, there were no transfers from Level 1 and 2 to 3 (2025: no transfers).
Movements in financial instruments categorised as Level 3 were:
|
|
Loans and advances to customers held at FVTPL £ million |
Derivative financial assets £ million |
Derivative financial liabilities £ million |
Equity shares £ million |
Contingent consideration £ million |
Other assets £ million |
Total £ million |
|
At 1 August 2024 |
11.8 |
6.1 |
(6.4) |
0.1 |
(1.8) |
0.8 |
10.6 |
|
Total gains/(losses) recognised in the consolidated income statement |
1.5 |
(2.1) |
2.2 |
- |
- |
- |
1.6 |
|
Purchases, issues, originations and transfers in |
3.6 |
- |
- |
- |
- |
0.3 |
3.9 |
|
Sales, settlements and transfers out |
(5.1) |
- |
- |
(0.1) |
22.9 |
- |
17.7 |
|
|
|
|
|
|
|
|
|
|
At 31 July 2025 |
11.8 |
4.0 |
(4.2) |
- |
21.1 |
1.1 |
33.8 |
|
Total gains/(losses) recognised in the consolidated income statement |
1.2 |
2.0 |
(2.3) |
- |
1.0 |
- |
1.9 |
|
Purchases, issues, originations and transfers in |
2.1 |
(1.2) |
1.2 |
- |
- |
- |
2.1 |
|
Sales, settlements and transfers out |
(4.7) |
- |
- |
- |
- |
(0.5) |
(5.2) |
|
|
|
|
|
|
|
|
|
|
At 31 July 2026 |
10.4 |
4.8 |
(5.3) |
- |
22.1 |
0.6 |
32.6 |
The gains recognised in the consolidated income statement relating to Level 3 instruments held at 31 July 2026 amounted to £1.9 million (2025: £1.6 million).
17. Additional support for customers
Forbearance
Forbearance occurs when a customer is experiencing difficulty in meeting their financial commitments and a concession is granted, by changing the terms of the financial arrangement, which would not otherwise be considered. This arrangement can be temporary or permanent, depending on the customer's circumstances. The group reports forborne exposures as either performing or non-performing in line with regulatory requirements. A forbearance policy is maintained to embed necessary processes and enable consistently fair treatment of all customers and that each is managed based on their individual circumstances. The arrangements agreed with customers will aim to create a sustainable and affordable financial position, thereby reducing the likelihood of suffering a credit loss. The forbearance policy is periodically reviewed to maintain its effectiveness.
The group offers a range of concessions to support customers which vary depending on the product and the customer's status. Such concessions include grace periods/payment moratoria, extensions of the loan term, and refinancing.
Loans are classified as forborne at the time a customer in financial difficulty is granted a concession and the loan will remain treated and recorded as forborne until the following exit conditions are met:
|
• |
the loan is considered as performing and there is no past-due amount according to the amended contractual terms; |
|
• |
a minimum two-year probation period has passed from the date the forborne exposure was considered as performing, during which time regular and timely payments have been made; and |
|
• |
none of the customer's exposures with Close Brothers are more than 30 days past due at the end of the probation period. |
At 31 July 2026, the gross carrying amount of exposures with forbearance measures was £435.8 million (31 July 2025: £406.1 million). The key driver of this increase was higher forbearance in Invoice Finance, linked to large single names. This increase was partially offset by reductions across other Commercial and Retail businesses, reflecting stability in portfolio performance against the backdrop of continued macroeconomic challenges and cost-of-living pressures on customers.
An analysis of forborne loans is shown in the table below:
|
|
31 July 2026 |
31 July 2025 |
|
Gross loans and advances to customers (£ million) |
9,727.6 |
9,709.1 |
|
Forborne loans (£ million) |
435.8 |
406.1 |
|
Forborne loans as a percentage of gross loans and advances to customers (%) |
4.5 % |
4.2 % |
|
Provision on forborne loans (£ million) |
125.5 |
113.8 |
|
Number of customers supported |
13,823 |
15,882 |
The following is a breakdown of forborne loans by segment:
|
|
31 July 2026 |
31 July 2025 |
|
Commercial |
143.4 |
112.9 |
|
Retail |
46.8 |
50.6 |
|
Property |
245.6 |
242.6 |
|
Total |
435.8 |
406.1 |
The following is a breakdown of the number of customers supported by segment:
|
|
31 July 2026 |
31 July 2025 |
|
Commercial |
815 |
948 |
|
Retail |
12,966 |
14,880 |
|
Property |
42 |
54 |
|
Total |
13,823 |
15,882 |
The following is a breakdown of forborne loans by concession type:
|
|
31 July 2026 |
31 July 2025 |
|
Grace period/payment moratorium |
114.1 |
136.3 |
|
Extension of maturity/term |
162.3 |
139.5 |
|
Rescheduled payments |
29.1 |
32.7 |
|
Other forbearance measures1 |
130.3 |
97.6 |
|
Total |
435.8 |
406.1 |
|
1. |
Includes £0.2 million of debt forgiveness concessions (31 July 2025: £0.2 million). |
Government lending schemes
Since the pandemic period, following accreditation, customers have been offered facilities under various UK and Irish government-introduced loan schemes, thereby enabling the group to maximise its support to small businesses. At
31 July 2026, there are 2,857 (31 July 2025: 3,350) remaining facilities, with a residual balance of £535.6 million (31 July 2025: £461.6 million) following continued new lending and regular repayments across the Commercial businesses.
The group maintains a regular reporting cycle of these facilities to monitor performance. To date, a number of claims have been made and payments received under the government guarantee.
18. Interest rate risk
The group recognises three main sources of interest rate risk in the banking book ("IRRBB") which could adversely impact future income or the value of the balance sheet:
|
• |
repricing risk - the risk presented by assets and liabilities that reprice at different times; |
|
• |
embedded optionality risk - the risk presented by contractual terms embedded into certain assets and liabilities; and |
|
• |
basis risk - the risk presented by a mismatch in the reference interest rate for assets and liabilities. |
IRRBB is assessed and measured on a behavioural basis by applying key behavioural and modelling assumptions including, but not limited to, those related to fixed rate loans subject to prepayment risk, the behaviour of non-maturity assets and liabilities, the treatment of own equity, and the expectation of embedded interest rate options. This assessment is performed across a range of regulatory prescribed and internal interest rate shock scenarios approved by the relevant Asset and Liability Committee.
Two measures are used for measuring IRRBB, namely Earnings at Risk ("EaR") and Economic Value ("EV"):
|
• |
EaR measures short-term impacts to earnings, highlighting any earnings sensitivity, should interest rates change unexpectedly. |
|
• |
EV measures longer-term earnings capacity, by estimating the present value sensitivity of the balance sheet, should rates change unexpectedly. |
EaR impact
The table below sets out the assessed impact on group net interest income over a 12-month period from interest rate changes. The results shown are for an instantaneous and parallel change in interest rates at 31 July 2026:
|
|
31 July 2026 |
31 July 2025 |
|
0.5% increase |
3.4 |
2.1 |
|
2.5% increase |
17.1 |
10.1 |
|
0.5% decrease |
(3.5) |
(2.1) |
|
2.5% decrease |
(15.5) |
(9.3) |
The EaR measure is a combination of the group's repricing profile and the embedded optionality risk, which is negligible in the current interest rate environment. The group also monitors any potential earning exposure from basis mismatches between its lending and funding activities at a monthly cadence. To provide a clearer assessment of the group's exposure to interest rate changes, basis risk is excluded from the EaR numbers.
The EaR reflects the group's strategy to manage and minimise interest rate risk, to that required to operate efficiently. The group's EaR at 31 July 2026 was managed within the group's risk appetites.
EV impact
The table below sets out the assessed impact on group EV, which measures the potential change in the balance sheet value following an instantaneous and parallel change in interest rates at 31 July 2026:
|
|
31 July 2026 |
31 July 2025 |
|
0.5% increase |
0.9 |
1.0 |
|
2.5% increase |
4.9 |
4.8 |
|
0.5% decrease |
(0.8) |
(0.9) |
|
2.5% decrease |
0.1 |
(0.3) |
The group's EV at 31 July 2026 reflects its policy to ensure exposure to interest rate shocks is managed within the group's risk appetites. The EV measure is a combination of the repricing profile and the embedded optionality to cover interest rate floors within the group's lending and borrowing activities.
19. Related party transactions
Related party transactions, including salary and benefits provided to directors and key management, did not have a material effect on the financial position or performance of the group during the period. There were no changes to the type and nature of the related party transactions disclosed in the 2025 Annual Report that could have a material effect on the financial position and performance of the group in the year ended 31 July 2026.
20. Discontinued operations and assets and liabilities classified as held for sale
At 31 July 2026, the group's discontinued operations comprised Winterflood Securities and Close Brothers Asset Management.
Summary results of discontinued operations
Operating profit/(loss) before tax
|
|
Year ended |
Year ended |
|
Winterflood Securities |
1.5 |
(14.2) |
|
Close Brothers Asset Management |
1.1 |
65.4 |
|
Operating profit before tax |
2.6 |
51.2 |
Profit/(loss) after tax
|
|
Year ended |
Year ended |
|
Winterflood Securities |
0.9 |
(14.7) |
|
Close Brothers Asset Management |
1.1 |
63.9 |
|
Profit after tax |
2.0 |
49.2 |
Winterflood Securities
On 25 July 2025, the group announced that it had entered into an agreement to sell Winterflood Securities, an execution services and securities business and one of the group's operating segments, to Marex Group plc. The sale was completed on 1 December 2025.
In the group's 2025 Annual Report, the business fulfilled the requirements of IFRS 5 to be classified as discontinued operations in the consolidated income statement with comparative information restated. In addition, the assets and liabilities of the business were presented as held for sale in the consolidated balance sheet.
Assets and liabilities held for sale
The major classes of assets and liabilities classified as held for sale, which exclude intercompany balances eliminated on consolidation, are as follows:
|
|
31 July 2026 |
31 July 2025 |
|
Balance sheet |
|
|
|
Intangible assets |
- |
10.3 |
|
Property, plant and equipment |
- |
20.2 |
|
Loans and advances to banks |
- |
54.8 |
|
Settlement balances |
- |
726.4 |
|
Equity shares |
- |
28.3 |
|
Debt securities and loans |
- |
32.8 |
|
Other assets |
- |
14.2 |
|
Total assets classified as held for sale |
- |
887.0 |
|
Bank loans and overdrafts |
- |
15.3 |
|
Settlement balances |
- |
698.2 |
|
Equity shares |
- |
10.4 |
|
Debt securities and loans |
- |
14.8 |
|
Accruals and deferred income |
- |
8.5 |
|
Other liabilities |
- |
20.2 |
|
Total liabilities classified as held for sale |
- |
767.4 |
Results of discontinued operations
|
|
Four months ended |
Year ended |
|
Operating income |
28.9 |
77.3 |
|
Operating expenses |
(28.4) |
(77.1) |
|
Impairment credit on financial assets |
- |
0.1 |
|
Goodwill impairment recognised on remeasurement of disposal group as held for sale |
- |
(14.5) |
|
Trading profit |
0.5 |
(14.2) |
|
Gain on disposal |
1.0 |
- |
|
Operating profit/(loss) before tax |
1.5 |
(14.2) |
|
Tax1 |
(0.6) |
(0.5) |
|
Profit/(loss) after tax |
0.9 |
(14.7) |
|
1. |
The tax charge of £0.6 million relates to the trading profit of the business prior to disposal. The gain on disposal is exempt following the application of the Substantial Shareholding Exemption. |
Cash flow from discontinued operations
|
|
Four months ended |
Year ended |
|
Net cash flow from operating activities |
(2.3) |
(8.3) |
|
Net cash flow from investing activities |
(0.4) |
0.1 |
|
Net cash flow from financing activities |
(0.2) |
(0.5) |
Consolidated gain on disposal
|
|
31 July 2026 |
|
Cash consideration received |
103.7 |
|
Disposal transaction costs |
(3.4) |
|
|
100.3 |
|
Net assets on completion date |
(99.3) |
|
Gain on disposal |
1.0 |
Close Brothers Asset Management
On 19 September 2024, the group announced that it had entered into an agreement to sell its wealth management business, Close Brothers Asset Management ("CBAM"), one of the group's operating segments, to funds managed by Oaktree Capital Management, L.P. ("Oaktree"). The sale completed on 28 February 2025.
CBAM related to the group's 100% shareholding in Close Asset Management Holdings Limited ("CAMHL") and its subsidiaries. The business was a well-regarded UK wealth management franchise and the transaction strengthened the group's capital base and enhanced its position to navigate the current uncertain environment.
In the group's Half Year 2025 Results, the business fulfilled the requirements of IFRS 5 to be classified as discontinued operations in the consolidated income statement. In addition, the assets and liabilities of the business were presented as held for sale in the consolidated balance sheet. On completion, the assets and liabilities were derecognised and a gain on disposal was recognised as follows.
Results of discontinued operations
|
|
Year ended |
Seven months ended |
|
Operating income |
- |
95.4 |
|
Operating expenses |
- |
(90.8) |
|
Trading profit |
- |
4.6 |
|
Gain on disposal |
0.1 |
60.8 |
|
Movement in fair value of deferred consideration |
1.0 |
- |
|
Operating profit before tax |
1.1 |
65.4 |
|
Tax1 |
- |
(1.5) |
|
Profit after tax |
1.1 |
63.9 |
|
1. |
Tax charge relates to the trading profit of the business prior to disposal. The gain on disposal is exempt following the application of the Substantial Shareholding Exemption. |
Cash flow from discontinued operations
|
|
Year ended |
Seven months ended |
|
Net cash flow from operating activities |
- |
(1.5) |
|
Net cash flow from investing activities |
- |
(3.5) |
|
Net cash flow from financing activities |
- |
(1.7) |
Cash consideration of £146.4 million was received on completion. The contingent deferred consideration is in the form of preference shares, redeemable no later than Oaktree's exit, for an amount of up to £28.0 million plus interest at a rate of 8% per annum, stepping up to 12% after five years.
The contingent deferred consideration is subject to potential deductions, including in relation to retention of key individuals and certain potential regulatory costs and separation cost overruns. The preference shares are measured at fair value through profit or loss under IFRS 9. The fair value is calculated to be £22.1 million (31 July 2025: £21.1 million) based on a discounted expected cash flow method, with the main assumptions relating to the expected time until redemption, aforementioned potential deductions and discount rate.
Close Brewery Rentals Limited
As announced on 15 July 2025, the group agreed the sale of its brewery container rentals business, Close Brewery Rentals Limited ("CBRL"), to MML Keystone, a fund managed by MML Capital. The sale completed on 31 August 2025 and a gain on disposal of £6.4 million has been recognised within "other income" in the consolidated income statement. The cash consideration received was £8.1 million.
In the group's Annual Report 2025, the assets and liabilities of the business were classified as held for sale but did not meet the criteria to be classified as discontinued operations under IFRS 5. The results of CBRL were therefore included within continuing operations.
Assets and liabilities held for sale
The major classes of assets and liabilities classified as held for sale, which exclude intercompany balances eliminated on consolidation, are as follows:
|
|
31 July 2026 |
31 July 2025 |
|
Balance sheet |
|
|
|
Property, plant and equipment |
- |
42.8 |
|
Loans and advances to banks |
- |
0.2 |
|
Other assets |
- |
4.0 |
|
Total assets classified as held for sale |
- |
47.0 |
|
Accruals and deferred income |
- |
0.7 |
|
Other liabilities |
- |
5.3 |
|
Total liabilities classified as held for sale |
- |
6.0 |
Cautionary Statement
Certain statements included or incorporated by reference within this announcement may constitute "forward-looking statements" in respect of the group's operations, performance, prospects, financial condition and/or environmental, social and governance ambitions, targets and commitments. All statements other than statements of historical fact are, or may be deemed to be, forward-looking statements. Forward-looking statements are sometimes, but not always, identified by their use of a date in the future or such words as "anticipates", "aims", "due", "could", "may", "will", "should", "expects", "believes", "intends", "plans", "potential", "targets", "goal" or "estimates" and other words and expressions of similar meaning. By their nature, forward-looking statements involve a number of risks, uncertainties and assumptions and actual results or events may differ materially from those expressed or implied by those statements, including where statements are based on evolving methodologies, data and/or regulatory frameworks. There are also a number of factors, including factors outside of the group's control, that could cause actual future operations, performance, financial conditions, results or developments to differ materially from the plans, goals and expectations expressed or implied by these forward-looking statements and forecasts. These factors include, but are not limited to, those contained in this announcement and the group's Annual Report (available at: https://www.closebrothers.com/investor-relations), including its sections on principal and emerging risks. Accordingly, no assurance can be given that any particular expectation will be met and reliance should not be placed on any forward-looking statement. Additionally, forward-looking statements regarding past trends or activities should not be taken as a representation that such trends or activities will continue in the future.
Except as may be required by law or regulation, no responsibility or obligation is accepted to update or revise any forward-looking statement resulting from new information, future events or otherwise. Nothing in this announcement should be construed as a profit forecast. Past performance cannot be relied upon as a guide to future performance and persons needing advice should consult an independent financial adviser.
This announcement does not constitute or form part of any offer or invitation to sell, or any solicitation of any offer to subscribe for or purchase any shares or other securities in the company or any of its group members, nor shall it or any part of it or the fact of its distribution form the basis of, or be relied on in connection with, any contract or commitment or investment decisions relating thereto, nor does it constitute a recommendation regarding the shares or other securities of the company or any of its group members. Statements in this announcement reflect the knowledge and information available at the time of its preparation. Liability arising from anything in this announcement shall be governed by English law. Nothing in this announcement shall exclude any liability under applicable laws that cannot be excluded in accordance with such laws.
RNS may use your IP address to confirm compliance with the terms and conditions, to analyse how you engage with the information contained in this communication, and to share such analysis on an anonymised basis with others as part of our commercial services. For further information about how RNS and the London Stock Exchange use the personal data you provide us, please see our Privacy Policy.

Latest directors dealings
- 23 minutes ago Dunelm Group
- 41 minutes ago Morgan Advanced Materials
- 53 minutes ago Distribution Finance Capital Holdings
- 1 hour ago IG Group Holdings
- 2 hours ago Galliford Try