
Half-year Financial Report
Summary by AI BETAClose X

British Telecommunications Limited
Results for the half year to 30 September 2026
17 November 2026
About BT
British Telecommunications Limited (formerly British Telecommunications plc) ('BT' or 'the group') is a wholly-owned subsidiary of BT Group Investments Limited, which encompasses virtually all businesses and assets of the BT Group. The ultimate parent company is BT Group plc, which is listed on the London Stock Exchange.
On 24 June 2026, British Telecommunications plc re-registered as a private limited company under the Companies Act 2006, under the name of 'British Telecommunications Limited'.
BT Group is the UK’s leading provider of fixed and mobile telecommunications and related secure digital products, solutions and services.
BT Group consists of three customer-facing units: Consumer serves individuals and families in the UK; Business covers companies and public services in the UK; and Openreach is an independently governed, wholly owned subsidiary wholesaling fixed access infrastructure services to its customers – over 700 communications providers across the UK.
BT has announced that International, which serves multinational organisations headquartered outside the UK and overseas public sector customers, will be contributed into a new joint venture, expected to complete in the second half of 2027.
The directors at 30 September 2026 were Neil Harris, Edward Heaton, Daniel Rider, Helen Charnley and Patricia Cobian. On 1 September 2026, Simon Lowth resigned as director and Patricia Cobian was appointed as director on the same date.
Results for the half year to 30 September
|
Half year to 30 September |
2026 |
2025 |
Change |
|
Reported measures on a continuing basis |
£m |
£m |
% |
|
Revenue |
8,753 |
8,700 |
1 |
|
Profit before tax |
1,376 |
1,286 |
7 |
|
Profit after tax |
1,140 |
1,064 |
7 |
|
Cash generated from continuing operations |
2,568 |
2,868 |
(10) |
|
Capital expenditure1,2 |
2,282 |
2,390 |
(5) |
|
|
|
|
|
|
Adjusted measures on a continuing basis |
£m |
£m |
% |
|
Adjusted1 revenue |
8,750 |
8,696 |
1 |
|
Adjusted service revenue1 |
7,685 |
7,726 |
(1) |
|
Adjusted1 EBITDA |
4,098 |
4,059 |
1 |
|
|
|
|
|
|
Group reported measures (including discontinued operations) |
|
|
|
|
Profit after tax |
1,114 |
981 |
14 |
Customer-facing unit updates
|
|
Adjusted1 revenue |
Adjusted service revenue1 |
Adjusted1 EBITDA | ||||||
|
Half year to 30 September |
2026 |
2025 re-presented3 |
Change |
2026 |
2025 re-presented3 |
Change |
2026 |
2025 re-presented3 |
Change |
|
£m |
£m |
% |
£m |
£m |
% |
£m |
£m |
% | |
|
Consumer |
4,783 |
4,684 |
2 |
3,939 |
3,932 |
— |
1,255 |
1,274 |
(1) |
|
Business |
2,574 |
2,589 |
(1) |
2,348 |
2,370 |
(1) |
601 |
647 |
(7) |
|
Openreach |
3,160 |
3,131 |
1 |
3,160 |
3,131 |
1 |
2,238 |
2,148 |
4 |
|
Other |
6 |
6 |
n/m |
6 |
5 |
n/m |
4 |
(10) |
n/m |
|
Intra-group items |
(1,773) |
(1,714) |
(3) |
(1,768) |
(1,712) |
(3) |
— |
— |
— |
|
Total continuing operations |
8,750 |
8,696 |
1 |
7,685 |
7,726 |
(1) |
4,098 |
4,059 |
1 |
Discontinued operations
Following the announcement in June of our agreement with Verizon to create a combined global business, the International CFU is now reported as a discontinued operation. Throughout this interim announcement, comparative financial information for the half year to 30 September 2025 ('H1 FY26') has been re-presented to reflect the recognition of International as a discontinued operation. International adjusted revenue was £923m (H1 FY26: £1,110m; including £150m of revenue generated in H1 FY26 by the five businesses divested during FY26) and adjusted EBITDA was £60m (H1 FY26: £66m; including £30m of EBITDA generated in H1 FY26 by the five businesses divested during FY26).
- See Glossary on page 24
- Includes spectrum investment of £1m in H1 FY26
- H1 FY26 comparative information is re‑presented on a continuing basis following announcement of our agreement with Verizon to create a combined global business. See note 10 'Discontinued operations and assets and liabilities classified as held for sale' for further information
n/m: comparison not meaningful
Group results for the half year to 30 September 2026
Income statement
Revenue
– Reported revenue was £8,753m, up 1%, driven by higher handset revenues in Consumer, partially offset by declines in adjusted service1 revenue
– Adjusted service1 revenue for the period was £7,685m (H1 FY26: £7,726m), down 1% driven by a continued drag from voice of one percentage point
Operating costs
– Reported operating costs were £7,036m, down 1% year on year due to lower restructuring costs and continued cost transformation, including lower total labour resource, primarily in Openreach, and lower energy costs offsetting higher handset costs in Consumer
– Specific items within operating costs were £69m (H1 FY26: £177m), down 61% due to lower restructuring charges of £85m (H1 FY26: £121m), fair value gains on preference shares in the Sports JV and lower litigation charges
– Adjusted operating costs were £6,967m (H1 FY26: £6,952m), flat year on year
Operating profit
– Reported operating profit was £1,717m, up 9% year on year, driven by revenue growth, strong cost transformation and lower specific items in H1 FY27 compared to H1 FY26
Adjusted EBITDA
– Adjusted1 EBITDA of £4,098m, up 1% year on year, driven by direct labour efficiencies and other cost transformation benefits, more than offsetting voice decline
Net finance expense
– Net finance expense was £341m, up 24% year on year primarily driven by lower investment income
– Specific items within finance expense related to interest expense on retirement benefit obligations of £100m (H1 FY26: £93m). On an adjusted basis, net finance expense was £241m, up 32% year on year
Share of post-tax profit (loss) of associates and joint ventures
– Our share of post-tax losses from our joint ventures and associates was £nil (H1 FY26: £9m loss)
Profit before tax
– Reported profit before tax of £1,376m, up 7% reflecting higher reported operating profit offset by higher reported net finance expense. On an adjusted basis profit before tax was £1,542m, down 1% year on year
Taxation
– The effective tax rate on reported profit was 17.2% (H1 FY26: 17.3%) which is below the UK corporation tax rate of 25%, primarily due to the benefit of the UK patent box tax regime
– The effective tax rate on adjusted profit was 18.3% (H1 FY26: 18.2%) primarily due to the UK patent box regime
– We made net corporate income tax payments of £13m (H1 FY26: £15m) comprising overseas tax payments
– We expect a large proportion of our UK capital expenditure to be eligible for full expensing which will reduce our current year UK tax liability
Profit (loss) for the period from discontinued operations
– Reported loss from discontinued operations was £26m (H1 FY26: £83m loss)
– Adjusted profit from discontinued operations was £14m (H1 FY26: £29m loss), reflecting disciplined cost management and ongoing transformation initiatives. H1 FY26 loss included £30m of operating profit from divestments which completed in FY26
- See Glossary on page 24
Cash flow and liquidity
Cash flow
– Cash generated from continuing operations was £2,568m, down 10%, reflecting a higher cash outflow from working capital and working capital programmes
Capital expenditure
– Capital expenditure1 was £2,282m, down 5% on H1 FY26 mainly driven by lower build activity
– Cash capital expenditure was £2,518m, down 1% with the difference to reported capital expenditure reflecting capital creditors and government grants
Pensions (Note 6 to the condensed consolidated financial statements)
– The IAS 19 pension deficit has decreased to £3.2bn at 30 September 2026, net of tax £2.1bn (31 March 2026: £4.2bn, net of tax £3.1bn). The decrease predominantly reflects the payment of scheduled contributions over the period
Balance sheet
– Non-current assets at 30 September 2026 were £52,367m (FY26: £54,203m), a decrease of £1,836m, mainly reflecting the classification of BT's International operations as held for sale
– Current assets at 30 September 2026 were £7,715m (FY26: £7,108m), of which £2,455m relates to trade and other receivables (FY26: £3,116m). The increase of £607m was mainly driven by assets classified as held for sale, partly offset by reductions in trade and other receivables, investments and preference shares in joint ventures
– Current liabilities at 30 September 2026 were £9,081m (FY26: £8,391m), of which £4,449m relates to trade and other payables (FY26: £5,877m). The increase of £690m was primarily a result of the increase of £1,278m in loans and other borrowings reflecting higher current borrowings and liabilities classified as held for sale, partially offset by lower trade and other payables and contract liabilities
– Non-current liabilities of £26,363m at 30 September 2026 (FY26: £27,930m) decreased by £1,567m. The decrease was primarily driven by lower retirement benefit obligations, loans and other borrowings, lease liabilities and the recognition of International as held for sale, partially offset by an increase in derivative financial instruments
– Total equity decreased by £352m to £24,638m (FY26: £24,990m) reflecting profits of £1,114m in the period and actuarial gains on retirement benefit obligations, partially offset by dividends paid to shareholders of £1,500m and adverse cash flow hedge reserve movements
Principal risks and uncertainties
Risk management is integral to our business and to achieving our strategic priorities. Our risk management framework gives us a simple, consistent way of looking at the challenges we face when delivering our strategy. It gives us the processes and structure we need to manage and oversee risk consistently and effectively, helping us make informed decisions against our risk appetite.
We continue to face a broad range of internal and external risks and uncertainties. During the period, our risk landscape has continued to evolve, reflecting developments in artificial intelligence, cyber security, geopolitics, regulation and global supply chains, as well as the acquisition of TalkTalk. While these developments have contributed to the emergence of new areas of uncertainty, they have not fundamentally altered the group's principal risks and uncertainties. Managing these while continuing to transform our business and deliver our strategic priorities remains a key focus.
The principal risks and uncertainties facing the group at 31 March 2026 are set out in detail within the strategic report section of the British Telecommunications Limited Annual Report 2026, which was published on 16 June 2026.
- See Glossary on page 24.
Operating review
Measures discussed in the operating review are on an adjusted basis and unless otherwise stated commentary is on half year results. For a definition of adjusted, see Glossary on page 24.
Consumer: Winning with customers, resilient financial performance
|
|
Half year to 30 September | |||
|
|
2026 |
2025 |
Change | |
|
|
£m |
£m |
£m |
% |
|
Revenue1 |
4,783 |
4,684 |
99 |
2 |
|
Of which service revenue1 |
3,939 |
3,932 |
7 |
— |
|
Operating costs1 |
3,528 |
3,410 |
118 |
3 |
|
EBITDA1 |
1,255 |
1,274 |
(19) |
(1) |
|
Depreciation & amortisation1 |
752 |
849 |
(97) |
(11) |
|
Operating profit1 |
503 |
425 |
78 |
18 |
|
Capital expenditure1 |
509 |
567 |
(58) |
(10) |
Financial metrics
– Revenue1 up 2% driven by higher handset revenues; equipment revenue up 12%
– Service revenue1 flat year on year, including a 1 percentage point drag from voice
– EBITDA¹ down 1% driven by lower voice revenue, incremental PSTN switchover costs, higher Openreach costs and investment in the BT brand refresh, partially offset by revenue flow-through. We continue to expect lower sports content costs in H2
– Depreciation and amortisation1 down, primarily reflecting the full amortisation of EE customer relationship intangibles
– Capital expenditure1 down driven by lower system and IT spend to run our core operations
Operational metrics
– Postpaid mobile net adds of 86k in H1, growing the base to 14.1m, with churn remaining low at 1.0%. Postpaid ARPU was £19.8, up 3% year on year
– Broadband base declined by 7k in H1, driven by the introduction of an activation fee. The base remained above 8.2m, with churn at 1.2%. Broadband ARPU was £40.8, down 3% year on year, reflecting lower voice revenue and a competitive market
– TV customer growth continued, with 26k net adds in H1, supported by two industry awards recognising EE TV’s smarter, more personalised experience
– FTTP adoption saw record growth, with the base increasing in H1 by 574k to 4.7m customers, up 29% year on year and now representing 58% of the total broadband base
– 5G+ coverage continued to expand, now reaching 81% of the population
– Our converged product base continued to grow, with 27.1% (H1 FY26: 25.9%) of all broadband and mobile customers now taking both services. Growth was supported by the launch of EE One Up, our new rewards programme and the relaunch of BT Mobile and BT TV
– Our network leadership was reinforced through a historic double award win, with RootMetrics® recognising EE as the UK's Best Mobile Network for the 13th consecutive year and Ookla recognising BT Group's Full Fibre network, serving BT, EE and Plusnet customers, as the UK's Best Broadband Network. EE also strengthened its innovation leadership through the launch of Fast Lane, the UK's first consumer network slicing proposition, and EE was the first and only UK operator to launch iPhone Handoff
– Customer experience improved across all three brands, with NPS increasing by 5.3pts year on year
- Financials and commentary are based on adjusted measures; see Glossary on page 24.
Business: Strong customer momentum, foundations for growth
|
|
Half year to 30 September | |||
|
|
2026 |
2025 |
Change | |
|
|
£m |
£m |
£m |
% |
|
Revenue1 |
2,574 |
2,589 |
(15) |
(1) |
|
Of which service revenue1 |
2,348 |
2,370 |
(22) |
(1) |
|
Operating costs1 |
1,973 |
1,942 |
31 |
2 |
|
EBITDA1 |
601 |
647 |
(46) |
(7) |
|
Depreciation & amortisation1 |
401 |
372 |
29 |
8 |
|
Operating profit1 |
200 |
275 |
(75) |
(27) |
|
Capital expenditure1 |
318 |
268 |
50 |
19 |
Financial metrics
– Revenue1 and service revenue1 down 1%, both up 1% before the voice drag, with improving FTTP mix and mobile growth
– EBITDA down 7%, due to the impact of migration from legacy products, expected higher marketing costs, higher input costs and low-margin kit sales, with improvements expected in H2
– Depreciation and amortisation1 up driven by higher network, digital and customer equipment investment
– Capital expenditure up driven by higher customer capital expenditure and digital investment to support new customer wins and transformation
Operational metrics
– FTTP base increased 29% year on year to 356k
– Units on legacy networks down by 53% year on year from 821k to 384k
– Strong commercial momentum, with high double-digit order growth year on year, including contracts with Scottish Water, Royal Mail, the Ministry of Justice and the Cabinet Office, reflecting BT's trusted brand, differentiated capabilities and improved sales execution
– Expanded our AI-enabled capabilities, including the launch of AI from BT, a new portfolio of practical and secure AI solutions, with AI Receptionist as its first customer offering
– Enabled the UK's first routine use of Beyond Visual Line of Sight (BVLOS) drones in day-to-day policing with British Transport Police
– Launched Fast Lane for businesses to support activities that depend on reliable mobile connectivity, including taking card payments, joining video calls while travelling and accessing digital services on the move
– Deepened the strategic partnership with Microsoft to help protect UK businesses and public sector organisations by combining BT’s scale, security operations and network insight with Microsoft’s leading security technology
– Continued NPS growth, up 5.2pts year on year, driven by improvements in corporate and public sector, and wholesale
- Financials and commentary are based on adjusted measures; see Glossary on page 24.
Openreach: Record FTTP connections, strong EBITDA growth
|
|
Half year to 30 September | |||
|
|
2026 |
2025 |
Change | |
|
|
£m |
£m |
£m |
% |
|
Revenue1 |
3,160 |
3,131 |
29 |
1 |
|
Of which service revenue1 |
3,160 |
3,131 |
29 |
1 |
|
Operating costs1 |
922 |
983 |
(61) |
(6) |
|
EBITDA1 |
2,238 |
2,148 |
90 |
4 |
|
Depreciation & amortisation1 |
1,112 |
1,053 |
59 |
6 |
|
Operating profit1 |
1,126 |
1,095 |
31 |
3 |
|
Capital expenditure1 |
1,419 |
1,529 |
(110) |
(7) |
Financial metrics
– Revenue1 up 1% driven by price increases across the portfolio and higher ARPU from the improved FTTP mix in broadband, partially offset by declines in the customer base of non-FTTP broadband and voice-only
– EBITDA¹ up 4% driven by ongoing cost transformation, including the benefit of lower repair volumes and lower total labour resource, plus revenue flow-through, partially offset by pay inflation
– Depreciation and amortisation1 up reflecting investment in the network
– Capital expenditure1 down driven by lower FTTP build activity and lower Ethernet provisioning volumes, partially offset by higher FTTP provisioning volumes. We expect capital expenditure in H2 to be down by around 30% year on year due to lower build volumes
Operational metrics
– FTTP connected base grew by a record 1.1m lines in H1, reaching a total of 9.9m and reaching 10m connections in October. Our take-up rate has increased to 41%, maintaining our market-leading position amongst major fibre providers
– FTTP footprint reached 24.1m, an increase of 1.2m in H1
– Openreach broadband lines fell by 175k in Q2; we continue to expect losses of c.800k in the year
– Openreach broadband ARPU was £17.8, up 7% year on year, driven by CPI-linked price increases, higher FTTP take-up and speed mix
– Year to date, Openreach achieved all Ofcom Quality of Service standards for FTTP, Copper and Ethernet
– Openreach delivered a solid performance for on-time FTTP provision of 90.5%
– End customer satisfaction was maintained, with 92% of our independent customer survey responses scoring Openreach between 8 and 10 (out of 10), helping to maintain an 'Excellent' Trustpilot rating
- Financials and commentary are based on adjusted measures; see Glossary on page 24.
Condensed consolidated financial statements
Group income statement
|
Half year to 30 September 2026 |
Note |
Before specific items (Adjusted) |
Specific items (note 5) |
Total (Reported) |
|
£m |
£m |
£m | ||
|
Revenue |
2,3 |
8,750 |
3 |
8,753 |
|
Operating costs |
4 |
(6,967) |
(69) |
(7,036) |
|
Of which net impairment losses on trade receivables and contract assets |
|
(77) |
— |
(77) |
|
Operating profit (loss) |
|
1,783 |
(66) |
1,717 |
|
Finance expense |
|
(581) |
(100) |
(681) |
|
Finance income |
|
340 |
— |
340 |
|
Net finance expense |
|
(241) |
(100) |
(341) |
|
Share of post-tax profit (loss) of associates and joint ventures |
9 |
— |
— |
— |
|
Profit (loss) before tax |
|
1,542 |
(166) |
1,376 |
|
Taxation |
|
(282) |
46 |
(236) |
|
Profit (loss) for the period from continuing operations |
|
1,260 |
(120) |
1,140 |
|
Profit (loss) for the period from discontinued operations |
10 |
14 |
(40) |
(26) |
|
Profit (loss) for the period |
|
1,274 |
(160) |
1,114 |
|
|
|
|
|
|
|
Half year ended 30 September 2025, re-presented1 |
Note |
Before specific items (Adjusted) |
Specific items (note 5) |
Total (Reported) |
|
£m |
£m |
£m | ||
|
Revenue |
2,3 |
8,696 |
4 |
8,700 |
|
Operating costs |
4 |
(6,952) |
(177) |
(7,129) |
|
Of which net impairment losses on trade receivables and contract assets |
|
(80) |
— |
(80) |
|
Operating profit (loss) |
|
1,744 |
(173) |
1,571 |
|
Finance expense |
|
(593) |
(93) |
(686) |
|
Finance income |
|
410 |
— |
410 |
|
Net finance expense |
|
(183) |
(93) |
(276) |
|
Share of post-tax profit (loss) of associates and joint ventures |
9 |
(9) |
— |
(9) |
|
Profit (loss) before tax |
|
1,552 |
(266) |
1,286 |
|
Taxation |
|
(283) |
61 |
(222) |
|
Profit (loss) for the period from continuing operations |
|
1,269 |
(205) |
1,064 |
|
Profit (loss) for the period from discontinued operations |
10 |
(29) |
(54) |
(83) |
|
Profit (loss) for the period |
|
1,240 |
(259) |
981 |
|
|
|
|
|
|
- H1 FY26 comparative information is re‑presented on a continuing basis following announcement of our agreement with Verizon to create a combined global business. See note 10 'Discontinued operations and assets and liabilities classified as held for sale' for further information.
Group statement of comprehensive income
|
|
Half year ended 30 September | |
|
|
2026 |
2025 |
|
|
£m |
£m |
|
Profit for the period |
1,114 |
981 |
|
Other comprehensive income (loss) |
|
|
|
Items that will not be reclassified to the income statement |
|
|
|
Remeasurements of the net pension obligation |
176 |
(488) |
|
Tax on pension remeasurements |
(45) |
122 |
|
Items that have been or may be reclassified subsequently to the income statement |
|
|
|
Exchange differences on translation of foreign operations |
(10) |
(36) |
|
Fair value movements on assets at fair value through other comprehensive income |
— |
2 |
|
Movements in relation to cash flow hedges: |
|
|
|
– net fair value (losses) |
(345) |
20 |
|
– recognised in income and expense |
205 |
(112) |
|
Share of post-tax other comprehensive income in associates and joint ventures |
— |
11 |
|
Tax on components of other comprehensive income (loss) that have been or may be reclassified |
33 |
22 |
|
Other comprehensive income (loss) for the period, net of tax |
14 |
(459) |
|
Total comprehensive income for the period |
1,128 |
522 |
|
|
|
|
|
Total comprehensive income (loss) for the period arising from: |
|
|
|
Continuing operations |
1,156 |
616 |
|
Discontinued operations |
(28) |
(94) |
Group balance sheet
|
|
Note |
30 September 2026 |
31 March 2026 re-presented |
|
|
|
£m |
£m |
|
Non-current assets |
|
|
|
|
Goodwill |
|
6,838 |
7,305 |
|
Other intangible assets |
|
4,375 |
4,663 |
|
Property, plant and equipment |
|
24,881 |
24,650 |
|
Right-of-use assets |
|
2,675 |
3,032 |
|
Derivative financial instruments |
|
634 |
830 |
|
Investments |
|
11,860 |
12,435 |
|
Joint ventures and associates |
9 |
3 |
4 |
|
Trade and other receivables |
|
602 |
681 |
|
Contract assets |
|
312 |
382 |
|
Retirement benefit surplus |
6 |
170 |
170 |
|
Deferred tax assets1 |
|
17 |
51 |
|
Total non-current assets |
|
52,367 |
54,203 |
|
Current assets |
|
|
|
|
Inventories |
|
349 |
366 |
|
Trade and other receivables |
|
2,455 |
3,116 |
|
Preference shares in joint ventures |
9 |
184 |
282 |
|
Contract assets |
|
938 |
1,009 |
|
Assets classified as held for sale |
10 |
1,907 |
— |
|
Current tax receivable |
|
423 |
433 |
|
Derivative financial instruments |
|
75 |
68 |
|
Investments |
|
1,074 |
1,482 |
|
Cash and cash equivalents |
|
310 |
352 |
|
Total current assets |
|
7,715 |
7,108 |
|
Total assets |
|
60,082 |
61,311 |
|
Current liabilities |
|
|
|
|
Loans and other borrowings |
|
1,698 |
420 |
|
Derivative financial instruments |
|
180 |
85 |
|
Trade and other payables |
|
4,449 |
5,877 |
|
Contract liabilities |
|
735 |
963 |
|
Lease liabilities |
|
711 |
779 |
|
Liabilities classified as held for sale |
10 |
1,103 |
— |
|
Current tax liabilities |
|
55 |
66 |
|
Provisions |
|
150 |
201 |
|
Total current liabilities |
|
9,081 |
8,391 |
|
Non-current liabilities |
|
|
|
|
Loans and other borrowings |
|
17,592 |
18,116 |
|
Derivative financial instruments |
|
492 |
313 |
|
Contract liabilities |
|
258 |
274 |
|
Lease liabilities |
|
3,004 |
3,405 |
|
Retirement benefit obligations |
6 |
3,339 |
4,379 |
|
Other payables |
|
238 |
177 |
|
Deferred tax liabilities1 |
|
1,139 |
896 |
|
Provisions |
|
301 |
370 |
|
Total non-current liabilities |
|
26,363 |
27,930 |
|
Total liabilities |
|
35,444 |
36,321 |
|
Net assets |
|
24,638 |
24,990 |
|
Equity |
|
|
|
|
Share capital |
|
2,172 |
2,172 |
|
Share premium |
|
8,000 |
8,000 |
|
Other reserves |
|
1,240 |
1,357 |
|
Retained earnings |
|
13,226 |
13,461 |
|
Total equity |
|
24,638 |
24,990 |
- We have re-presented the balance sheet at 31 March 2026 to offset the £1,073m deferred tax asset relating to our retirement benefit obligations within the deferred tax liability. This re-presentation has no impact on net assets, profit or cash flows. See note 1 'Basis of preparation and accounting policies' for further information.
Group statement of changes in equity
|
|
Share capital |
Share premium |
Other reserves |
Retained earnings |
Total equity |
|
|
£m |
£m |
£m |
£m |
£m |
|
At 1 April 2026 |
2,172 |
8,000 |
1,357 |
13,461 |
24,990 |
|
Profit for the period |
— |
— |
— |
1,114 |
1,114 |
|
Other comprehensive income (loss) before tax |
— |
— |
(355) |
176 |
(179) |
|
Tax on other comprehensive income (loss) |
— |
— |
33 |
(45) |
(12) |
|
Transferred to the income statement |
— |
— |
205 |
— |
205 |
|
Total comprehensive income (loss) for the period |
— |
— |
(117) |
1,245 |
1,128 |
|
Dividends to shareholders |
— |
— |
— |
(1,500) |
(1,500) |
|
Share-based payments |
— |
— |
— |
21 |
21 |
|
Other movements |
— |
— |
— |
(1) |
(1) |
|
At 30 September 2026 |
2,172 |
8,000 |
1,240 |
13,226 |
24,638 |
|
At 1 April 2025 |
2,172 |
8,000 |
1,535 |
13,724 |
25,431 |
|
Profit for the period |
— |
— |
— |
981 |
981 |
|
Other comprehensive income (loss) before tax |
— |
— |
(14) |
(477) |
(491) |
|
Tax on other comprehensive income (loss) |
— |
— |
22 |
122 |
144 |
|
Transferred to the income statement |
— |
— |
(112) |
— |
(112) |
|
Total comprehensive income (loss) for the period |
— |
— |
(104) |
626 |
522 |
|
Dividends to shareholders |
— |
— |
— |
(1,500) |
(1,500) |
|
Share-based payments |
— |
— |
— |
23 |
23 |
|
Other movements |
— |
— |
1 |
— |
1 |
|
At 30 September 2025 |
2,172 |
8,000 |
1,432 |
12,873 |
24,477 |
Group cash flow statement
|
|
Half year to 30 September | |
|
|
2026 |
2025 |
|
|
£m |
£m |
|
Cash flow from operating activities |
|
|
|
Profit before taxation from continuing operations |
1,376 |
1,286 |
|
Share of post-tax loss of associates and joint ventures |
— |
9 |
|
Net finance expense |
341 |
276 |
|
Operating profit |
1,717 |
1,571 |
|
Other non-cash charges1 |
(63) |
19 |
|
Impairment loss on remeasurement of disposal groups |
— |
5 |
|
Profit on disposal of property, plant and equipment and intangible assets |
(11) |
(31) |
|
Depreciation and amortisation, including impairment charges |
2,316 |
2,315 |
|
Decrease (increase) in inventories |
12 |
(28) |
|
Increase in trade and other receivables |
(238) |
(180) |
|
Decrease in contract assets |
74 |
65 |
|
Decrease in trade and other payables |
(441) |
(81) |
|
(Decrease) increase in contract liabilities |
(27) |
28 |
|
Decrease in other liabilities2 |
(725) |
(785) |
|
Decrease in provisions |
(46) |
(30) |
|
Cash generated from continuing operations |
2,568 |
2,868 |
|
Income taxes paid |
(13) |
(15) |
|
Cash outflows from discontinued operations |
(45) |
(88) |
|
Net cash inflow from operating activities |
2,510 |
2,765 |
|
Cash flow from investing activities |
|
|
|
Interest received |
31 |
54 |
|
Dividends received from joint ventures, associates and investments |
3 |
1 |
|
Proceeds on disposal of businesses |
— |
29 |
|
Increase in amounts owed by ultimate parent company |
(623) |
(606) |
|
Proceeds on disposal of current financial assets3 |
5,884 |
6,639 |
|
Purchases of current financial assets3 |
(5,483) |
(5,640) |
|
Proceeds from investment in preference shares in joint venture |
119 |
19 |
|
Proceeds on disposal of property, plant and equipment and intangible assets |
11 |
33 |
|
Purchases of property, plant and equipment and intangible assets4 |
(2,518) |
(2,533) |
|
Decrease in amounts owed by joint ventures |
92 |
46 |
|
Settlement of minimum guarantee liability with Sports joint venture |
(102) |
(118) |
|
Cash outflows from discontinued operations |
(42) |
(49) |
|
Net cash outflow from investing activities |
(2,628) |
(2,125) |
|
Cash flow from financing activities |
|
|
|
Interest paid |
(385) |
(437) |
|
Repayment of borrowings5 |
(37) |
(874) |
|
Proceeds from bank loans and bonds |
734 |
1,056 |
|
Payment of lease liabilities |
(352) |
(335) |
|
Cash flows from collateral received6 |
222 |
281 |
|
(Decrease) increase in amounts owed to joint ventures |
(12) |
16 |
|
Cash outflows from discontinued operations |
(35) |
(49) |
|
Net cash inflow (outflow) from financing activities |
135 |
(342) |
|
Net increase in cash and cash equivalents |
17 |
298 |
|
Opening cash and cash equivalents |
349 |
207 |
|
Net increase in cash and cash equivalents |
17 |
298 |
|
Effect of exchange rate changes |
(2) |
(7) |
|
Closing cash and cash equivalents7 |
364 |
498 |
- Non-cash items include a £(25)m gain on lease termination (H1 FY26: £nil), a £(21)m fair value gain on A and C preference shares held in the Sports JV (H1 FY26: £(1)m) and no impairment of the group’s equity interest in the Sports JV (H1 FY26: £23m impairment).
- Other liabilities includes pension deficit payments of £780m (H1 FY26: £789m)
- Financial assets primarily comprises investments in and redemptions of liquidity funds.
- Purchase of property, plant and equipment and intangible assets includes £2,282m of additions to property, plant and equipment, engineering stores and software (H1 FY26: £2,389m), £nil of spectrum additions (H1 FY26: £1m) and £236m of capital accrual movements (H1 FY26: £143m). Purchases of property, plant and equipment are presented net of £76m of cash flows from government grants (H1 FY26: £64m)
- Repayment of borrowings includes the impact of hedging.
- Cash flows in relation to collateral received relates to cash collateral held in respect of derivative financial assets with certain counterparties.
- Cash and cash equivalents are presented net of bank overdrafts of £10m (H1 FY26: £7m) and include £64m of cash held for sale (H1 FY26: £152m)
Notes to the condensed consolidated financial statements
1. Basis of preparation and accounting policies
Basis of preparation
These unaudited condensed consolidated financial statements (the "financial statements") comprise the financial results of British Telecommunications Limited for the half years to 30 September 2026 and 2025 together with the balance sheet at 31 March 2026. The financial statements for the half year to 30 September 2026 have been reviewed by the auditors and their review opinion is on page 23. The financial statements have been prepared in accordance with the Disclosure Guidance and Transparency Rules sourcebook (DTR) of the Financial Conduct Authority and with UK-adopted IAS 34 'Interim Financial Reporting'. The financial statements should be read in conjunction with the Annual Report 2026 which was prepared in accordance with UK-adopted International Financial Reporting Standards (IFRS).
Management have produced forecasts which confirm the group has adequate resources to continue in operation for a period of at least twelve months from the date of approval of this report, notwithstanding the net current liabilities position of £1,366m at 30 September 2026 (£1,283m net current liabilities at 31 March 2026). Consequently, the directors consider it appropriate to adopt the going concern basis of accounting in preparing the condensed consolidated financial statements for the half year to 30 September 2026. When reaching this conclusion, the directors took into account:
– The group’s overall financial position (including trading during the half year and ability to repay term debt as it matures without recourse to refinancing);
– Exposure to our principal risks and uncertainties; and
– The financial effect of a severe but plausible downside scenario
At 30 September 2026, the group had cash and cash equivalents of £364m (net of bank overdrafts) and current asset investments of £1,074m. The group also had access to committed borrowing facilities of £2.1bn (FY26: £2.1bn) which mature no earlier than January 2031, with an option to extend for one further year.
The information for the year ended 31 March 2026 does not constitute the group's statutory accounts as defined in section 434 of the Companies Act 2006. A copy of the statutory accounts for that year has been delivered to the Registrar of Companies. The auditor has reported on those accounts; their report (i) was unqualified, (ii) did not include a reference to any matters to which the auditor drew attention by way of emphasis without qualifying their report and (iii) did not contain a statement under section 498 (2) or (3) of the Companies Act 2006 in respect of the accounts for the year to 31 March 2026.
A reference to a year expressed as FY27 is to the financial year to 31 March 2027.
Accounting policy changes and restatements
Except for the adoption of new and amended standards described below, the financial statements have been prepared in accordance with the accounting policies as set out in the group's financial statements for the year to 31 March 2026 and have been prepared under the historical cost convention as modified by the revaluation of financial assets and liabilities (including derivative financial instruments) at fair value.
New and amended accounting standards effective during the year
The following are the amendments to IFRS standards effective during the year. None of them have a material impact on the financial statements of the group.
– Amendments to IFRS 9 and IFRS 7 – Classification and Measurement of Financial Instruments
– Amendments to IFRS 9 and IFRS 7 – Contracts Referencing Nature-dependent Electricity; and
– Annual Improvements to IFRS Accounting Standards – Volume 11
IFRS Interpretations Committee agenda decisions
The IFRS Interpretations Committee (IFRIC) periodically issues agenda decisions which explain and clarify how to apply the principles and requirements of IFRS. Agenda decisions are authoritative and may require the group to revise accounting policies or practice to align with the interpretations set out in the decision.
We regularly review IFRIC updates and assess the impact of agenda decisions. No agenda decisions finalised in the half year to 30 September 2026 have been assessed as having a material impact on the group.
New and amended accounting standards issued but not yet effective
The IASB issued IFRS 20 Regulatory Assets and Regulatory Liabilities in May 2026. The standard establishes comprehensive principles for the recognition, measurement, presentation and disclosure of regulatory assets, regulatory liabilities, regulatory income and regulatory expense arising from qualifying regulatory agreements. It will be effective for BT for the period beginning 1 April 2029, subject to the UK endorsement process. The group is currently assessing the impact of the new standard.
The IASB issued IFRS 18 Presentation and Disclosure in Financial Statements, which replaces IAS 1 Presentation of Financial Statements. The group has not early adopted IFRS 18 and is currently assessing the new requirements, with the main impacts expected on the presentation of the consolidated income statement and the disclosure of management-defined performance measures. The group is progressing implementation activities ahead of applying IFRS 18 in its interim financial statements for the six months ending 30 September 2027 and its annual financial statements for the year ending 31 March 2028.
Re-presentation of balance sheet and operating costs
Following a review of balance sheet presentation, the group has revised the presentation of certain subtotals in the balance sheet. The subtotal 'Total assets less current liabilities' has been removed and replaced with a new subtotal, 'Net assets'. Additional subtotals, including 'Total assets' and 'Total liabilities', have been introduced to provide a clearer and more structured presentation of the balance sheet.
As part of this review, the group has also revised the presentation of certain deferred tax balances. Deferred tax related to pension obligations, which was previously presented within deferred tax assets, is now presented net of deferred tax liabilities where the relevant offsetting criteria under IAS 12 are met.
These changes affect presentation only and have no impact on the group's net assets, profit for the period or cash flows. Comparative amounts have been re-presented on a consistent basis.
Comparative operating costs have been re-presented to reflect revised classifications between operating cost categories, with no impact on total operating costs, adjusted EBITDA or operating profit.
International joint venture
In June 2026, BT and Verizon Communications Inc. (“Verizon”) entered into an agreement to combine their respective international enterprise operations into a 50:50 joint venture. BT will contribute the group's International unit to the joint venture. The transaction is consistent with the group's strategy to fully focus on UK connectivity and follows the active programme initiated in 2025 to optimise its non-core global operations.
The group classified the remaining operations of the group's International unit as held for sale at 30 June 2026, when management concluded that the carrying amount of the business would be recovered principally through the transaction rather than through continuing use and that completion of the transaction was highly probable.
As the International unit represents a major separate line of business, its results have been presented as discontinued operations for all periods presented in the consolidated income statement and statement of comprehensive income. Cash flows attributable to discontinued operations have also been presented separately in the cash flow statement.
2. Operating results – by customer-facing unit
|
Half year to 30 September 2026 | |||||
|
|
Consumer |
Business |
Openreach |
Other |
Total continuing operations |
|
|
£m |
£m |
£m |
£m |
£m |
|
Segment revenue |
4,783 |
2,574 |
3,160 |
6 |
10,523 |
|
Internal revenue |
(20) |
(113) |
(1,640) |
— |
(1,773) |
|
Adjusted1 revenue from external customers |
4,763 |
2,461 |
1,520 |
6 |
8,750 |
|
Adjusted EBITDA1,2 |
1,255 |
601 |
2,238 |
4 |
4,098 |
|
Depreciation and amortisation |
(752) |
(401) |
(1,112) |
(50) |
(2,315) |
|
Adjusted1 operating profit (loss) |
503 |
200 |
1,126 |
(46) |
1,783 |
|
Specific items (note 5) |
|
|
|
|
(66) |
|
Operating profit |
|
|
|
|
1,717 |
|
|
|
|
|
|
|
|
Half year to 30 September 2025 (re-presented3) | |||||
|
Segment revenue |
4,684 |
2,589 |
3,131 |
6 |
10,410 |
|
Internal revenue |
(20) |
(108) |
(1,586) |
— |
(1,714) |
|
Adjusted1 revenue from external customers |
4,664 |
2,481 |
1,545 |
6 |
8,696 |
|
Adjusted EBITDA1,2 |
1,274 |
647 |
2,148 |
(10) |
4,059 |
|
Depreciation and amortisation |
(849) |
(372) |
(1,053) |
(41) |
(2,315) |
|
Adjusted1 operating profit (loss) |
425 |
275 |
1,095 |
(51) |
1,744 |
|
Specific items (note 5) |
|
|
|
|
(173) |
|
Operating profit |
|
|
|
|
1,571 |
- See Glossary on page 24.
- See Additional Information on page 24 for the reconciliation of adjusted EBITDA.
- H1 FY26 comparative information is re‑presented on a continuing basis following announcement of our agreement with Verizon to create a combined global business. See note 10 'Discontinued operations and assets and liabilities classified as held for sale' for further information.
3. Operating results - disaggregation of revenue
|
Half year to 30 September 2026 | ||||||
|
|
Consumer |
Business |
Openreach |
Other |
Internal revenue |
Total |
|
|
£m |
£m |
£m |
£m |
£m |
£m |
|
ICT and managed networks |
— |
553 |
— |
— |
(13) |
540 |
|
Fixed access subscriptions |
1,981 |
999 |
— |
— |
(14) |
2,966 |
|
Mobile subscriptions |
1,831 |
424 |
— |
— |
(11) |
2,244 |
|
Other services |
18 |
371 |
107 |
6 |
(130) |
372 |
|
Equipment revenue |
844 |
226 |
— |
— |
(6) |
1,064 |
|
Revenue from contracts with customers |
4,674 |
2,573 |
107 |
6 |
(174) |
7,186 |
|
Lease revenue2 |
109 |
1 |
3,053 |
— |
(1,599) |
1,564 |
|
Revenue before specific items1 |
4,783 |
2,574 |
3,160 |
6 |
(1,773) |
8,750 |
|
Specific items (note 5) |
|
|
|
|
|
3 |
|
Total revenue from continuing operations3 |
|
|
|
8,753 | ||
|
|
|
|
|
|
|
|
|
Half year to 30 September 2025 (re-presented4) | ||||||
|
ICT and managed networks |
— |
558 |
— |
— |
(5) |
553 |
|
Fixed access subscriptions |
2,042 |
1,021 |
— |
— |
(15) |
3,048 |
|
Mobile subscriptions |
1,774 |
419 |
— |
— |
(22) |
2,171 |
|
Other services |
9 |
371 |
107 |
6 |
(137) |
356 |
|
Equipment revenue |
751 |
216 |
— |
— |
(2) |
965 |
|
Revenue from contracts with customers |
4,576 |
2,585 |
107 |
6 |
(181) |
7,093 |
|
Lease revenue2 |
108 |
4 |
3,024 |
— |
(1,533) |
1,603 |
|
Revenue before specific items1 |
4,684 |
2,589 |
3,131 |
6 |
(1,714) |
8,696 |
|
Specific items (note 5) |
|
|
|
|
|
4 |
|
Total revenue from continuing operations3 |
|
|
|
8,700 | ||
- See Glossary on page 24.
- Lease revenue includes income from Openreach's fixed access subscription services.
- We have further disaggregated the revenue presented here to derive the adjusted service revenue of £7,685m (H1 FY26: £7,726m). See our adjusted service revenue reconciliation in Additional Information on page 24.
- H1 FY26 comparative information is re‑presented on a continuing basis following announcement of our agreement with Verizon to create a combined global business. See note 10 'Discontinued operations and assets and liabilities classified as held for sale' for further information.
4. Operating costs
|
|
Half year to 30 September | |
|
|
2026 |
2025 (re-presented1) |
|
|
£m |
£m |
|
Operating costs by nature |
|
|
|
Wages and salaries |
1,599 |
1,673 |
|
Social security costs |
197 |
215 |
|
Other pension costs |
136 |
143 |
|
Share-based payment expense |
18 |
19 |
|
Total staff costs |
1,950 |
2,050 |
|
Capitalised direct labour2 |
(672) |
(700) |
|
Net staff costs |
1,278 |
1,350 |
|
Indirect labour costs2 |
588 |
597 |
|
Capitalised indirect labour2 |
(390) |
(407) |
|
Net indirect labour costs |
198 |
190 |
|
Net labour costs |
1,476 |
1,540 |
|
Product costs |
1,317 |
1,224 |
|
External sales commissions |
224 |
225 |
|
Payments to telecommunications operators |
232 |
267 |
|
Property and energy costs |
604 |
601 |
|
Network operating and IT costs |
450 |
453 |
|
Provision and installation |
76 |
79 |
|
Marketing and sales |
154 |
118 |
|
Net impairment losses on trade receivables and contract assets |
77 |
80 |
|
Other operating costs2 |
213 |
202 |
|
Other operating income |
(171) |
(152) |
|
Depreciation and amortisation, including impairment charges |
2,315 |
2,315 |
|
Total continuing operating costs before specific items |
6,967 |
6,952 |
|
Specific items (note 5) |
69 |
177 |
|
Total continuing operating costs |
7,036 |
7,129 |
Depreciation and amortisation, which includes impairment charges, is analysed as follows:
|
|
Half year to 30 September | |
|
|
2026 |
2025 (re-presented1) |
|
|
£m |
£m |
|
Depreciation and amortisation before impairment charges |
|
|
|
Intangible assets |
574 |
621 |
|
Property, plant and equipment |
1,465 |
1,415 |
|
Right-of-use assets |
273 |
271 |
|
|
|
|
|
Impairment charges |
|
|
|
Intangible assets |
1 |
3 |
|
Property, plant and equipment |
— |
2 |
|
Right-of-use assets |
2 |
3 |
|
Total continuing depreciation and amortisation before specific items |
2,315 |
2,315 |
|
Impairment charges classified as specific items (note 5) |
|
|
|
Intangible assets |
— |
— |
|
Property, plant and equipment |
— |
— |
|
Right-of-use assets |
1 |
— |
|
Total continuing depreciation and amortisation |
2,316 |
2,315 |
- H1 FY26 comparative information is re‑presented on a continuing basis following announcement of our agreement with Verizon to create a combined global business. See note 10 'Discontinued operations and assets and liabilities classified as held for sale' for further information
- Comparative amounts have also been re-presented to revise the classification of certain operating costs and to provide a basis of presentation consistent with the current period. Before the separate re-presentation for discontinued operations, the classification adjustments comprised £12m from capitalised direct labour, £31m from indirect labour costs, £30m from capitalised indirect labour and £22m from network operating and IT costs, with a corresponding £95m increase in other operating costs. These changes are within operating costs and have no impact on total operating costs, adjusted EBITDA or operating profit.
5. Specific items
The following charges and credits in H1 FY27 and H1 FY26 were recognised as specific items: significant business restructuring programmes including the current group-wide cost transformation and modernisation programme, disposals of businesses and investments, charges or credits relating to retrospective regulatory matters, litigation matters, impairment on remeasurement of disposal groups to be held for sale, asset impairment charges, net interest on our pension obligation, and the impact of remeasuring deferred tax balances. Movements relating to the sports joint venture (Sports JV) with Warner Bros. Discovery (WBD), such as fair value gains or losses on the A and C preference shares or impairment charges on the equity-accounted investment are classified as specific items, refer to note 9.
|
|
|
Half year to 30 September | |
|
|
|
2026 |
2025 (re-presented1) |
|
|
Ref. |
£m |
£m |
|
Revenue |
|
|
|
|
Retrospective regulatory matters |
A |
(3) |
(4) |
|
Specific revenue |
|
(3) |
(4) |
|
Operating costs |
|
|
|
|
Restructuring charges |
B |
85 |
121 |
|
Sports JV – related items |
C |
(17) |
22 |
|
Divestment-related items |
F |
— |
(1) |
|
Litigation matters |
F |
— |
30 |
|
Impairment loss on remeasurement of disposal groups |
F |
— |
5 |
|
Specific operating costs before depreciation and amortisation |
|
68 |
177 |
|
Asset impairment charges |
F |
1 |
— |
|
Specific operating costs |
|
69 |
177 |
|
Impact on operating profit |
|
66 |
173 |
|
Net finance expense |
|
|
|
|
Interest expense on retirement benefit obligation |
D |
100 |
93 |
|
Specific net finance expense |
|
100 |
93 |
|
Net specific items charge before tax |
|
166 |
266 |
|
Tax credit on specific items above |
E |
(46) |
(61) |
|
Net specific items charge after tax from continuing operations |
|
120 |
205 |
|
Net specific items after tax from discontinued operations |
G |
40 |
54 |
|
Net specific items after tax |
|
160 |
259 |
- H1 FY26 comparative information is re‑presented on a continuing basis following announcement of our agreement with Verizon to create a combined global business. See note 10 'Discontinued operations and assets and liabilities classified as held for sale' for further information
A. Retrospective regulatory matters
We recognised a £3m net credit in relation to historical regulatory matters (H1 FY26: net credit of £4m). These items represent movements in provisions relating to various matters.
B. Restructuring charges
Following the announcement in June of our agreement with Verizon to create a combined global business, the International CFU is now reported as a discontinued operation. The continuing group’s transformation programme targets £3.5bn of gross annualised cost savings at a total cost to achieve of £1.2bn compared with £3.7bn and £1.4bn respectively including International, covering the period from programme launch in May 2024 to the end of FY30. The continuing group's transformation programme incorporated the benefits and costs of the final FY25 year of the previous May 2020 programme.
In H1 FY27, the programme for the continuing group delivered estimated gross annualised cost savings of £312m with a cost to achieve of £85m (H1 FY26: £121m), these restructuring charges mainly comprised leaver, third-party and property-related costs. Net restructuring cash outflows were £148m (H1 FY26: £182m). Since launch, excluding International, it has delivered £1.7bn of gross annualised cost savings at a cost to achieve of £0.8bn. The expected cash cost to achieve until FY30 is £1.2bn, of which £0.8bn has been incurred to date, including £0.1bn in H1 FY27.
We do not consider the remaining estimated restructuring costs of £0.4bn, included within the £1.2bn referenced here, to constitute a sufficiently-detailed formal announcement of a restructuring programme that would trigger a provision under IAS 37. Costs are provided for when the IAS 37 recognition criteria are met.
C. Sports JV – related items
We have recorded a net gain of £17m (H1 FY26: net charge of £22m), comprising a fair value gain of £21m (H1 FY26: £1m) on the A and C preference shares in the Sports JV and other transaction-related costs of £4m (H1 FY26: £nil). In H1 FY26 we recognised an impairment loss of £23m on the ordinary equity interest in the Sports JV. Refer to note 9 for further details.
D. Interest expense on retirement benefit obligation
During the half year we incurred £100m (H1 FY26: £93m) of interest costs in relation to our defined benefit pension obligations.
E. Tax on specific items
A tax credit of £46m was recognised in relation to specific items (H1 FY26: £61m).
F. Other specific items
In H1 FY27 we recognised the following within specifics:
– £1m impairment charge in relation to property rationalisation programmes, part of our group-wide cost transformation and modernisation programme
In H1 FY26 we recognised the following within specifics:
– £1m credit relating to divestment-related activity associated with the continuing group
– £30m charge associated with litigation claims brought against the group
– £5m impairment charge for the remeasurement of disposal groups. Assets classified as held for sale under IFRS 5 are measured at the lower of their carrying amount and fair value less costs of disposal, resulting in an impairment loss
G. Specific items after tax relating to discontinued operations
In relation to International, we incurred £19m of divestment-related costs (H1 FY26: £20m), £17m of restructuring charges (H1 FY26: £13m) and £4m of interest costs in relation to our defined benefit pension obligations (H1 FY26: £3m) during the half year. In H1 FY26 we recognised an impairment loss on remeasurement of disposal groups of £22m. Tax of £nil (H1 FY26: £4m credit) has been recognised in relation to the discontinued specific items.
6. Pensions
|
|
30 September 2026 |
31 March 2026 |
|
|
£bn |
£bn |
|
IAS 19 liabilities – BTPS |
(33.4) |
(35.1) |
|
Assets – BTPS |
30.1 |
30.9 |
|
Other schemes |
0.1 |
— |
|
Total IAS 19 deficit, gross of tax1,2 |
(3.2) |
(4.2) |
|
Total IAS 19 deficit, net of tax |
(2.1) |
(3.1) |
|
|
|
|
|
Discount rate (nominal) |
6.50 % |
6.00 % |
|
Future inflation – average increase in RPI (p.a.) |
3.25 % |
3.25 % |
|
Future inflation – average increase in CPI (p.a.) |
2.90 % |
2.90 % |
- Of which £(3.3)bn relates to schemes in deficit (FY26: £(4.4)bn) and £0.1bn relates to schemes in surplus (FY26: £0.2bn).
- The 31 March 2026 deficit figure includes £0.2bn of IAS 19 pension deficit that as at 30 September 2026 has been included within liabilities held for sale. See note 10 'Discontinued operations and assets and liabilities classified as held for sale' for further information.
The IAS 19 pension deficit decreased to £3.2bn at 30 September 2026 from £4.2bn at 31 March 2026 predominantly as a result of the payment of scheduled contributions over the period.
7. Financial instruments and risk management
Fair value of financial assets and liabilities measured at amortised cost
At 30 September 2026, the fair value of listed bonds was £17,958m (31 March 2026: £17,778m) and the carrying value was £18,865m (31 March 2026: £18,303m). The increase was primarily attributable to newly issued bonds, partially offset by favourable foreign exchange movements.
The fair value of all other financial assets and liabilities continued to approximate their carrying amounts.
The group’s activities expose it to a variety of financial risks: market risk (including interest rate risk, foreign exchange risk and energy price risk); liquidity risk; and credit risk. There have been no changes to the risk management policies which cover these risks since 31 March 2026.
Current trade and other payables balance of £4,449m (31 March 2026: £5,877m) includes:
– £215m (31 March 2026: £271m) of trade payables in a supply chain financing programme used with a limited number of suppliers to extend short payment terms to a more typical payment term; and
– £237m (31 March 2026: £257m) of trade payables in a separate supply chain financing programme that allows suppliers the opportunity to receive funding earlier than the invoice due date. Financial institutions are used to support this programme, but we continue to recognise the underlying payables as we continue to cash settle the supplier invoices in accordance with their terms
Fair value estimation
Financial instruments measured at fair value are classified within a three-level fair value hierarchy, which remained unchanged since year-end.
Level 2 balances are the fair values of the group’s outstanding derivative financial assets and liabilities which were estimated using discounted cash flow models and market rates of interest and foreign exchange at the balance sheet date.
Level 3 balances comprise the following financial instruments classified as fair value through profit or loss and fair value through other comprehensive income:
– A and C preference shares in the Sports JV, see note 9 for more details
– Investments in a number of private companies. If specific market data is not available, these investments are held at cost, adjusted as necessary for impairments, which approximates to fair value
– Derivative energy contracts, estimated using discounted cash flow models and a mix of assumptions some of which are not observable in the market. The key inputs used in the internal valuation model are the developer’s P90 generation volume forecast (where the output is forecasted to be exceeded 90% of the time over the contract’s lifetime), publicly available electricity price data, inflation rates, and the group’s weighted average cost of capital. A 10% increase or decrease in the significant non-observable inputs would increase or decrease the fair value of the contracts by approximately £0.3m. During the period, no new energy contracts were signed or terminated, the fair value movement was driven by monthly settlements and market movements
|
|
Level 1 |
Level 2 |
Level 3 |
Total held at fair value |
|
30 September 2026 |
£m |
£m |
£m |
£m |
|
Preference shares in joint venture |
|
|
|
|
|
Fair value through profit or loss |
— |
— |
184 |
184 |
|
Investments |
|
|
|
|
|
Fair value through other comprehensive income |
— |
— |
19 |
19 |
|
Derivative assets |
|
|
|
|
|
Designated in a cash flow hedge |
— |
618 |
21 |
639 |
|
Designated in a fair value hedge |
— |
3 |
— |
3 |
|
Fair value through profit or loss |
— |
67 |
— |
67 |
|
Total assets |
— |
688 |
224 |
912 |
|
Derivative liabilities |
|
|
|
|
|
Designated in a cash flow hedge |
— |
451 |
14 |
465 |
|
Designated in a fair value hedge |
— |
151 |
— |
151 |
|
Fair value through profit or loss |
— |
43 |
13 |
56 |
|
Total liabilities |
— |
645 |
27 |
672 |
|
|
Level 1 |
Level 2 |
Level 3 |
Total held at fair value |
|
31 March 2026 |
£m |
£m |
£m |
£m |
|
Preference shares in joint venture |
|
|
|
|
|
Fair value through profit or loss |
— |
— |
282 |
282 |
|
Investments |
|
|
|
|
|
Fair value through other comprehensive income |
— |
— |
20 |
20 |
|
Derivative assets |
|
|
|
|
|
Designated in a cash flow hedge |
— |
835 |
8 |
843 |
|
Designated in a fair value hedge |
— |
5 |
— |
5 |
|
Fair value through profit or loss |
— |
50 |
— |
50 |
|
Total assets |
— |
890 |
310 |
1,200 |
|
Derivative liabilities |
|
|
|
|
|
Designated in a cash flow hedge |
— |
290 |
36 |
326 |
|
Designated in a fair value hedge |
— |
22 |
— |
22 |
|
Fair value through profit or loss |
— |
37 |
13 |
50 |
|
Total liabilities |
— |
349 |
49 |
398 |
A net loss of £98m (H1 FY26: net loss of £40m) and a net gain of £34m (H1 FY26: net gain of £26m) have been recognised in the income statement and other comprehensive income respectively in respect of fair value movements on level 3 instruments during the half year ended 30 September 2026. Of the £98m net loss (H1 FY26: £40m net loss) recognised in the income statement, £nil (H1 FY26: £22m net loss) is in respect of recycling from the cash flow hedge reserve. There were no significant changes in the measurement and valuation techniques, or transfers between the levels of the fair value hierarchy during the period.
8. Financial commitments
Financial commitments as at 30 September 2026 include capital commitments of £987m (31 March 2026: £1,025m).
9. Joint ventures and associates
|
|
30 September 2026 |
31 March 2026 |
|
|
£m |
£m |
|
Interest in joint ventures |
2 |
2 |
|
Interest in associates |
1 |
2 |
|
Total |
3 |
4 |
No share of post-tax profit or loss or other comprehensive income from associates and joint ventures was recognised in the half year to 30 September 2026.
Sports JV
Ordinary equity shares
The carrying amount of our equity-accounted interest in the Sports JV remained at nil at 30 September 2026 (31 March 2026: nil). Accordingly, no further share of loss was recognised during the period. Our unrecognised share of the Sports JV’s total comprehensive losses, which is tracked off-balance sheet, was £24m at 30 September 2026 (31 March 2026: £23m).
Under the terms of the joint venture arrangements, WBD continues to have a call option in respect of BT’s 50% equity interest in the Sports JV. The contractual processes associated with that option remain ongoing and the option therefore remains capable of exercise in accordance with its terms.
The Sports JV has been classified as a joint venture since completion of the transaction with WBD in FY23. Determining whether the call option provides WBD with a substantive right to unilaterally control the key decisions requires judgement and consideration of a variety of factors, including whether there are any barriers to WBD completing the acquisition. Having considered all relevant facts and circumstances, we concluded that BT retained joint control of the Sports JV as at 30 September 2026 and that classification as a joint venture remained appropriate.
Preference shares
During the half year to 30 September 2026, BT’s earn-out entitlement ended and the economic interests of BT and WBD in the Sports JV were realigned to 50:50. Following the settlement of the final earn-out payment, the carrying amount of the A preference shares reduced to £nil at 30 September 2026 (31 March 2026: £107m). The C preference shares had a carrying amount of £184m (31 March 2026: £175m), reflecting the present value of the amount expected to be received by BT on completion of the economic realignment. Settlement is expected during the second half of FY27. Overall, a net £21m fair value gain was recognised on the A and C preference shares during the period (H1 FY26: net £1m fair value gain).
10. Discontinued operations and assets and liabilities classified as held for sale
We classify non-current assets or a group of assets and associated liabilities, together forming a disposal group, as 'held for sale' when their carrying amount will be recovered principally through disposal rather than continuing use and the sale is highly probable. A sale is considered to be highly probable when management are committed to a plan to sell the asset or disposal group and completion is expected within one year. We measure non-current assets or disposal groups classified as held for sale at the lower of their carrying amount and fair value less costs of disposal. Intangible assets, property, plant and equipment and right-of-use assets classified as held for sale are not depreciated or amortised.
Upon completion of a divestment, we recognise a profit or loss on disposal calculated as the difference between (i) the aggregate of the fair value of the consideration received and the fair value of any retained interest less costs incurred in disposing of the asset or disposal group, and (ii) the carrying amount of the asset or disposal group (including goodwill). The profit or loss on disposal is recognised as a specific item, see note 5.
Where non-current assets or disposal groups held for sale represent a separate major line of business or geographical area of operations, or form part of a single coordinated plan to dispose of one, the group classifies the disposal group as a discontinued operation and re-presents comparative periods on the same basis.
The post-tax results of discontinued operations are presented separately from continuing operations as a single amount in the consolidated income statement. The cash flows of discontinued operations are presented separately from continuing operations in the consolidated cash flow statement. Discontinued operations are also excluded from segment reporting. Unless otherwise stated, all other notes to the consolidated financial statements include only continuing operations, except for comparative balance sheet information.
Transactions between continuing and discontinued operations are eliminated in full in the consolidated income statement. However, where the group expects commercial relationships with the discontinued operation to continue after disposal, the effects of those transactions are reflected in continuing operations, with an equal and opposite charge or credit recognised in discontinued operations. As a result, there is no net impact on the group's profit for the period.
International unit
In June 2026, BT and Verizon Communications Inc. (“Verizon”) entered into an agreement to combine their respective international enterprise operations into a 50:50 joint venture. BT will contribute the remaining operations of the group's International unit to the joint venture. The transaction is consistent with the group's strategy to focus fully on UK connectivity and follows the active programme initiated in 2025 to optimise its non-core International activities.
Management has concluded that the remaining international operations met the criteria to be classified as held for sale at 30 June 2026 and that the international unit as a whole met the criteria to be presented as a discontinued operation. Accordingly, the results of the International unit are presented as a discontinued operation and comparative periods have been re-presented on the same basis. The associated assets and liabilities have been presented as held for sale.
The discontinued operations comparative information includes five businesses that previously formed part of the International unit which were classified as held for sale in the prior year and were subsequently disposed of during FY26. Those disposals, together with the proposed contribution of the remaining International operations to the joint venture, form part of a single coordinated plan to dispose of the group’s non-core International activities.
Impairment on remeasurement of disposal groups held for sale
On classification of the disposal groups as held for sale, we remeasured the disposal groups to the lower of their carrying amount and fair value less costs of disposal. This measurement is reassessed at each reporting date while the disposal groups remain classified as held for sale, with further impairment recognised where applicable. No impairment has been recognised during the half year to 30 September 2026 in respect of the International operations to be contributed to the joint venture. During H1 FY26 an impairment of £22m was recognised in respect of the previously disposed International businesses described above. The prior period impairment was recognised as a specific item and applied to reduce the carrying amounts of intangible assets, property, plant and equipment and right-of-use assets within the affected disposal groups (see note 5).
Analysis of discontinued operations
The results of the International unit are presented separately from continuing operations for all periods presented in the consolidated income statement and statement of comprehensive income.
The summary income statements for the half years ended 30 September 2026 and 30 September 2025 are set out below.
|
|
Before specific items ('Adjusted') |
|
Specific items |
|
Total (Reported) | |||
|
|
2026 |
20251 |
|
2026 |
20251 |
|
2026 |
20251 |
|
£m |
£m |
|
£m |
£m |
|
£m |
£m | |
|
Revenue |
923 |
1,110 |
|
— |
— |
|
923 |
1,110 |
|
Internal revenue |
(1) |
— |
|
— |
— |
|
(1) |
— |
|
Revenue from external customers |
922 |
1,110 |
|
— |
— |
|
922 |
1,110 |
|
Operating costs |
(905) |
(1,146) |
|
(36) |
(55) |
|
(941) |
(1,201) |
|
Operating profit (loss) |
17 |
(36) |
|
(36) |
(55) |
|
(19) |
(91) |
|
Finance expense |
(1) |
(3) |
|
(4) |
(3) |
|
(5) |
(6) |
|
Finance income |
4 |
3 |
|
— |
— |
|
4 |
3 |
|
Net finance income (expense) |
3 |
— |
|
(4) |
(3) |
|
(1) |
(3) |
|
Share of post-tax profit (loss) of associates and joint ventures |
— |
— |
|
— |
— |
|
— |
— |
|
Profit (loss) before tax |
20 |
(36) |
|
(40) |
(58) |
|
(20) |
(94) |
|
Taxation |
(6) |
7 |
|
— |
4 |
|
(6) |
11 |
|
Profit (loss) for the period from discontinued operations |
14 |
(29) |
|
(40) |
(54) |
|
(26) |
(83) |
- Revenue of £150m and operating profit of £30m relating to disposals completed during FY26, which formed part of the International business, have been re-presented within discontinued operations in the FY26 comparatives
Assets and liabilities held for sale
The assets and liabilities classified as held for sale at the balance sheet date relate to the international operations to be contributed to the joint venture with Verizon and comprise the following:
|
|
30 September 2026 |
|
|
£m |
|
Assets |
|
|
Goodwill and other intangible assets |
607 |
|
Property, plant and equipment |
140 |
|
Right-of-use assets |
123 |
|
Trade and other receivables |
904 |
|
Deferred tax assets |
69 |
|
Cash and cash equivalents |
64 |
|
Assets held for sale |
1,907 |
|
|
|
|
Liabilities |
|
|
Trade and other payables |
770 |
|
Lease liabilities |
114 |
|
Retirement benefit obligations |
173 |
|
Provisions |
46 |
|
Liabilities held for sale |
1,103 |
|
|
|
There were no assets and liabilities held for sale at 31 March 2026.
Divestments
There were no disposals during H1 FY27. In H1 FY26 BT Communications Ireland Ltd was disposed with no gain or loss recognised on disposal.
11. Related party transactions
British Telecommunications Limited related parties include joint ventures, associates, investments and key management personnel.
Associates and joint ventures related parties include the Sports JV with Warner Bros Discovery (see note 9). Sales of services to the Sports JV during H1 FY27 were £1m (H1 FY26: £2m) and purchases from the Sports JV were £155m (H1 FY26: £160m) excluding £102m (H1 FY26: £118m) additional payments made to settle the minimum guarantee liability. The amount receivable from the Sports JV as at 30 September 2026 was £nil (31 March 2026: £nil) and the amount payable to the Sports JV was £49m (31 March 2026: £94m).
Following the economic realignment, the previous £200m Revolving Credit Facility (RCF) provided by the group was replaced by a revised £200m facility provided equally by the group and Warner Bros. Discovery, with each shareholder providing £100m. Amounts drawn under the facility accrue interest at a market reference rate. At 30 September 2026, the amount outstanding under the group's share of the facility was £nil (31 March 2026: £91m under the previous RCF). The previous cash pooling arrangement with the Sports JV also ceased following the economic realignment and consequently there is no loan payable to the Sports JV at 30 September 2026 (31 March 2026: £10m).
The Sports JV has a foreign exchange hedging arrangement with the group to secure euros required to meet its commitments to certain sports rights holders; the group has external forward contracts in place to purchase the euros at an agreed sterling rate in order to mitigate its exposure to exchange risk. The group holds a £9m (31 March 2026: £9m) derivative liability in respect of forward contracts provided to the Sports JV.
British Telecommunications Limited and certain of its subsidiaries act as a funder and deposit taker for cash related transactions for both its parent and ultimate parent company. The loan arrangements described below with these companies reflect this. Cash transactions usually arise where the parent and ultimate parent company are required to meet their external payment obligations or receive amounts from third parties. These principally relate to the payment of dividends, the buyback of shares, the exercise of share options and the issuance of ordinary shares. Transactions between the ultimate parent company, parent company and the group are settled on both a cash and non-cash basis through these loan accounts depending on the nature of the transaction.
A dividend of £1,500m was declared and settled with the parent company (FY26: £1,500m).
A summary of the balances with the parent and ultimate parent companies and the finance income or expense arising in respect of these balances is shown below:
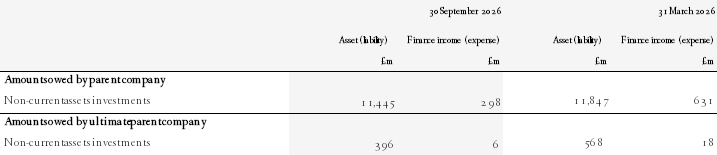
12. Contingent liabilities and legal proceedings
There have been no material changes in contingent liabilities, legal proceedings or regulatory matters since those reported in our Annual Report 2026.
13. Post balance sheet events
Acquisition of TalkTalk
On 5 October 2026, the group acquired 100% of the equity interests in TalkTalk Telecommunications Limited and PlatformX Communications Limited, (“TalkTalk businesses”), which operate TalkTalk’s consumer and wholesale businesses, respectively. The businesses were acquired out of administration on a debt-free basis.
Following the acquisition, the Competition and Markets Authority imposed a Pre-emptive Action Order (“PAO”) requiring the TalkTalk businesses to remain operationally separate from the remainder of BT and to be independently managed while the regulatory review is completed. These restrictions mean that the group does not currently control the acquired TalkTalk businesses. The equity interests in the TalkTalk businesses will therefore be accounted for as financial assets and the TalkTalk businesses will not be consolidated while the PAO restrictions remain in place.
The estimated total cash impact of the transaction in FY27 is approximately £400 million, comprising both consideration and other cash impacts, including funding that the group has committed to provide to the TalkTalk businesses together with transaction and administration costs and other related cash impacts.
The acquisition of the TalkTalk businesses occurred after 30 September 2026 and is a non-adjusting post balance sheet event. Accordingly, no amounts relating to this transaction have been recognised in these condensed consolidated financial statements.
The group will consolidate TalkTalk Telecommunications Limited and PlatformX Communications Limited only if control is obtained. The timing and financial effect of any future consolidation cannot currently be determined while the regulatory review is ongoing.
Pensions triennial agreement
Following the completion of the triennial funding valuation of the BT Pension Scheme (BTPS), an agreement has been reached with the BTPS Trustee. The funding deficit reduced to £2.7bn at June 2026. Under the agreement, scheduled contributions will be substantially replaced by the issuance of zero-coupon bonds, which is expected to substantially close the funding deficit and reduce the IAS 19 deficit. BT will also provide additional funding with a net present value of £0.3bn to ensure that the BTPS remains on track to be fully funded by 2030. These measures will substantially reduce the funding deficit to around £0.3bn. A wider package has also been agreed, including enhanced dividend headroom. See separate release published on 5 November 2026 for full details.
Bond issuance
On 10 November 2026, BT, through BT Finance plc, issued a €900m senior bond due on 17 November 2035 under its European Medium Term Note programme, with a coupon of 4.625%.
On 13 November, BT, through BT Finance plc, issued five tranches of zero-coupon bonds totalling £2.68bn, maturing between April 2027 to September 2033. The bonds were issued to the BT-BTPS co-investment vehicle, as announced as part of the 30 June 2026 triennial funding valuation.
RESPONSIBILITY STATEMENT
We confirm that to the best of our knowledge:
– the condensed set of financial statements has been prepared in accordance with UK-adopted International Accounting Standard 34 'Interim Financial Reporting'; and
– the interim management report includes a fair review of the information required by DTR 4.2.7R (the indication of important events and their impact during the first six months and description of principal risks and uncertainties for the remaining six months of the year).
By order of the Board
Patricia Cobian
Director
16 November 2026
INDEPENDENT REVIEW REPORT TO BRITISH TELECOMMUNICATIONS LIMITED
Conclusion
We have been engaged by British Telecommunications Limited (“the Company”) to review the condensed set of consolidated financial statements in the half-yearly financial report for the six months ended 30 September 2026 which comprises the Group Income Statement, Group statement of comprehensive income, Group balance sheet, Group statement of changes in equity, Group cash flow statement and the related explanatory notes.
Based on our review, nothing has come to our attention that causes us to believe that the condensed set of financial statements in the half-yearly financial report for the six months ended 30 September 2026 is not prepared, in all material respects, in accordance with IAS 34 Interim Financial Reporting as adopted for use in the UK and the Disclosure Guidance and Transparency Rules (“the DTR”) of the UK’s Financial Conduct Authority (“the UK FCA”).
Basis for conclusion
We conducted our review in accordance with International Standard on Review Engagements (UK) 2410 Review of Interim Financial Information Performed by the Independent Auditor of the Entity (“ISRE (UK) 2410”) issued for use in the UK. A review of interim financial information consists of making enquiries, primarily of persons responsible for financial and accounting matters, and applying analytical and other review procedures. We read the other information contained in the half-yearly financial report and consider whether it contains any apparent misstatements or material inconsistencies with the information in the condensed set of financial statements.
A review is substantially less in scope than an audit conducted in accordance with International Standards on Auditing (UK) and consequently does not enable us to obtain assurance that we would become aware of all significant matters that might be identified in an audit. Accordingly, we do not express an audit opinion.
Conclusions relating to going concern
Based on our review procedures, which are less extensive than those performed in an audit as described in the Basis for conclusion section of this report, nothing has come to our attention that causes us to believe that the directors have inappropriately adopted the going concern basis of accounting, or that the directors have identified material uncertainties relating to going concern that have not been appropriately disclosed.
This conclusion is based on the review procedures performed in accordance with ISRE (UK) 2410. However, future events or conditions may cause the group to cease to continue as a going concern, and the above conclusions are not a guarantee that the group will continue in operation.
Directors’ responsibilities
The half-yearly financial report is the responsibility of, and has been approved by, the directors. The directors are responsible for preparing the half-yearly financial report in accordance with the DTR of the UK FCA.
As disclosed in note 1, the annual financial statements of the group are prepared in accordance with UK-adopted international accounting standards.
The directors are responsible for preparing the condensed set of financial statements included in the half-yearly financial report in accordance with IAS 34 as adopted for use in the UK.
In preparing the condensed set of financial statements, the directors are responsible for assessing the group’s ability to continue as a going concern, disclosing, as applicable, matters related to going concern and using the going concern basis of accounting unless the directors either intend to liquidate the group or to cease operations, or have no realistic alternative but to do so.
Our responsibility
Our responsibility is to express to the Company a conclusion on the condensed set of financial statements in the half-yearly financial report based on our review. Our conclusion, including our conclusions relating to going concern, are based on procedures that are less extensive than audit procedures, as described in the Basis for conclusion section of this report.
The purpose of our review work and to whom we owe our responsibilities
This report is made solely to the Company in accordance with the terms of our engagement to assist the Company in meeting the requirements of the DTR of the UK FCA. Our review has been undertaken so that we might state to the Company those matters we are required to state to it in this report and for no other purpose. To the fullest extent permitted by law, we do not accept or assume responsibility to anyone other than the Company for our review work, for this report, or for the conclusions we have reached.
Mark Flanagan
for and on behalf of KPMG LLP
Chartered Accountants
15 Canada Square, London, E14 5GL
16 November 2026
Additional information
Notes
Our commentary includes discussion of our trading results on an adjusted basis, which are alternative performance measures (APMs), being before specific items. The directors believe that presentation of the group’s results in this way is relevant to an understanding of the group’s financial performance, as specific items are those that in management’s judgement need to be disclosed by virtue of their size, nature or incidence. This presentation is consistent with the way that financial performance is measured by management and reported to the Board and Executive Committee of BT Group plc and assists in providing a meaningful analysis of the group's trading results. Adjusted measures may not be comparable to similarly titled measures used by other companies. In determining whether an event or transaction is specific, management considers quantitative as well as qualitative factors such as the frequency or predictability of occurrence. Reported revenue, reported operating profit, reported profit before tax and reported net finance expense, presented on a continuing and discontinued basis, are the equivalent statutory measures. Reconciliations of reported to adjusted revenue, operating costs, operating profit, profit before tax, finance expense and net finance expense are set out in the group income statement. Reconciliations of adjusted service revenue, adjusted earnings before interest, tax, and depreciation and amortisation from the nearest measures prepared in accordance with IFRS are provided in this Additional Information.
Adjusted service revenue
Adjusted service revenue comprises all revenue less equipment revenue. Revenue from equipment is included where the equipment is sold as part of a managed services contract, or where that equipment cannot be practicably separated from the underlying service. A reconciliation of reported revenue, the most directly comparable IFRS measure, is set out below.
|
|
Half year to 30 September | |
|
|
2026 |
2025 (re-presented1) |
|
|
£m |
£m |
|
Reported revenue |
8,753 |
8,700 |
|
Specific revenue |
(3) |
(4) |
|
Adjusted revenue |
8,750 |
8,696 |
|
Equipment revenue2 |
(1,065) |
(970) |
|
Adjusted service revenue |
7,685 |
7,726 |
- H1 FY26 comparative information is re‑presented on a continuing basis following announcement of our agreement with Verizon to create a combined global business. See note 10 'Discontinued operations and assets and liabilities classified as held for sale' for further information
- Equipment revenue includes £1m (H1 FY26: £5m) of equipment revenue recognised as lease revenue in note 3
Reconciliation of adjusted earnings before interest, tax, depreciation and amortisation
In addition to measuring financial performance of the group and customer-facing units based on adjusted operating profit, we also measure performance based on adjusted EBITDA. Adjusted EBITDA is defined as profit or loss from continuing operations before specific items, net finance expense, taxation, depreciation and amortisation and share of post-tax profits or losses of associates and joint ventures.
We consider adjusted EBITDA to be a useful measure of our operating performance because it approximates the underlying operating cash flow by eliminating depreciation and amortisation. Adjusted EBITDA is not a direct measure of our liquidity, which is shown by our cash flow statement, and needs to be considered in the context of our financial commitments.
A reconciliation of reported profit for the period from continuing operations, the most directly comparable IFRS measure, to adjusted EBITDA, is set out below.
|
|
Half year to 30 September | |
|
|
2026 |
2025 (re-presented1) |
|
|
£m |
£m |
|
Reported profit for the period from continuing operations |
1,140 |
1,064 |
|
Tax |
236 |
222 |
|
Profit before tax |
1,376 |
1,286 |
|
Net finance expense |
341 |
276 |
|
Depreciation and amortisation |
2,316 |
2,315 |
|
Specific revenue |
(3) |
(4) |
|
Specific operating costs before depreciation and amortisation |
68 |
177 |
|
Share of post-tax (profits) losses of associates and joint ventures |
— |
9 |
|
Adjusted EBITDA |
4,098 |
4,059 |
- H1 FY26 comparative information is re‑presented on a continuing basis following announcement of our agreement with Verizon to create a combined global business. See note 10 'Discontinued operations and assets and liabilities classified as held for sale' for further information
Glossary
|
Alternative performance measures (APMs) |
Alternative performance measures, including adjusted measures which are before specific items - such as Adjusted service revenue and Adjusted EBITDA. Definitions and reconciliation to nearest IFRS measures are detailed in the Additional information section on page 24 |
|
Capital expenditure |
Additions to property, plant and equipment and intangible assets in the period |
|
Re-presented |
We have re-presented certain FY26 comparatives to reflect the results of the International division now presented as discontinued operations, changes to our operating cost classification and changes to the presentation of certain balance sheet items, including subtotals and deferred tax balances. Further details are provided in note 1 on page 12 and note 10 on page 19 |
|
Specific items |
Items that in management’s judgement should be disclosed separately by virtue of their size, nature or incidence. Details can be found in note 5 on page 16 |
Cautionary statement regarding forward-looking statements
Certain information included in this interim results announcement is forward-looking in nature and involves risks, assumptions and uncertainties that could cause actual results to differ materially from those expressed or implied by such statements.
Forward-looking statements relate to all matters which are not historical facts and include, without limitation, projections relating to results of operations and financial conditions and the Company’s plans and objectives for future operations. These statements can be identified by the use of forward-looking terminology, including terms such as ‘believes’, ‘estimates’, ‘anticipates’, ‘expects’, ‘forecasts’, ‘intends’, ‘plans’, ‘projects’, ‘goal’, ‘target’, ‘aim’, ‘may’, ‘will’, ‘would’, ‘could’ or ‘should’ or, in each case, their negative or other variations or comparable terminology.
Forward-looking statements in this interim results announcement are not guarantees of future performance. All forward-looking statements in this interim results announcement are based upon information known to the Company on the date of this interim results announcement. Accordingly, no assurance can be given that any particular expectation will be met and readers are cautioned not to place undue reliance on forward-looking statements, which speak only at their respective dates. Additionally, forward-looking statements regarding past trends or activities should not be taken as a representation that such trends or activities will continue in the future.
Other than in accordance with its legal or regulatory obligations (including under the UK Listing Rules and the Disclosure Guidance and Transparency Rules of the Financial Conduct Authority), the Company undertakes no obligation to publicly update or revise any forward-looking statement, whether as a result of new information, future events or otherwise. Nothing in this interim results announcement shall exclude any liability under applicable laws that cannot be excluded in accordance with such laws.
|
|
British Telecommunications Limited Registered Office: 1 Braham Street London E1 8EE Registered in England and Wales no. 01800000 |
RNS may use your IP address to confirm compliance with the terms and conditions, to analyse how you engage with the information contained in this communication, and to share such analysis on an anonymised basis with others as part of our commercial services. For further information about how RNS and the London Stock Exchange use the personal data you provide us, please see our Privacy Policy.

Latest directors dealings
- 57 minutes ago Spirax Group plc
- 1 hour ago Caledonia Investments
- 1 hour ago Barclays
- 1 hour ago Clarkson
- 1 hour ago Keller Group