
Half-year Report
Summary by AI BETAClose X

BAKER STEEL RESOURCES TRUST LIMITED
(Incorporated in Guernsey with registered number 51576 under the provisions of The Companies (Guernsey) Law, 2008 as amended)
24 September 2026
BAKER STEEL RESOURCES TRUST LIMITED
(the "Company")
LEI: 213800JUXEVF1QLKCC27
Half-Yearly Report and Unaudited Condensed Interim Financial Statements for the period 1 January 2026 to 30 June 2026
The Company has today, in accordance with DTR 6.3.5, released its Half-Yearly Report for the period ended 30 June 2026. The Report is available via www.bakersteelcap.com/baker-steel-resources-trust/ and the National Storage Mechanism.
Further details of the Company and its investments are available on the Baker Steel Capital website www.bakersteelcap.com
Enquiries:
Baker Steel Resources Trust Limited +44 20 7389 8237
Francis Johnstone
Trevor Steel
Shore Capital +44 20 7408 4050
Henry Willcocks (Corporate Broking)
Gillian Martin, Daphne Zhang (Corporate)
Adam Gill (Sales)
Aztec Financial Services (Guernsey) Limited
Company Secretary +44 1481 748882
BAKER STEEL RESOURCES TRUST LIMITED
Half-Yearly Report and Unaudited Condensed Interim Financial Statements
For the period from 1 January 2026 to 30 June 2026
CONTENTS PAGE
Chairman’s Statement |
2 |
Investment Manager’s Report |
5 |
Directors’ Report |
14 |
Unaudited Portfolio Statement |
17 |
Unaudited Condensed Interim Statement of Financial Position |
19 |
Unaudited Condensed Interim Statement of Comprehensive Income |
20 |
Unaudited Condensed Interim Statement of Changes in Equity |
22 |
Unaudited Condensed Interim Statement of Cash Flows |
23 |
Notes to the Unaudited Condensed Interim Financial Statements |
24 |
Management and Administration |
36 |
CHAIRMAN'S STATEMENT
FOR THE PERIOD FROM 1 JANUARY 2026 TO 30 JUNE 2026
THE PORTFOLIO
The first half of 2026 has been positive for the Company in large part. Our NAV increased by 15.4% during the period, and the share price by 65.2%. This compares with a rise of 10.2% in the MSCI World Metals and Mining Index. Once again, the diversity of our portfolio stood the Company and its shareholders in good stead.
The market backdrop to this performance continued to be challenging - while the shock of the tariff wars that had dominated 2025 dissipated somewhat, the US attack on Iran two months into 2026 ratcheted up the risks around spiking energy costs and widespread inflationary pressure on interest rates. The latter took the wind out of precious metals prices in the second quarter, while power (coal) prices firmed.
We are pleased to report that the NAV has continued to grow since 30 June 2025, reflecting both the benefits of some specific commodity price uplift, particularly in critical minerals, and notable progress in a range of our development projects as they move up the value creation curve.
In addition, a more favourable investor view towards junior mining projects continued into the first quarter of the year. This allowed three of our portfolio companies to progress crucial financing packages, namely: Tungsten West, Blue Moon and Silver X. The willingness of Western governments to come alongside private capital in funding critical minerals projects has also underpinned sentiment.
This has been reflected in our own portfolio following the period end, firstly with the UK’s National Wealth Fund providing £71million of equity and debt with the aim of ensuring Tungsten West’s Hemerdon tungsten mine in Devon remains on track for full production early next year. Secondly, the US Government invested $150million in Blue Moon’s Springer tungsten mine through a strategic partnership with Elmet Technologies, the leading US manufacturer of tungsten metal and other critical minerals to a range of applications in defence, aerospace, medical, energy, semiconductor, electronics and industrial processing. Importantly, these strategic government investments have included offtake rights as Western governments react to Chinese export restrictions.
Key developments affecting the Company’s holdings over the past six months are discussed in detail in the Investment Manager’s Report (pages 5-13).
A top-down look at the portfolio shows the ongoing shift in the balance between unquoted and quoted investments net of cash. A primary catalyst was the stronger share prices of Tungsten West (+235%) and Blue Moon Metals (+91%), leaving both companies now forming a more significant part of the portfolio.
As a result, our two largest unquoted holdings, Cemos and Futura, whilst still significant, have reduced from 47.8% at the beginning of 2025 to 34.1% at 30 June 2026. Cemos, the Moroccan cement producer, is now producing its own clinker from its new compact calcination plant. While revenues have remained steady in the first half, the benefit to future profit margins from this achievement is expected to be significant from reduced operating expenses (as the cost of clinker represents around 70% of the cost of cement production).
Australian coal producer Futura had a difficult start to the year. Exceptionally heavy rains and typhoons in Queensland, where Futura is based, resulted in almost a month’s lost production which again put strain on its balance sheet as it was unable to benefit from firming coking coal prices, despite the refinancing of its debts with a “Nordic Bond” at the end of 2025. Futura’s board have therefore engaged Clarkson Securities AS, who arranged the Nordic Bond financing, to undertake a strategic review to consider whether Futura would be better placed as part of a larger group which could provide the additional financing needed to expand the current targeted 4 million tonnes per annum of run-of-mine material up to
10 million tonnes per annum.
Of note amongst our smaller holdings, we are seeing positive operational momentum at Silver X in the wake of its successful fundraising, in what looks to be an improving post-election environment for mining in Peru. Metals Exploration is pushing ahead with its La India project in Nicaragua, which is due to pour first gold before the end of this year, funded by cashflows from its Runruno gold mine in the Philippines.
CHAIRMAN'S STATEMENT
FOR THE PERIOD FROM 1 JANUARY 2026 TO 30 JUNE 2026 (CONTINUED)
CAPITAL ALLOCATION POLICY
Over the past three years the NAV has grown by 135% but the shares continue to trade at a disappointingly wide (albeit reduced) discount.
In light of this, in the 2025 Annual Report and accounts, the Board announced some important changes to the capital allocation policy with one of the aims being to reduce this discount. A share buyback programme was put in place, and in the period to the end of June 2026 1,174,400 shares had been repurchased. Over the six months, the discount has at times tightened significantly, but extreme market uncertainty was unhelpful around the outbreak of the Iran war. We will continue to use the share buyback programme as one of the strings to our bow. Whilst we cannot predict the impact that they will have on the level of discount at which the shares trade, they should be highly accretive to the NAV per share. At the most recent AGM held on 22 September 2026, shareholders authorised the Company to repurchase up to 14.99% of its shares and the Board intends to seek a renewal of the authority at each AGM.
The second objective of the revised capital allocation policy was to offer shareholders some visibility on future income streams. For a number of years, they had been anticipating capital returns as development projects matured or were sold. Given the unpredictability of such returns, the Board decided that a regular dividend could help in this regard. This has been set at a minimum of 3% of NAV per annum. This rate, as well as enhanced buybacks or tender offers, could increase capital returns in the case of significant realisations of assets.
The maiden interim dividend of 2 pence per share will be declared, and further details will be announced in due course.
In the new capital allocation policy outlined in the 2025 Annual Report, the Board made a commitment that in the event of significant realisations from asset sales, and where the Company’s shares have been trading at a discount to NAV in excess of 25%, the Company will, where appropriate, seek to apply at least 50% of the “Net Gains” from such realisation proceeds to a return of capital. Following further consultation with shareholders, the Board has decided to amend the policy such that it will consider applying at least 50% of net realisation proceeds (rather than net gains) from any significant realisations. Any decision to return capital in this respect shall remain at the discretion of the Board taking into account a number of factors such as the level of discount at which the Company’s shares have been trading, the overall liquidity of the Company’s portfolio and any requirement for follow-on commitments, as well as the cash requirements of the Company including the payment of dividends and other potential liabilities such as any performance fee due.
Future capital allocation decisions will inevitably be driven by cash generated by dividend and royalty income from the investee companies, as well as selective asset realisations. The Board will retain discretion for determining the most appropriate manner by which to make such distributions, mindful of differing preferences across our shareholder base and the cyclicality of the commodity markets in which we operate, and always subject to the solvency of the Company, its future commitments and the general liquidity of markets.
Finally, this statement regarding capital allocation does not result in a change to the Company’s investment approach and strategy, which aims to continuously evaluate the best returns for shareholders over the medium term by investing in attractive high growth natural resources opportunities that have the potential for superior returns and to broaden the diversification and increase the critical mass of the portfolio.
OUTLOOK
Short-term trends in capital and commodity markets are likely to be affected by a cocktail of different factors. These include key decisions by the US administration in relation to the Middle East war and consequential implications for inflation. The possible outcome of the tug of war between the US Federal Reserve and the Treasury is hard to predict, and will impact the direction of interest rates and the US dollar. As all these factors impact commodity prices in one way or another, we expect volatility in markets to continue.
CHAIRMAN'S STATEMENT
FOR THE PERIOD FROM 1 JANUARY 2026 TO 30 JUNE 2026 (CONTINUED)
Against this challenging macro background, the diversity of the Company’s portfolio and its increased focus on critical minerals should continue to underpin performance and protect shareholder value. We are excited by the positive momentum in a number of our investee companies, and believe the more benign environment for financing should continue. In many instances, Western government funding for select critical minerals projects is instilling a confidence in the private capital markets to come alongside, while buoyant precious metals continue to attract fund inflows.
Fiona Perrott-Humphrey
Chairman
23 September 2026
INVESTMENT MANAGER'S REPORT
FOR THE PERIOD FROM 1 JANUARY 2026 TO 30 JUNE 2026
Financial Performance
The unaudited Net Asset Value per Ordinary Share (“NAV”) as at 30 June 2026 was 158.2 pence (31 December 2025:137.1 pence), an increase of 15.4% in the period compared with the increase in the MSCI World Metals and Mining Index of 10.2% in Sterling terms.
For the purpose of calculating the NAV per share, unquoted investments were carried at fair value as at 30 June 2026 as determined by the Directors, based on reports received from the Investment Manager following a process detailed in the Annual Report and Accounts. Quoted investments were carried at their quoted prices as at that date.
Net assets comprised the following: |
30 June 2026 |
31 December 2025 | ||
|
£m |
% of NAV |
£m |
% of NAV |
Unquoted Investments |
81.9 |
49.1 |
87.0 |
59.6 |
Quoted Investments |
81.8 |
49.2 |
54.4 |
37.3 |
Cash and other net assets |
2.8 |
1.7 |
4.6 |
3.1 |
|
166.5 |
100.0 |
146.0 |
100.0 |
|
|
|
|
|
Investment Update |
30 June 2026 |
31 December 2025 | ||
Largest Holdings |
£m |
% of NAV |
£m |
% of NAV |
Tungsten West Plc |
36.7 |
22.0 |
12.5 |
8.6 |
Cemos Group plc |
30.0 |
18.0 |
33.5 |
22.9 |
Futura Resources Ltd |
26.8 |
16.1 |
36.4 |
24.9 |
Blue Moon Metals Inc |
24.2 |
14.5 |
13.6 |
9.3 |
Bilboes Royalty |
14.4 |
8.6 |
15.7 |
10.8 |
Silver X Mining Corporation |
9.4 |
5.7 |
11.4 |
7.8 |
First Tin plc |
5.6 |
3.4 |
5.1 |
3.5 |
Metals Exploration Plc |
5.5 |
3.3 |
6.8 |
4.7 |
Caledonia Mining Corporation Plc |
2.9 |
1.7 |
4.6 |
3.2 |
Kanga Potash |
2.5 |
1.5 |
1.0 |
0.7 |
|
158.0 |
94.8 |
140.6 |
96.4 |
Other Investments |
5.7 |
3.5 |
0.8 |
0.5 |
Cash and other net assets |
2.8 |
1.7 |
4.6 |
3.1 |
|
166.5 |
100.0 |
146.0 |
100.0 |
|
|
|
|
|
INVESTMENT MANAGER'S REPORT
FOR THE PERIOD FROM 1 JANUARY 2026 TO 30 JUNE 2026 (CONTINUED)
Review
At 30 June 2026, the Company was fully invested, holding 17 investments of which the top 10 holdings comprised 94.8% of the portfolio by value. In terms of commodity, the portfolio has indirect exposure to tungsten, cement, coking coal, gold, silver, copper, tin, zinc, potash, lead, gallium, germanium, iron, and vanadium. Its projects were located in Australia, Canada, Germany, Indonesia, Madagascar, Morocco, Norway, Nicaragua, Peru, the Philippines, Republic of the Congo, the UK, the USA and Zimbabwe.
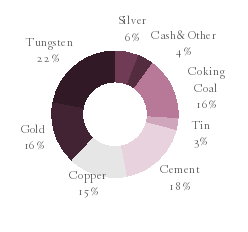
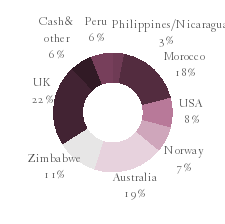
During the first few months of 2026, the recovery of investor interest for development-stage projects seen in 2025 continued with investors prepared to make equity funds available for good quality development and advanced exploration projects held by junior mining companies. This benefited several of the investments in the Company’s portfolio looking to progress their projects. Tungsten West raised £44.4 million in equity towards the restart of the Hemerdon Tungsten Mine in the UK; Blue Moon raised C$150 million towards the construction of its Nussir Copper Mine in Norway and the fast-tracking of the Springer Mine in Nevada, USA; and Silver X raised C$69 million through a convertible debenture to continue the expansion of its La Recuperada silver mine in Peru. However, in the second quarter, investors became more cautious as the conflict in the Middle East became prolonged and shipping halted through the Strait of Hormuz, affecting the price and availability of oil.
During the first half of 2026 the MSCI World Metals and Mining Index composed of large and mid-cap companies rose 10.2% in Sterling terms in response to stronger commodity prices. The Company’s NAV rose 15.4% during the period. The outperformance was driven largely by stronger listed share prices of Tungsten West and Blue Moon which increased by 235% and 91% respectively and now form a more significant proportion of the portfolio.
The ongoing interest from western governments in securing future supply chains of critical minerals continues to be an important driver for commodity prices. The continuing focus on future security of supply of critical minerals has seen key players in commodity markets like the US, China and India focus on calibrating the direction of their future trade flows, both inward and outward bound. This trend has been demonstrated in the Company’s portfolio by the UK National Wealth Fund investing £71 million on Tungsten West whilst securing 50% of the tungsten offtake during August 2026 and in September 2026, the US Department of War invested US$150 million in Tungsten West through a strategic investment in The Elmet Group.
Following a stellar performance in 2025, precious metals took a step back in the first half of 2026 with gold falling 7.2% and silver 18.2%. Base metals prices continued their rise, with copper up 7.2%, tin up 25.9%, and in particular tungsten up 193.0% after also almost trebling in 2025. Steelmaking mineral prices were mixed with metallurgical coal continuing the recovery seen towards the end of 2025 rising 15.0% in the first half of 2026, whereas iron ore prices fell 6.6% (all percentages measured in US dollar terms).
The Company’s main investments at 30 June 2026:
INVESTMENT MANAGER'S REPORT
FOR THE PERIOD FROM 1 JANUARY 2026 TO 30 JUNE 2026 (CONTINUED)
Tungsten West Plc (‘‘Tungsten West’’)
Tungsten West owns the Hemerdon Tungsten Mine in Devon, United Kingdom and is quoted on the AIM market of the London Stock Exchange.
Investment: 109,650,294 ordinary shares (7.3%) valued at £36.3 million
1,657,195 second options valued at £0.4 million
1,657,195 third options valued at Nil
Total £36.7 million (31 December 2025 - £12.5 million). The share price increased following the increased tungsten price and progress towards the start of production. In February 2025 China, which accounts for some 80% of the global supply of tungsten, announced restrictions to the export of 5 critical minerals including tungsten. This development has fed through to prices with the western price of APT having risen to over US$3,000 per MTU at 30 June 2026.
In August 2025, Tungsten West announced the results of its updated feasibility study for the restart of mining operations at the Hemerdon Mine. The feasibility study sets out a base case with an 11-year mine life, 4 years of subsequent stockpile reclaim and an additional 12 years of on-going premium aggregate sales. The potential also exists to extend the operational life of mine, potentially to over 40 years.
The total financing requirement for restarting mining operations at Hemerdon was estimated at US$93 million, benefitting from approximately US$300 million of previously invested capital, including significant open pit pre-stripping, the majority of the plant and a large tailings dam. Using a tungsten price of US$1,313 per Metric Tonne Unit (MTU) (65% ammonium paratungstate or APT), the economics model estimates an NPV (7.5%) of US$1.7 billion with an IRR of 197% and an average cashflow over the first 11 years of production of around US$300 million. In February 2026 Tungsten West raised £44.4 million equity and in August 2026 announced a funding package totalling of £71 million consisting of a £36 million equity investment, £25 million debt facility plus a further £10 million standby “accordion” option to the debt facility. The project is thus fully funded to production.
Limited production at the Hemerdon Mine restarted at the end of July 2026 with the retreating of the fines stockpile with the commissioning of the new build crushing, screening and ore sorting facilities scheduled for Q1 2027.
Futura Resources Ltd (“Futura”)
Futura owns the Wilton and Fairhill steelmaking coal projects in the Bowen Basin in Queensland, Australia
Investment: 13,684,931 ordinary shares (26.9%) valued at £11.4 million
1.5% Gross Revenue Royalty valued at £15.3 million
700,000 warrants exercisable at A$2.50 per share valued at A$0.18 per share (£0.07 million)
Total Value: £26.8 million (31 December 2025 - £36.4 million). The overall value of the investment decreased following reduced production in the first half of 2026, together with a general derating of listed Australian comparables.
Futura commenced mining coal from its second project the Fairhill mine in April 2025 adding to its Wilton mine which had commenced in February 2024, immediately to the South of Fairhill. At the end of 2025 Futura successfully raised US$90 million through a “Nordic Bond” allowing it to retire its existing debt including the bridging loans and deferring principal repayments to 30 months after the issue date.
Exceptionally heavy cyclonic events which were the worst recorded for over forty years resulted in heavy flooding in Queensland. The resulting significant reduction in production across the Bowen Basin severely impacted cash flows not least at Futura. In addition, the increase in coking coal prices received was unfortunately insufficient to offset the lower production levels and the increase in diesel costs and availability of fuel generally as a result of the conflict in the Middle East. In Futura’s case, not only was production delayed but it also affected its ramp-up to steady state. Although the Fairhill mine reached its production target of 145,000 tonnes of run of mine ore per month in May 2026, the restart of the Wilton mine has now been delayed until the beginning of 2027.
Possibly as a result of their current low ratings, there appears to be significant increased interest in acquiring coal assets in Australia and Futura has been approached by a number of parties interested in the consolidation of the area.
INVESTMENT MANAGER'S REPORT
FOR THE PERIOD FROM 1 JANUARY 2026 TO 30 JUNE 2026 (CONTINUED)
Cemos Group Plc (‘‘Cemos’’)
Cemos is a private cement producer with production operations at Tarfaya in Morocco.
Investment: 50,129,247 ordinary shares (30.4%) valued at £30.0 million
Value at 31 December 2025: £33.5 million – decreased due to derating of comparable listed Moroccan cement companies.
First half sales of cement from Cemos’s Tarfaya cement plant site in Morocco totalled approximately 90,000 tonnes in line with budget due to religious holidays with sales for 2026 expected to be similar to the 200,000 tonnes achieved in 2025. The key difference is that Cemos is now producing its own clinker from its new Compact Calcination Unit (CCU) which started operating in October 2025. The CCU is performing well, producing high-quality clinker at around 90% capacity, with debottlenecking activities expected to achieve nameplate capacity during the second half of 2026. The CCU is expected to materially reduce the cost of clinker which represents approximately 70% of cost of the cement and this is therefore expected to translate into an increased EBITDA for 2026 and onwards.
The CCU plant will not only materially reduce costs but also provides security of supply of clinker as well as providing the potential to lower the carbon footprint associated with cement production through the use of natural supplementary cementitious materials such as pozzolan.
During 2024, Cemos identified a site at Errachidia in northern Morocco and commenced the permitting process for its second grinding plant acquired in 2022, essentially identical to the existing plant at Tarfaya. Cemos has started construction of this second plant with foundation works completed and commissioning targeted for mid-2027. This will allow it to double its production rate from 2027 onwards.
Major Moroccan Government and foreign investment and development initiatives (including but not limited to the football World Cup in 2030) are expected to provide a boost to the Moroccan cement market over the coming years. Cemos continues to evaluate a listing of the local company on the Casablanca Stock Exchange potentially in 2027/2028.
Blue Moon Metals Inc (“Blue Moon”)
Blue Moon is a TSXV-listed company which owns 5 brownfield polymetallic development projects: the Nussir Copper-gold-silver Project in Norway; the Springer Tungsten Mine in Nevada; the Apex Germanium/Gallium project in Utah; the Blue Moon zinc-gold-silver-copper project in the United States and the Sulitjelma project copper-zinc-gold-silver project in Norway.
Investment: 5,289,555 ordinary shares (5.1%) valued at £24.2 million (1,393,222 shares subject to phased lock-up to be released in September 2026 – held at a discount.)
December 2025 valuation: £13.6 million. Strong share price appreciation following acquisition of Springer Tungsten mine and Apex Germanium/Gallium project.
During April 2026, Blue Moon announced the completion of a Feasibility Study (“FS”) for its Nussir copper project, located in northern Norway. The FS confirmed that Nussir is a robust, long-life asset with strong economics producing an average of 19,000 tonnes per annum of copper equivalent. The FS outlines a 13-year mine life, while the deposit remains open to the west and at depth. This provides significant upside potential for future resource growth and mine life extension in addition to the potential utilisation of 50% of the inferred resources which would add a further 5 years to the mine life. Initial capital expenditure is forecast to be US$184 million generating base case average annual free cash flow of US$77 million using a long-term copper price of US$10,540/t (US$13,349/t - 30 June 2026). The economics generated a post-tax net present value of US$235 million (8% discount rate). Blue Moon formally approved a final investment decision with construction underway at Nussir with hot commissioning of the process plant scheduled for the third quarter 2027.
INVESTMENT MANAGER'S REPORT
FOR THE PERIOD FROM 1 JANUARY 2026 TO 30 JUNE 2026 (CONTINUED)
In February 2026 Blue Moon completed the acquisition of the Springer tungsten mine and mill complex, situated in Pershing County, Nevada. The Springer tungsten production facility consists of an existing 1,300-ft vertical shaft and underground workings, a nominal 1,200 tonne per day mill with rod/ball mills, grinding and flotation circuits, and a decommissioned Ammonium Paratungstate (“APT”) circuit including autoclave and related reagent systems.
Preliminary internal studies estimate the restart cost at US$50 million, with potential production of 107,000 to 124,000 MTU which would represent a material component of the domestic U.S. market with Springer becoming the only major producer of tungsten in North America. Blue Moon management estimates cash costs net of molybdenum production would be in the US$300-400/MTU APT range compared to the current price of around US$3,000/MTU. In April 2026, Blue Moon announced plans to fast-track production resumption at Springer tungsten mine in Nevada with a targeted restart date of the fourth quarter 2027.
On 13 September 2026 Blue Moon announced a US$150 million investment in Springer through a strategic partnership with The Elmet Group and ASX listed tungsten producer EQ Resources Limited funded as a key part of a US$450 million investment into Elmet by the US Department of War. Elmet will invest US$75 million into Blue Moon in equity and pre-production finance to fund the redevelopment of the Springer mine and mill and a further US$75 million to recommission the Springer APT facility. Blue Moon will retain 100% of the mine and mill which will sell concentrate to the APT joint venture in which it will retain a 20% carried interest.
In March 2026, Blue Moon completed the acquisition of the Apex mine in southern Utah from Teck Resources. Apex is a historic underground mine that was operational in the mid-1980s and through the 1990s, and was the largest primary source of US germanium (Ge) and gallium (Ga) when operational. Apart from the potential economic value of Apex, adding Teck as a strategic shareholder positions Blue Moon at the forefront of an integrated pipeline of US critical mineral projects to secure North American supply. The assay from an initial bulk sample at Apex showed grades of 0.18% germanium, 0.0273% gallium and 1.96% copper. Using spot prices at the end of June 2026 of $10,500/kg Ge and $2,650/kg Ga and US$13,600/tonne Cu would give an in-situ value of around $18,000 per tonne, prior to accounting for recoveries and payability so would easily cover the transportation cost to Springer.
In March 2025, Blue Moon announced the results of a Preliminary Economic Assessment (“PEA”) of its volcanogenic massive sulphide deposit, located in Mariposa County California. This envisaged a mine producing an average of 7.2 million lbs copper, 62.3 million lbs zinc, 22,566 ounces of gold and 681,764 ounces of silver per annum in concentrate. Based on an initial capital cost of US$144.5 million, the base case economic model estimated a post-tax NPV (8%) of US$244 million and an IRR of 38%. During October 2025, Blue Moon commenced the construction of the exploration decline at the Blue Moon Mine.
Apart from the potential to process the existing tungsten resources at Springer, the plant can readily be modified and expanded to produce concentrates from critical metals from alternate sources including the Blue Moon mine. Blue Moon intends to develop a hub and spoke business model by acquiring and developing smaller, high grade underground critical metals mines in the western United States and processing the mineralised material at the Springer processing plant. Springer is 400 miles by road from the Blue Moon mine and the primary Union Pacific rail spur is 7 miles away from the mill. The site was historically served by a railway siding that could potentially be reinstated. As part of the agreement to acquire Apex, Blue Moon and Teck Resources agreed the offtake of zinc concentrates produced from the Blue Moon mine for Teck’s Trail smelter in British Columbia. By combining the Blue Moon Mine in California, with processing at the Springer Complex in Nevada and smelting of the zinc concentrate at Teck’s Trail Operations in Canada, Blue Moon and Teck are building a fully integrated North American value chain.
INVESTMENT MANAGER'S REPORT
FOR THE PERIOD FROM 1 JANUARY 2026 TO 30 JUNE 2026 (CONTINUED)
Bilboes Gold Royalty / Caledonia Mining Corporation Plc (“Caledonia”)
Caledonia is a NYSE, AIM and Victoria Falls Exchange listed gold producer whose primary assets are the producing Blanket Mine and the Bilboes gold project both in Zimbabwe.
The Company holds a 1% Net Smelter Royalty (“NSR”) over future production from the Bilboes’ gold project
Investment: 200,000 ordinary shares in Caledonia (1.0%) valued at £2.9 million
December 2025 valuation: £4.6 million. During the period the Company sold 36,000 shares.
1% NSR valued at £14.4 million
December 2025 valuation: £15.7 million. Valuation reduced due to lower gold price
Caledonia reported gold production for the first half of 2026 from its Blanket gold mine in Zimbabwe of 32,127 oz. maintaining 2026-year production guidance from Blanket of 72,000 to 76,500.
EBITDA for the half year increased to US$79.7 million compared to US$62.0 million in the first half of 2025. Caledonia currently pays a dividend of US$0.14 per quarter. It is expected that at least this level of dividend will continue until the Bilboes project can be brought into production.
The Bilboes properties host a Joint Ore Reserves Committee (“JORC”) compliant Proved and Probable Reserve containing 1.8 million ounces of gold out of a total Mineral Resource of 3.8 million ounces of gold.
In November 2025, Caledonia released the results of its Feasibility Study for the Bilboes Gold Project. The mine will be based on Proven and Probable Reserves of 1.75 million ounces of gold at a grade of 2.26 g/t with the construction of a 240,000 tonne per month plant utilising BIOX® technology for processing. The mine has been designed to produce 1.5 million ounces of gold over a 12-year period. The feasibility study confirmed that a single-phase development of the project would provide the best economic return, having considered alternative development options, including multi-phase development and changes to certain other aspects of the project. At a gold price of US$3,648 per ounce used in the feasibility study, the economic model calculated a Net Present Value (“NPV”) with an 8% discount rate of US$1,234 million and an Internal Rate of Return (“IRR”) of 50.4%.
Caledonia has announced its decision to proceed with the project, which is expected to be funded by a combination of non-recourse senior debt, internal equity and flexible instruments (including royalties, streaming arrangements and mezzanine funding). During February 2026 Caledonia raised US$150 million through the issue of convertible notes towards the funding of the Bilboes development. Caledonia expects that the mine will commence production in the second half of 2028 with the first full year of production being 197,000 ounces of gold in 2029.
At the current gold prices in excess of US$4,000 per ounce, the Company should receive over US$5 million per annum after withholding tax from its 1% Net Smelter Royalty on the Bilboes mine once it is in full production.
Silver X Mining Corporation (“Silver X”)
Silver X is a TSX-V listed company whose Nuevo Recuperada silver/lead/zinc project in Peru comprises 11,261 Ha of mining concessions centred around a 750 tonne per day processing plant.
Investment: 15,193,695 ordinary shares (5.6%) valued at £4.9 million
C$9 million convertible debenture (10% interest) valued at £4.5 million
December 2025 valuation: £11.4 million. During the first half of 2026, the Company sold 4.3 million shares to partially fund the subscription for the convertible debenture as part of a C$69 million raising, in line with its general strategy of targeting convertibles in preference to pure exposure to equity.
During the first half of 2026, Silver X produced 462,970 silver equivalent ounces (AgEq oz) from its Nuevo Recuperada silver/lead/zinc mine in Peru generating an EBITDA of US$12.9 million (1H 2025 US$0.8 million).
INVESTMENT MANAGER'S REPORT
FOR THE PERIOD FROM 1 JANUARY 2026 TO 30 JUNE 2026 (CONTINUED)
In August 2025 Silver X released the results of a PEA under Canadian National Instrument 43-101 Standards which would include the construction of a new plant to process the ore from the current mining area, Tangana, and the expansion of the existing plant to process ore from the new Plata area. The PEA outlined a project processing 3,000 tonnes of ore per day producing an average of 5.6 million silver equivalent ounces per annum over a 14-year period. Initial capital costs are estimated at US$81.8 million with an All-In-Sustaining Cost (“AISC”) of US$15.8/oz AgEq. The economic model generated a post-tax NPV10% of US$303 million at a silver price of US$33.2 per ounce. Following the C$69 million convertible debenture raising, Silver X has been ramping up its production rate with the aim of processing 1,000 tonnes of ore per day in the second half of 2026, approximately double the rate of 2025. The new government of Peru has made positive statements about promoting mining in the country which should open Silver X to new opportunities as well as a faster process for obtaining operating licences for its expansion.
First Tin PLC (“First Tin”)
First Tin is a company listed on the London Stock Exchange which owns the Taronga tin project in Australia and the Tellerhäuser and Gottesburg tin projects in Germany.
Investment: 53,770,871 ordinary shares (9.9%) valued at £5.6 million
December 2025 valuation: £5.1 million. The share price increased 10% following the continued strength in the price of tin.
A drilling programme undertaken in 2025 on the Taronga open pit tin project located in New South Wales, Australia totalled 7,459 metres across 97 reverse circulation (RC) drillholes. This programme was designed to convert Inferred resources to Measured and Indicated status as well as test several interpreted zones of mineralisation near the proposed pits. In April 2026, First Tin announced an updated mineral resource estimate:
Measured Resources increased by 7,000t tin (15.8%) to 39.2Mt @ 0.13% Sn (51,200t tin). Indicated Resources increased by 4,400t tin (10.5%) to 46.5Mt @ 0.10% Sn (46,400t tin).The updated resource including Inferred Resources totalled 132Mt @ 0.10% Sn (136,600t tin) with over 71% of contained tin now in the higher confidence Measured & Indicated categories.
The updated mineral resource has been incorporated into an updated and optimised Definitive Feasibility Study (“DFS”), which outlines a 13.5 year open-pit mine producing an average of 3,200 tonnes of tin per annum. Pre-production capital costs are estimated at US$208 million with All-in-sustaining operating costs of US$16,650/t, placing Taronga in the lower half of production costs worldwide. The mine plan as currently being permitted and using current Reserves, delivers a stand-alone pre-tax NPV8 of US$204 million at a tin price of US$40,000 per tonne (currently >US$55,000/t) with significant opportunities to extend the life to up to 20 years with the conversion of inferred resources.
Metals Exploration plc (“Metals Ex”)
Metals Ex is an AIM listed company which owns the Runruno gold mine in the Philippines and a gold development project in Nicaragua.
Investment: 44,810,000 ordinary shares (1.5%) valued at £5.5 million
December 2025 valuation: £6.8 million. The valuation has decreased in line with many gold mining shares following the reduction in the gold price.
During the first half of 2026, Metals Ex produced gold sales of 21,373 ounces from its Runruno gold mine in the Philippines generating positive free cash flow of US$54.7 million. The Runruno Mine is due to end its life at the end of 2026. Gold production guidance for 2026 is 40,000-48,000 ounces of gold.
Cashflow from Runruno is funding the development of Metals Ex’s La India gold project in Nicaragua which has an estimated overall resource of 2.3moz. Metals Ex’s forecasts annual production of 145,000 ounces of gold over 12.4 years. Based on a gold price of US$4,000 per ounce it estimates an NPV(6%) at US$1.4 billion. At 30 June 2026 the overall construction of the mine was 56% complete with project expenditure standing at US$123.9 million of the total revised budget of US$177 million. First gold pour remains on track for December 2026.
INVESTMENT MANAGER'S REPORT
FOR THE PERIOD FROM 1 JANUARY 2026 TO 30 JUNE 2026 (CONTINUED)
Kanga Investments Ltd(“KIL”)/ Kanga Potash Ltd (“Kanga”)
KIL is a private holding company which owns 64% of Kanga, the private company which owns and operates the Kanga potash project, in the Republic of the Congo.
Investment: KIL: 56,042 ordinary shares (7.8%) valued at £1.6 million
Kanga: 23,390 ordinary shares (1.9%) valued at £0.9 million
December 2025 valuation total: £1.0 million. The valuation has increased due to a further funding round at a higher price.
Kanga completed a positive Feasibility Study in 2020 on its Kanga Potash project in the Republic of the Congo for a mine producing 600,000 tonnes per annum (tpa) of Muriate of Potash (“MOP”). An updated economic model has shown a NPV at a 8% discount rate of US$1.0 billion on this base case with a 2.4 million tpa case generating an NPV of US$3.7 billion. Negotiations are ongoing for the sale of the project. During the first half of 2026 the Company subscribed for new shares in Kanga as part of a US$1.6 million rights issue to provide working capital for Kanga whilst sale negotiations are finalised.
Chancery Royalty Ltd (“Chancery”)
Chancery Royalty is a private company which is building a portfolio of producing gold & silver royalty assets
Investment: 1,000,000 ordinary shares (2.6%) valued at £2.3 million
Chancery has acquired royalties over 4 near term precious metal mines including an initial 8% royalty over the recently restarted Pilar gold mine in Brazil, the Laiva gold mine in Finland which is due to restart in early 2027, a silver royalty on the Gold Road Project in the USA, which is in production and the Kefi gold project in Ethiopia which is in development. At full production these royalties could provide up to 15,000 gold equivalent ounces per annum to Chancery. Chancery is aiming to undertake an IPO in the first half of 2027.
MacKay Gold & Silver Corp (“MacKay”)
Mackay is a TSX-V listed Nevada-focused gold and silver exploration company holding a large land package in the Comstock district in the USA.
Investment: 1,100,000 ordinary shares (1.3%) valued at £2.0 million
MacKay has gathered majority control of the Comstock district, Nevada, one of America’s most iconic and productive Au-Ag epithermal deposits which produced 8.2Moz @ 35 g/t and 192Moz Ag @ 726 g/t between 1859 and 1926. Despite its rich history, large sections of the Comstock district have seen virtually no exploration for over 100 years because of small, highly fragmented mining properties and ownership. Recent land consolidation by Mackay, which has unified a single large and contiguous land package under Mackay control, has removed this barrier to exploration. Mackay now controls more than 7 km of strike of the District’s two major parallel vein structures – the Comstock Lode and Occidental–Brunswick Lode.
At the end of June 2026, MacKay mobilised the first drill rig as part of an initial 20,000 metre drill programme with the initial focus on the Occidental-Brunswick Lode, a 3-mile-long mineralized structure, with the same strike, dip, and overall geological setting and character as the neighbouring Comstock Lode that was mined to depths of over 3000 feet.
OUTLOOK
Strategic minerals have become fundamental to modern economic development, technological innovation, energy transformation, and national security. Their importance extends far beyond mining because their supply chains connect geology with manufacturing, international trade, energy policy, technology, defence, and geopolitics. The growing demand for batteries, renewable-energy systems, electric vehicles, electronics, telecommunications, aerospace technologies, and defence equipment is likely to maintain strong demand for many strategic minerals. At the same time, concentrated production and processing, geopolitical tensions, environmental constraints, and lengthy development times for new mines create significant supply risks.
INVESTMENT MANAGER'S REPORT
FOR THE PERIOD FROM 1 JANUARY 2026 TO 30 JUNE 2026 (CONTINUED)
The central challenge for developed countries in the West is therefore to build resilient, diversified, sustainable, and reliable mineral supply chains. We aim to position the Company’s portfolio to take advantage of the opportunities that lie ahead in identifying the projects which lead to mines that will become the providers of these critical and strategic minerals. BSRT will continue to seek to add to its successful strategy of identifying opportunities such as those already in its portfolio which include Tungsten West, Blue Moon, and First Tin.
At a macro level the war in the Middle East is severely disrupting trade flows, adding increased volatility to the commodity and stock markets. How long these conditions will continue, and what their lasting effects on global growth and equity markets could be is unclear. In this volatile environment, it is important to have a focused and proactive approach which we will continue to undertake through site visits, Board representation as well as guiding corporate activity in our investee companies.
The diverse nature of the Company’s portfolio (spread across precious metals, critical minerals and industrial products) is well positioned to withstand the challenging macro environment, as a number of its development projects continue to move up the value creation curve.
Baker Steel Capital Managers LLP
Investment Manager
23 September 2026
DIRECTORS’ REPORT
FOR THE PERIOD FROM 1 JANUARY 2026 TO 30 JUNE 2026
The Directors of the Company present the Half-Yearly Report and Unaudited Condensed Interim Financial Statements for the six months ended 30 June 2026.
The Directors’ Report contains information that covers this period and the period up to the date of publication of this Report. Please note that more up to date information is available on the Company’s website (www.bakersteelcap.com).
Status
Baker Steel Resources Trust Limited (the “Company”) is a closed-ended investment company with limited liability incorporated on 9 March 2010 in Guernsey under the Companies (Guernsey) Law, 2008 with registration number 51576. The Company is a registered closed-ended investment scheme registered pursuant to the Protection of Investors (Bailiwick of Guernsey) Law, 2020, (“POI Law”) and the Registered Collective Investment Scheme Rules and Guidance, 2021 issued by the Guernsey Financial Services Commission (“GFSC”). On 28 April 2010 the Ordinary Shares and Subscription Shares of the Company were admitted to the Official List of the UK Listing Authority and to trading on the Main Market of the London Stock Exchange.
Investment Objective
The Company’s investment objective is to seek capital growth over the long-term through a focused, global portfolio consisting principally of the equities, loans or related instruments of natural resources companies. The Company invests predominantly in unlisted companies (i.e. those companies that have not yet made an initial public offering (“IPO”)) but also in listed securities (including special situations opportunities and less liquid securities). It aims to achieve attractive investment returns through the uplift in value resulting from the development progression of the investee companies’ projects, and through exploiting value inherent in market inefficiencies and pricing anomalies.
Performance
During the period ended 30 June 2026, the Company’s unaudited NAV per Ordinary Share increased by 15.4% and the share price increased by 65.2% on the London Stock Exchange. This compares with a rise in MSCI World Metals and Mining Index of 10.2% in Sterling terms. A more detailed explanation of the performance of the Company is provided within the Investment Manager’s Report on pages 5 to 13.
The results for the period are shown in the Unaudited Statement of Comprehensive Income on pages 20 and 21 and the Company’s financial position at the end of the period is shown in the Unaudited Statement of Financial Position on page 19.
Dividend and distribution policy
The Board has adopted a new capital allocation policy. The Board intends to target a 5% return of capital each year, delivered through a 3% annual dividend, based on NAV and expected to become progressive in due course once royalty income streams from relevant asset commence; and the balance allocated to share buyback or dividends. The Board will consider, where the Company’s shares have been trading at a discount to NAV in excess of 25%, applying at least 50% of net realisation proceeds from any significant realisations to a return of capital. Any decision to return capital in this respect shall remain at the discretion of the Board taking into account a number of factors such as the level of discount at which the Company’s shares have been trading, the overall liquidity of the Company’s portfolio and any requirement for follow-on commitments, as well as the cash requirements of the Company including the payment of dividends and other potential liabilities such as any performance fee due.
Under the above new dividend policy, the Board will declare an interim dividend of 2 pence per share, and further details will be announced in due course. A final dividend is planned to be declared for the 2026 financial year in April 2027 following the completion of the audit. Dividends will be paid out of capital and/or from any net income after payment of operating expenses.
DIRECTORS’ REPORT
FOR THE PERIOD FROM 1 JANUARY 2026 TO 30 JUNE 2026 (CONTINUED)
Directors and their interests
The Directors of the Company who served during the period and up until the date of signing of the financial statements are:
Fiona Perrott-Humphrey (Chairman)
Charles Hansard
John Falla
Patrick Meier
Biographical details of each of the Directors who were on the Board of the Company at the time of signing the annual report and financial statements for the year ended 31 December 2025 (“the Annual Report”) are presented on page 20 of that report.
Each of the Directors is considered to be independent in character and judgement.
Each Director is asked to declare their interests at each Board Meeting. No Director has any material interest in any other contract which is significant to the Company’s business.
John Falla holds 100,000 shares in the Company (31 December 2025: 100,000). Patrick Meier holds 82,261 shares in the Company (31 December 2025: 82,261). No other director has a beneficial interest in the Company.
Attendance at the quarterly Board and Audit Committee meetings during the period was as follows:
|
Board Meetings |
Audit Committee Meetings | ||
|
Held |
Attended |
Held |
Attended |
Fiona Perrott-Humphrey |
2 |
2 |
2 |
2 |
Charles Hansard |
2 |
2 |
n/a |
n/a |
John Falla |
2 |
2 |
2 |
2 |
Patrick Meier |
2 |
2 |
2 |
2 |
In addition to the quarterly meetings, ad hoc Board and committee meetings are convened as required. All Directors contribute to a significant ad hoc exchange of views between the Directors and the Investment Manager on specific matters, in particular in relation to developments in the portfolio.
The Directors are remunerated for their services at such rate as the Directors determine provided that the aggregate amount of such fees may not exceed £200,000 per annum (or such sum as the Company in a general meeting shall from time to time determine). The Chairman receives a supplement of £15,000 per annum and the Chairman of the Audit Committee a supplement of £10,000 per annum.
For the period ended 30 June 2026 the total remuneration of the Directors was £87,500 (30 June 2025: £72,500) of which £nil remains outstanding as at 30 June 2026 (30 June 2025: £nil).
Authorised share capital
The share capital of the Company on incorporation was represented by an unlimited number of Ordinary Shares of no-par value. The Company may issue an unlimited number of shares of a nominal or par value and/or of no-par value or a combination of both.
Shares in issue
The Company was admitted to trading on the London Stock Exchange on 28 April 2010. During the period, the Company repurchased and subsequently cancelled 1,174,400 of its own shares. As at 30 June 2026, the Company had a total of 105,278,935 (31 December 2025: 106,453,335) ordinary shares in issue with an additional 700,000 (31 December 2025: 700,000) held in treasury. In addition, the Company has 9,167 (31 December 2025: 9,167) Management Ordinary shares in issue, which are held by the Investment Manager.
DIRECTORS’ REPORT
FOR THE PERIOD FROM 1 JANUARY 2026 TO 30 JUNE 2026 (CONTINUED)
Going concern
Having reassessed the principal and emerging risks described on pages 16-17 of the Annual Report, and the other matters discussed in connection with the viability statement as set out on page 17 of the said report, the Directors consider it is appropriate to adopt the going concern basis in preparing these interim Financial Statements. As at 30 June 2026, approximately 51% of the Company’s assets were represented by cash, listed and quoted investments which are readily realisable. The Board is satisfied that the Company has the resources to continue in business for at least 12 months following the signing of these financial statements.
At the 2024 AGM, the vote to discontinue the Company was not passed and therefore a vote with regards to continuation will not be proposed by the Board until the 2027 AGM as is required by the Company’s Articles.
The Directors are not aware of any material uncertainties that may cast significant doubt upon the Company’s ability to continue as a going concern.
Related party transactions
Transactions with related parties are based on terms equivalent to those that prevail in an arm’s length transaction.
Principal and emerging risks
The principal and emerging risks facing the Company, which include market and financial risk and portfolio management and performance risk, are considered in detail, on pages 16 and 17 of the Annual Report which is available on the Company’s website (www.bakersteelcap.com). The Directors do not consider that these risks have materially changed during the period ended 30 June 2026.
Directors’ responsibility statement
The Directors confirm that to the best of their knowledge:
- the condensed set of financial statements have been prepared in accordance with International Financial Reporting Standards (“IFRS”) as adopted by the European Union (“EU”) and give a true and fair view of the assets, liabilities, financial position and profit or loss of the Company; and
- the Interim Report and Accounts include a fair review of the information required by 4.2.7R and 4.2.8R of the FCA’s Disclosure and Transparency Rules.
Corporate governance compliance
The Company is a member of the Association of Investment Companies.
The Board has therefore considered the Principles and Provisions of the AIC Code of Corporate Governance (AIC Code). The AIC Code addresses the Principles and Provisions set out in the UK Corporate Governance Code (the UK Code), as well as setting out additional Provisions on issues that are of specific relevance to the Company.
The Board considers that reporting against the Principles and Provisions of the AIC Code, which has been endorsed by the Financial Reporting Council and the GFSC, provides more relevant information to shareholders.
The Company has complied with the Principles and Provisions of the AIC Code and therefore the UK Code except where explained in the Annual Report on pages 24 to 28.
There is no change in compliance since the Annual Report.
Signed for and on behalf of the Directors:
Fiona Perrott-Humphrey John Falla
Director Director
23 September 2026
UNAUDITED PORTFOLIO STATEMENT
AS AT 30 JUNE 2026
Shares |
Investments |
Fair value |
% of Net |
/Warrants/ |
|
£ equivalent |
assets |
Nominal |
|
|
|
|
|
|
|
|
Listed equity shares |
|
|
|
|
|
|
|
Australian Dollars |
|
|
4,091,910 |
Akora Resources Limited |
168,646 |
0.10 |
|
|
|
|
|
Australian Dollars Total |
168,646 |
0.10 |
|
|
|
|
|
Canadian Dollars |
|
|
6,519,395 |
Azarga Metals Corporation |
272,780 |
0.16 |
15,193,695 |
Silver X Mining Corporation |
4,924,316 |
2.96 |
1,100,000 |
Mackay Gold & Silver Corporation |
1,975,432 |
1.19 |
5,289,555 |
Blue Moon Metals Corp |
24,169,587 |
14.51 |
|
|
|
|
|
Canadian Dollars Total |
31,342,115 |
18.82 |
|
|
|
|
|
Great Britain Pounds |
|
|
53,770,871 |
First Tin Plc |
5,592,171 |
3.36 |
44,810,000 |
Metals Exploration Plc |
5,529,554 |
3.32 |
109,650,294 |
Tungsten West Plc |
36,294,247 |
21.79 |
|
|
|
|
|
Great Britain Pounds Total |
47,415,972 |
28.47 |
|
|
|
|
|
United States Dollars |
|
|
200,000 |
Caledonia Mining Corporation Plc |
2,871,841 |
1.72 |
|
|
|
|
|
United States Dollars Total |
2,871,841 |
1.72 |
|
|
|
|
|
Total investments in listed equity shares |
81,798,574 |
49.11 |
|
|
|
|
|
Debt instruments |
|
|
|
|
|
|
|
Canadian Dollars |
|
|
9,000 |
Silver X – Senior Convertible Debentures |
4,482,887 |
2.69 |
|
|
|
|
|
Canadian Dollars Total |
4,482,887 |
2.69 |
|
|
|
|
|
Total investments in debt instruments |
4,482,887 |
2.69 |
|
|
|
|
UNAUDITED PORTFOLIO STATEMENT
AS AT 30 JUNE 2026
Shares |
Investments |
Fair value |
% of Net |
/Warrants/ |
|
£ equivalent |
assets |
Nominal |
|
|
|
|
|
|
|
|
Unlisted equity shares, warrants and royalties |
|
|
|
|
|
|
|
Australian Dollars |
|
|
10,100,000 |
Futura Gross Revenue Royalty |
15,285,945 |
9.18 |
13,684,931 |
Futura Resources Limited |
11,423,148 |
6.86 |
56,042 |
Kanga Investments Limited |
1,618,736 |
0.97 |
700,000 |
Futura Resources Option |
66,392 |
0.04 |
|
|
|
|
|
Australian Dollars Total |
28,394,221 |
17.05 |
|
|
|
|
|
Canadian Dollars |
|
|
20,578,027 |
PRISM Diversified |
1,093,343 |
0.66 |
40,000 |
PRISM Diversified Limited Royalty |
21,253 |
0.01 |
39,533,114 |
PRISM Royalty Corp |
- |
0.00 |
324,000 |
Unkur On-sale Entitlement |
43,036 |
0.03 |
|
|
|
|
|
Canadian Dollars Total |
1,157,632 |
0.70 |
|
|
|
|
|
Great Britain Pounds |
|
|
50,129,247 |
Cemos Group Plc |
30,027,419 |
18.03 |
1,657,195 |
Tungsten West Plc Second Option Share Warrants 18/10/2026 |
399,053 |
0.24 |
1,657,195 |
Tungsten West Plc Third Option Share Warrants 18/10/2026 |
- |
0.00 |
|
|
|
|
|
Great Britain Pounds Total |
30,426,472 |
18.27 |
|
|
|
|
|
United States Dollars |
|
|
100 |
Bilboes Holdings (Private) Limited - Royalty |
14,353,005 |
8.62 |
500 |
Polar Acquisition Limited |
377 |
0.00 |
23,390 |
Kanga Potash |
858,176 |
0.52 |
1,000,000 |
Chancery Royalty Limited |
2,262,480 |
1.36 |
|
|
|
|
|
United States Dollars Total |
17,474,038 |
10.50 |
|
|
|
|
|
Total Unlisted equity shares, warrants and royalties |
77,452,363 |
46.52 |
|
|
|
|
|
Financial Assets held at fair value through profit or loss |
163,733,824 |
98.32 |
|
|
|
|
|
Other Assets & Liabilities |
2,793,926 |
1.68 |
|
|
|
|
|
Total Equity |
166,527,750 |
100.00 |
|
|
|
|
UNAUDITED CONDENSED INTERIM STATEMENT OF FINANCIAL POSITION
AS AT 30 JUNE 2026
|
|
Unaudited 30 June 2026 |
Audited 31 December 2025 |
|
Notes |
£ |
£ |
Assets |
|
|
|
Cash and cash equivalents |
|
2,677,762 |
3,756,740 |
Interest and other receivables |
|
372,890 |
965,865 |
Financial assets at fair value through profit or loss |
3 |
163,733,824 |
141,370,687 |
Total assets |
|
166,784,476 |
146,093,292 |
Equity and Liabilities |
|
|
|
Liabilities |
|
|
|
Directors’ expenses payable |
8 |
535 |
2,099 |
Management fees payable |
8 |
199,801 |
115,076 |
Audit fees payable |
|
53,275 |
66,800 |
Other payables |
|
3,115 |
821 |
Total liabilities |
|
256,726 |
184,796 |
Equity |
|
|
|
Management Ordinary Shares |
7 |
9,167 |
9,167 |
Ordinary shares |
7 |
74,603,743 |
75,972,688 |
Revenue reserves |
|
6,270,423 |
7,026,851 |
Capital reserves |
|
85,644,417 |
62,899,790 |
Total equity |
|
166,527,750 |
145,908,496 |
Total equity and liabilities |
|
|
|
166,784,476 |
146,093,292 | ||
|
|
|
|
Net Asset Value per Ordinary Share (in Pence) |
4 |
158.2 |
137.1 |
These unaudited condensed financial statements on pages 19 to 35 were approved by the Board of Directors on 23 September 2026 and signed on its behalf by:
Fiona Perrott-Humphrey John Falla
Director Director
The accompanying notes form an integral part of these unaudited condensed interim financial statements
UNAUDITED CONDENSED INTERIM STATEMENT OF COMPREHENSIVE INCOME
FOR THE PERIOD FROM 1 JANUARY 2026 TO 30 JUNE 2026
|
|
Unaudited Period ended 30 June 2026
Revenue |
Unaudited Period ended 30 June 2026
Capital |
Unaudited Period ended 30 June 2026
Total |
|
Notes |
£ |
£ |
£ |
Income |
|
|
|
|
Interest income |
|
519,838 |
- |
519,838 |
Dividend income |
|
48,240 |
- |
48,240 |
Royalty income |
|
201,695 |
- |
201,695 |
Net gain on financial assets and liabilities at fair value through profit or loss |
3 |
- |
22,769,433 |
22,769,433 |
Net foreign exchange gain |
|
- |
(24,806) |
(24,806) |
Net income |
|
769,773 |
22,744,627 |
23,514,400 |
Expenses |
|
|
|
|
Management fees |
6,8 |
1,068,485 |
- |
1,068,485 |
Administration fees |
|
106,786 |
- |
106,786 |
Directors’ fees |
8 |
87,500 |
- |
87,500 |
Other expenses |
|
71,706 |
- |
71,706 |
Custody fees |
|
62,418 |
- |
62,418 |
Broker fees |
|
58,031 |
- |
58,031 |
Audit fees |
|
53,275 |
- |
53,275 |
Depositary fees |
|
18,000 |
- |
18,000 |
Total expenses |
|
1,526,201 |
- |
1,526,201 |
Total comprehensive (loss)/income for the period |
|
|
|
|
|
(756,428) |
22,744,627 |
21,988,199 | |
Earnings per Ordinary Share for the period: |
|
|
|
|
Basic and Diluted (in pence) |
4 |
(0.71) |
21.48 |
20.77 |
In the period ended 30 June 2026, there were no other gains or losses than those recognised above. The Directors consider all results to derive from continuing activities.
The format of the Statement of Comprehensive Income follows the recommendations of the AIC Statement of Recommended Practice.
The accompanying notes form an integral part of these unaudited condensed interim financial statements
UNAUDITED CONDENSED INTERIM STATEMENT OF COMPREHENSIVE INCOME
FOR THE PERIOD FROM 1 JANUARY 2025 TO 30 JUNE 2025
|
|
Unaudited Period ended 30 June 2025 Revenue |
Unaudited Period ended 30 June 2025 Capital |
Unaudited Period ended 30 June 2025
Total |
|
Notes
|
£ |
£ |
£ |
Income |
|
|
|
|
Interest income |
|
163,193 |
- |
163,193 |
Royalty income |
|
58,147 |
- |
58,147 |
Dividend income |
|
81,612 |
- |
81,612 |
Net gain on financial assets and liabilities at fair value through profit or loss |
3 |
- |
16,296,508 |
16,296,508 |
Net foreign exchange loss |
|
- |
4,444 |
4,444 |
Net income |
|
302,952 |
16,300,952 |
16,603,904 |
Expenses |
|
|
|
|
Management fees |
6,8 |
507,753 |
- |
507,753 |
Administration fees |
|
105,959 |
- |
105,959 |
Interest receivable written off |
|
88,145 |
- |
88,145 |
Directors’ fees |
8
|
72,500
|
- |
72,500
|
Audit fees |
|
50,087 |
- |
50,087 |
Custody fees |
|
34,891 |
- |
34,891 |
Other expenses |
|
44,474 |
- |
44,474 |
Broker fees |
|
30,000 |
- |
30,000 |
Depositary fees |
|
21,000 |
- |
21,000 |
Directors’ insurance |
|
8,544 |
- |
8,544 |
Directors’ expenses |
|
8,503 |
- |
8,503 |
Legal fees |
|
3,360 |
- |
3,360 |
Total expenses |
|
975,216 |
- |
975,216 |
Total comprehensive (loss)/income for the period |
|
|
|
|
|
(672,264) |
16,300,952 |
15,628,688 | |
Earnings per Ordinary Share for the period: |
|
|
|
|
Basic and Diluted (in pence) |
4 |
(0.63)
|
15.31
|
14.68
|
In the period ended 30 June 2025, there were no other gains or losses than those recognised above. The Directors consider all results to derive from continuing activities.
The format of the Statement of Comprehensive Income follows the recommendations of the AIC Statement of Recommended Practice.
The accompanying notes form an integral part of these unaudited condensed interim financial statements
UNAUDITED CONDENSED INTERIM STATEMENT OF CHANGES IN EQUITY
FOR THE PERIOD FROM 1 JANUARY 2026 TO 30 JUNE 2026
|
Management Ordinary shares £ |
Ordinary Shares £ |
Treasury Shares £ |
Profit or Loss (Revenue) £ |
Profit or Loss (Capital) £ |
Total Equity £ |
|
|
|
|
|
|
|
Balance as at 1 January 2026 |
9,167 |
76,113,180 |
(140,492) |
7,026,851 |
62,899,790 |
145,908,496 |
Shares bought back and cancelled |
- |
(1,368,945) |
- |
- |
- |
(1,368,945) |
Net (loss)/gain for the period |
- |
- |
- |
(756,428) |
22,744,627 |
21,988,199 |
Balance as at 30 June 2026 |
9,167 |
74,744,235 |
(140,492) |
6,270,423 |
85,644,417 |
166,527,750 |
UNAUDITED CONDENSED INTERIM STATEMENT OF CHANGES IN EQUITY
FOR THE PERIOD FROM 1 JANUARY 2025 TO 30 JUNE 2025
|
Management Ordinary shares |
Ordinary Shares |
Treasury Shares |
Profit or Loss (Revenue) |
Profit or Loss (Capital) |
Total Equity |
|
£ |
£ |
£ |
£ |
£ |
£ |
Balance as at 1 January 2025 |
9,167 |
76,113,180 |
(140,492) |
7,791,310 |
11,703,209 |
95,476,374 |
Net (loss)/gain for the period |
- |
- |
- |
(672,264) |
16,300,952 |
15,628,688 |
Balance as at 30 June 2025 |
9,167
|
76,113,180 |
(140,492) |
7,119,046 |
28,004,161 |
111,105,062 |
The accompanying notes form an integral part of these unaudited condensed interim financial statements
UNAUDITED CONDENSED INTERIM STATEMENT OF CASH FLOWS
FOR THE PERIOD FROM 1 JANUARY 2026 TO 30 JUNE 2026
|
|
Unaudited Period ended 30 June 2026
|
Unaudited Period ended 30 June 2025
|
|
|
£ |
£ |
Cash flows from operating activities |
|
|
|
Net Income for the period |
|
21,988,199 |
15,628,688 |
Adjustments to reconcile net gain for the period to net cash used in operating activities: |
|
|
|
Interest Income |
|
(519,838) |
(163,193) |
Dividend Income |
|
(48,240) |
(81,612) |
Royalties Income |
|
(201,695) |
(58,147) |
Net gain on financial assets at fair value |
3 |
(22,769,433) |
(16,296,508) |
Interest receivable written-off |
|
- |
88,145 |
Net foreign exchange (gain)/loss |
|
(51,137) |
15,504 |
Increase in other receivable |
|
8,385 |
12,991 |
Increase/(Decrease) in other payable |
|
71,930 |
(62,925) |
|
|
(1,521,829) |
(917,057) |
Interest received |
|
1,181,981 |
132,884 |
Royalties income received |
|
124,142 |
135,750 |
Dividend received |
|
48,240 |
81,612 |
Net cash used in operating activities |
|
(167,466) |
(566,811) |
Cash flows from investing activities* |
|
|
|
Purchase of financial assets at fair value through profit or loss |
3 |
(9,852,826) |
(1,091,780) |
Sales of financial assets at fair value through profit or loss |
3 |
10,310,259 |
2,488,188 |
Net cash generated from investing activities |
|
457,433 |
1,396,408 |
Cash flows from financing activities |
|
|
|
Share buyback |
7 |
(1,368,945) |
- |
Net cash from financing activities |
|
(1,368,945) |
- |
Net (decrease)/increase in cash and cash equivalents |
|
(1,078,978) |
829,597 |
Cash and cash equivalents at the beginning of the period |
|
3,756,740 |
123,608 |
|
|
|
|
Cash and cash equivalents at the end of the period |
|
2,677,762 |
953,205 |
* As permitted under IFRS, purchases and sales of financial assets at fair value through profit or loss are classified as investing activities due to the nature and intention to generate future income and cash flows from these investments.
The accompanying notes form an integral part of these unaudited condensed interim financial statements
NOTES TO THE UNAUDITED CONDENSED INTERIM FINANCIAL STATEMENTS
FOR THE PERIOD FROM 1 JANUARY 2026 TO 30 JUNE 2026
- GENERAL INFORMATION
Baker Steel Resources Trust Limited (the “Company”) is a closed-ended investment company with limited liability incorporated and domiciled on 9 March 2010 in Guernsey under the Companies (Guernsey) Law, 2008 with registration number 51576. The Company is a registered closed-ended investment scheme registered pursuant to the Protection of Investors (Bailiwick of Guernsey) Law, 2020 and the Registered Collective Investment Scheme Rules and Guidance, 2021 issued by the Guernsey Financial Services Commission (“GFSC”). On 28 April 2010 the Ordinary Shares and Subscription Shares of the Company were admitted to the Official List of the UK Listing Authority and to trading on the Main Market of the London Stock Exchange. The final exercise date for the Subscription Shares was 2 April 2013. No Subscription Shares were exercised at this time and all residual/unexercised Subscription Shares were subsequently cancelled.
The Company’s portfolio is managed by Baker Steel Capital Managers (Cayman) Limited (the “Manager”). The Manager has appointed Baker Steel Capital Managers LLP (the “Investment Manager”) as the Investment Manager to carry out certain duties. The Company’s investment objective is to seek capital growth over the long-term through a focused, global portfolio consisting principally of the equities, or related instruments, of natural resources companies. The Company invests predominantly in unlisted companies (i.e. those companies which have not yet made an initial public offering (“IPO”)) and also in listed securities (including special situations opportunities and less liquid securities) with a view to exploiting value inherent in market inefficiencies and pricing anomalies.
Baker Steel Capital Managers LLP was authorised to act as an Alternative Investment Fund Manager (“AIFM”) of Alternative Investment Funds (“AIFs”) on 22 July 2014. On 14 November 2014, the Investment Manager signed an amended Investment Management Agreement with the Company, to take into account AIFM regulations. AIFMD focuses on regulating the AIFM rather than the AIFs themselves, so the impact on the Company is limited.
The Half-Yearly financial report has not been audited or reviewed by the independent auditor. However, the Board did procure the independent external auditor to undertake certain agreed-upon procedures to assist the Audit Committee and Board with its review of this report.
- MATERIAL ACCOUNTING POLICY INFORMATION
The unaudited condensed interim financial statements in the half year report for the six months ended 30 June 2026 have been prepared in accordance with International Accounting Standard (IAS) 34, ‘Interim Financial Reporting’ as adopted by the European Union. This half year report and condensed financial statements should be read in conjunction with the Company's annual report and financial statements for the year ended 31 December 2025, which have been prepared in accordance with International Financial Reporting Standards (IFRS) as adopted by the European Union and are available at the Company’s website (www.bakersteelcap.com).
The accounting policies adopted and methods of computation followed in the condensed interim financial statements are consistent with those applied in the preparation of the Company's annual financial statements for the year ended 31 December 2025 and are expected to be applied to the Company's annual financial statements for the year ending 31 December 2026.
NOTES TO THE UNAUDITED CONDENSED INTERIM FINANCIAL STATEMENTS (CONTINUED) FOR THE PERIOD FROM 1 JANUARY 2026 TO 30 JUNE 2026
3. FINANCIAL ASSETS AT FAIR VALUE THROUGH PROFIT OR LOSS
|
Period ended 30 |
Year ended 31 |
Investment Summary: |
June 2026 |
December 2025 |
|
£ |
£ |
Opening book cost |
73,119,199 |
80,229,991 |
Purchases at cost |
9,852,826 |
3,409,033 |
Proceeds from sale of investments |
(10,310,259) |
(8,472,444) |
Net realised gains/(losses) |
3,423,270 |
(2,047,381) |
Closing cost |
76,085,036 |
73,119,199 |
Net unrealised gains |
87,648,788 |
68,251,488 |
Financial assets held at fair value through profit or loss |
163,733,824 |
141,370,687 |
The following table analyses net gains on financial assets at fair value through profit or loss for the period/year ended 30 June 2026, 31 December 2025 and 30 June 2025.
|
Period ended 30 June 2026
£ |
Year ended 31 December 2025
£ |
Period ended 30 June 2025
£ |
Financial assets at fair value through profit or loss |
|
|
|
- Listed equity shares |
3,423,270 |
1,750,150 |
753,646 |
- Royalties |
- |
(3,797,531) |
- |
|
3,423,270 |
(2,047,381) |
753,646 |
Movement in unrealised gains/(losses) on: |
|
|
|
- Listed equity shares |
29,363,761 |
40,809,332 |
13,268,931 |
- Unlisted equity shares |
(4,625,787) |
(1,249,149) |
(2,010,656) |
- Royalties |
(4,934,307) |
14,987,764 |
690,673 |
- Debt instruments |
(650,034) |
(2,142,988) |
3,502,699 |
- Warrants |
192,530 |
852,629 |
91,215 |
|
19,346,163 |
53,257,588 |
15,542,862 |
Net gain on financial assets at fair value through profit or loss |
22,769,433 |
51,210,207 |
16,296,508 |
NOTES TO THE UNAUDITED CONDENSED INTERIM FINANCIAL STATEMENTS (CONTINUED) FOR THE PERIOD FROM 1 JANUARY 2026 TO 30 JUNE 2026
3. FINANCIAL ASSETS AT FAIR VALUE THROUGH PROFIT OR LOSS (CONTINUED)
The following table analyses investments by type and by level within the fair valuation hierarchy at 30 June 2026.
|
Quoted prices in active markets |
Quoted market-based observables |
Unobservable Inputs |
Total |
|
Level 1 |
Level 2 |
Level 3 |
|
|
£ |
£ |
£ |
£ |
Financial assets at fair value through profit or loss |
|
|
|
|
Listed equity shares |
75,946,452 |
5,852,122 |
- |
81,798,574 |
Unlisted equity shares |
- |
- |
47,283,679 |
47,283,679 |
Royalties |
- |
- |
29,660,203 |
29,660,203 |
Warrants |
- |
- |
508,481 |
508,481 |
Debt instruments |
- |
- |
4,482,887 |
4,482,887 |
|
75,946,452 |
5,852,122 |
81,935,250 |
163,733,824 |
The following table analyses investments by type and by level within the fair valuation hierarchy at 31 December 2025.
|
Quoted prices in active markets |
Quoted market-based observables |
Unobservable Inputs |
Total |
|
Level 1 |
Level 2 |
Level 3 |
|
|
£ |
£ |
£ |
£ |
Financial assets at fair value through profit or loss |
|
|
|
|
Listed equity shares |
48,032,920 |
6,321,174 |
- |
54,354,094 |
Unlisted equity shares |
- |
- |
47,433,825 |
47,433,825 |
Royalties |
- |
- |
34,594,510 |
34,594,510 |
Warrants |
- |
- |
363,108 |
363,108 |
Debt instruments |
- |
- |
4,625,150 |
4,625,150 |
|
48,032,920 |
6,321,174 |
87,016,593 |
141,370,687 |
NOTES TO THE UNAUDITED CONDENSED INTERIM FINANCIAL STATEMENTS (CONTINUED) FOR THE PERIOD FROM 1 JANUARY 2026 TO 30 JUNE 2026
- FINANCIAL ASSETS AT FAIR VALUE THROUGH PROFIT OR LOSS (CONTINUED)
The table below shows a reconciliation of beginning to ending fair value balances for Level 3 investments and the amount of total gains or losses for the year included in net loss on financial assets and liabilities at fair value through profit or loss held at 30 June 2026.
30 June 2026 |
Unlisted £ |
Royalties £ |
Debt instruments £ |
Warrants £ |
Total £ |
Opening balance 1 January 2026 |
47,433,825 |
34,594,510 |
4,625,150 |
363,108 |
87,016,593 |
Purchases of investments |
2,017,236 |
- |
4,941,978 |
- |
6,959,214 |
Sales of investments |
- |
- |
(1,975,802) |
(47,157) |
(2,022,959) |
Conversion |
2,458,405 |
- |
(2,458,405) |
- |
- |
Change in net unrealised (losses)/gains |
(4,625,787) |
(4,934,307) |
(650,034) |
192,530 |
(10,017,598) |
Closing balance 30 June 2026 |
47,283,679 |
29,660,203 |
4,482,887 |
508,481 |
81,935,250 |
Unrealised gains on investments still held at 30 June 2026 |
|
|
|
|
|
15,005,297 |
17,460,134 |
(5,006,330) |
377,894 |
27,836,995 |
The table below shows a reconciliation of beginning to ending fair value balances for Level 3 investments and the amount of total gains or losses for the year included in net loss on financial assets and liabilities at fair value through profit or loss held at 31 December 2025.
31 December 2025 |
Unlisted £ |
Royalties £ |
Debt instruments £ |
Warrants £ |
Total £ |
Opening balance 1 January 2025 |
51,120,696 |
26,248,129 |
5,133,328 |
88,779 |
82,590,932 |
Purchases of investments |
35,578 |
350,496 |
1,975,802 |
47,157 |
2,409,033 |
Transfer out of level 3 |
(2,270,071) |
- |
- |
- |
(2,270,071) |
Sales of investments |
- |
(7,329,525) |
(340,995) |
- |
(7,670,520) |
Conversion |
2,064,720 |
- |
(2,064,720) |
- |
- |
Movement in net unrealised gains/(losses) |
(3,517,098) |
15,325,410 |
(78,265) |
227,172 |
11,957,219 |
Closing balance 31 December 2025 |
47,433,825 |
34,594,510 |
4,625,150 |
363,108 |
87,016,593 |
Unrealised gains/(losses) on investments |
|
|
|
|
|
19,792,611 |
21,495,062 |
(4,344,417) |
315,951 |
37,259,207 |
It is the Company’s policy to recognise a change in hierarchy level when there is a change in the status of the investment, for example when a listed company delists or vice versa, or when shares previously subject to a restriction have that restriction released. Transfers between levels are recorded either on the value of the investment immediately after the event or the carrying value of the investment at the beginning of the financial year.
NOTES TO THE UNAUDITED CONDENSED INTERIM FINANCIAL STATEMENTS (CONTINUED) FOR THE PERIOD FROM 1 JANUARY 2026 TO 30 JUNE 2026
- FINANCIAL ASSETS AT FAIR VALUE THROUGH PROFIT OR LOSS (CONTINUED)
In determining an investment’s position within the fair value hierarchy, the Directors take into consideration the following factors:
Investments whose values are based on quoted market prices in active markets are classified within Level 1. These include listed equities with observable market prices. The Directors do not adjust the quoted price for such instruments, even in situations where the Company holds a large position, and a sale could reasonably impact the quoted price. The Company does not currently hold a sufficiently large position in any listed company that it could impact the quoted price via a sale of its investment.
As at 30 June 2026, the Investment Manager prepared the valuations and considered whether there were any changes to performance or the circumstances of the underlying investments which would affect the fair values. Methods, assumptions, and data were consistently applied period on period except for certain private equity investments where a change in assumption is deemed appropriate to reflect the change in the market conditions or investment-specific factors. The Investment Manager then made recommendations to the Board of the fair values as at 30 June 2026.
Investments that trade in markets that are not considered to be active but are valued based on quoted market prices, dealer quotations or alternative pricing sources supported by observable inputs, are classified within Level 2. These include certain less-liquid listed equities. Level 2 investments are valued with reference to the listed price of the shares should they be freely tradable after applying a discount for illiquidity if relevant. As Level 2 investments include positions that are not traded in active markets and/or are subject to transfer restrictions, valuations may be adjusted to reflect illiquidity and/or non-transferability, which are generally based on available market information. The Company held two Level 2 investments at 30 June 2026 (31 December 2025: two).
At 30 June 2026, 1,393,222 of the Company’s Blue Moon shares remain locked up and are therefore held at a discount to the listed price. During the period this has been classified as Level 2.
There were no transfers into or out of level 3 during the period.
Investments classified within Level 3 have significant unobservable inputs. They include unlisted debt instruments, royalty rights, unlisted equity shares and warrants. Level 3 investments are valued using valuation techniques explained below. The inputs used by the Directors in estimating the value of Level 3 investments include the original transaction price, recent transactions in the same or similar instruments if representative in volume and nature, completed or pending third-party transactions in the underlying investment of comparable issuers, subsequent rounds of financing, recapitalisations and other transactions across the capital structure, offerings in the equity or debt capital markets, and changes in financial ratios or cash flows. Level 3 investments may also be adjusted with a discount to reflect illiquidity and/or non-transferability in the absence of market information.
Valuation methodology of Level 3 investments
The primary valuation technique is of “Latest Recent Transaction” being either recent external fund raises or transactions. In all cases the valuation considers whether there has been any change since the transaction that would indicate the price is no longer fair value. Where an unquoted investment has been acquired or where there has been a material arm’s length transaction during the past six months it will be carried at transaction value, having taken into account any change in market conditions and the performance of the investee company between the transaction date and the valuation date. If it is assessed that a recent transaction is not at an arm’s length or there are other indicators that it has not been executed at a price that is indicative of fair value, then the transaction value will not be used as the carrying value of the investment. Where there has been no Latest Recent Transaction the primary valuation driver is IndexVal. For each core unlisted investment, the Company maintains a weighted average basket of listed companies which are comparable to the investment in terms of commodity, stage of development and location (“IndexVal”).
NOTES TO THE UNAUDITED CONDENSED INTERIM FINANCIAL STATEMENTS (CONTINUED) FOR THE PERIOD FROM 1 JANUARY 2026 TO 30 JUNE 2026
3. FINANCIAL ASSETS AT FAIR VALUE THROUGH PROFIT OR LOSS (CONTINUED)
Valuation methodology of Level 3 investments (continued)
IndexVal is used as an indication of how an investment’s share price might have moved had it been listed. Movements in commodity prices are deemed to have been taken into account by the movement of IndexVal.
A secondary tool used by Management to evaluate potential investments as well as to provide underlying valuation references for the Fair Value already established is Development Risk Adjusted Value (“DRAV”). DRAVs are not a primary determinant of Fair Value. The Investment Manager prepares discounted cash flow models for the Company’s core investments annually taking into account significant new information, and for decision making purposes when required. From these, DRAVs are derived. The computations are based on consensus forecasts for long term commodity prices and investee company management estimates of operating and capital costs. Some market analysts incorporate development risk into the discount rate in arriving at a net present value (“NPV”). Instead, the Investment Manager establishes an NPV discounted purely for cost of capital and country risk and then applies a further overall discount to the project economics dependent on where such project sits on the development curve per the DRAV calculations.
The valuation technique for Level 3 investments can be divided into seven groups:
- Transactions & Offers
Where there have been transactions within the past 6 months either through a capital raising by the investee company or known secondary market transactions, representative in volume and nature and conducted on an arm’s length basis, this is taken as the primary driver for valuing Level 3 investments, having taken into account any change in market conditions and the performance of the investee company between the transaction date and the valuation date. This includes offers, binding or otherwise from third parties around the year end which may not have completed prior to the year-end but have a high chance of success and are considered to represent the situation at year end.
- IndexVal
Where there have been no known transactions for 6 months, at the Company’s half year and year end, movements in IndexVal will generally be taken into account in assessing Fair Value where there has been at least a 10% movement in IndexVal over at least a six-month period. The IndexVal results are used as an indication of trend and are viewed in the context of investee company progress and any requirement for finance in the short term for further progression.
- Royalty Valuation Model
The rights to receive royalties are valued on projected cashflows taking into account expected time to production and development risk and adjusted for movement in commodity prices.
- EBITDA Multiple
In the case of Cemos Group plc, which moved to full production during 2020 and so could reflect maintainable earnings, its main asset is a cement plant with no defined life like a mining project and therefore has been valued on the basis of a multiple of a blend of historical and forecast earnings before interest, tax, depreciation and amortisation (“EBITDA”) when compared to listed comparable cement producers.
- Market Comparison
In the case of Futura Resources Ltd which moved into production in early 2024, it was valued with reference to comparable listed coal producers both in terms of EBITDA multiple and Net Present Value duly discounted for its stage of development.
- Warrants
Warrants are valued using a simplified Black Scholes model taking into account time to expiry, exercise price and volatility. Where there is no established market for the underlying shares the average volatility of the companies in that investment’s basket of IndexVal comparable is utilised in the Black Scholes model.
NOTES TO THE UNAUDITED CONDENSED INTERIM FINANCIAL STATEMENTS (CONTINUED) FOR THE PERIOD FROM 1 JANUARY 2026 TO 30 JUNE 2026
3. FINANCIAL ASSETS AT FAIR VALUE THROUGH PROFIT OR LOSS (CONTINUED)
- Convertible loans
Convertible loans are valued taking into account the value of the conversion option based on a binomial
model along with the associated credit risk of the instrument.
Quantitative information on significant unobservable inputs – Level 3
Description |
30 June 2026 £ |
Valuation technique |
Unobservable input |
Range of unobservable input (weighted average) |
|
|
|
|
|
Unlisted Equity |
5,832,735 |
Transactions |
Private transactions |
n/a |
Unlisted Equity |
377 |
IndexVal |
Change in Index |
n/a |
Unlisted Equity |
41,450,567 |
EBITDA Multiple |
EBITDA Multiple |
2x – 7x |
Royalties |
29,638,950 |
Royalty Valuation model |
Development rate risk |
15% - 30% |
Royalties |
21,253 |
Other |
n/a |
n/a |
Debt Instruments |
|
|
|
|
Convertible Loans |
4,482,887
|
Valued at fair value with reference to credit risk
|
Rate of Credit Risk
|
20%
|
|
|
|
|
|
Warrants |
399,053
|
Discount factors to achieve milestones
|
Discount
|
25% - 100%
|
Warrants |
66,392
|
Simplified Black Scholes Model
|
Volatility
|
57%
|
Contingent Interest
|
43,036
|
Discount to external valuation
|
Discount
|
+/-75%
|
|
81,935,250 |
|
|
|
|
|
|
|
|
Description |
31 December 2025 £ |
Valuation technique |
Unobservable input |
Range of unobservable input (weighted average) |
Unlisted Equity |
1,170,344
|
Transactions |
Private transactions |
n/a
|
Unlisted Equity |
46,263,481
|
EBITDA Multiple |
EBITDA Multiple |
3x – 8x
|
Royalties |
34,572,497
|
Royalty Valuation model |
Development rate risk |
15% - 40%
|
|
|
|
|
|
Royalties |
22,013
|
other |
n/a |
n/a
|
|
|
|
|
|
Debt Instruments |
|
|
|
|
Convertible Loans Debentures/Loans |
2,458,405
|
Valued at fair value with reference to credit risk
|
Rate of Credit Risk
|
Nil
|
Other Loans
|
2,166,745 |
Valued at fair value with
|
Risk Discount |
Nil |
|
|
reference to credit risk |
|
|
Warrants |
188,695
|
Simplified Black Scholes Model
|
Volatility
|
57%
|
Warrants |
130,587 |
Discount Factor to achieve milestones |
Discount |
25%-100% |
Contingent Interest |
43,826
|
Discount to external valuation
|
Discount
|
+/-75%
|
|
87,016,593 |
|
|
|
NOTES TO THE UNAUDITED CONDENSED INTERIM FINANCIAL STATEMENTS (CONTINUED) FOR THE PERIOD FROM 1 JANUARY 2026 TO 30 JUNE 2026
- FINANCIAL ASSETS AT FAIR VALUE THROUGH PROFIT OR LOSS (CONTINUED)
Information on third party transactions in unlisted equities is derived from the Investment Manager’s market contacts. The change in IndexVal for each particular unlisted equity is derived from the weighted average movements of the individual baskets for that equity so it is not possible to quantify the range of such inputs.
The significant unobservable inputs used in the fair value measurement categorised within Level 3 of the fair value hierarchy together with a quantitative sensitivity analysis as at 30 June 2026 are as shown below:
Description Input |
Sensitivity |
Effect on Fair Value (£) |
Unlisted Equity Transactions & Expected Transactions |
+/-20% |
+/-1,166,547 |
Unlisted Equity EBITDA Multiple |
+/-20% |
+/-8,290,113 |
Royalties Commodity Price |
+/-20% |
+/-5,927,790 |
Royalties Discount Rate |
+/-20% |
-3,301,422/+3,857,545 |
Debt Instruments |
|
|
Convertibles/Loans Risk discount rate |
+20% |
-896,577 |
|
|
|
Warrants Risk of milestones being achieved |
+/-40% |
+/-106,392 |
Warrants Volatility of Index Basket |
+/-40% |
+87,938/-65,177 |
Contingent Interest Risk discount rate |
+/-20% |
+/-8,607 |
The significant unobservable inputs used in the fair value measurement categorised within Level 3 of the fair value hierarchy together with a quantitative sensitivity analysis as at 31 December 2025 are as shown below:
Description Input |
Sensitivity |
Effect on Fair Value (£) |
Unlisted Equity Transactions & Expected Transactions |
+/-20% |
+/-234,069 |
Unlisted Equity EBITDA Multiple |
+/-20% |
+/-9,252,696 |
Royalties Commodity Price |
+/-20% |
+/-6,914,499 |
Royalties Discount Rate |
+/-20% |
-3,674,966/+4,321,897 |
Debt Instruments |
|
|
Convertibles / Loans Risk discount rate |
+/-20% |
-491,681 |
Others/Loans Risk discount rate |
+/-20% |
-433,348 |
Warrants Volatility of Index Basket |
+/-40% |
+289,527/-292,023 |
Warrants Risk of milestones being achieved |
+/-20% |
-34,801/+34,801 |
Contingent Interest Risk discount rate |
+/-20% |
-35,942/+44,928 |
NOTES TO THE UNAUDITED CONDENSED INTERIM FINANCIAL STATEMENTS (CONTINUED)
FOR THE PERIOD FROM 1 JANUARY 2026 TO 30 JUNE 2026
- NET ASSET VALUE PER SHARE AND EARNINGS PER SHARE
Net asset value per share is based on the net assets of £166,527,750 (31 December 2025: £145,908,496) and 105,288,102 (31 December 2025: 106,462,502) Ordinary Shares, being the number of shares in issue at 30 June 2026 and 31 December 2025, excluding 700,000 shares which are held in treasury. The calculation for basic and diluted NAV per share is as below:
|
31-Dec-25 |
30-Jun-26 |
Net assets at the period end (£) |
166,527,750 |
145,908,496 |
Number of shares |
105,288,102 |
106,462,502 |
Net asset value per share (in pence) basic and diluted |
158.2 |
137.1 |
|
30-Jun-26 |
31-Dec-25 |
Net Profit for the period (£) |
21,988,199 |
50,432,121 |
Number of shares |
105,852,103 |
106,462,502 |
Earnings per ordinary share (in pence) basic and diluted |
20.77 |
47.37 |
There are no outstanding instruments which could result in the issue of new shares or dilute the issued share capital.
- TAXATION
The Company is a Guernsey Exempt Company and is therefore not subject to taxation in Guernsey on its income under the Income Tax (Exempt Bodies) (Guernsey) Ordinance, 1989. An annual exemption fee of £1,600 (2025: £1,600) has been paid. The Company may, however, be exposed to taxes in certain other territories in which it invests such as withholding taxes on interest payments, dividends, royalties and taxes on realisations of investments.
- MANAGEMENT AND PERFORMANCE FEES
The Manager was appointed pursuant to a management agreement with the Company dated 31 March 2010 (the “Management Agreement”). The Company pays a management fee which is equal to 1/12th of 1.75 per cent of the total average market capitalisation of the Company during each month. The management fee is calculated and accrued as at the last business day of each month and is paid monthly in arrears. Amendments effective from 1 July 2024 were made to the Management Agreement and Investment Management Agreements with the Manager and Investment Manager respectively, such that, that the proportion of the Management Fee associated with discretionary fund management is now paid directly to the Investment Manager with the remainder paid to the Manager. There is no impact whatsoever on the overall Management Fee paid by the Company.
The management fee for the period ended 30 June 2026 was £1,068,485 (30 June 2025: £507,753) of which £199,801 (31 December 2025: £ 115,076) was outstanding at the period end.
Pursuant to the Management Agreement, the Manager may also be entitled to a performance fee in certain circumstances. The performance period is each 12-month period ending on 31 December (the “Performance Period”). The amount of the performance fee is 15% of the total increase in the NAV, if the Hurdle has been met, at the end of the relevant Performance Period, over the highest previously recorded NAV as at the end of a Performance Period in respect of which a performance fee was last accrued, having adjusted for the number of Ordinary Shares issued and/or repurchased (“High-water Mark”). The Hurdle is the Issue Price multiplied by the shares in issue, increased at a rate of 8% per annum compounded to the end of the relevant performance period adjusted for tender offers and share buy backs. The performance fee will only become payable if there have been sufficient net realised gains. As at 30 June 2026, the High-water Mark was the equivalent of approximately 95 pence per share with the relevant Hurdle being the equivalent of approximately 217 pence per share.
There were no performance fees accrued for the current or paid for the prior period and, in accordance with IFRS, no potential performance fee is accrued in the NAV until the Hurdle is met. The last performance fee was paid in 2013 in respect to the financial year 2011.
NOTES TO THE UNAUDITED CONDENSED INTERIM FINANCIAL STATEMENTS (CONTINUED)
FOR THE PERIOD FROM 1 JANUARY 2026 TO 30 JUNE 2026
- MANAGEMENT AND PERFORMANCE FEES (CONTINUED)
If the Company wishes to terminate the Management Agreement without cause it is required to give the Manager 12 months prior notice or pay to the Investment Manager and Manager an amount equal to: (a) the aggregate investment management fee which would otherwise have been payable during the 12 months following the date of such notice (such amount to be calculated for the whole of such period by reference to the Market Capitalisation prevailing on the Valuation Day on or immediately prior to the date of such notice); and (b) any performance fee accrued at the end of any Performance Period which ended on or prior to termination and which remains unpaid at the date of termination which shall be payable as soon as, and to the extent that, sufficient cash or other liquid assets are available to the Company (as determined in good faith by the Directors), provided that such accrued performance fee shall be paid prior to the Company making any new investment or settling any other liabilities; and (c) where termination does not occur at 31 December in any year, any performance fee accrued at the date of termination shall be payable as soon as and to the extent that sufficient cash or other liquid assets are available to the Company (as determined in good faith by the Directors), provided that such accrued performance fee shall be paid prior to the Company making any new investment or settling any other liabilities.
- SHARE CAPITAL
The share capital of the Company on incorporation was represented by an unlimited number of Ordinary Shares of no-par value. The Company may issue an unlimited number of shares of a nominal or par value and/or of no-par value or a combination of both.
As at 30 June 2026, the Company has a total of 105,278,935 (31 December 2025: 106,453,335) Ordinary Shares in issue with an additional 700,000 (31 December 2025: 700,000) held in treasury. In addition, the Company has 9,167 (31 December 2025: 9,167) Management Ordinary Shares in issue, which are held by the Investment Manager.
The Ordinary Shares are admitted to the Official List of the London Stock Exchange. Holders of Ordinary Shares have the right to receive notice of and to attend and vote at general meetings of the Company.
During the period, the Company repurchased 1,174,400 shares at an average price of 1.1656 per share, representing a weighted average discount of approximately 26.3% to the prevailing NAV per share of 1.5816. As the shares were repurchased below NAV, the transaction was accretive to remaining shareholders and resulted in an estimated increase in NAV of approximately £488,000 during the period. All shares acquired during the period were subsequently cancelled. The share repurchases were undertaken pursuant to the general authority granted by shareholders at the Company's annual general meeting held on 24 September 2025 ( "the 2025 General Authority"). Under the terms of the 2025 General Authority, the maximum number of shares that may have been acquired by the Company should not, in aggregate, exceed 15,958,729 shares.
Each holder of Ordinary Shares being present in person or by proxy at a meeting will, upon a show of hands, have one vote and upon a poll each such holder of Ordinary Shares present in person or by proxy will have one vote for each Ordinary Share held by him.
The details of issued share capital of the Company were as follows:
|
30 June 2026 |
31 December 2025 | ||
|
Amount* |
No. of shares* |
Amount* |
No. of shares* |
|
£ |
|
£ |
|
Issued and fully paid share capital |
|
|
|
|
Ordinary Shares of no par value** |
74,753,402 |
105,988,102 |
76,122,347 |
107,162,502 |
(including Management Ordinary Shares) |
|
|
|
|
Treasury Shares |
(140,492) |
(700,000) |
(140,492) |
(700,000) |
Total Share Capital |
74,612,910 |
105,288,102 |
75,981,855 |
106,462,502 |
* Includes 9,167 (2025: 9,167) Management Ordinary Shares.
** The value reported for the ordinary shares represents the net of subscriptions and redemptions (including any associated expenses)
NOTES TO THE UNAUDITED CONDENSED INTERIM FINANCIAL STATEMENTS (CONTINUED)
FOR THE PERIOD FROM 1 JANUARY 2026 TO 30 JUNE 2026
7. SHARE CAPITAL (CONTINUED)
The outstanding Ordinary Shares as at the period ended 30 June 2026 were as follows:
|
|
| ||
|
|
| ||
|
Ordinary Shares |
Treasury Shares | ||
|
Amount* |
No. of shares* |
Amount |
No. of shares |
|
£ |
|
£ |
|
Balance at 1 January 2026 |
76,122,347 |
106,462,502 |
140,492 |
700,000 |
Shares bought back and cancelled |
(1,368,945) |
(1,174,400) |
- |
- |
Balance at 30 June 2026 |
74,753,402 |
105,288,102 |
140,492 |
700,000 |
|
|
| ||
The outstanding Ordinary Shares as at the period ended 31 December 2025 were as follows:
|
|
| ||
|
|
| ||
|
Ordinary Shares |
Treasury Shares | ||
|
Amount* |
No. of shares* |
Amount |
No. of shares |
|
£ |
|
£ |
|
Balance at 1 January 2025 & 31 December 2025 |
76,122,347 |
106,462,502 |
140,492 |
700,000 |
|
|
| ||
* Includes 9,167 (31 December 2025: 9,167) Management Ordinary Shares.
- RELATED PARTY TRANSACTIONS
The Investment Manager, Baker Steel Capital Managers LLP, had an interest in 9,167 Management Ordinary Shares at 30 June 2026 (31 December 2025: 9,167).
The Management fees paid and accrued for the year are disclosed under Note 6.
David Baker and Trevor Steel, Directors of the Manager, are interested in the shares held by Northcliffe Holdings Pty Limited and The Sonya Trust respectively, which are therefore considered to be Related Parties. Northcliffe Holdings Pty Limited holds 12,460,677 shares (31 December 2025; 12,460,677) and The Sonya Trust holds 12,637,350 shares (31 December 2025: 12,637,350).
John Falla holds 100,000 shares in the Company (31 December 2025: 100,000). Patrick Meier holds 82,261 shares in the Company (31 December 2025: 82,261).
Management fees and Directors’ fees paid and accrued during the period ended were:
|
|
30 June 2026 |
30 June 2025 |
|
|
£ |
£ |
Management fees |
1,068,485 |
507,753 | |
Directors’ fees |
87,500 |
72,500 | |
Directors’ expenses |
535 |
8,503 | |
The Management fees and Directors’ fees and expenses outstanding at the period / year ended were:
|
|
30 June 2026 |
31 December 2025 |
|
|
£ |
£ |
Management fees |
|
199,801 |
115,076 |
Directors’ expenses |
|
535 |
2,099 |
NOTES TO THE UNAUDITED CONDENSED INTERIM FINANCIAL STATEMENTS (CONTINUED)
FOR THE PERIOD FROM 1 JANUARY 2026 TO 30 JUNE 2026
- SUBSEQUENT EVENTS
Subsequent to the reporting period, the Company repurchased and cancelled 50,000 of its own shares. Following the cancellation, the total number of shares in issue was 105,228,935, with an additional 700,000 shares held in treasury and 9,167 management shares held by the Investment Manager.
No other material events have occurred subsequent to the reporting date.
MANAGEMENT AND ADMINISTRATION
DIRECTORS: Fiona Perrott-Humphrey (Chairman)
Charles Hansard
John Falla
Patrick Meier
(all of whom are non-executive and independent)
REGISTERED OFFICE: East Wing, Trafalgar Court
Les Banques
St. Peter Port
Guernsey, GY1 3PP
Channel Islands
MANAGER: |
Baker Steel Capital Managers (Cayman) Limited PO Box 309 George Town Grand Cayman, KY1-1104 Cayman Islands |
INVESTMENT MANAGER: Baker Steel Capital Managers LLP
34 Dover Street
London, W1S 4NG
United Kingdom
STOCKBROKERS: Shore Capital Stockbrokers Limited
Cassini House, 57 St James’s Street London, SW1A 1LD
United Kingdom
SOLICITORS TO THE COMPANY: Norton Rose Fulbright LLP
(as to English law) 3 More London Riverside
London, SE1 2AQ
United Kingdom
ADVOCATES TO THE COMPANY: Mourant Ozanne
(as to Guernsey law) Royal Chambers
St Julian’s Avenue
St. Peter Port
Guernsey, GY1 4HP
Channel Islands
MANAGEMENT AND ADMINISTRATION (CONTINUED)
ADMINISTRATOR & COMPANY SECRETARY: Aztec Financial Services (Guernsey) Limited
East Wing, Trafalgar Court
Les Banques
St. Peter Port
Guernsey, GY1 3PP
Channel Islands
CUSTODIAN TO THE COMPANY: Liberum Wealth Limited
1st Floor, Royal Chambers
St Julian’s Avenue
St. Peter Port
Guernsey, GY1 2HH
Channel Islands
SAFEKEEPING AND MONITORING AGENT: Liberum Wealth Limited
1st Floor, Royal Chambers
St Julian’s Avenue
St. Peter Port
Guernsey, GY1 2HH
Channel Islands
INDEPENDENT AUDITOR: BDO Limited
P.O. Box 180
Plaza House
2nd Floor, Admiral Park
St. Peter Port
Guernsey, GY1 3LL
Channel Islands
REGISTRAR: Computershare Investor Services (Guernsey) Limited
2nd Floor, Lefebvre Place
Lefebvre Street
St Peter Port
Guernsey
GY1 2JP
UK PAYING AGENT AND TRANSFER AGENT: Computershare Investor Services (Jersey) Limited
Queensway House
Hilgrove Street
St Helier
JE1 1ES
Jersey
MANAGEMENT AND ADMINISTRATION (CONTINUED)
RECEIVING AGENT: Computershare Investor Services (Jersey) Limited
Queensway House
Hilgrove Street
St Helier
JE1 1ES
Jersey
PRINCIPAL BANKER: HSBC Bank plc
Arnold House
St Julian’s Avenue
St. Peter Port
Guernsey, GY1 3NF
Channel Islands
RNS may use your IP address to confirm compliance with the terms and conditions, to analyse how you engage with the information contained in this communication, and to share such analysis on an anonymised basis with others as part of our commercial services. For further information about how RNS and the London Stock Exchange use the personal data you provide us, please see our Privacy Policy.

Latest directors dealings
- 3 minutes ago Prudential
- 3 hours ago Trufin
- 3 hours ago Everplay Group plc
- 3 hours ago Hilton Food Group
- 3 hours ago Sunbelt Rentals Holdings, Inc.