
Tiris BFS Confirms Low-Cost, Near-Term Project
Summary by AI BETAClose X

Cautionary Statement:
This announcement contains a production target for the Tiris Uranium Project and forecast financial information derived from that production target. Those statements are forward-looking statements. The production target is based in part on Inferred Mineral Resources. This Cautionary Statement, the material assumptions underpinning the production target and the forecast financial information and the Competent Person statements are included in this announcement in accordance with ASX Listing Rules 5.16 and 5.17.
This announcement includes forward-looking statements. These forward-looking statements are based on the Company’s expectations and beliefs concerning future events. Forward-looking statements are necessarily subject to risks, uncertainties, and other factors, many of which are outside the control of the Company, which could cause actual results to differ materially from such statements. The Company makes no undertaking to subsequently update or revise the forward-looking statements made in this announcement, to reflect the circumstances or events after the date of this announcement.
The Company has concluded that it has a reasonable basis for providing the forward-looking statements, the production target and the forecast financial information included in this announcement, including the reasonable basis to expect that the funding required for the Project will be available when required. The reasons for that conclusion, and the material assumptions on which those statements are based, are set out in this announcement (including under “Funding”) and in Appendix 4 (Material assumptions).
The production target is based on the Mineral Resource estimate for the Tiris Uranium Project reported in accordance with the JORC Code (2012 Edition) in the ASX and AIM release dated 12 June 2024 “Aura increases Tiris’ Mineral Resources by 55% to 91.3 Mlbs U3O8”, and on the Ore Reserve estimate for the Tiris Uranium Project reported in this announcement. The Mineral Resources and Ore Reserves underpinning the production target have been prepared by a Competent Person in accordance with the requirements of the JORC Code (2012 Edition).
The material assumptions on which the production target and the forecast financial information are based, including the material assumptions about the Modifying Factors, the scheduling of development and production and the availability of project finance, are set out in Appendix 4 (Material assumptions), as required by ASX Listing Rules 5.16.1 and 5.17.1. The summary of the Ore Reserve estimate required by ASX Listing Rule 5.9.1 is set out in Appendix 2 and JORC Code Table 1 Sections 1 to 4 are set out in Appendix 3. The Competent Person statements required by ASX Listing Rules 5.16.2, 5.17.2 and 5.22 are set out under “Competent Person statement”.
The Company confirms that it is not aware of any new information or data that materially affects the information included in the ASX and AIM release dated 12 June 2024, “Aura increases Tiris’ Mineral Resources by 55% to 91.3 Mlbs U3O8”. All material assumptions and technical parameters underpinning the Mineral Resource estimates continue to apply and have not materially changed. The Company confirms that the form and context in which the Competent Person's findings are presented have not been materially modified from the original market announcement.
In accordance with ASX Listing Rule 5.16.3, the Company advises that, by ore tonnes, the production target for the Tiris Uranium Project set out in this announcement comprises 67.1% Ore Reserves (28.3% Proved Ore Reserves and 38.8% Probable Ore Reserves) and 32.9% Inferred Mineral Resources and, by contained U3O8, 67.7% Ore Reserves and 32.3% Inferred Mineral Resources. Cumulative Inferred Mineral Resources comprise less than 12% of the ore mined in the first five years of the schedule and less than 25% of the ore mined in the first ten years. Table 14 in the announcement provides details of the Ore categorisations and the periods in which they are scheduled to be mined.
No exploration target or qualifying foreign estimate is included in the production target.
Cautionary Statement (continued):
The Company is also aware that ASIC has stated, in its submission to ASX and JORC dated 1 December 2011, that Inferred Mineral Resources may provide reasonable grounds in part for a statement about future matters implying economic viability where the viability of the Company's project is based on Indicated or Measured Mineral Resources (where sufficient work has been done on the Modifying Factors), Ore Reserves, or a combination of these, and where the use of Inferred Mineral Resources is not substantial. The Company understands that ASX applies this test both year by year and across the mine plan as a whole.
Consistent with that approach, the Company has scheduled the mine plan so that Inferred Mineral Resources do not form a substantial proportion of the production target in any year.
The Company is also aware that some financiers take a different approach and require Ore Reserves to be prioritised for extraction early in the mine plan. As a result, Inferred Mineral Resources could become a substantial proportion of the year-by-year production targets towards the end of the mine plan. This approach is required by some financiers to ensure that (a) Ore Reserves underpin the servicing of initial capital, which in the Company’s case would be complete by year four, (b) the present value of the project is weighted towards the material that is best understood, and (c) the Company has time to complete infill drilling to upgrade Inferred Mineral Resources to Indicated or Measured Mineral Resources ahead of their extraction.
There is a low level of geological confidence associated with Inferred Mineral Resources, and there is no certainty that further exploration work will result in the determination of Indicated Mineral Resources or that the production target itself will be realised.
The Competent Person has tested a mine plan based on Measured and Indicated Mineral Resources only (the Ore Reserve case), which produced 73.1 Mt at 226 ppm U3O8 for 36.5 Mlb over 18 years and, at a uranium price of US$90/lb U3O8, a post-tax net present value at an 8% real discount rate of about US$355.3 million and a post-tax IRR of 25%.
On that basis, the Company is satisfied that the Inferred Mineral Resources are not the determining factor in the viability of the Tiris Uranium Project. Aura intends to undertake infill drilling to convert Inferred Mineral Resources to Indicated or Measured Mineral Resources before they are scheduled to be mined, although there is no certainty that it will be able to do so.
The 2026 Bankable Feasibility Study is a Feasibility Study for the purposes of clause 40 of the JORC Code (2012 Edition). The development capital cost estimate is an AACE Class 3 estimate with an accuracy of ±15%, and certain inputs, including power supply pricing, remain to be finalised. Actual capital and operating costs may differ materially from the estimates in this announcement.
The forecast financial information in this announcement assumes that the Project is funded with US$400 million, of which US$220 million is senior and subordinated debt and US$180 million is equity, royalties or other quasi-equity instruments. Funding is not secured, no lender or investor has committed to the Company, and the final funding mix has not been determined. There is no assurance that funding will be available on acceptable terms or at all, and any equity or quasi-equity funding is likely to dilute existing shareholders, potentially substantially.
16 October 2026
Bankable Feasibility Study confirms Tiris as a low-cost, near-term uranium producer
Aura Energy Limited (ASX: AEE, AIM: AURA) (“Aura” or the “Company”) is pleased to announce the Bankable Feasibility Study (“BFS”) results for the Tiris Uranium Project in Mauritania (“Tiris”).
The BFS confirms Tiris as a technically simple, long-life uranium mine that requires limited capital expenditure for successful development and is expected to deliver robust returns at conservative uranium prices. The Study supports advancing the Project to a Final Investment Decision (“FID”), targeted for December 2026, with first production by the end of 2028.
Financial Highlights
- Post-tax NPV of US$500.3 million (8% real discount rate, 100% basis, ungeared) at a uranium price of US$90/lb U3O8. Aura’s attributable share is US$425.3 million[1]
- Post-tax IRR of 28%, with a payback of 3.2 years from first production
- Life-of-mine free cash flow of US$1,479 million (undiscounted, ungeared) at base case
- Development capital of US$349.8 million, with construction taking about two years
- C1 cash cost of US$32.53/lb and all-in sustaining cost (AISC) of US$41.25/lb. At US$90/lb, cash margin over C1 cost is US$57.47/lb (64%) and margin over AISC is US$48.75/lb (54%)
- Saleable production of 46.1 Mlb U3O8 over a 26-year mine life, averaging 1.8 Mlb a year
- Average annual revenue of US$158 million, a cash margin over C1 cost of US$101 million, a margin over AISC of US$85 million, EBITDA of US$93 million and post-tax free cash flow of US$57 million over the mine life
Production Highlights
- Ore Reserve estimate has increased by 11% to 74.6 Mt at 227 ppm U3O8, containing 37.3 Mlb of U3O8, up from 33.6 Mlb of U3O8[2]
- Total Mineral Resource of 184 Mt at 225 ppm U3O8 for 91.3 Mlb. Tiris East (BFS basis) holds 162 Mt at 215 ppm for 76.6 Mlb, of which 83 Mt at 219 ppm for 39.9 Mlb is Measured and Indicated
- Free-dig mining with no drilling, blasting, crushing or grinding, at a low strip ratio of 1.00:1
- Simple beneficiation upgrades uranium seven-fold to a leach feed grade of 1,697ppm U3O8, with overall recovery of 83.7%
- 30-year exploitation permits, executed Mining Conventions, environmental approvals in place
- The Tiris Pilot Plant at Bir Moghrein, which replicates the full commercial flowsheet, is due on site later this month and to operate from November to December. It is expected to process more than 80t of ore over different ore types to confirm plant performance ahead of FID
- Product is trucked about 1,447 km to the Port of Nouakchott, of which 782 km is sealed highway
Financing
- Advanced senior debt discussions with the US DFC (about US$150–170 million) and a non-binding MOU with a major nuclear utility, targeting FID in December 2026
Aura Energy Executive Chair, Philip Mitchell, commented:
“Tiris is a simple, robust project. It will be Mauritania’s first uranium mine and opens a new uranium province. It comes on line just as demand for uranium is accelerating.
“The BFS confirms strong returns from our first stage. Construction will cost US$350 million. Our life-of-mine cash operating cost of US$32.53 per pound U3O8 compares favourably against the global cost curve and emerging project benchmarks established in TradeTech's Independent Marketing Assessment. And we can build Tiris in two years.
“Financing arrangements are well advanced. Several strategic investors are working closely with us. We aim to select our financing partner and structure by the end of 2026.”
Aura Energy President, John Carr, commented:
“We are ready to move into execution. Engineering is complete, key permits are in place, and our owner’s team is on board. Once we make the investment decision, we can move to construction.
“A major next step will be the start-up of our continuous pilot plant at Bir Moghrein in November. The plant will process ore from each of our main ore types through the full flowsheet, validating the process under continuous operating conditions. The results will feed directly into detailed design and provide our financing partners with further confidence in the flowsheet and development plans.
“We are targeting a two-year construction period, which would put us on track to begin production by the end of 2028. We have a clear path ahead of us and are focused on executing it safely, efficiently and adopting key technologies of the digital age.”
Mauritania’s Minister of Mines and Industry, His Excellency Eddi Ould Zeine, commented:
“The Government of Mauritania strongly supports the development of Tiris, which will be our country’s first uranium mine and the foundation of a new national industry. Tiris reflects the Government’s priorities for the mining sector: a stable, predictable framework for long-term investment, and projects that create lasting value for Mauritanians.
“Through the State’s 15% interest, royalties, taxes and community contributions, the Project is expected to benefit Mauritania and its communities. Just as important are the jobs Tiris will create and Aura’s commitment to develop young Mauritanians for leadership roles in a modern, digitalised mining industry. We look forward to continuing our close cooperation with Aura as Tiris moves towards construction.”
Why Tiris
- A new uranium province: Mauritania's first uranium mine, anchoring a regional exploration position of about 13,000 km² across the Reguibat Craton.
- Permitted: 30-year exploitation permits, executed Mining Conventions that stabilise fiscal terms, an approved ESIA and radiation authorisation from ARSN.
- Simple to mine and process: Shallow, free-dig ore with no drilling, blasting, crushing or grinding. Over the mine’s life, scrubbing and screening recover about 91.9% of uranium, while rejecting 88% of ore mass. This reduces the leach plant's size and operating costs. The plant recovers 91.1% of uranium, giving an overall recovery of 83.7% from mined ore to final product.
- Modest capital for a long life: Development capital of US$349.8 million supports a 26-year operation.
- 85% Renewable power: Solar and battery microgrid, externally funded via a power purchase agreement (PPA), to harness exceptional solar irradiance in region (circa. 2,200 kWh/m2 p.a.).
- Autonomy and Remote Operation: Adoption of an autonomous and fully electric haulage fleet, a significant first step towards further automation to be advanced by FID.
- Low development risk: Considering all these factors, TradeTech assessed Aura's Tiris as one of the lowest development-risk projects among the 'newly emerging' uranium supply.
Bankable Feasibility Study Summary
This Announcement summarises the 2026 Bankable Feasibility Study (BFS) for the Tiris Uranium Project (Tiris or the Project) in northern Mauritania. The BFS establishes, to a bankable level of confidence, the technical viability and economic merit of developing the Eastern Tiris uranium resource. It is the basis on which Aura, its partners and prospective financiers will make a final investment decision (FID).
The BFS updates and supersedes the production targets and forecast financial information reported in the Company’s previous ASX releases. Investors should no longer rely on the production targets or forecast financial information in those earlier releases.
A detailed summary of the Bankable Feasibility Study is provided at Attachment 1.
Study Outcomes
All figures are stated on a 100% project basis in real terms, unless otherwise noted.
Table 1: Summary BFS Outcomes
|
Measure |
Unit |
BFS outcome |
|
Uranium price assumption (flat) |
US$/lb U3O8 |
90.00 |
|
Weighted average realised price |
US$/lb U3O8 |
89.28 |
|
Post-tax NPV, 8% real, 100% basis |
US$M |
500.3 |
|
Pre-tax NPV, 8% real, 100% basis |
US$M |
604.8 |
|
NPV attributable to Aura shareholders |
US$M |
425.3 |
|
Post-tax IRR |
% |
28 |
|
Payback from first production |
years |
3.2 |
|
Mine life |
years |
26 |
|
Ore mined |
Mt |
111.1 |
|
Average grade mined |
ppm U3O8 |
225 |
|
Beneficiation recovery (LOM average) |
% |
91.9 |
|
Process plant recovery (LOM average) |
% |
91.1 |
|
Overall recovery, ore to product (LOM average) |
% |
83.7 |
|
Total saleable production |
Mlb U3O8 |
46.1 |
|
Average annual production |
Mlb U3O8 |
1.8 |
|
Average annual revenue |
US$M |
158 |
|
Development capital |
US$M |
349.8 |
|
Sustaining capital |
US$M |
203.4 |
|
Closure and rehabilitation |
US$M |
20.0 |
|
Peak funding requirement |
US$M |
379.6 |
|
Life-of-mine capital per pound |
US$/lb U3O8 |
12.44 |
|
C1 cash cost |
US$/lb U3O8 |
32.53 |
|
All-in sustaining cost |
US$/lb U3O8 |
41.25 |
|
Average annual EBITDA |
US$M |
93 |
|
Unlevered free cash flow, life of mine |
US$M |
1,479 |
Uranium Price Sensitivity
Project economics are most sensitive to the uranium price. Table 2 shows post-tax NPV, IRR and payback across a range of flat real uranium prices. Spot and long-term contract prices at the time of the study were about US$89.7/lb and US$97/lb respectively. The base-case price of US$90/lb is in line with the spot price. It is below the long-term contract price. It is also below TradeTech's forecast for 2028 to 2040, which runs from US$106 to US$119/lb in real terms. The study sells all uncontracted production at the base case price, not at the higher contract prices.
Table 2: Project economics across a range of uranium prices
|
Uranium Price (US$/lb U3O8) |
70 |
80 |
90 |
100 |
110 |
120 |
|
Post-tax NPV8 (US$M) |
221.2 |
361.1 |
500.3 |
638.5 |
776.6 |
914.6 |
|
Post-tax IRR (%) |
17% |
23% |
28% |
32% |
37% |
41% |
|
Payback (years) |
4.6 |
3.8 |
3.2 |
2.7 |
2.4 |
2.1 |
|
Attributable NPV8 (US$M) |
188.0 |
306.9 |
425.3 |
542.7 |
660.1 |
777.4 |
Mineral Resource Estimate[3]
The total Mineral Resource is 184 Mt at 225 ppm U3O8 for 91.3 Mlb and is restated from the ASX and AIM release of 12 June 2024, "Aura increases Tiris’ Mineral Resources by 55% to 91.3 Mlbs U3O8". It was estimated by H&S Consultants and is reported at a 100 ppm U3O8 cut-off.
The BFS covers the Tiris East Mineral Resource of 162 Mt at 215 ppm for 76.6 Mlb, comprising 83 Mt at 219 ppm for 39.9 Mlb of Measured and Indicated Mineral Resources and 79 Mt at 210 ppm for 36.7 Mlb of Inferred Mineral Resources.
The Oum Ferkik Resource of 22 Mt at 294 ppm for 14.6 Mlb, all Inferred, is outside the Project.
Ore Reserve Estimate3
An updated Ore Reserve of 74.6 Mt at 227 ppm U3O8 for 37.3 Mlb has been included in this release in conjunction with the BFS. Of this, 31.5 Mt at 237 ppm U3O8 for 16.4 Mlb is Proved and 43.1 Mt at 219 ppm U3O8 for 20.8 Mlb is Probable. It was estimated by Mr Andrew Hutson of Resolve Mining Services.
This replaces the Ore Reserve reported in the ASX release dated 16 December 2024 “Substantial increase in Tiris Uranium Project Ore Reserves”.
The summary of information required by ASX Listing Rules 5.8 and 5.9 is set out in Appendices 1 to 3, together with JORC Code Table 1 Sections 1 to 4.
Flowsheet
Mining
The Tiris ore is hosted in shallow, flat-lying calcrete. Mineralisation starts about 10 centimetres below surface. The ore zone is typically 5 to 15 metres thick. It is free-digging throughout, so no drilling or blasting is required.
The mine plan delivers 111.1 million tonnes of ore over 26 years at an average grade of 225 ppm U₃O₈. About 111.4 million tonnes of waste will also be moved, giving a strip ratio of 1.00:1. Aura will run the mine itself, using excavators and trucks across several shallow pits. Waste and tailings go back into mined-out pits, and Aura will rehabilitate the ground as mining moves on. No permanent waste dumps or tailings dams are needed.
The pits designed for the project contain 11.7 million pounds of U₃O₈ more than the mine plan extracts. All of this extra material is Inferred Mineral Resource. It sits at Marie, Hippolyte West, Hippolyte East and the southern end of Hippolyte South. Adding it would have pushed the share of Inferred material in the final years of the plan above 50%. The mine plan therefore leaves it out. Aura expects to test this material in future resource work.
Aura is also investigating methods to make the mining fleet more efficient and safer. The BFS mine plan adopts a fleet of autonomous, battery-electric haul trucks, peaking at 23 trucks, managed remotely using an autonomous haulage system (AHS). These will run around the clock and can be charged from the site’s solar power, cutting diesel use.
Future work will focus on integrating sensors into excavators, haul trucks, belts, and transfer stations, enabling ore to be scanned for geochemical and mineralogical properties prior to processing. This information would reach the plant before the ore does, allowing the Processing Plant to adjust its settings in advance to suit each load. Given the investment in the communication infrastructure with AHS, tele-remote operations for excavator, loader, and dozer will also be investigated.
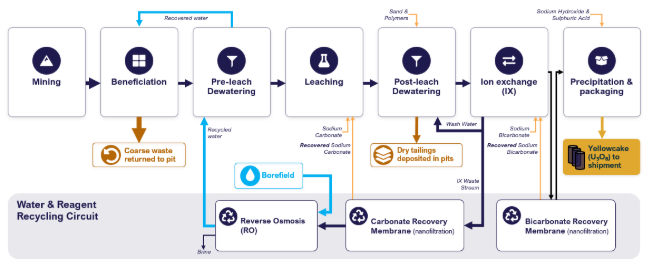
Figure 1: Tiris Process Flowsheet
Processing
First, the ore is washed and tumbled in a scrubber to break it up. It is then passed through three screens: 2 millimetres, 300 microns and, finally, 75 microns. The uranium is in the fine particles that pass through the 75-micron screen. The coarse rock left on the screen holds very little uranium, and is returned to the pit void. This step removes about 88% of ore by weight over the life-of-mine (LOM).
The beneficiation process recovers about 91.9% of the uranium and raises the grade from 225 ppm to 1,697 ppm U3O8, a seven-fold increase (life of mine average). Rejecting most of the ore mass at this stage keeps the leach plant small and operating costs low. This process occurs at one of two Beneficiation Plants, each with a design capacity of 2.5Mtpa, located near active mining sites.
The uranium-concentrated slurry is pumped to the Processing Plant as leach feed. The plant is designed to process 550,000 tonnes of leach feed per year, or about 1,500 tonnes per day, and operates at this rate in most years. Over the 26-year mine life, it averages about 520,000 tonnes per year, mainly driven by the required relocation of the beneficiation plants, which occurs seven times as mining advances into new areas. Each move, along with each shift of the mining face, briefly reduces the ore sent to the plant.
Pre-leach dewatering of the beneficiated leach feed is by two-stage centrifugation, with a wash step incorporated in the first stage. The wash rejects soluble salts and other deleterious species that would otherwise interfere with downstream processing. Centrifugation replaces the pressure filtration adopted in the previous study.
The dewatered cake then undergoes alkaline leaching, in which sodium carbonate dissolves uranium in a series of stirred tanks.
After leaching, the liquids and solids must be separated. The slurry contains dissolved uranium and very fine clay. Clay acts like a sponge, holding on to water and refusing to let go. With ordinary filters, we lose some of the uranium-bearing liquid or need huge, energy-intensive filter plants.
We now use ATA®, owned by Clean TeQ Water (ASX: CNQ), to solve this. ATA®, short for Activator-Tether-Anchor, is a complete dewatering system that conditions the clay slurry and then filters it. Its name comes from the three stages of the process (Activator-Tether-Anchor). In activation, a polymer is mixed into the leached clay slurry, where it coats and agglomerates the fine clay particles. In tethering, a second polymer is mixed into a stream of coarse desert sand, laying down a layer of binding sites across each grain. In anchoring, the two streams are combined, and the activated clay slurry bonds to the tethered sand grains, locking the fines into a granular structure. This granular structure allows the uranium-bearing liquid to drain freely rather than remain trapped within the clay particles. A horizontal vacuum belt filter is then used to separate the liquid from the solids.
This open granular structure is the key. Without ATA®, fine clay packs into a thin, tight layer that blocks the filter cloth and traps the uranium-bearing liquid. Standard chemicals (such as flocculants) can further clump clay particles together, leading to blinding of the filter cloth and entrapment of the uranium-bearing liquid. The granular structure created by ATA® further allows for efficient washing of the cake. Solution is sprayed over the cake in stages to flush out the remaining uranium-bearing liquid.
We chose ATA® for three reasons. First, it works on every type of Tiris ore. It was the only option tested that was shown to do so. Second, it does the job in one step. The previous design needed several. Third, it makes a firm, stackable cake of about 67% solids, rising to 78–79% with vibration-assisted dewatering. This means the leftover solids can go straight back into the empty mine pits.
ATA® was specifically developed to dewater fine mine tailings. Clean TeQ Water has run more than 100 bench-scale filtration tests on Tiris material. The pilot plant at Bir Moghrein, starting in November 2026, will prove ATA® on Tiris ore before the final investment decision.
Next, the uranium-bearing liquid is sent to ion exchange, where it is pumped through columns filled with resin beads. In this process, uranium is adsorbed onto resin beads. This is another key to the flowsheet. We now use Moving Bed Ion Exchange (MBIX), also from Clean TeQ Water. In MBIX, the resin beads are continuously transferred from column to column against the liquid flow, maximising resin utilisation and uranium loading. A second liquid containing sodium bicarbonate then washes the uranium off the beads in a U-shaped column, stripping out impurities and producing a concentrated uranium solution.
The uranium is then precipitated (via two stages) into a solid powder, dried, and packed into drums. This product is called yellowcake.
The final step treats the process water so that it can be reused and useful reagent chemicals can be recovered. The water is passed through nanofiltration membranes, which allow the water to pass while recovering the chemicals. One set of nanofiltration membranes recovers sodium carbonate from the waste liquid generated by ion exchange, which is then used in the leaching process, and returns it to the start of that process, reducing the amount of fresh sodium carbonate required by approximately 50%. A second set of nanofiltration membranes recovers sodium bicarbonate from the concentrated uranium stream from ion exchange, allowing it to be reused. Finally, reverse osmosis purifies the water so that the plant can reuse it.
Aura also plans to digitalise the plant and the mining operations. Enhanced instrumentation will monitor each stage of the process in real time, feeding data into a digital twin (a computer model of the plant that mirrors the behaviour of the physical operation ever more closely as the AI-driven unit process models learn from the plant’s response to changing ore characteristics and operating conditions). Operators can also use the data to test process changes before implementing them in the plant, helping to improve stability, optimise recovery and performance and identify potential issues early. The digital twin is not included in the Study's cost estimate; however, the Company aims to progress this initiative throughout the detailed design and construction phases.
Infrastructure
The following is a summary of the key infrastructure inputs for the Project:
Renewable Power: Power and process steam will be supplied by an independent power producer (IPP) under a long-term power purchase agreement (PPA). The IPP will fund, build, own and operate the generation facility, so power generation carries no development capital for Aura and is included in operating costs. Based on a request-for-proposal process with several large power providers, a power price of US$0.15/kWh and $92/t steam (via diesel boilers) has been used in the study. Prior to execution of a PPA, Aura will work with potential IPPs to produce steam by renewables.
Water: The Taoudeni bore field can sustainably supply up to 74 litres per second, with C22 available as a supplementary supply, against a site requirement of 56 litres per second. A bore field and water pipeline from the Taoudeni basin (120km south of the Project) has been included in the BFS capital and operating estimate.
Access: Product is trucked about 1,447 km to the Port of Nouakchott, of which 782 km is sealed highway. Rail via the SNIM line has been assessed and remains open for further optimisation.
People
Every decision we make about the physical assets (mining, processing, infrastructure) takes the nature of human work into consideration. Our objective is to provide Mauritania with the first mining and processing operation of a new age where the jobs on offer provide staff with excellent career development opportunities, intellectual stimulation and quality of life.
Safer work: Autonomous mining and plant digitalisation allow the handover of relentlessly repetitive tasks from humans to machines. Exposure to physically and mentally harmful working conditions can be sharply reduced. And because a lean site crew can be supervised from an operations centre in Nouakchott, fewer people need to live away from their families in a remote and often harsh environment.
Better careers: Roles can be refocused on problem-solving and decision-making, becoming higher-value-adding, better-paid, and forming the foundation of attractive careers. Over time, such skills improve the quality of individual lives. They will also help strengthen Mauritania's broader economy.
Higher productivity: There is no trade-off between the human benefits and business performance. Machines don't get bored, so they perform repetitive tasks with greater predictability. Better jobs attract, motivate and retain better people. And the gains compound: the plant's models learn and never forget with every tonne processed, and one operations centre can oversee several plants at once.
Capital cost estimate
The following table is the Development Capital estimate at an AACE International Class 3 standard (±15%). Development capital is equivalent to US$7.59 per pound of saleable U3O8.
Table 3: Development capital by component
|
Component |
US$M |
Share |
|
Mining |
24.1 |
6.9% |
|
Processing (incl Beneficiation & Infrastructure) |
228.5 |
65.3% |
|
EPCM |
28.6 |
8.2% |
|
Owner’s cost |
30.2 |
8.6% |
|
Contingency |
38.6 |
11.0% |
|
Total development capital |
349.8 |
100.0% |
Totals may not add due to rounding
Operating cost estimate
The following table presents the operating cost estimate for the project:
Table 4: Operating cost estimate (life of mine), real US dollars, excluding corporate overheads
|
Cost component |
US$/lb U3O8 1-10 yr avg |
US$/lb U3O8 LOM avg |
US$/t ore mined |
US$M LOM |
US$M/yr (LOM avg) |
|
C1 cash cost by Area |
|
|
|
|
|
|
Mining |
5.61 |
7.10 |
2.95 |
327.4 |
12.6 |
|
Processing |
16.91 |
18.73 |
7.77 |
863.2 |
33.2 |
|
G&A |
5.12 |
5.77 |
2.39 |
265.9 |
10.2 |
|
Product transport & marketing |
0.93 |
0.93 |
0.39 |
42.9 |
1.6 |
|
C1 cash cost |
28.58 |
32.53 |
13.49 |
1,499.4 |
57.7 |
|
C1 cash cost by Cost Centre |
|
|
|
|
|
|
Labour |
3.51 |
4.15 |
1.72 |
191.2 |
7.4 |
|
Power |
5.66 |
6.39 |
2.65 |
294.4 |
11.3 |
|
Reagents & Consumables |
9.69 |
10.82 |
4.49 |
498.7 |
19.2 |
|
Diesel |
2.16 |
2.50 |
1.04 |
115.3 |
4.4 |
|
Maintenance |
2.36 |
2.93 |
1.22 |
135.2 |
5.2 |
|
Administration |
4.27 |
4.81 |
2.00 |
221.9 |
8.5 |
|
Product transport & marketing |
0.93 |
0.93 |
0.39 |
42.9 |
1.6 |
|
C1 cash cost |
28.58 |
32.53 |
13.49 |
1,499.4 |
57.7 |
|
All-in sustaining cost |
|
|
|
|
|
|
C1 cash cost |
28.58 |
32.53 |
13.49 |
1,499.4 |
57.7 |
|
Royalties (3.5%, see below) |
3.07 |
3.10 |
1.28 |
142.7 |
5.5 |
|
Sustaining capital |
3.13 |
4.41 |
1.83 |
203.4 |
7.8 |
|
Communities |
0.81 |
0.77 |
0.32 |
35.6 |
1.4 |
|
Closure |
0.00 |
0.43 |
0.18 |
20.0 |
0.8 |
|
All-in sustaining cost |
35.60 |
41.25 |
17.11 |
1,901.2 |
73.1 |
Government and community share of the project
Mauritania shares in the value of Tiris at every level of the Project: through royalties on revenue, wages paid to the workforce, community contributions, tax on profits and the State’s dividends from its 15% interest. Over the 26-year mine life, the Project is expected to generate about US$4,115 million of revenue. Of the US$2,042 million of surplus cash flow (revenue less operating costs, capital and closure costs), about US$903 million, or 44%, is expected to flow to the Government of Mauritania and local communities.
Royalties: 3.5% of the FOB value of product sold, payable from first production regardless of profitability. About US$143 million over the mine life, or US$5.5 million a year.
Jobs: A peak construction workforce of about 600 people on site (including Aura’s owner’s team) and about 438 operating roles (381 at commencement of operations) across site, Nouakchott and Zouérat. Wages of about US$191 million over the mine life are included in operating costs.
Communities: Community contributions of about US$35.6 million over the mine life, included in all-in sustaining cost.
Tax: Corporate tax of 25% after a 36-month tax holiday. Tax is first paid in 2036, once construction-related tax losses are used, and totals about US$377 million, or about US$18.9 million a year over the 20 years in which it is paid. Withholding tax of 10% on dividends paid to Aura adds about US$126 million.
State dividends: ANARPAM’s 15% free-carried interest is expected to receive about US$222 million in dividends from surplus cash flow.
Changes since the September 2024 production target update
Saleable production and mine life are broadly in line with the September 2024 update.
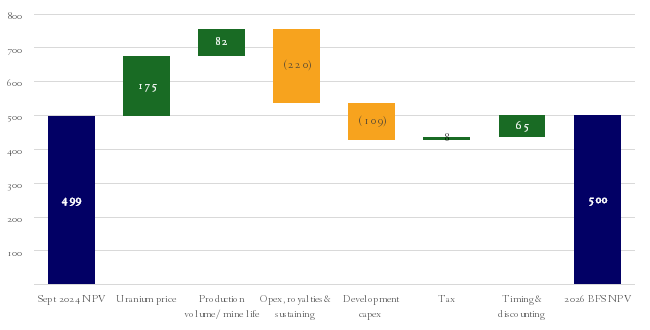
Figure 2: NPV bridge – September 2024 update to 2026 BFS (US$m)
Development capital has risen from US$230 million to US$349.8 million, mainly because the process plant has been re-estimated based on more advanced engineering in the 2025 Basic Engineering and this Study; mining equipment is now purchased rather than leased and includes the provision for autonomy and remote operation; escalation on purchased items; and contingency is higher on an absolute basis. Sustaining capital is now fully costed over the life of mine. Operating costs are higher, primarily due to increased reagent consumption and rising reagent unit costs, as well as an increased allowance for site G&A.
These increases reflect a higher level of engineering definition, not a change in the underlying Project, which the pilot plant is intended to confirm before FID.
Funding
Capital Structure and Credit Metrics
The Study assumes US$400 million of funding (Table 5) comprising US$220 million (55%) of debt, being US$170 million of senior project debt and US$50 million of subordinated debt, and US$180 million (45%) of equity, royalties or other quasi-equity instruments. This covers the peak funding requirement of US$379.6 million, including US$38.6 million of contingency, and leaves US$20.4 million of debt undrawn at first production.
Table 5: Funding Sources & Uses
|
Sources |
US$m |
% |
Uses |
US$m |
|
Senior project debt |
170.0 |
42.5% |
Development capital and spares1 |
352.1 |
|
Subordinated debt |
50.0 |
12.5% |
Capitalised interest and fees |
16.3 |
|
Total debt |
220.0 |
55.0% |
Minimum cash at first production |
10.0 |
|
Equity and quasi-equity |
180.0 |
45.0% |
Peak funding requirement |
379.6 |
|
|
|
|
Undrawn debt at first production2 |
20.4 |
|
Total sources |
400.0 |
100% |
Total |
400.0 |
1 Development capital of US$349.8 million plus spares, less amounts spent after first production. 2 Available for ramp-up working capital.
The Study’s debt assumptions are conservative. All debt is assumed to bear an interest rate of 9%, with all the necessary finance arrangement fees and transaction costs included in the financial analysis. Cash margins are robust, underpinned by a C1 Cash Cost of US$32.53/lb against a realised price of US$89.3/lb. Under this base case scenario, the minimum annual debt service coverage ratio (DSCR) is 2.23x, loan life coverage ratio of 2.56x, and peak debt at 1.6x EBITDA, thus signalling significant headroom.
Status of Funding Discussions
Aura is in advanced discussions with the US International Development Finance Corporation (DFC) on approximately US$150–170 million of senior debt and has received a non-binding, fully funded proposal from a major US investment fund. Separately, on 2 June 2026, Aura signed a non-binding memorandum of understanding (MOU) with a major international nuclear utility covering a potential strategic equity investment and related funding support, a framework for offtake discussions, and technical collaboration including a confirmatory due diligence pilot plant. Aura retains full ownership and operational control of the Project, with any participation rights linked to a defined funding contribution. The parties’ indicative timetable targets a commercial agreement by 31 December 2026 and any required approvals by 30 June 2027. The MOU is non-binding and thus subject to due diligence, credit and investment committee approvals, and definitive documentation.
With respect to these funding discussions, Aura is not yet locked into any lender, investor, or funding strategy, as the optimal strategy is conditional upon the completion of this Study. To this end, future funding plans are indicative only. The Company has a reasonable basis to believe the required funding will be available when needed, based on the Project economics, payback and credit metrics detailed within this report.
Marketing
Tiris has not yet contracted most of its production. About 83% of the expected yearly output remains available. This leaves Aura free to offer it as part of a transaction with a strategic offtaker. The only currently effective long-term contract is a small offtake with Curzon Uranium (Curzon), which covers 300,000lb a year. Aura will sell half of this at fixed prices that rise from US$60.3 to US$67.8 per lb if FID occurs before the end of 2026, or US$59.0 to US$66.5 per lb if FID occurs before the end of 2027. Aura will sell the other half at the spot price minus a 5% discount. The study assumes that all uncontracted production sells at the spot price. On this basis, assuming a flat US$90/lb price, Aura expects to receive an average of US$89 a pound over the mine life.
Approvals and tenure
The principal approvals required to develop the Project have been granted, with a number of routine construction and operating permits expected to be granted in a timely manner. Environmental approval was issued on 5 October 2017. Two exploitation permits were granted on 28 January 2019, each for a 30-year term running from receipt of the grant decree on 8 February 2019 and expiring on 8 February 2049. Together they cover 397 km². The Government of Mauritania has confirmed that the permits can be renewed if all conditions are fulfilled. The Mining Conventions were executed on 27 January 2023 and remain in force until the exploitation permits expire. ARSN, the national radiation authority, granted radiation authorisation on 12 July 2024.
The Mining Conventions stabilise the tax and customs terms for their term. The State holds a 15% interest through ANARPAM. This interest is free-carried through construction and cannot be diluted. Corporate tax is 25%, after a 36-month tax holiday from the start of production, following which a minimum flat tax of 1.75% of turnover applies and is creditable against income tax in the same year. The royalty is 3.5% of the FOB value of uranium sold. Imported goods on the approved mining list are exempt from customs duty and import VAT.
Next steps
- Pilot plant: Operating at Bir Moghrein from November 2026, validating the flowsheet at one tonne per hour on ore from each of the main domains.
- Final Investment Decision: Targeted for December 2026.
- Construction: From the first quarter of 2027, over approximately two years.
- First ore from Tiris 2Mlb p.a. operation: By the end of 2028.
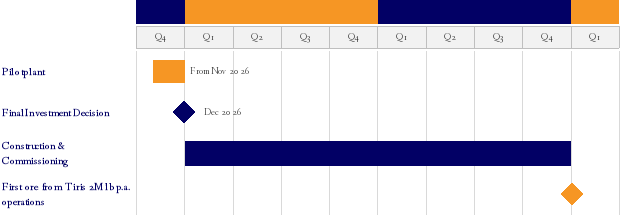
Figure 3: Development timeline to first production
Webinar
Aura Energy will host a briefing on the Tiris Project BFS via a webcast on Monday 19 October 2026 at 3.30pm AEDT.
Please pre-register for the BFS briefing using either of the registration links below.
Webinar registration – (view and listen)
Conference call dial in registration – (listen only, telephone dial-in)
A recording will be made available on Aura Energy’s Investor Centre as soon as possible following the webcast. The presentation materials will be released to the ASX prior to the briefing.
Authorisation for release
This announcement is authorised for release by the Board of Aura Energy Ltd.
This Announcement contains inside information for the purposes of the UK version of the market abuse regulation (EU No. 596/2014) as it forms part of United Kingdom domestic law by virtue of the European Union (Withdrawal) Act 2018 ("UK MAR").
For further information, please contact:
|
Philip Mitchell Executive Chair Aura Energy Limited pmitchell@auraee.com +44 7771 317302
|
SP Angel Corporate Finance LLP Nominated Adviser David Hignell Adam Cowl & Devik Mehta +44 203 470 0470 |
GRACosway Australian investor & media Bill Frith Bill.Frith@omc.com +61 405 144 807
|
Tamesis Partners LLP Broker Charlie Bendon Richard Greenfield +44 203 882 2868
|
About Aura Energy
Aura Energy Limited (ASX:AEE, AIM:AURA) is an Australian-based company focused on the development of uranium and battery metals to support a cleaner energy future. Aura is committed to creating value for host nations, local communities, and shareholders through responsible and sustainable resource development. Aura is advancing two key projects:
Tiris Uranium Project, Mauritania: A near-term, long-life, high-value project transitioning from development to production, positioning the Company as a future uranium supplier.
Häggån Polymetallic Project, Sweden: A large-scale polymetallic project containing vanadium, sulphate of potash and uranium providing longer-term growth potential.
Notes to project descriptions
The Company considers it has a reasonable basis for the forward-looking statements and production targets contained in this Announcement. These statements, including process descriptions and estimates of costs, NPV, IRR and payback period, are derived from the 2026 Bankable Feasibility Study and the Company’s internal financial model.
The production target referred to in this Announcement is based on a life-of-mine schedule comprising 67.1% Ore Reserves (28.3% Proved Ore Reserves and 38.8% Probable Ore Reserves) and 32.9% Inferred Mineral Resources and, by contained U3O8, 67.7% Ore Reserves and 32.3% Inferred Mineral Resources. Inferred material represents less than 12% of ore mined in the first five years and less than 25% in the first ten years. There is a low level of geological confidence associated with Inferred Mineral Resources and there is no certainty that further exploration work will result in the determination of Indicated or Measured Mineral Resources, or that the production target itself will be realised.
Inferred material is scheduled mainly in the second half of the mine life. This is because the early pits draw mostly on Proved and Probable Ore Reserves. The Inferred share rises from about year 16 of the mine schedule, as mining moves into areas with wider drill spacing. From about year 16 to the end of the schedule, about 43% of ore mined is Inferred. Aura intends to convert this material to Indicated or Measured Mineral Resources through infill drilling before it is mined, although there is no certainty that it will be able to do so. The payback period, which ends about 3.2 years after first production, therefore falls almost entirely within the part of the schedule drawn from Proved and Probable Ore Reserves.
The Tiris Uranium Project Mineral Resources were reported in the ASX release dated 12 June 2024 “Aura increases Tiris’ Mineral Resources by 55% to 91.3 Mlbs U3O8”. The Ore Reserves previously reported in the ASX release dated 16 December 2024 “Substantial increase in Tiris Uranium Project Ore Reserves” are updated and superseded by the Ore Reserve estimate reported in this Announcement. In respect of the Mineral Resources, the Company confirms that it is not aware of any new information or data that materially affects the information included in that market announcement, and that all material assumptions and technical parameters underpinning the estimate continue to apply and have not materially changed.
The Company confirms that the form and context in which the Competent Person’s findings are presented have not been materially modified from the original market announcements.
The Häggån Project Mineral Resource estimate referred to in this Announcement was originally reported in accordance with the JORC Code (2004 Edition) (see ASX Release dated 22 August 2012 “Outstanding Häggån Uranium Resource Expands to 800 Million Pounds” and ASX Release dated 10 October 2019 “Häggån Battery Metal Project Resource Upgrade Estimate Successfully Completed”) and has not been reported in accordance with the JORC Code (2012 Edition). The uranium Mineral Resource comprises an Inferred Mineral Resource of 2.35 billion tonnes at a grade of 155 ppm U3O8 (at a cut-off grade of 100 ppm U3O8), for contained U3O8 of approximately 800 million pounds. A Competent Person has not undertaken sufficient work to classify the historical estimate as a Mineral Resource in accordance with the JORC Code (2012 Edition), and it is uncertain that future conversion work will result in the estimate being reported as a Mineral Resource in accordance with the JORC Code (2012 Edition). Nothing has come to the Company’s attention since the original reporting that causes it to believe the historical estimate is materially misleading or inaccurate. However, the estimate should not be relied upon until conversion under the JORC Code (2012 Edition) is complete.
The uranium Mineral Resource is currently in the process of being converted in accordance with the JORC Code (2012 Edition) and to incorporate uranium assay information from exploration drilling subsequent to the ASX Release dated 22 August 2012. No reinterpretation or re-estimation has been completed during the conversion process to date. A full summary of the Resource methodology and validation, which is currently being independently reviewed by the Competent Person, will be included in the relevant JORC Table 1 attached to the future announcement of the JORC Code (2012 Edition) compliant Häggån Mineral Resource estimate. The Company confirms that it is not aware of any new information or data arising from the ongoing JORC Code (2012 Edition) conversion process that materially affects the Häggån Mineral Resource estimate referred to above.
Disclaimer Regarding Forward-Looking Statements
This ASX announcement (‘Announcement’) contains various forward-looking statements. All statements other than statements of historical fact are forward-looking statements. Forward-looking statements are inherently subject to uncertainties in that they may be affected by a variety of known and unknown risks, variables and factors which could cause actual values or results, performance or achievements to differ materially from the expectations described in such forward-looking statements. The Company does not give any assurance or guarantee that the anticipated results, performance or achievements expressed or implied in those forward-looking statements will be achieved.
Future funding plans are indicative only and are not commitments. They are subject to market conditions, regulatory approvals and counterparties, and there is no assurance that finance will be obtained on acceptable terms or at all. Any equity or quasi-equity funding is likely to dilute existing shareholders, potentially substantially.
This Announcement includes non-IFRS financial information, including C1 cash cost, all-in sustaining cost (AISC), EBITDA and free cash flow. These measures are not defined in, or calculated in accordance with, Australian Accounting Standards or IFRS, have not been audited or reviewed, and may not be comparable to similarly titled measures reported by other companies. They are presented because the Company considers they assist investors to assess the Project’s cost position.
Competent Person statement
The information in this Announcement that relates to Ore Reserves for the Tiris Uranium Project is based on, and fairly represents, information compiled by Mr Andrew Hutson of Resolve Mining Services. Mr Hutson is a Fellow of the Australian Institute of Mining and Metallurgy (AusIMM) and has sufficient experience relevant to the style of mineralisation and type of deposit under consideration and to the activity being undertaken to qualify as a Competent Person as defined in the JORC Code 2012. Mr Hutson consents to the inclusion in this Announcement of the matters based on his information in the form and context in which it appears.
Attachment 1: Bankable Feasibility Study Detailed Summary
Introduction and study team
This Announcement summarises the 2026 Bankable Feasibility Study (BFS) for the Tiris Uranium Project (Tiris or the Project) in northern Mauritania. The BFS establishes, to a bankable level of confidence, the technical viability and economic merit of developing the Eastern Tiris uranium resource. It is the basis on which Aura, its partners and prospective financiers will make a final investment decision (FID).
The BFS updates and supersedes the production targets and forecast financial information reported in the Company’s ASX releases dated 29 July 2019 (Tiris Uranium Definitive Feasibility Study Completed), 29 March 2023 (Enhanced Definitive Feasibility Study), 28 February 2024 (FEED study confirms excellent economics for the Tiris Uranium Project), 11 September 2024 (Updated Production Target Improves Economics at Tiris Uranium Project) and 13 December 2024 (Tiris Uranium Project - Alternative Production Targets provide growth opportunities for Aura), together with the Basic Engineering Study completed by Wood in 2025. Investors should no longer rely on the production targets or forecast financial information in those earlier releases.
Study basis
All aspects of the BFS are reflected in an integrated Financial Model. Every physical and financial input is drawn from a controlled source document: the mine plan; the mass balance for recoveries and reagent consumption; the detailed capital estimate, a detailed labour plan and G&A cost build-up; and an economic assumptions register for prices, exchange rates and fiscal terms.
The model runs monthly, in real terms, on a 100% ungeared project basis. All monetary values are in real US dollars at exchange rates of AUD:USD 0.70 and MRU:USD 0.025, with a base valuation date of 1 January 2027. Unit costs are stated per pound of saleable U3O8. The capital and operating cost estimates were prepared to an AACE International Class 3 standard (±15%).
Study team
Aura's technical team led the BFS, supported by independent specialist consultants. Key contributors are listed in Table 6.
Table 6: BFS study team and responsibilities
|
Organisation |
Scope |
|
Aura Energy |
Study & test work management, Financial Model, Owner's costs, G&A |
|
H&S Consultants |
June 2024 Mineral Resource estimate |
|
AMC Consultants Pty Ltd |
Geometallurgy review |
|
Resolve Mining Services |
Mine plan, schedule, mining costs & Ore Reserve |
|
RCS/Acclarium, Clean TeQ Water, AMML |
Beneficiation, leach, dewatering and ion exchange testwork |
|
Wood Group (Wood) |
Contributor to process design, mass balance, capital estimate |
|
Worley |
Renewable Power & Steam and Electric Autonomous Mining Fleet Study |
|
Knight Piésold |
Borefield evaluation and groundwater modelling |
|
Earth Systems, JBS&G |
ESIA (2017) and 2025 ESIA update |
|
TradeTech |
Independent uranium market assessment |
Project background and study history
Aura has worked in Mauritania since 2008. The Project grew out of regional surveys under the PRISM programme, started in 1999 by the Mauritanian Ministry of Petroleum, Energy and Mines. The French Geological Survey (BRGM) and the British Geological Survey carried out much of that work. Their airborne radiometric surveys mapped uranium anomalies across the Reguibat Craton. Aura bought the PRISM database, identified the strongest anomalies and secured tenure over them. The Tiris deposits correlate closely with those anomalies.
Tiris is in the Tiris Zemmour region of north-eastern Mauritania. It will be Mauritania's first uranium mine and one of the first new mines of scale in the country in close to two decades.


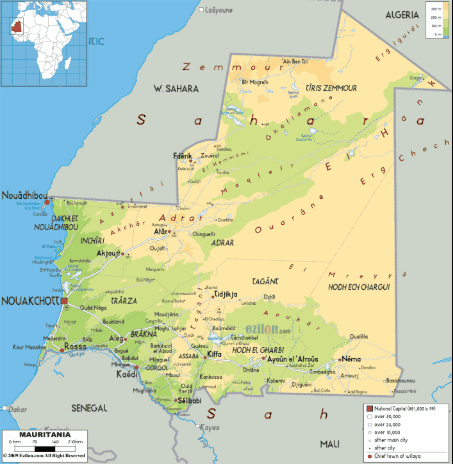
Figure 4: Tiris Project Overview
Mining and other extractive industries made up about 76% of Mauritania's exports in 2023, according to the Extractive Industries Transparency Initiative (EITI). They also made up close to one-fifth of the economy. Iron ore from Zouérat, gold from Tasiast and copper from Akjoujt lead the sector. Tiris will add uranium to that base.
Ownership
Tiris Ressources SA holds 100% of the Project. Aura Energy Mauritania Pty Ltd, a wholly owned subsidiary of Aura, owns 85% of Tiris Ressources SA. The State agency ANARPAM holds the remaining 15% on behalf of the Mauritanian State. The State's interest is free-carried and cannot be diluted.
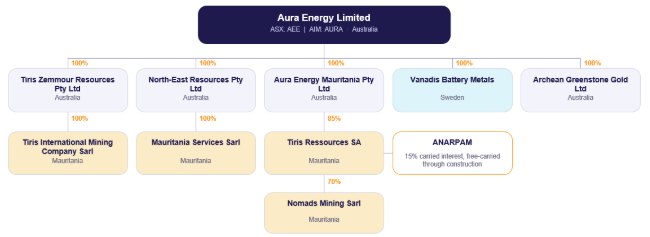
Figure 5: Tiris Uranium Project ownership structure
Discovery and production concept
Aura's metallurgical work established early that the Tiris uranium occurs as very fine-grained carnotite, loosely attached to the surfaces of barren host-rock grains. Simple scrubbing and wet screening therefore concentrate about 90% of the uranium into a small fine fraction. Alkaline leach tests on that fraction extracted more than 90% of the uranium. These two results define the simple beneficiation and alkaline leach flowsheet that underpins the Project.
Study history
The Project has advanced through a sequence of increasingly detailed studies, summarised in Table 7. Each study has expanded the Mineral Resource, the mine life and the level of engineering definition.
Table 7: Evolution of Tiris studies
|
Year |
Study |
Key outcomes |
|
2014 |
Scoping Study[4] |
Initial concept; 1 Mtpa mine and plant |
|
2019 |
Definitive Feasibility Study |
1.25 Mtpa mined, 0.23 Mtpa processed, 0.8 Mlb pa; capex US$62.9M; 12.4 Mlb over 15 years; maiden Ore Reserve 10.9 Mt at 336 ppm |
|
2023 |
Enhanced Definitive Feasibility Study |
1.25 Mtpa mined rising to 4.1 Mtpa from year 3, 2.0 Mlb pa; revised mine plan and costs; 25.5 Mlb over 16 years; capex US$178.2M; NPV8 US$226M at US$65/lb; Ore Reserve 40.4 Mt at 254 ppm |
|
2024 |
FEED Study |
4.1 Mtpa mined, 1.9 Mlb pa; 30.1 Mlb over 17 years |
|
2024 |
Updated Production Target (FEED update) |
4.1 Mtpa mined, 1.8 Mlb pa; 43.5 Mlb over 25 years; capex US$230M; NPV8 US$499M at US$80/lb |
|
2025 |
Basic Engineering Study |
Advanced engineering definition |
|
2026 |
Bankable Feasibility Study |
This Announcement |
Key changes since the September 2024 update
The BFS keeps the production base broadly unchanged but re-bases costs on the current engineering. It also reflects three technical changes that materially reshape the Project:
- Dewatering: The fine fraction of Tiris ore is dominated by active clays. The finer 75 μm screen cut adopted for the BFS, in place of 150 μm, concentrates these clays in the leach feed. Test work showed that pressure filtration would require a significant number of pressure filters (the previously adopted technology) before and after the leach, which was both technically uncertain and uneconomic. The BFS replaces pressure filtration with two-stage decanter centrifuges before the leach, and with sand addition, ATA-conditioned horizontal vacuum belt filtration (HVBF) after it.
- Mining sequence: The mine plan now mines Lazare North and Lazare South first. Lazare is the most intensively drilled and metallurgically tested part of the resource, so the best-understood ore goes through the plant during commissioning and ramp-up. An autonomous electric truck fleet has been incorporated into the mine design.
- Pilot plant: A pilot plant processing more than 80 tonnes of Tiris ore will confirm the selected flowsheet under continuous operating conditions, commencing in November 2026.
Location, tenure, access and permitting
Location and access
The Project is in the Sahara Desert in north-eastern Mauritania, about 665 km by desert track north-east of the regional mining town of Zouérat. It covers the Eastern Tiris resource, which contains the Lazare North, Lazare South, Sadi, Hippolyte North, Hippolyte South, Hippolyte East, Hippolyte West and Marie deposits. The deposits span about 70 km east–west and 36 km north–south, at 320 m to 340 m above sea level. The terrain is flat, with scattered linear sand dunes. The process plant will be built in the Lazare area.
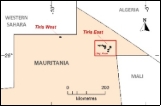
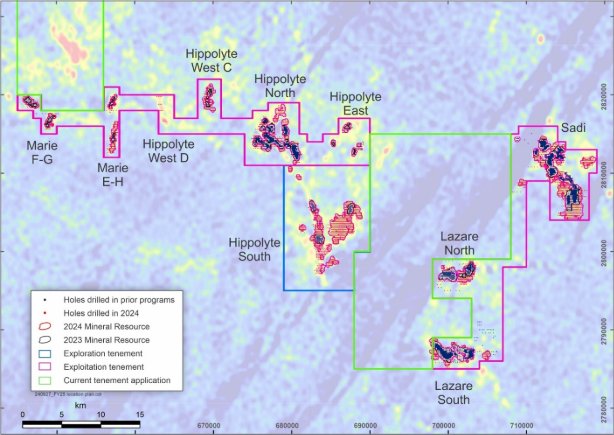
Figure 6: Tiris Project location & deposits
The Oum Ferkik resource, several hundred kilometres to the north-west, is held under a separate application and is not part of the Project.
Access is by the N1 sealed highway from the port of Nouakchott to Zouérat, about 782 km. From Zouérat, a 665 km desert track leads to site. The total distance is about 1,447 km. The workforce will be bussed to site from Zouérat on rotating rosters.
The climate is hyper-arid. Annual rainfall is rarely above 20 mm and falls to under 10 mm in the east. Daytime temperatures can exceed 50°C in summer, and night-time temperatures can fall below 10°C in winter. Aura's weather station near Hippolyte has been recording since June 2017. It shows about 3,251 hours of sunshine a year, which is about 74% of daylight hours. IRENA rates areas with yearly solar energy of 2,200 kWh/m² or more as highly favourable.
Algeria and Mauritania are building a sealed highway between Tindouf and Zouérat. Once complete, it will replace about 200 km of the current unsealed access road. The cost estimate assumes no benefit from this road, because its completion date is outside Aura's control.
Tenure
The Project is held under two exploitation permits granted by the Prime Minister on 28 January 2019, each for a 30-year term. The term runs from receipt of the grant decree on 8 February 2019. The permits cover a combined 397 km².
Table 8: Tiris tenure schedule
|
Permit |
Name |
Type |
km² |
Holder |
Grant |
Expiry |
Deposits |
|
2492C4 |
Oued El Foule Est |
Exploitation |
190 |
Tiris Ressources SA |
8 Feb 2019 |
8 Feb 2049 |
Hippolyte North, East & West; Marie |
|
2491C4 |
Ain Sder |
Exploitation |
207 |
Tiris Ressources SA |
8 Feb 2019 |
8 Feb 2049 |
Lazare North, Lazare South, Sadi |
|
2365B4 |
Oued El Foule Sud |
Exploration |
166 |
Aura Energy Limited |
4 Dec 2023 |
4 Dec 2026 (renewal submitted) |
Hippolyte South |
|
2490C4 |
Oum Ferkik |
Exploration (exploitation application lodged) |
60 |
Tiris Ressources SA (100%) |
19 May 2017 |
Pending approval of exploitation permit application |
Oum Ferkik (not part of the Project) |
The Hippolyte South ore deposit lies within the Oued El Foule Sud exploration permit, held by Aura Energy Limited. That permit expires on 4 December 2026 and an application for its renewal, with a 25% area reduction, has been lodged. An exploitation permit will be required before Hippolyte South can be mined. There is no certainty that the renewal, or an exploitation permit, will be granted or granted on acceptable terms. Hippolyte South ore is first scheduled in about year 18 of the mine plan.
Mining Conventions and fiscal terms
Aura and the Mauritanian State signed a Mining Convention for each exploitation permit on 27 January 2023. The Conventions remain in force until the permits expire, thereby stabilising the fiscal and customs terms for that period. The main terms applied in the Financial Model are:
- State interest: 15% held by ANARPAM, free-carried and non-dilutable.
- Royalty: 3.5% of the FOB value of uranium sold, stabilised for the life of the permits.
- Corporate income tax: 25%, after a 36-month tax holiday from the start of production. A minimum flat tax of 1.75% of turnover applies after the holiday and is creditable against income tax in the same year.
- Capital allowances: Development capital is written off for tax over three years, starting when the tax holiday ends.
- Customs and VAT: Imported goods on the approved mining list are exempt from customs duty and import VAT. Exports carry a refundable VAT credit.
- Withholding tax: 10% on dividends paid to non-residents.
- Community contributions: US$200,000 in the first production year, then 2% of annual net profit for local development in Tiris Zemmour, plus infrastructure contributions set by production band.
- Commitments: The permit decrees require production to start within 24 months of the grant decree and set a minimum production commitment of 1 Mlb a year. Production has not commenced within that period. The company maintains regular communication and reporting with the Mauritanian authorities on the schedule of activities being undertaken to finalise project financing and pave the way for the commencement of construction.
Permits and approvals
The principal approvals required to develop the Project have been granted, with a number of routine construction and operating permits (including water abstraction, uranium transport & export) expected to be granted in a timely manner. The Environmental and Social Impact Assessment (ESIA) was approved on 5 October 2017. ARSN, the national radiation authority, authorised the development, mining and production of uranium oxide concentrate on 12 July 2024.
An update to the ESIA was lodged with the Ministry of Environment on 23 April 2025 to reflect the larger Project. The Ministry's review report was received on 2 October 2025, and Aura is completing its recommendations. Because the 2017 approval remains in force, the update is treated as a revision to an existing approval, not a new application.
Geology and Mineral Resource
Regional and local geology
The Project lies in the north-eastern, Palaeoproterozoic part of the Reguibat Shield, within the West African Craton. The shield is made up mainly of granites, metasediments and metavolcanics. It is bounded by the Taoudeni Basin to the south, the Tindouf Basin to the north and the Mauritanide fold belt to the west.
Two main granite types occur in the resource areas. A grey granite carries about 1–2 ppm uranium. A finer-grained, foliated red granite carries 5–20 ppm uranium and is thought to be the source of the uranium in the deposits.
The resource areas lie under very flat ground, covered by desert pavement and thin wind-blown sand. The uranium occurs in weathered red granite and in gravels laid down on or near it. The mineralised gravels and weathered granite sit at the surface or under less than 30 cm of sand. They form thin, flat, continuous sheets 1 to 12 m thick over fresh granite.
Mineralisation
The uranium occurs as carnotite, a potassium uranium vanadate, possibly with some of the related calcium mineral tyuyamunite. The carnotite is mostly micron-scale. It forms fine dustings and coatings on granite fragments and in patches of calcium carbonate (calcrete).
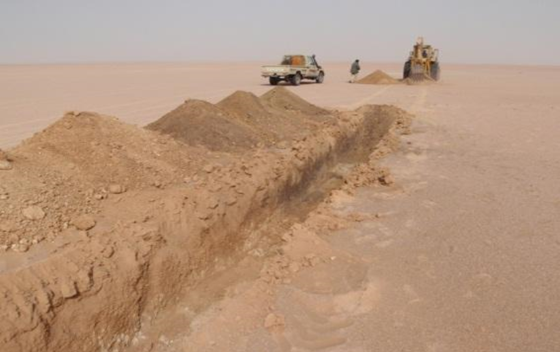
Figure 7: Typical trench showing soft sandy overburden over gravelly, free-digging calcrete ore
The deposits formed as saline groundwater leached uranium from the red granites during wetter periods over the past 2.5 million years. The most recent wet period ended about 5,900 years ago. Evaporation in the following dry periods precipitated the uranium vanadates together with carbonates, sulphates and chlorides.
Tiris differs from better-known calcrete uranium deposits such as Langer Heinrich in Namibia and Yeelirrie in Western Australia. Those are river valley-fill deposits in clays or hard calcrete below the water table. Tiris formed in shallow depressions in loose gravels and weathered granite, above the water table.
This is why the ore is loose and lies at or near the surface, so it can be dug without blasting and needs no crushing. The carnotite forms fine coatings on the gravel and granite fragments, so it separates readily from the host rock.
Drilling and data
The Mineral Resource is based on 7,844 drillholes for 43,543 m, mostly aircore, with smaller programmes of triple-tube PQ diamond core in 2017 and 2022. About 76% of holes were graded by downhole gamma logging with a disequilibrium factor applied, and the rest by chemical assay. ANSTO updated the disequilibrium work in 2022–2023.
Measured Resources are generally based on 50 m × 50 m drill spacing, Indicated on 100 m × 50 m and Inferred on 200 m × 100 m. Close-spaced patterns at 12.5 m spacing, drilled in 2017 and 2022, confirmed the spacing is appropriate for each classification.
The 2024 aircore programme of 2,995 holes for 15,262 m tested extensions to known mineralisation and new, lower-level radiometric targets. It increased Measured and Indicated Resources by 35% and Inferred Resources by 76%. The total increase of 32.4 Mlb exceeded the upper end of the 8 Mlb to 32 Mlb exploration target range reported in the Company’s ASX release dated 17 October 2023 “New Uranium Exploration Target identified at Tiris Project”.
Mineral Resource
The Mineral Resource is restated from the ASX and AIM release of 12 June 2024, "Aura increases Tiris’ Mineral Resources by 55% to 91.3 Mlbs U3O8". It was estimated by H&S Consultants and is reported at a 100 ppm U3O8 cut-off.
Table 9: Tiris Mineral Resource summary (JORC 2012) at 100 ppm U3O8 cut-off
|
Area |
Class |
Tonnes (Mt) |
|
U3O8 (Mlb) | |
|
Tiris East |
Measured |
34 |
230 |
17.3 | |
|
Tiris East |
Indicated |
48 |
212 |
22.6 | |
|
Tiris East |
Inferred |
79 |
210 |
36.7 | |
|
Tiris East |
Total |
162 |
215 |
76.6 | |
|
Oum Ferkik |
Inferred |
22 |
294 |
14.6 | |
|
All deposits |
Total |
184 |
225 |
91.3 |
Totals may not add because of rounding. The full Mineral Resource statement by deposit is set out in Appendix 1.
The total Mineral Resource is 184 Mt at 225 ppm U3O8 for 91.3 Mlb. The BFS covers Tiris East only, which contains all of the Measured and Indicated Mineral Resources. The Tiris East Mineral Resource is 162 Mt at 215 ppm for 76.6 Mlb, comprising 83 Mt at 219 ppm for 39.9 Mlb of Measured and Indicated Mineral Resources and 79 Mt at 210 ppm for 36.7 Mlb of Inferred Mineral Resources. The Oum Ferkik Resource of 22 Mt at 294 ppm for 14.6 Mlb, all Inferred, is outside the Project.
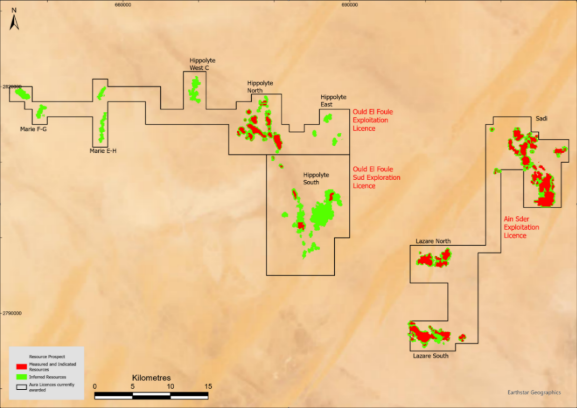
Figure 8: Tiris East Mineral Resource deposits and exploitation permits
The Company confirms that it is not aware of any new information or data that materially affects the Mineral Resource estimate, and that all material assumptions and technical parameters underpinning it continue to apply and have not materially changed.
Geometallurgy
The main economic drivers of the Tiris flowsheet are the extent of ore upgrading during screening and the management of sulphate that reaches the leach. Geometallurgical domaining predicts how these drivers vary across the resource. The domains are carried into the Mineral Resource block models, the recovery estimates and the mine plan.
The 2019 DFS test work used three process-behaviour composites built from a 2018 trench programme at Lazare North and Lazare South. For the BFS, AMC Consultants rebuilt the domaining across the whole resource using the larger assay, mineralogy and screening dataset. The new domaining is now the primary framework for the Project.
Geometallurgical groups
AMC applied a multivariate statistical method (UMAP) to calcium, aluminium and sulphur assays, which separate material mainly by its calcite, silicate and gypsum (sulphate) content. Combined with mineralogy and screening results, Aura has defined three domains:
- Domain 1 – calcium-rich. Low aluminium and sulphur; quartz, feldspar, and calcite; represents 16.1% of the mine plan. Forms the surface layer.
- Domain 2 – sulphur-rich. High sulphur, calcium and strontium from gypsum; represents 23.2% of the mine plan. Sits beneath Domain 1 where present and varies in thickness.
- Domain 3 – aluminium-rich. High aluminium, phosphorus and potassium, low sulphur and calcium; mainly quartz and feldspar; represents 60.7% of the mine plan. Forms the base of the sequence and the majority of material mined in the first years of operation.
Uranium grade shows no correlation with the domains, indicating that all three are similarly mineralised.
Mass reporting to the fine fraction falls from Domain 1 to Domain 3, while the uranium upgrade and recovery rise. The groups were coded into the block models for all main deposits, together with mass, uranium and sulphur recovery values (Table 10), determined by Aura based on scrubbing and screening test work across the three groups.
Table 10: Beneficiation performance by geometallurgical domain (P50 values) – BFS basis
|
|
Domain 1 (Ca-rich)
|
Domain 2 (S-rich)
|
Domain 3 ((Al-rich) |
Life of mine |
|
Mass to –75 μm fraction (%) |
21.4 |
11.7 |
9.9 |
12.2 |
|
Uranium upgrade factor (×) |
4.2 |
7.3 |
9.7 |
7.5 |
|
Sulphur in –75 μm fraction (%) |
0.10 |
1.69 |
0.15 |
– |
|
Beneficiation uranium recovery (%) |
89.0 |
85.0 |
95.9 |
91.9 |
|
Leach uranium extraction (%) |
same | |||
The share of each domain varies between deposits (Table 11). Sadi and Hippolyte South contain the most Domain 2 material, the Lazare deposits are dominated by Domain 3, and Hippolyte North has the highest share of Domain 1.
Table 11: Share of mine plan ore tonnes by geometallurgical domain and deposit
|
Deposit |
Domain 1 (Ca-rich) % |
Domain 2 (S-rich) % |
Domain 3 (Al-rich) % |
Ore mined (Mt) |
|
Lazare North |
11.4 |
11.5 |
77.1 |
14.6 |
|
Lazare South |
14.7 |
9.2 |
76.1 |
19.0 |
|
Sadi |
6.2 |
31.0 |
62.8 |
40.7 |
|
Hippolyte North |
41.3 |
12.1 |
46.6 |
21.1 |
|
Hippolyte South |
14.2 |
45.3 |
40.5 |
15.8 |
|
Total / life of mine |
16.1 |
23.2 |
60.7 |
111.1 |
Hippolyte East, Hippolyte West and Marie are included in the Hippolyte North block model.
Mining Plan
Mining method
Tiris will be mined by conventional, owner-operated open-cut methods. The ore is shallow, flat-lying and free-digging, so no drilling or blasting is needed. Most mineralisation lies within 6 to 8 m of surface. Excavators and wheel loaders will load road-style tipper trucks, which haul ore a short distance to the nearest beneficiation plant.
No permanent waste dumps or tailings dams are needed. Waste, coarse beneficiation rejects, and dry-filtered tailings are all returned to mined-out pits. Tailings are placed at the base of the pits and covered with rejects and waste. Clean sand is also mined to support post-leach dewatering (see “Processing”).
The mine plan uses two relocatable beneficiation plants, moved seven times over the mine life as mining moves between deposits. Hippolyte East and West ore is hauled to the Hippolyte North plant.
Pit optimisation and design
Pit optimisations used costs from the BFS Financial Model, recoveries by geometallurgical group, a uranium price of US$90/lb and a 3.5% royalty. Calculated cut-off grades were 151 ppm for Group 1, 100 ppm for Group 2 and 80 ppm for Group 3. The selected cut-offs were 150 ppm for Group 1 and 100 ppm for Groups 2 and 3.
The Mineral Resource models use 50 m × 50 m × 1 m blocks. Grade control drilling on a 10 m × 10 m pattern will define a smallest mining unit of about 200 t. Blocks with less than 4% mineralisation were excluded to allow for ore loss, which reduces the mineralised tonnage by about 1–3%.
Two sets of Whittle optimisations were run. The first included Measured, Indicated and Inferred material and guided the mine plan. The second used Measured and Indicated material to test the Ore Reserve.
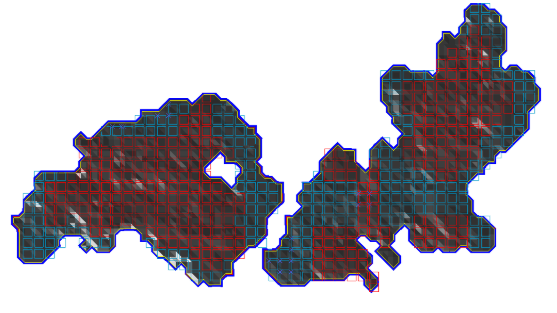
Figure 9: Lazare North mining panels
Table 12: Pit optimisation results (revenue factor 0.90 shells)
|
|
Measured, Indicated and Inferred |
Measured and Indicated only | ||||
|
|
Mt |
ppm |
Mlb |
Mt |
ppm |
Mlb |
|
Lazare North |
15.2 |
281 |
9.4 |
12.3 |
270 |
7.3 |
|
Lazare South |
17.5 |
237 |
9.1 |
12.9 |
241 |
6.9 |
|
Sadi |
39.4 |
209 |
18.1 |
26.1 |
203 |
11.7 |
|
Hippolyte North |
19.5 |
276 |
11.9 |
13.7 |
269 |
8.1 |
|
Hippolyte South |
25.2 |
199 |
11.0 |
4.1 |
216 |
1.9 |
|
Hippolyte East |
1.2 |
195 |
0.5 |
– |
– |
– |
|
Hippolyte West |
3.1 |
278 |
1.9 |
– |
– |
– |
|
Marie |
7.8 |
273 |
4.7 |
– |
– |
– |
|
Total |
128.8 |
235 |
66.7 |
69.1 |
236 |
35.9 |
Because the deposits are very shallow, detailed pit designs were not prepared. Blocks were grouped into mining panels of at least 100 m × 100 m, each large enough to be mined independently with its own access ramp. The panels and low revenue-factor shells were used to sequence mining so that higher-value ore is mined early.
Mine schedule
The schedule was built in monthly periods and it is designed to keep the leach circuit fed at its design rate of 550,000 t/year by varying mining and beneficiation rates to suit the different reject rates of each group.
The mine plan delivers 111.1 Mt of ore at 225 ppm U3O8, containing 55.1 Mlb, over 26 years (2029–2054). Leach feed ends in the same year as mining, with no separate stockpile rehandling period. About 111.4 Mt of waste and 12.8 Mt of overburden are mined, a strip ratio of 1.00:1 (1.12:1 including overburden). Including beneficiation reject, total material movement is about 333 Mt.
Lazare North and Lazare South are mined first. Inferred material makes up about 11% of ore mined in the first five years, about 23% cumulatively to year 10 and about 27% cumulatively to year 15. The share rises in later years as mining moves to Hippolyte North (from year 15) and Hippolyte South (from year 18), and Hippolyte South is mostly Inferred. Over the mine life, 33% of ore mined is Inferred. No conversion factor has been applied to the Inferred material.
Table 13: Mine plan by deposit and Resource category
|
Deposit |
Lazare North |
Lazare South |
Sadi |
Hippolyte North |
Hippolyte South |
Hippolyte East & West |
Marie |
Total |
|
Measured (Mt) |
3.7 |
7.9 |
10.5 |
9.4 |
– |
– |
– |
31.5 |
|
Indicated (Mt) |
9.5 |
6.1 |
18.0 |
5.4 |
4.2 |
– |
– |
43.1 |
|
Inferred (Mt) |
1.4 |
5.1 |
12.2 |
6.3 |
11.5 |
– |
– |
36.5 |
|
Total ore (Mt) |
14.6 |
19.0 |
40.7 |
21.1 |
15.8 |
– |
– |
111.1 |
|
Grade (ppm U3O8) |
258 |
226 |
201 |
266 |
199 |
– |
– |
225 |
|
Contained U3O8 (Mlb) |
8.3 |
9.5 |
18.0 |
12.4 |
6.9 |
– |
– |
55.1 |
|
Waste (Mt) |
13.7 |
24.8 |
38.7 |
19.3 |
14.9 |
– |
– |
111.4 |
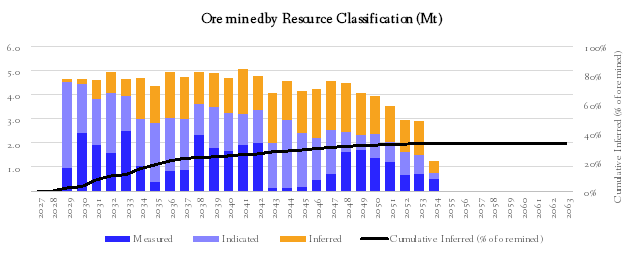
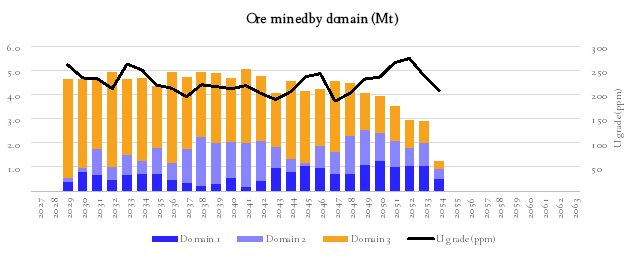
Figure 10: Ore mined by Resource category and cum. Inferred proportion (top) and by geomet domain and uranium grade (bottom)
Table 14: Mine Plan by % Inferred
|
Years |
1-5 |
6-10 |
11-15 |
16-20 |
21-25 |
26+ |
Total |
|
Ore Reserve mined (Mt) |
20.8 |
15.4 |
15.2 |
12.5 |
9.8 |
0.7 |
74.6 |
|
Inferred Resources mined (Mt) |
2.7 |
8.2 |
8.2 |
9.4 |
7.5 |
0.5 |
36.5 |
|
Total Mined (Mt) |
23.5 |
23.7 |
23.5 |
22.0 |
17.3 |
1.3 |
111.1 |
|
Inferred Resources in period (%) |
11% |
35% |
35% |
43% |
43% |
41% |
33% |
|
Cumulative Inferred Resources (%) |
11% |
23% |
27% |
31% |
33% |
33% |
|
Inferred material outside the mine plan and production target
The pit shells that guided the mine plan (Table 12) contain more uranium than the mine plan extracts. A schedule that mined all of the material inside those shells would deliver about 23.6 Mt more ore at 226 ppm U₃O₈, containing 11.7 Mlb (5.3 kt) more U₃O₈. All of this additional material is Inferred Mineral Resource. It lies at Marie, Hippolyte West and Hippolyte East, which hold only Inferred Mineral Resources, and in the Inferred part of Hippolyte South that the mine plan does not reach (Table 15).
Table 15: Inferred Mineral Resources within the pit shells but outside the mine plan
|
Deposit |
Ore (Mt) |
Grade (ppm U₃O₈) |
Contained U₃O₈ (Mlb) |
|
Hippolyte South (remaining Inferred) |
10.5 |
188 |
4.4 |
|
Hippolyte East |
1.3 |
188 |
0.6 |
|
Hippolyte West |
3.4 |
263 |
2.0 |
|
Marie |
8.3 |
264 |
4.8 |
|
Total |
23.6 |
226 |
11.7 |
Figures are rounded, which may cause small differences in totals. Tonnes and grades are as scheduled, including dilution and ore loss.
The Company has scheduled the mine plan so that Inferred Mineral Resources do not form a substantial proportion of the production target in any year (see Cautionary Statement). Inferred material already makes up about 43% of ore mined in years 16 to 25 (Table 14). The material in Table 15 could only be mined at the end of the schedule, once the Ore Reserves are exhausted. Adding it would extend mining by about five years, and Inferred material would make up well over half of the ore mined in those final years. The Company has therefore excluded it from the production target.
The Company acknowledges that the scheduling approach set out in the Cautionary Statement, together with the current Inferred classification of this material, prevents its inclusion in the mine plan and production target. The material remains part of the Tiris East Mineral Resource and lies within the pit shells used for this Study. Aura expects it to be the subject of further drilling and resource work. There is no certainty that this work will result in Indicated or Measured Mineral Resources, or that the material will be included in a future production target.
Mining fleet and workforce
The BFS assumes an owner-operated, electric-powered and autonomous trucking fleet, with all other vehicles as a diesel-powered, manned fleet. Equipment pricing came from global mining equipment suppliers. The fleet is purchased outright and replaced as equipment reaches its recommended life.
Table 16: Mining equipment fleet
|
Equipment |
Peak fleet |
Total purchased over life of mine |
|
Excavators |
5 |
13 |
|
Wheel loaders |
8 |
25 |
|
Haul trucks (electric and autonomous) |
23 |
78 |
|
Bulldozers |
4 |
13 |
|
Graders |
4 |
10 |
|
Compactor |
1 |
4 |
|
Water trucks |
7 |
25 |
Mining capital totals US$108.7 million over the life of mine, of which US$24.1 million is initial. Mining operating cost is US$327.4 million, or US$1.47 per tonne mined. Fuel and labour are the largest components.
Ore Reserve
The BFS is underpinned by an updated Ore Reserve, estimated for this Announcement in accordance with the JORC Code (2012). The Ore Reserve is 74.6 Mt at 227 ppm U3O8 for 37.3 Mlb U3O8. Of this, 31.5 Mt at 237 ppm for 16.4 Mlb is Proved and 43.1 Mt at 219 ppm for 20.8 Mlb is Probable. This compares with the previous Ore Reserve of 62.8 Mt at 243 ppm U3O8 for 33.6 Mlb, reported on 16 December 2024.
The updated Ore Reserve applies the BFS capital and operating costs, the revised flowsheet, beneficiation recoveries by geometallurgical group and a uranium price of US$90/lb U3O8, at cut-off grades of 150 ppm U3O8 for Group 1 and 100 ppm U3O8 for Groups 2 and 3. Only Measured and Indicated Resources were converted to Ore Reserve; Inferred material within the mine plan was assigned zero revenue. The Ore Reserve alone supports a mine life of 18 years. Further detail is given in Appendix 2 and Appendix 3.
Table 17: Tiris Ore Reserve (JORC 2012) at 150 ppm (Group 1) and 100 ppm (Groups 2 and 3) U3O8 cut-off
|
Deposit |
Proved - Mt |
ppm | Mlb | Probable - Mt | ppm |
Mlb |
Total - Mt |
ppm |
Mlb |
|
Lazare North |
3.7 |
293 |
2.4 |
9.5 |
246 |
5.1 |
13.2 |
259 |
7.5 |
|
Lazare South |
7.9 |
239 |
4.2 |
6.1 |
220 |
2.9 |
14.0 |
231 |
7.1 |
|
Hippolyte |
9.4 |
254 |
5.2 |
9.6 |
245 |
5.2 |
19.0 |
249 |
10.4 |
|
Sadi |
10.5 |
201 |
4.7 |
18.0 |
191 |
7.6 |
28.5 |
195 |
12.2 |
|
Total |
31.5 |
237 |
16.4 |
43.1 |
219 |
20.8 |
74.6 |
227 |
37.3 |
Tonnages include mining dilution; totals may not add because of rounding.
Metallurgy
Metallurgical test work on Tiris ore has run continuously since 2011, across 27 test programmes. Laboratories and vendors include ANSTO Minerals, RCS/Acclarium, Clean TeQ Water, Vietti Slurrytec, ENPROTEC and Jord International. The test work established the flowsheet and the design parameters summarised in Appendix 4: Material assumptions.
Recovery basis
The BFS adopts an overall recovery from ore mined to final product of 83.7% as an average over the life of mine. Beneficiation recovers 91.9% of the uranium, and the hydrometallurgical plant recovers 91.1% of the uranium in the leach feed average of the LOM, or 91.5% at steady state.
Mineralogy
Uranium is hosted solely in carnotite, with grains finer than 5 μm that are well liberated by scrubbing. The gangue is dominated by carbonate minerals (calcite and strontianite), with sulphate minerals (gypsum and celestine) and clays. Because carbonate minerals dominate, alkaline leaching is preferred to acid leaching, which would consume large amounts of acid.
Beneficiation
The breakthrough for Tiris was finding that screening concentrates most of the carnotite into a small fine fraction. Screening the washed ore recovers more than 91% of the uranium into 12% of the ore mass (life of mine average) at a cut size of 75 µm. Sulphate minerals, which consume leach reagent, tend to report to the coarse fraction and are rejected. In the plant, trucks tip ore over a 200 mm grizzly into a feed hopper. No feeder-breaker is needed because the ore is loose. A rotating drum scrubber washes the carnotite off the coarser particles in about one minute. A hydrocyclone recovers water from the fine-screen oversize. A thickener at each beneficiation plant recovers more water before the slurry is pumped to the Processing Plant. Each beneficiation plant (2.5Mtpa design capacity) is built as modules on skids or trailers, so it can be moved. The mine schedule allows 30 days of downtime for each move.
Leaching
Alkaline leaching with sodium carbonate and bicarbonate at 80°C extracted 96% of the uranium from the Lazare composites. Most extraction occurred within four hours, and the design residence time is 12 hours. Sodium carbonate consumption rises in line with the sulphate content of the leach feed. The plant leaches in six stirred tanks in series. Hot slurry leaving the leach heats the incoming feed by direct contact. This avoids heat exchangers, which would scale up. The same method is used at Langer Heinrich. Steam injection supplies the rest of the heat.
Solid–liquid separation
The combination of a finer screen cut and the mix of geometallurgical domain ore in feed can send more clay to the leach. The clays in the fine fraction are about 90% illite and mica, which consolidate poorly and break down further during leaching. Test work found that clay stability, and with it dewatering performance, is impacted by the salinity (total dissolved solids) of the process solution.
Pressure filters could form competent cakes only with a silica additive at up to half the solids mass. At the finer cut, the Project would have needed six very large filter presses ahead of the leach and thirteen after it, adding significant cost to the process. Pressure filtration was therefore replaced:
Before the leach – two-stage decanter centrifuges. Bench spin tests produced clear water and cakes of 47–52% solids. Two stages reduce chloride below the 2 g/L limit needed for ion exchange. Each stage has three units. Recycled sodium carbonate is added between the stages. It turns gypsum into sodium sulphate, which dissolves and is washed out before the leach. This reduces the amount of fresh sodium carbonate needed.
After the leach – ATA conditioning and three horizontal vacuum belt filtration (HVBF) units, operating in parallel. Clean TeQ Water's Activator-Tether-Anchor (ATA®) chemistry binds the fine clays to added coarse sand, forming a free-draining structure that washes and filters well. It produces a stackable cake of about 67% solids in one step, rising to 78–79% with Jord International's Viper vibration technology. Counter-current wash tests recovered 97.6–97.8% of the soluble uranium.
ATA+HVBF was the only option shown to be robust across the full range of ore variability. While ATA has not yet been used at a commercial uranium operation, the use of HVBF is common in the mining industry. Clean TeQ Water has run more than 100 bench filtration tests on Tiris material and is delivering a 750,000 t/y ATA+HVBF plant at the Rasp mine at Broken Hill.
The pilot plant operation, to commence in November, also includes two-stage centrifugation for pre-leach and HVBF and ATA on post-leach to confirm the assumptions on Tiris ore.
Uranium recovery and Yellowcake production
Uranium is recovered from the leach solution by moving-bed ion exchange (MBIX), using Clean TeQ Water's continuous system. It replaces the fixed-bed ion exchange assumed in earlier studies. MBIX improves solids tolerance, resin use and reagent and water consumption.
The MBIX circuit has four columns. Resin moves between them by airlift about once an hour. The uranium is eluted with sodium bicarbonate and precipitated with sodium hydroxide as sodium diuranate. It is then purified and precipitated again as uranium peroxide. The product is dried in a fluid-bed dryer and packed into drums in a secure building. Test work product met ASTM specifications.
Pilot plant
The Tiris Optimised Pilot Plant (TOPP) is a purpose-built, modular demonstration plant at Bir Moghrein that replicates the full commercial Tiris flowsheet at pilot scale, at about 1/470th of the commercial plant’s mass throughput. The flowsheet employs proven and widely used mineral processing and uranium recovery technologies, making TOPP a confirmation programme instead of a technology development project.
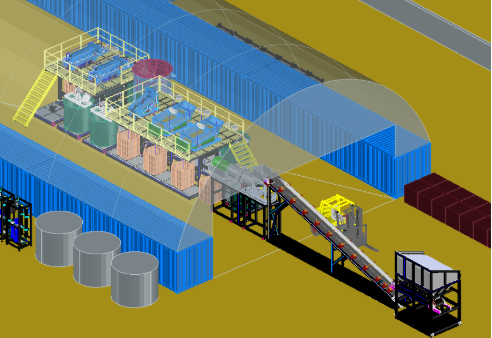
Figure 11: TOPP operation overview
The pilot plant is a small copy of the full plant. It runs the principal processing steps in series. First, the ore is washed and screened. Then the uranium is dissolved out. Then the solids are filtered off. Finally, the uranium is collected from the liquid. Water and reagents are cleaned and reused, just as they will be in the full plant. Product purification of the eluate into uranium oxide concentrate will be undertaken at a licensed laboratory outside Mauritania to demonstrate product quality to prospective offtake partners.
More than 80 tonnes of Tiris ore will be tested. Some comes from each main ore type. The rest is a mix that matches the ore planned for the first five years. The pilot is built in two parts:
- Module A – beneficiation and pre-leach dewatering: scrubbing, screening and centrifuge dewatering at up to 1 t/h upgrade the ore, rejecting about 90% of the mass as barren residue and concentrating the uranium into a small, high-grade leach feed; and
- Module B – hydrometallurgy: carbonate leach, ATA and horizontal vacuum belt filtration, MBIX recovery and nanofiltration reagent recycle, operated at about 150 kg/h to prove out the recycle and impurity build-up behaviour that carries most of the process risk;
Equipment is scheduled to be on site at Bir Moghrein in October 2026, with operation commencing in November 2026, in time for potential financiers to present the results to their credit committees.
Changes from the 2024 FEED Study
The following provides a summary of the main process changes from the 2024 FEED study to the BFS:
Table 18: Changes to the process design since the 2024 FEED
|
Area |
2024 FEED |
2026 BFS |
Reason |
|
Screen cut |
150 μm |
75 μm |
Higher upgrade and mass rejection |
|
Pre-leach dewatering |
Pressure filtration |
Two-stage decanter centrifuge |
Pressure filtration uneconomic with clay-rich fines |
|
Leach heating |
Spiral heat exchangers |
Direct-contact flash-splash heat recovery |
Avoids scaling of heat-transfer surfaces |
|
Post-leach dewatering |
Pressure filtration |
ATA® + horizontal vacuum belt filter |
Robust across ore variability; stackable cake in one step |
|
Ion exchange |
Fixed bed |
Moving bed (MBIX) |
Better solids tolerance, higher uranium solution concentration, lower reagent and water use |
|
Reagent recovery |
– |
Nanofiltration |
Recovers sodium carbonate; reduces fresh reagent |
Process plant and engineering design
The process facilities have a hub-and-spoke layout. Two relocatable, modular beneficiation plants sit close to the active pits and feed a single permanent hydrometallurgical plant at Lazare North. Beneficiated slurry, recycled water and raw water move between the sites by pipeline. This layout suits Tiris because 88% of the ore mass is rejected as barren coarse material during beneficiation. Siting the beneficiation plants next to the deposits reduces ore haulage and the return of rejects to pit voids.
Table 19: Process design summary
|
|
Unit |
Value |
|
Beneficiation plants |
number |
2, relocatable |
|
Design throughput per beneficiation plant |
Mtpa |
2.5 maximum (418 t/h) |
|
Screen cut (after three stages) |
μm |
75 |
|
Leach design capacity |
t/yr beneficiated feed |
550,000 (about 70 t/h) |
|
Leach temperature |
°C |
80 |
|
Leach residence times |
h |
12 |
|
Drying and packaging capacity |
Mlb/yr U3O8 |
3.5 |
|
Average leach feed grade (life of mine) |
ppm U3O8 |
1,697 |
|
Overall uranium recovery |
% |
83.7 |
Figure 12: Tiris process flowsheet
Plant layout and engineering
Aura issued General and Process Design Criteria to its engineering and mining consultants as the formal basis of design. The engineers prepared the mass balance, process flow diagrams, mechanical equipment list and electrical load list. A PLC-based control system with remote access will allow operations to be supervised and supported off site, in conjunction with its autonomous haulage fleet and remote operations centre in Nouakchott.
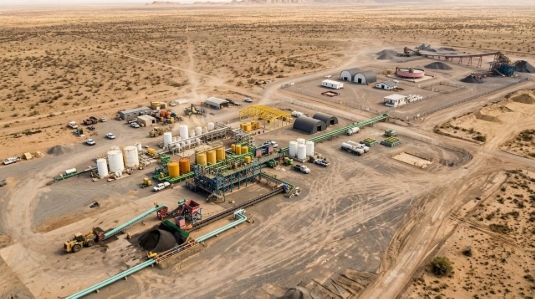
Figure 13: Conceptual 3D rendering of permanent process plant general arrangement
Infrastructure
Tiris is remote, so the operation is largely self-contained. Infrastructure is designed to be transportable, quick to erect and suited to a hot, dusty desert environment.
Power & Steam
Power and process steam will be supplied by an independent power producer (IPP) under a long-term power purchase agreement (PPA). The IPP will fund, build, own and operate the generation facility, so power generation carries no development capital for Aura and is included in operating costs.
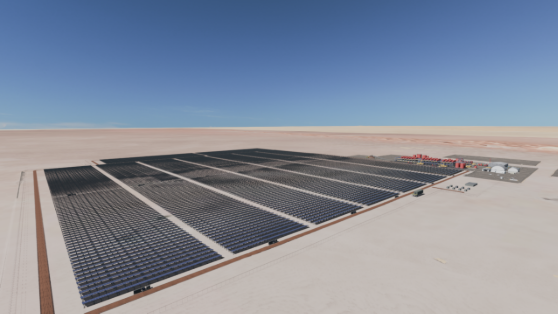
Figure 14: Conceptual solar field layout (processing plant in background)
Aura ran a competitive request for proposal and received four proposals. Two configurations are being taken forward: a conventional solar PV and battery system, and a solar PV and battery system combined with solar thermal generation to supply process heat. Both include diesel generation for backup. Aura expects to select a preferred supplier and execute the PPA in Q1 2027.
The BFS adopts the following design basis, which applies to either configuration: the processing plant and infrastructure average demand of 8-9 MW, and mining fleet charging with an average demand of 8-9 MW. Separately, there is leach heat requirement of about 3–4 t/h of steam.
The BFS assumes an all-in electricity cost of US$0.15/kWh and a steam cost of US$92/t (via diesel-powered boilers), in real terms over the life of mine, including diesel for backup generation. These figures reflect Aura's evaluation of the proposals on a common 25-year basis. The final cost will depend on the configuration selected, the final load and the negotiated terms, and may differ materially. Aura's capital estimate includes site preparation, access and the connecting powerline for the power facility.
Table 20: Power summary assumptions for BFS
|
Parameter |
Value |
|
Power |
IPP-supplied solar-based hybrid under a build-own-operate PPA |
|
Electricity cost assumed |
US$0.15/kWh |
|
Steam cost assumed |
US$92/t steam |
Water
The Project needs about 56 L/s of water, or about 1.8 GL a year, for processing, processing plant and administration site dust suppression and camp use. There are two defined borefields: C22, about 20 km west of the plant, and a larger borefield in the Taoudeni Basin, about 120 km to the south. Groundwater modelling indicates the Taoudeni borefield could sustainably supply up to 74 L/s, with the potential to increase to 100 L/s, and C22 up to 63 L/s with additional bores. The recharge rate of the C22 field is not well defined and is therefore assumed to be available only for supplementary water supply.
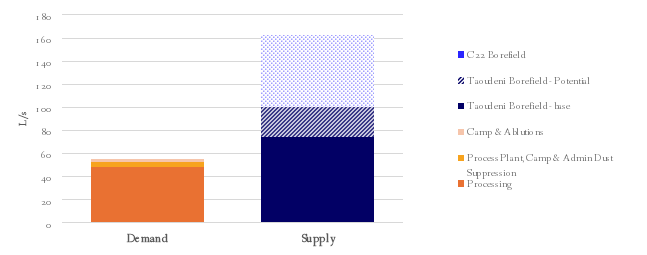
Figure 15: Water demand and supply profile
It is assumed that RO brine will be used for mine dust suppression.
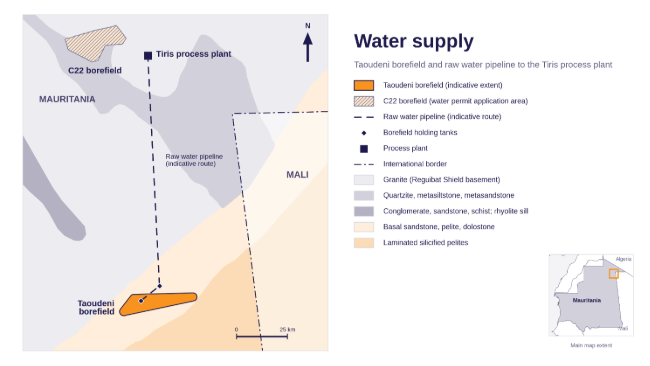
Figure 16: Indicative borefield layout relative to Tiris project & process plant
Bore water will be treated by reverse osmosis (RO) for potable and process use. The capital and operating cost for the borefield, pipeline and RO treatment have been included in the BFS capital cost estimate.
Access and logistics
Three routes were assessed for construction freight: through Nouakchott port and the N1 highway; through Nouadhibou port and the SNIM railway; and through the Algerian port of Oran. The Nouakchott route is the base case.
Before construction, Aura will mark the 665 km desert track every 250 m and replace soft-sand sections with compacted crushed rock, so trucks can reliably reach site from Zouérat in two days. Oversize loads are limited to 5 m wide, 5 m high and 12 m long.
Uranium product will be trucked in sealed containers to the port of Nouakchott under military escort, with overnight stops in secure compounds. Product transport and marketing costs are estimated at US$0.93/lb.
Site facilities
Other infrastructure includes:
- Camp: A 300-person camp 3.3 km north-east of the plant, built in two phases (a 70-person pioneer camp and a 230-person main camp). Construction contractors will use a temporary camp during the construction period. It is assumed the IPP will use Aura’s camp during their construction period and will also accommodate the IPP plant operations and maintenance workforce.
- Airstrip: A daylight airstrip about 1.5 km from the plant for light aircraft and medical evacuation. ANAC has approved the site. The existing Shield Mining airstrip, 152 km away, will be used until the new airstrip is complete.
- Buildings: Fabric-dome workshops and warehouse, and flat-pack offices, laboratory and change rooms, chosen to minimise concrete and speed up construction.
- Communications: VSAT satellite communications with Wi-Fi across site.
- Off-site / Remote Operations Centre. An office, guest house and secure compound in Zouérat, and a remote operations centre, likely in Nouakchott.
Environment, social and governance
The Project is being developed to Mauritanian law and to international good practice, including the IFC Performance Standards, the Equator Principles and the radiation protection guidance of the IAEA and ICRP. As Mauritania's first uranium project, particular attention is given to radiation protection and to the safe and secure handling of uranium product.
ESIA
Earth Systems prepared the original Environmental and Social Impact Assessment (ESIA), which was lodged in May 2017 and approved in October 2017. In accordance with good practice, and due to the growth of the project’s scale, Aura worked with the Ministry of Environment to submit a revised ESIA in 2025. The 2025 update reflected the larger Mineral Resource, the 4.1 Mtpa hub-and-spoke plan, the longer mine life and updated infrastructure, including a renewable power solution. The Ministry provided feedback in October 2025, with recommendations currently underway and completed prior to operation in collaboration with the Ministry.
Setting
The Project is in a hyper-arid, uninhabited part of the Sahara, historically a military zone. There are no permanent settlements, protected areas or critical habitat nearby, no surface water use and no need for resettlement. The nearest Important Bird Area, at Chegga, is about 130–159 km away and is not affected by water abstraction. A 2026 archaeological survey of the plant, camp, airstrip and water pipeline corridor, and selected areas at Sadi and Hippolyte, found no archaeological remains within any planned infrastructure footprint; ten sites (nine protohistoric tumuli and one Muslim grave) lie alongside the footprints and are to be preserved. A heritage monitoring MOU was signed with IMRFPC in February 2026.
Impact assessment
The ESIA concludes that residual impacts after mitigation are mostly low or lower, and none are rated high. A small number are rated moderate: dust during operations, road transport of product, occupational health and safety, and groundwater demand. Economic development is rated moderate positive.
Radiation management
Uranium ore is naturally occurring radioactive material. The Project creates no new radiation sources. The ore is low in thorium, and the product is a stable oxide transported as Class 7 material. Radiation protection follows the ICRP principles through a Radiation Management Plan approved under Mauritania's Nuclear Energy Law.
Water
Knight Piésold found no groundwater-dependent ecosystems or existing users in the borefield areas. Community water points within about 40 km down-gradient could see minor drawdown. All final pit floors sit above the water table, and dry tailings placed in the pits are predicted to have negligible impact on groundwater. A groundwater radiological baseline is underway, and potable water will be monitored for uranium and radioactivity.
Closure and rehabilitation
Closure is primarily achieved through progressive backfilling. Fine tailings are buried at the base of mined-out pits and covered with coarse rejects and waste, returning surface radiation to below pre-mining levels. Landforms are then graded and revegetated with local species chosen with nomadic groups. Modular plant and camp buildings are removed at closure. The design goal is no permanent change to the natural landform. Closure and rehabilitation costs of US$20 million are included in the Financial Model.
Management systems and engagement
The Environmental and Social Management and Monitoring Plan sits over a suite of management plans covering radiation, closure, stakeholder engagement, transport, occupational health and safety, emergency response and security. Plans for water, waste, greenhouse gas, tailings, air quality, chemicals and biodiversity are being prepared.
Stakeholders include national and regional government, ANARPAM, the military, nomadic herders, artisanal miners at Gleib Ndour and the Zouérat community. A grievance mechanism aligned with IFC standards is in place.
Contribution to Mauritania
Tiris will deliver significant benefits to Mauritania through the State's 15% free-carried interest, royalties, corporate tax, withholding tax and community contributions. It will employ up to about 438 people and will run a Mauritanisation programme to replace expatriate staff over time. A community development fund will receive US$200,000 in the first year of production, then 2% of net profit.
- Royalties: 3.5% of the FOB value of product sold, payable from first production regardless of profitability. About US$143 million over the mine life, or US$5.5 million a year.
- Jobs: A peak construction workforce of about 600 people on site (including the owner’s team) and about 438 operating roles (381 at commencement of operations). Wages of about US$191 million over the mine life are included in operating costs.
- Communities: Community contributions of about US$35.6 million over the mine life, included in all-in sustaining cost.
- Tax: Corporate tax of 25% after a 36-month tax holiday. Tax is first paid in 2036, once construction-related tax losses are used, and totals about US$377 million, or about US$18.9 million a year over the 20 years in which it is paid. Withholding tax of 10% on dividends paid to Aura adds about US$126 million.
- State dividends: ANARPAM’s 15% free-carried interest is expected to receive about US$222 million in dividends from surplus cash flow.
Aura intends to go further than conventional obligations. Its goal is to transfer more than 90% of the expatriate leadership roles across its Mauritanian operations to Mauritanian nationals by 31 December 2031. The transition is staged. By the final investment decision, Aura aims to identify Mauritanian candidates with the potential to succeed to leadership roles. Of these, 4–5 are expected to join before 31 December 2026, in the Technology Centre and in data architecture, the foundation of the Company's Digitalisation Strategy. The first transfers, by 31 December 2029, will be the executive roles that shape the Company's strategy, culture and long-term sustainability in Mauritania. Many of the expatriates whose roles transfer are expected to move to Aura's head office or to other Company projects, such as Häggån.
Much of the groundwork is already in place. Aura has identified a talent pool of some 230 Mauritanians interested in careers in digitalisation and automation. From this pool it has shortlisted 4–5 leadership successors for proposed Technology Centre and data architecture roles. The Company has also developed an eight-week induction programme that introduces new recruits to the Tiris resource and the uranium hydrometallurgical flowsheet. A first trial of the programme has been completed, and its lessons are being built into the next intake. Together, these steps deliver on a commitment Aura made to Mauritanian ministers in June 2026: to develop young Mauritanians for careers in a digitalised mining industry.
Our ambition for Tiris is bigger than a single well-run mine. We aim to build a first predictable business, with a plant that reconciles itself to the ore it receives and learns from every tonne it processes. Beyond that, we aim to build a repeatable system for developing a new uranium province, anchored by Aura's exploration position across northern Mauritania. The system has three parts. Each is built once at Tiris and carried to every deposit that follows.
- The method: Tiris is already designed to repeat itself. Its beneficiation plants relocate seven times over the mine life as mining advances. Aura intends the process models, data architecture and digital twin to move with them. A new deposit would then start from models already trained on the province's ore, not from a blank page. Each move should make the next one faster, cheaper and less risky.
- The people: Mauritanians who learn their trade at Tiris become the leaders and specialists of the operations that follow. Each new deposit draws on a larger and more experienced national workforce than the last. The skills largely stay in Mauritania.
- The place: The remote operations centre, likely in Nouakchott, and the Technology Centre we are also considering are designed to serve more than one plant. One centre can, in time, supervise several operations at once, so new deposits increase output without adding a new layer of overhead.
For Mauritania, the value of Tiris therefore lies beyond the royalties, taxes and dividends set out above. It lies in a national capability to develop the country's uranium endowment, increasingly led by Mauritanians. Future deposits do not form part of this Study, and there is no certainty that further exploration will result in additional Mineral Resources or operations.
Project implementation and schedule
The Project will be delivered under a fully reimbursable engineering, procurement and construction management (EPCM) contract. The EPCM contractor will manage engineering, procurement and construction on Aura’s behalf, with all contracts placed in the Company’s name, and will support commissioning and performance testing. Execution will follow Construction Industry Institute and AACE International practice, with a frozen engineering baseline after the BFS, early orders for long-lead items, HAZOP reviews before detailed design, and modularisation and pre-assembly off site to reduce site work.
The scope covers the mine, the relocatable beneficiation plants, the central process plant and the supporting power, water, camp, workshops, laboratory, clinic and airstrip, together with the access road, logistics, a remote operations centre and a recruitment and training centre. Construction packages will be awarded with schedule as the driving factor and are expected to comprise the camp, bulk earthworks and civils, structural, mechanical, platework and piping (SMPP), electrical and instrumentation (potentially combined with SMPP), and a small-works contract reserved for a local or regional contractor. Mauritanian companies will be assessed in tenders through a weighted matrix that values local content.
Construction is expected to employ a peak of about 600 people on site, including Aura’s owner’s team, which include administration, support, and site-based operational roles. Led by the Tiris Project Director, the owner’s team will oversee the EPCM contractor and manage permitting, logistics, industrial relations, project controls and operational readiness. Key operations, maintenance and training staff will be recruited during construction so that the operations team is in place before commissioning. Contractors will be required to maximise Mauritanian employment under a project-wide industrial relations policy based on Mauritanian labour law. The workforce will be housed initially in a 70-person pioneer camp and then in the 300-person permanent camp, supplemented by temporary contractor accommodation at the peak.
Schedule
Construction is expected to take about two years from FID, with development capital spent at US$97.9 million in year 1, US$225.6 million in year 2 and US$19.3 million in year 3. There is US$6.9m in final performance payments assumed in Year 4. Indicative milestones are:
Table 21: Key development milestones
|
|
Target timing |
|
Pilot plant operation (TOPP) |
Q4 2026 |
|
Final investment decision |
December 2026 |
|
Start of construction |
Q1 2027 |
|
Power supply contract |
Q1 2027 |
|
Uranium transport and export approvals |
Progressively throughout 2027 |
|
Commissioning |
End of 2028 / start of 2029 |
|
First ore from 2Mlb p.a. operation |
By end of 2028 |
|
Nameplate production |
2030 |
Operating strategy and workforce
Tiris will be an owner-operated, continuously run operation. The 550,000 t/yr leach circuit sets the pace. Mining and beneficiation feed a rolling stockpile at plant grade, so the leach runs at nameplate on a pre-blended feed. Recovery is optimised against grade and reagent cost, not maximised for its own sake.
Digitalisation and automation
Steady, predictable throughput is the largest single driver of value at Tiris. Aura's Digitalisation Strategy addresses the four main causes of unpredictability: variable plant feed, inconsistent operation of individual process units, equipment reliability, and the human layer across all three. The strategy uses ore sensing at the mine face, plant instrumentation, and automation to build a digital twin of the whole operation. Plant automation will be introduced step by step, one process unit at a time, with humans retaining control of safety-critical systems.
Ramp-up
Commissioning will proceed from the beneficiation front end into the leach circuit. The mine schedule delivers higher head grades in the early years, with saleable production of about 2.0–2.3 Mlb a year in the first five production years before settling to the life-of-mine average.
Workforce and roster
The project will employ about 381 people in the first operation, rising to about 438 at steady state.
Table 22: Project workforce at peak steady state by role
|
Function |
Headcount |
|
Mining, mine maintenance, geology and survey |
201 |
|
Processing and fixed-plant maintenance |
95 |
|
General and administration |
142 |
|
Total |
438 |
Table 23: Project workforce at peak steady state by location
|
Function |
Headcount |
|
Tiris site based |
384 |
|
Off-site (Nouakchott and Zouérat) |
54 |
|
Including Remote Operations Centre |
12 |
|
Total |
438 |
Most operations staff will be bussed from Zouérat, with some from Bir Moghrein, on a 28-days-on, 14-days-off roster. There are an estimated 210 to 230 people on site at any time.
Importantly, Aura’s digitalisation, autonomy and remote operation strategy is focused on moving people out of dangerous, repetitive jobs on site (on the haul roads, in the dust and heat, and on night shifts far from home) and into more intellectually challenging roles in cities such as Nouakchott. Working from a remote operations centre and in data and technology teams, they will monitor, direct and continuously improve the operation rather than work its hazardous front line. Autonomy is already assumed in the mining base case, while plant digitalisation is being introduced unit by unit, with each step justified on its own economics.
This work has only recently begun and will develop through detailed engineering, but the direction is set: safer work, higher-value careers for Mauritanians and a more predictable operation.
Under the Mauritanisation provisions of the Mining Conventions, Aura is committed to training and progressively promoting Mauritanian staff. Mauritania already has a workforce experienced in large-scale mining at Zouérat, Tasiast and Guelb Moghrein.
Maintenance
Maintenance will be planned on a reliability-centred basis with a rolling major-shutdown schedule, to sustain 90% leach availability. Mobile equipment will be supported under an original equipment manufacturer support agreement. The remote location makes spares holdings and a reliable supply chain particularly important.
Capital cost estimate
Development capital is estimated at US$349.8 million. Wood prepared the process plant and non-process infrastructure estimate, and Aura managed most vendor quotes for equipment packages and prepared the mining and owner's cost components. Clean TeQ Water engineered and priced the moving-bed ion exchange and post-leach ATA® dewatering packages. Life-of-mine capital, including sustaining capital of US$203.4 million and closure and rehabilitation of US$20.0 million, totals US$573.3 million, or US$12.44 per pound of saleable U3O8.
Basis of estimate
The estimate has been prepared to an AACE International Class 3 standard (±15%), in real US dollars at AUD:USD 0.70 and MRU:USD 0.025. It excludes pre-construction and sunk costs, escalation and expansion capital.
Table 24: Capital cost estimate by area (US$ million)
|
Component |
Development |
Sustaining |
Total Life of Mine |
|
Mining |
24.1 |
84.6 |
108.7 |
|
Plant & Infrastructure |
228.5 |
118.8 |
347.3 |
|
EPCM |
28.6 |
- |
28.6 |
|
Owner’s cost |
30.2 |
- |
30.2 |
|
Contingency |
38.6 |
- |
38.6 |
|
Total capital, excluding closure |
349.8 |
203.4 |
553.3 |
Totals may not add because of rounding.
Under the Mining Conventions, customs duty and VAT do not apply during construction. Power is supplied under a build-own-operate arrangement, so power generation carries no owner capital and is included in operating costs.
A US$38.6 million contingency is applied as a single provision, equal to about 12% of the base estimate before contingency. It covers cost growth within the defined scope. It will be converted into package-level risk allowances in the estimate for FID.
The process and hydrometallurgical plant is the largest item. It covers the leach and downstream circuits (US$105.5 million), reagents, tailings handling and plant site services. Site services and infrastructure include the camp, off-site infrastructure and shared utilities. Indirects include EPCM of US$28.6 million.
Owner’s costs include Aura’s execution team, site and project general and administration costs, camp and Aura personnel transport and accommodation during construction, insurances, plant mobile equipment and light vehicles, all infrastructure associated with autonomous haulage communication and operation, and a remote operations centre in Nouakchott.
Sustaining and closure capital
Table 25: Sustaining and closure capital (US$ million)
|
Item |
US$ million |
|
Owner-mining fleet (purchase and replacement) |
84.6 |
|
Process plant sustaining |
90.6 |
|
Beneficiation plant relocations |
17.8 |
|
Other sustaining |
10.4 |
|
Total sustaining capital |
203.4 |
|
Closure and rehabilitation |
20.0 |
Sustaining capital averages about US$7.8 million a year. It is uneven, driven by fleet replacement and beneficiation plant relocations.
Operating cost estimate
The operating cost estimate covers 26 years of production and is prepared on the same basis and to the same class as the capital estimate. Processing costs draw on the process design criteria, the mass balance and the mechanical equipment list. All costs are in real US dollars per pound of saleable U3O8. Costs are reported on the Brook Hunt basis. C1 cash cost covers mining through to product delivered to market. It includes product transport and marketing but excludes royalties. All-in sustaining cost (AISC) adds royalties, community contributions, sustaining capital and closure.
Life-of-mine C1 cash cost is US$32.53/lb and AISC is US$41.25/lb. The detailed breakdown below is from the October 2026 Financial Model and illustrates the cost structure.
Table 26: C1 operating cost by area
|
Cost component |
|
US$/lb U3O8 LOM |
US$/t ore mined |
US$M LOM |
US$M/yr (LOM avg) | |
|
Mining |
5.61 |
7.10 |
2.95 |
327.4 |
12.6 | |
|
Processing (incl beneficiation) |
16.91 |
18.73 |
7.77 |
863.2 |
33.2 | |
|
Site G&A |
5.12 |
5.77 |
2.39 |
265.9 |
10.2 | |
|
Product transport & marketing |
0.93 |
0.93 |
0.39 |
42.9 |
1.6 | |
|
C1 cash cost |
28.58 |
32.53 |
13.49 |
1,499.4 |
57.7 |
Table 27: C1 operating cost by cost centre
|
Cost component |
|
US$/lb U3O8 LOM |
US$/t ore mined |
US$M LOM |
US$M/yr (LOM avg) | |
|
Labour |
3.51 |
4.15 |
1.72 |
191.2 |
7.4 | |
|
Power |
5.66 |
6.39 |
2.65 |
294.4 |
11.3 | |
|
Reagents & Consumables |
9.69 |
10.82 |
4.49 |
498.7 |
19.2 | |
|
Diesel |
2.16 |
2.50 |
1.04 |
115.3 |
4.4 | |
|
Maintenance |
2.36 |
2.93 |
1.22 |
135.2 |
5.2 | |
|
Administration |
4.27 |
4.81 |
2.00 |
221.9 |
8.5 | |
|
Product transport & marketing |
0.93 |
0.93 |
0.39 |
42.9 |
1.6 | |
|
C1 cash cost |
28.58 |
32.53 |
13.49 |
1,499.4 |
57.7 |
Table 28: All In Sustaining Cost
|
Cost component |
US$/lb U3O8 Yr 1-10
|
US$/lb U3O8 LOM |
US$/t ore mined |
US$M LOM |
US$M/yr (LOM avg) |
|
C1 Cash Cost |
28.58 |
32.53 |
13.49 |
1,499.4 |
57.7 |
|
Royalties (3.5%, see below) |
3.07 |
3.10 |
1.28 |
142.7 |
5.5 |
|
Sustaining capital |
3.13 |
4.41 |
1.83 |
203.4 |
7.8 |
|
Communities |
0.81 |
0.77 |
0.32 |
35.6 |
1.4 |
|
Closure |
- |
0.43 |
0.18 |
20.0 |
0.8 |
|
All-in sustaining cost |
35.60 |
41.25 |
17.11 |
1,901.2 |
73.1 |
Main cost drivers
Reagents, including sodium carbonate, sodium bicarbonate and sodium hydroxide dominate, reflecting the alkaline flowsheet. Nanofiltration recovery reduces reagent use of sodium carbonate and sodium bicarbonate. The table below summarises the key reagent unit costs, delivered to site, based on budget quotations for reagents landed in Nouakchott and in-land transport:
Table 29: Reagent consumption and cost
|
Reagent |
kg/t leach feed |
Unit cost (US$/t reagent) |
|
Sodium carbonate |
10.60 |
570 |
|
Sodium bicarbonate |
9.58 |
656 |
|
Sodium hydroxide |
8.79 |
1,123 |
|
ATA (activator and tether) |
0.85 |
4,377 |
|
Sulphuric acid |
1.08 |
568 |
|
Flocculant |
0.26 |
2,822 |
|
Ion exchange resin |
0.005 |
8,635 |
|
Hydrogen peroxide |
0.24 |
1,203 |
Mining covers owner-operated equipment, power (approximately 9GWh a year for electric autonomous haul trucks), diesel for the balance of mobile fleet, and mining labour. Mobile maintenance is based on recommended allowances by machine OEMs with a site-based maintenance workforce assumed (captured under labour).
Power assumes US$0.15/kWh for about 74 GWh a year (65GWh a year for the processing plant) from the renewable facility (under PPA), plus US$92/t steam for leach heating at about 3.18 t/h.
Labour. Total workforce cost, including mining labour. A breakdown of labour by location is outlined below.
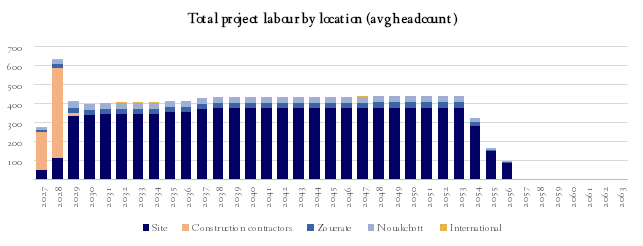
Figure 17: Total project labour by location (avg headcount)
General and administration includes camp and catering, insurance and administration labour.
Operating Cost Profile
The following graphs outline the All In Sustaining Cost of the Operation by year, broken into department and cost centre:
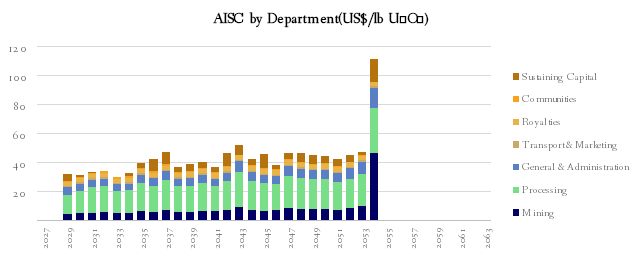
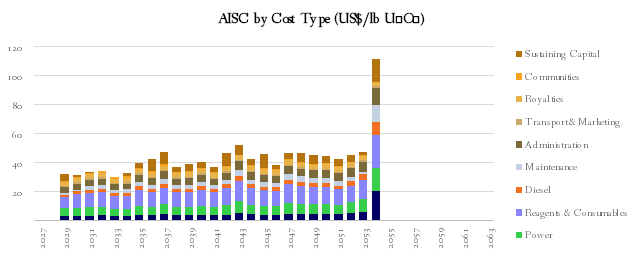
Figure 18: AISC over the project life by area (top) and cost centre (bottom)
Sensitivity and comparison
Reagents, mining and power make up about 70% of controllable operating cost, so reagent supply contracts, the mining fleet and the power tariff dominate operating cost risk. A 10% change in AISC is equivalent to about US$4.1/lb.
Compared with the September 2024 update, mine-site C1 is up about 4%, mainly because of higher reagent consumption in the current design. AISC is up about 12%, mainly because sustaining capital is now fully costed.
Market analysis and offtake
The market analysis draws on the World Nuclear Association's 2025 Nuclear Fuel Report, an independent marketing assessment prepared for Aura by TradeTech (August 2026) and a consensus of 19 broker and independent price forecasts (September 2026).
Demand
Nuclear power is entering a period of sustained growth. At COP28 in 2023, more than 20 countries pledged to triple nuclear capacity by 2050, and the International Energy Agency counts more than 70 GW of reactors under construction. Electrification and data-centre demand add to this. The World Nuclear Association expects reactor requirements to rise from about 69,000 t U (179 Mlb U3O8) in 2025 to more than 150,000 t U (390 Mlb U3O8) by 2040.
Supply
Supply is not keeping pace. Primary production of about 157 Mlb U3O8 in 2024 was highly concentrated, with the top five countries supplying about 85%. Many of the largest mines deplete during the 2030s, and new mines now take 8 to 15 years to develop. The World Nuclear Association estimates that 49–60% of 2040 demand will need to come from mines not yet built. TradeTech estimates that the share of Western supply producible below US$25/lb falls from 69% in 2028 to 38% in 2030.
Security of supply is also driving demand for new production from stable jurisdictions. Uranium is on the United States critical minerals list, and restrictions on Russian-origin enriched uranium are in place.
Price
The BFS base case uses a uranium price of US$90/lb U3O8, flat in real terms. Broker consensus and TradeTech forecasts at the time of the study are shown in Table 30.
Table 30: Uranium price forecasts (US$/lb U3O8)
|
|
2026 |
2028 |
2030 |
Long term |
|
Broker consensus (September 2026)[5] |
89.6 |
97.1 |
93.2 |
96.9 |
|
TradeTech Forward Average Model 2 (real)[6] |
95 |
106 |
108 |
119 |
|
BFS base case |
90.0 |
90.0 |
90.0 |
90.0 |
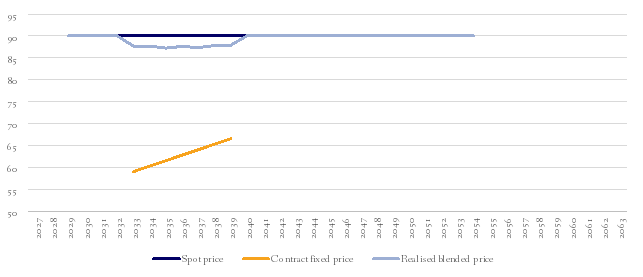
Figure 19: Uranium price forecasts compared with the BFS base case (including impact of offtake), US$/lb
Offtake
Aura has one currently effective long-term offtake contract, with Curzon Uranium, for 300,000 lb a year over seven years. Half is sold at fixed prices rising from US$59.00 to US$66.50/lb (the schedule that applies if FID occurs during 2027; the study assumes FID on 1 January 2027), and half at the spot price less 5%. All other production is assumed to be sold at the base-case price, resulting in a life-of-mine average realised price of US$89.28/lb. About 83% of expected annual production remains uncontracted, allowing Aura to offer it as part of a strategic offtake and financing transaction.
Cost position
TradeTech ranks Tiris as one of the lowest development-risk projects among the 'newly emerging' supply it assessed. Tiris is the only truly near-surface deposit amenable to open pit extraction in that group. Most of the others are underground or in-situ recovery projects. Measured on Proved Ore Reserves alone, Tiris ranks fourth of the eight projects that disclose them. Furthermore, Tiris's life-of-mine cash operating cost of US$32.53 per pound U3O8 compares favourably against the global cost curve and 'newly emerging' project benchmarks established in TradeTech's Independent Marketing Assessment.
With respect to TradeTech's uranium market analysis and supply-and-demand forecast, Aura Energy's Tiris Project aligns with the favourable 'newly emerging' project category. TradeTech deems the Project one of the few fully licensed newly emerging uranium assets commissionable in the 2026-2029 forecasting period.
In comparison to peers' performances over a similar time frame, the negligible rise in cash operating (C1) costs of 3.6 percent between Aura Energy's 2024 FEED and 2026 BFS study demonstrates the company's ability to control and contain mine-cost inflation, ensuring the Tiris Project remains competitive in the near-term future supply profile.
Financial analysis
The Financial Model values the Project at a post-tax NPV of US$500.3 million (8% real discount rate, 100% basis, ungeared), with an IRR of 28% and payback of 3.2 years from first production, at a uranium price of US$90/lb. The value attributable to Aura shareholders, after the State's carried interest, is US$425.3 million.
Key assumptions
Below is a summary of the main financial assumptions. A detailed list is provided in Appendix 4.
Table 31: Key financial assumptions
|
|
Value |
Basis |
|
Uranium price (real, flat) |
US$90/lb U3O8 |
Base case |
|
Weighted average realised price |
US$89.28/lb |
Includes Curzon offtake |
|
Discount rate |
8% real, post-tax |
NPV8 basis |
|
Exchange rates |
AUD:USD 0.70; MRU:USD 0.025 |
Model input |
|
Base date |
1 January 2027 |
Model epoch |
|
Construction period |
2 years |
Development schedule |
|
Production life |
26 years |
Mine plan |
|
Corporate income tax |
25% after 36-month holiday |
Mining Conventions |
|
Minimum flat tax |
1.75% of turnover after holiday |
Mining Conventions |
|
Royalty |
3.5% of FOB value |
Mining Conventions |
|
Community contributions |
US$200,000 in year 1, then 2% of net profit |
Exploitation decrees |
|
State interest |
15%, free-carried |
Mining Conventions |
|
Withholding tax on dividends |
10% |
Mining Conventions |
|
Tax depreciation |
Development capital over 3 years from end of tax holiday |
Mining Conventions |
|
Valuation basis |
100%, ungeared, real |
Base case |
Production and cash flow
The mine plan processes 111.10 Mt of ore at 225 ppm U3O8, containing 55.1 Mlb. At an overall recovery of 83.7%, this yields 46.09 Mlb of saleable U3O8 over 26 years, an average of about 1.8 Mlb a year. Higher-grade zones at Lazare North and Sadi lift production in the first decade.
Table 32: Life-of-mine cash flow summary (real US$ million, ungeared, 100% basis)
|
Item |
US$ million |
US$/lb U3O8 |
|
Gross revenue |
4,114.9 |
89.28 |
|
Product transport and marketing |
42.9 |
0.93 |
|
Royalties |
142.7 |
3.10 |
|
Mine-site operating costs |
1,456.6 |
31.60 |
|
Community contributions |
36.7 |
0.80 |
|
Closure costs |
20.0 |
0.43 |
|
EBITDA |
2,416.0 |
52.42 |
|
Corporate income tax |
383.9 |
8.33 |
|
Development capital |
349.8 |
7.59 |
|
Sustaining capital |
203.4 |
4.41 |
|
Unlevered post-tax free cash flow |
1,478.9 |
32.09 |
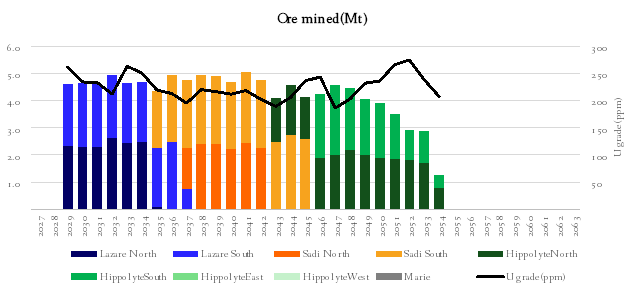
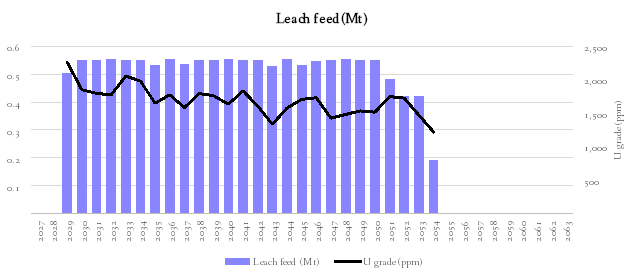
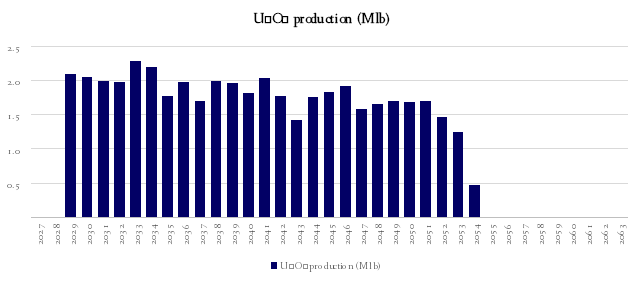
Figure 20: Mined ore, leach feed and grade and uranium production profiles
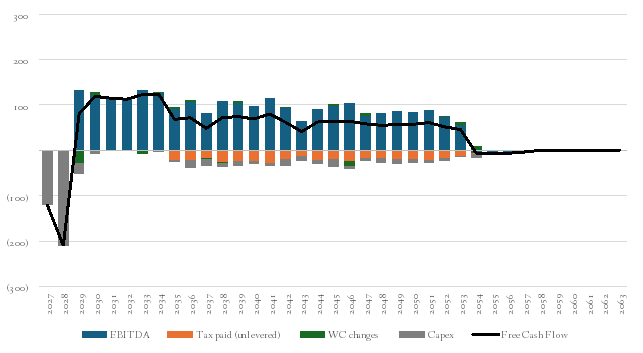
Figure 21: Post-tax free cash flow
Company income tax is first paid in about the eighth production year, after the 36-month tax holiday and the three-year write-off of development capital. The effective tax rate over the life of mine is about 20%. Community contributions in Table 31 are shown on an ungeared basis and therefore differ slightly from the US$35.6 million quoted elsewhere.
Sensitivity analysis
The Project is most sensitive to the uranium price and head grade, followed by operating costs. Capital cost has the least effect.
Table 33: Project economics across a range of uranium prices
|
Uranium price (US$/lb) |
Post-tax NPV8 (US$M) |
IRR (%) |
Payback (years) |
|
70 |
221.2 |
17% |
4.6 |
|
80 |
361.1 |
23% |
3.8 |
|
90 |
500.3 |
28% |
3.2 |
|
100 |
638.5 |
32% |
2.7 |
|
110 |
776.6 |
37% |
2.4 |
|
120 |
914.6 |
41% |
2.1 |
Table 34: NPV8 sensitivity to key inputs (US$ million)
|
Variable |
-15% |
-10% |
-5% |
Base |
+5% |
+10% |
+15% |
|
Uranium price |
312.2 |
375.0 |
437.7 |
500.3 |
562.5 |
624.7 |
686.8 |
|
Ore grade |
308.8 |
372.8 |
436.6 |
500.3 |
563.6 |
626.9 |
690.1 |
|
Operating cost |
565.2 |
543.6 |
522.0 |
500.3 |
478.6 |
456.8 |
435.0 |
|
Capital cost |
534.3 |
523.0 |
511.7 |
500.3 |
488.7 |
477.1 |
465.6 |
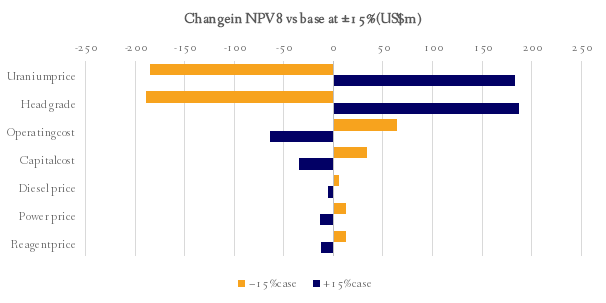
Figure 22: Post-tax NPV8 sensitivity (spider chart)
Risk assessment
The BFS risk assessment updates the register first prepared for the 2019 DFS and refreshed for the 2024 FEED. Each risk is scored for likelihood and severity, mitigations are developed, and residual risk is re-scored. For the 2026 BFS, risks were re-assessed under six headings: political, economic, social, technical, legal and labour.
The overall risk profile has improved materially since the DFS. Tenure and approvals that were then pending have been granted, the flowsheet has been strengthened, and the mine plan and economics are now model-based. The uranium price remains the largest residual risk.
Many technical risks are scheduled to be retired, not just managed. The pilot plant will run ore from the main geometallurgical domains through an integrated beneficiation and hydrometallurgical train before FID. It is designed to reduce flowsheet, recovery, reagent consumption, dewatering and geometallurgical risks in a single programme.
Table 35: Key Project risks and mitigations
|
Item |
Description |
Mitigation |
|
Uranium price |
A sustained price below the Project's economic threshold |
Conservative base case price; Curzon offtake; strategic offtake; structural demand outlook |
|
Capital cost and estimate maturity |
Cost overrun against the Class 3 (±15%) estimate |
Contingency; firm-price tendering; package-level risk assessment before FID |
|
Funding |
Ability to secure debt and equity on acceptable terms |
Multi-source funding plan; advanced senior debt discussions with the U.S. International Development Finance Corporation; non-binding MOU with a major international nuclear utility dated 2 June 2026; non-binding fully funded proposal from a major US investment fund; debt capacity headroom |
|
Throughput and ore variability |
Variable clay content and plant availability limit throughput |
Geometallurgical domaining; blending; pilot plant; digitalisation and process control |
|
Post-leach dewatering |
ATA® has not been used at a commercial uranium operation |
Bench testwork; larger-scale ATA® plant under construction at the Rasp mine; confirmation in pilot plant |
|
Inferred material |
33% of scheduled feed is Inferred |
Low Inferred share in early years; funded infill drilling ahead of mining |
|
Water supply |
Borefield yield and quality over the mine life |
Taoudeni borefield with headroom, potential for C22 borefield to augment if required; monitoring bores; Borefields Management Plan; |
|
Health and safety |
Radioactive dust and NORM exposure |
Radiation Management Plan; engineering controls; dosimetry; automation reduces exposure |
|
Logistics and export |
Product trucked 1,447 km to port under escort |
Transport Management Plan; secure compounds; experienced logistics partners |
|
Security |
Sahel regional security |
Remote location; security protocols; government and military support |
|
Permitting |
Delays to remaining construction and operating permits |
Key permits granted; dedicated permitting team, remaining permits and licence applications underway |
|
Labour |
Skills, retention and key-person risk |
Mauritanisation and training; Zouérat-based rosters; succession planning |
Appendix 1: Mineral Resource and Ore Reserve statement
Mineral Resource Estimate
Table 36: Tiris Mineral Resource (JORC 2012) – 100ppm U3O8 cut-off grade
|
Deposit |
Class |
Tonnes (Mt) |
U3O8 (ppm) |
U3O8 (Mlb) |
V2O5 (ppm) |
V2O5 (Mlb) |
|
Hippolyte East |
Inferred |
2 |
172 |
0.8 |
56 |
0.3 |
|
Hippolyte North |
Measured |
11 |
237 |
5.6 |
77 |
1.8 |
|
Hippolyte North |
Indicated |
7 |
238 |
3.7 |
77 |
1.2 |
|
Hippolyte North |
Inferred |
9 |
236 |
4.9 |
77 |
1.6 |
|
Hippolyte North |
Sub-total |
27 |
237 |
14.3 |
77 |
4.6 |
|
Hippolyte South |
Indicated |
5 |
205 |
2.1 |
67 |
0.7 |
|
Hippolyte South |
Inferred |
28 |
181 |
11.0 |
59 |
3.6 |
|
Hippolyte South |
Sub-total |
32 |
184 |
13.2 |
60 |
4.3 |
|
Hippolyte West C |
Inferred |
4 |
244 |
2.2 |
79 |
0.7 |
|
Marie |
Inferred |
10 |
246 |
5.3 |
80 |
1.7 |
|
Lazare North |
Measured |
4 |
291 |
2.4 |
94 |
0.8 |
|
Lazare North |
Indicated |
10 |
247 |
5.3 |
80 |
1.7 |
|
Lazare North |
Inferred |
4 |
299 |
2.4 |
97 |
0.8 |
|
Lazare North |
Sub-total |
17 |
268 |
10.1 |
87 |
3.3 |
|
Lazare South |
Measured |
8 |
234 |
4.4 |
76 |
1.4 |
|
Lazare South |
Indicated |
7 |
217 |
3.1 |
70 |
1.0 |
|
Lazare South |
Inferred |
6 |
209 |
2.6 |
68 |
0.8 |
|
Lazare South |
Sub-total |
21 |
222 |
10.1 |
72 |
3.3 |
|
Sadi |
Measured |
11 |
198 |
4.9 |
64 |
1.6 |
|
Sadi |
Indicated |
20 |
187 |
8.4 |
61 |
2.7 |
|
Sadi |
Inferred |
17 |
201 |
7.5 |
65 |
2.4 |
|
Sadi |
Sub-total |
48 |
195 |
20.8 |
63 |
6.7 |
|
All Tiris East |
Measured |
34 |
230 |
17.3 |
75 |
5.6 |
|
All Tiris East |
Indicated |
48 |
212 |
22.6 |
69 |
7.3 |
|
All Tiris East |
Inferred |
79 |
210 |
36.7 |
68 |
11.9 |
|
All Tiris East |
Sub-total |
162 |
215 |
76.6 |
69 |
24.9 |
|
Oum Ferkik |
Inferred |
22 |
294 |
14.6 |
95 |
4.7 |
|
All deposits |
Measured |
34 |
230 |
17.3 |
75 |
5.6 |
|
All deposits |
Indicated |
48 |
212 |
22.6 |
69 |
7.3 |
|
All deposits |
Inferred |
102 |
229 |
51.4 |
74 |
16.6 |
|
Grand Total |
All |
184 |
225 |
91.3 |
73 |
29.6 |
For further information, please refer to the ASX and AIM Release: 12 June 2024 – Aura increases Tiris’ Mineral Resources by 55% to 91.3Mlbs U3O8. Contained metal shown for U3O8 and V2O5. Significant figures quoted do not imply precision and are to minimise round-off errors.
Ore Reserves
Table 37: Tiris Ore Reserve (JORC 2012) – 150 ppm (Group 1) and 100 ppm (Groups 2 and 3) U3O8 cut-off grade
|
Deposit |
Proved Mt |
Proved ppm |
Proved Mlb |
Probable Mt |
Probable ppm |
Probable Mlb |
Total Mt |
Total Mlb |
|
Lazare North |
3.7 |
293 |
2.4 |
9.5 |
246 |
5.1 |
13.2 |
7.5 |
|
Lazare South |
7.9 |
239 |
4.2 |
6.1 |
220 |
2.9 |
14.0 |
7.1 |
|
Hippolyte |
9.4 |
254 |
5.2 |
9.6 |
245 |
5.2 |
19.0 |
10.4 |
|
Sadi |
10.5 |
201 |
4.7 |
18.0 |
191 |
7.6 |
28.5 |
12.2 |
|
Total |
31.5 |
237 |
16.4 |
43.1 |
219 |
20.8 |
74.6 |
37.3 |
Ore Reserve estimated for this Announcement. It supersedes the Ore Reserve reported in the ASX and AIM Release: 16 December 2024 – Substantial increase in Tiris Uranium Project Ore Reserves. Total Ore Reserve 74.6 Mt at 227 ppm U3O8 for 37.3 Mlb, compared with the previous Ore Reserve of 62.8 Mt at 243 ppm U3O8 for 33.6 Mlb.
- Ore Reserves are a subset of Mineral Resources
- Ore Reserves conform with and use the JORC Code 2012 definitions
- Ore Reserves are calculated using a uranium price of US$90/lb
- Ore Reserves are calculated using cut-off grades of 150 ppm U3O8 for Group 1 and 100 ppm U3O8 for Groups 2 and 3.
- Tonnages are reported including mining dilution.
- All figures are rounded to reflect appropriate levels of confidence which may result in apparent errors of summation.
- Mineral Resource is reported inclusive of Ore Reserves.
- Competent Person notes refer to Arnold van der Heyden (H&S Consultants) for Mineral Resources and Andrew Hutson (Resolve Mining Services) for Ore Reserves.
Appendix 2: Ore Reserve – summary of material information (ASX Listing Rule 5.9)
The following summary is provided in accordance with ASX Listing Rule 5.9.1.
Economic assumptions
The Ore Reserve is estimated at a uranium price of US$90/lb U3O8, a royalty of 3.5% of FOB value and corporate tax of 25%. A simplified version of the BFS Financial Model was used to test the Measured-and-Indicated-only mine plan. It returned a post-tax NPV8 of about US$355 million over an 18-year life. The NPV remains positive above about US$65/lb, and undiscounted cash flow remains positive above about US$55/lb. Operating costs would need to rise by more than 40% to make the Ore Reserve uneconomic.
Criteria for classification
Proved Ore Reserves are derived from Measured Mineral Resources and Probable Ore Reserves from Indicated Mineral Resources. No Inferred material is included in the Ore Reserve. Of the Ore Reserve, 31.5 Mt at 237 ppm for 16.4 Mlb is Proved and 43.1 Mt at 219 ppm for 20.8 Mlb is Probable.
Mining method and assumptions
Conventional, owner-operated open-cut mining with excavators, wheel loaders and off-road trucks. The ore is free-digging, so no drilling or blasting is required. Pits are shallow and progressively backfilled with waste, beneficiation rejects, and filtered tailings, so no pit-slope geotechnical work was required. Mining panels of at least 100 m × 100 m were defined from Whittle optimisation shells. Dilution and ore loss are applied by excluding resource blocks with less than 4% mineralisation, reflecting a smallest mining unit of about 200 t.
Processing method and assumptions
Ore is scrubbed and wet screened at 75 μm in relocatable beneficiation plants. The fine fraction is pumped to a central plant, dewatered by two-stage centrifuges and leached in sodium carbonate and bicarbonate at about 80°C. Leached solids are separated by ATA-conditioned belt filtration, and uranium is recovered by moving-bed ion exchange, precipitated and packaged. Recoveries are applied by geometallurgical group: beneficiation metal loss of 11% (Group 1), 15.0% (Group 2) and 4.1% (Group 3), and processing recovery of 91.5% for all groups. Beneficiation mass yield to leach feed is 21.4% (Group 1), 11.7% (Group 2) and 9.9% (Group 3).
Cut-off grade
A cut-off grade of 100 ppm U3O8 is applied to Groups 2 and 3, and 150 ppm to Group 1, based on calculated break-even cut-offs of 100, 80, and 151 ppm, respectively.
Estimation methodology
The Ore Reserve is based on the June 2024 MIK recoverable resource models prepared by H&S Consultants, coded with defined geometallurgical groups. Whittle optimisations were run on Measured and Indicated material only. Revenue factor 0.9 shells returned 69.1 Mt at 236 ppm for 35.9 Mlb, within 7% of the December 2024 Ore Reserve.
Material modifying factors
Material approvals for construction and operation have been granted. Remaining secondary permits, including water abstraction, power, transport and export permits, are expected in the normal course. Power will be supplied under a build-own-operate power purchase agreement. Water will be supplied from the Taoudeni borefield.
Appendix 3: JORC Code 2012 Table 1
The following table sets out the Competent Person's commentary against the criteria in Section 4 of Table 1 of the JORC Code (2012). Sections 1 to 3 are reproduced here without change from the ASX release of 12 June 2024. The Company is not aware of any new information or data that materially affects the Mineral Resource estimate.
Part A: Sections 1 to 3
Section 1: Sampling Techniques and Data
(Criteria in this section apply to all succeeding sections)
|
Criteria |
JORC Code explanation |
Commentary | ||||||||||||||||||||||||||||||||||||||||||||||||||||||||||||||||||||||||||||||||||||||||||||||||||||||||||||||
|
Sampling techniques |
|
| ||||||||||||||||||||||||||||||||||||||||||||||||||||||||||||||||||||||||||||||||||||||||||||||||||||||||||||||
|
Drilling techniques |
|
| ||||||||||||||||||||||||||||||||||||||||||||||||||||||||||||||||||||||||||||||||||||||||||||||||||||||||||||||
|
Drill sample recovery |
|
| ||||||||||||||||||||||||||||||||||||||||||||||||||||||||||||||||||||||||||||||||||||||||||||||||||||||||||||||
|
Logging |
|
| ||||||||||||||||||||||||||||||||||||||||||||||||||||||||||||||||||||||||||||||||||||||||||||||||||||||||||||||
|
Sub-sampling techniques and sample preparation |
|
| ||||||||||||||||||||||||||||||||||||||||||||||||||||||||||||||||||||||||||||||||||||||||||||||||||||||||||||||
|
Quality of assay data and laboratory tests |
|
| ||||||||||||||||||||||||||||||||||||||||||||||||||||||||||||||||||||||||||||||||||||||||||||||||||||||||||||||
|
Verification of sampling and assaying |
|
| ||||||||||||||||||||||||||||||||||||||||||||||||||||||||||||||||||||||||||||||||||||||||||||||||||||||||||||||
|
Location of data points |
|
| ||||||||||||||||||||||||||||||||||||||||||||||||||||||||||||||||||||||||||||||||||||||||||||||||||||||||||||||
|
Data spacing and distribution |
|
| ||||||||||||||||||||||||||||||||||||||||||||||||||||||||||||||||||||||||||||||||||||||||||||||||||||||||||||||
|
Orientation of data in relation to geological structure |
|
| ||||||||||||||||||||||||||||||||||||||||||||||||||||||||||||||||||||||||||||||||||||||||||||||||||||||||||||||
|
Sample security |
|
| ||||||||||||||||||||||||||||||||||||||||||||||||||||||||||||||||||||||||||||||||||||||||||||||||||||||||||||||
|
Audits or reviews |
|
| ||||||||||||||||||||||||||||||||||||||||||||||||||||||||||||||||||||||||||||||||||||||||||||||||||||||||||||||
Section 2: Reporting of Exploration Results
(Criteria listed in the preceding section also apply to this section)
|
Criteria |
JORC Code explanation |
Commentary |
|
Mineral tenement and land tenure status |
|
|
|
Exploration done by other parties |
|
|
|
Geology |
|
|
|
Drill hole Information |
|
|
|
Data aggregation methods |
|
|
|
Relationship between mineralisation widths and intercept lengths |
|
|
|
Diagrams |
|
|
|
Balanced reporting |
|
|
|
Other substantive exploration data |
|
|
|
Further work |
|
|
Section 3. Estimation and Reporting of Mineral Resources
|
|
|
|
|
Database integrity |
|
The Aura resource database is managed by independent organisation Reflex Hub, based in Perth. HSC conducted some basic checks for internal inconsistencies such as overlapping intervals, records beyond end of hole depth, unassayed intervals and unrealistic data values. Twinned drill holes, generally within 10m, were identified and examined. Twins without assays or shallower holes were removed for geological interpretation and grade estimation. |
|
Site visits |
|
The Competent Person for the Mineral Resource Estimate (MRE) undertook a site visit to the Tiris East project area in January 2024. Two days were spent on site observing air-core drilling operations including down-hole gamma logging, as well as inspecting the geology of each of the major deposits and locating older drill hole collar locations. A further half day was spent in the capital Nouakchott inspecting core and sample storage at the AEE storage facility. The drilling and gamma logging were being performed in a professional manner and the core inspection confirmed the presence of significant uranium mineralisation. |
|
Geological interpretation |
|
The uranium mineralisation generally forms thin shallow horizontal tabular bodies ranging in thickness from 1 to 12m hosted in weathered granite and granitic sediments. Differentiation of the weathered granite from granitic sediments is unreliable from air-core sample returns. HSC generated surfaces representing the base of the mineralisation at each deposit in order to limit the extrapolation of grades into volumes that have no data. This is important at Tiris as there is a general decrease in uranium grades with depth. These basal surfaces generally represent the top of fresh granite, where air-core drilling could penetrate no further. The basal surfaces were produced using the locations of the end of the deepest assay from each drill hole. The exceptions are the 2022 air-core drilling, when a hydraulic hammer was used instead of a conventional blade bit, and all diamond core holes. Therefore, these holes could penetrate fresh rock, while the blade bit used in other years could not. This difference is important to the Tiris project because the DFS assumes that mining will be free-digging. Consequently, fresh rock intersected in the 2022 air-core holes and all diamond core drilling will not be mineable under current assumptions and needs to be excluded from the MRE. Therefore, in deposits with 2022 air-core holes and diamond core drilling (Sadi, Lazare South and Hippolyte North), an additional surface was created to represent the top of fresh rock, which may be shallower than the base of mineralisation in places. Areas of obvious outcrop were excised from the MRE assuming a dip of 45 degrees between weathered granite/granitic sediments and the fresh granite. At the time that the estimates were completed, no topographic survey data were available. The majority of the recent drill collar locations were surveyed using a Differential Global Positioning System (DGPS). HSC used the locations of all drill hole collars that had been located with the DGPS to create a wireframe representing the topographic surface. The elevations of all drill holes that had been located using a handheld GPS were then derived from this topographic surface. All geological models contain block proportions of material:
These proportions were later combined to assess estimates of material between the different surfaces. The block proportion below topography was used to assign average block depth, which was used to calculate dry bulk density and allow assessment of mineralisation in one metre slices below surface. The interpretation of the mineralisation as flat lying tabular bodies is undisputed. The lateral extents of the mineralisation are poorly defined and recent drilling around the edges of the deposits shows that mineralisation is not necessarily limited to areas with stronger surface radiometric anomalies. The extent of outcrop/subcrop and its relationship to free-digging mineralisation is somewhat uncertain but a conservative approach has been taken to minimise this risk. Alternative interpretations of the geology are unlikely to significantly impact estimated resources. The continuity of both grade and geology are affected by the extent of weathering of the granitic host. Continuity does not appear to be affected by faulting. The models account for sand dunes that overlie mineralisation in places that can be over 10m high. These dunes move on an annual basis within specific corridors. AEE provided the outlines of the base of sand dunes from aerial imagery and HSC generated volumes based on a nominal height of 10m. The modelling of these volumes and their location is somewhat subjective, but it does give a nominal indication of the location of the sand dune corridors. |
|
Dimensions |
|
The MREs reported here occur in ten separate deposits in two areas (Tiris East and Tiris West) separated by ~200km. All MREs are reported at 100ppm U3O8 cut-off grade. The Tiris East area comprises 8 separate deposits within a rectangle around 35km north-south and 74km east-west.
The Tiris West area comprises 2 separate deposits within a rectangle around 3.4km north-south and 7.2km east-west.
These dimensions do not account for sand dunes that overly parts of some deposits because the dunes move on an annual basis and the modelling of their volumes and location is somewhat subjective. |
|
Estimation and modelling techniques |
|
New estimates were generated for all deposits reported here. There is additional recent drilling for all the Tiris East deposits, while Tiris West was re-estimated with existing historical data using the same methodology as Tiris East to make all estimates consistent and compatible. Uranium concentration was estimated by recoverable Multiple Indicator Kriging (MIK) using GS3 geostatistical software. The uranium grades at the Tiris deposits exhibit a positively skewed distributions and therefore show reasonable sensitivity to a small number of high grades. MIK is considered an appropriate estimation method for the uranium grade distribution at the Tiris deposits because it specifically accounts for the changing spatial continuity at different grades through a set of indicators variograms at a range of grade thresholds. It also reduces the need to use the practice of top cutting. All drill hole intervals were composited to 0.5m for estimation. No direct top-cuts were applied but the average of the mean and median grades was applied to the top indicator class to address any potential extreme values. The larger deposits were subdivided into a number of Subzones for estimation, with conditional statistics generated for each of the subzones. All class grades used for estimation of the mineralised domains were derived from the class mean grades, except the top indicator class. Only U3O8 was estimated. No deleterious elements or other non-grade variables of economic significance were estimated. Vanadium is a potential by-product and vanadium oxide (V2O5) has been estimated for the mineral resources using the stoichiometric V2O5/ U3O8 ratio for carnotite group minerals. These V2O5 values represent potentially recoverable vanadium in carnotite and not total vanadium occurring in mineralisation, which is significantly higher in almost all cases. These potentially recoverable V2O5 values are based on the analysis of a substantial database of available sample data and represent average values that may be conservative. This procedure relies on the correlation between uranium and vanadium in carnotite group minerals, which are the only uranium- vanadium minerals identified to date at Tiris. The base of mineralisation surface was used to limit the extrapolation of grades into volumes that had no data. The proportion of outcrop was estimated for each block based on digitising provided by AEE and used to deplete the MRE on the assumption that this material cannot be dug freely. The Recoverable MIK technique employed by HSC in this case requires a set of 14 variogram models, one for each of the fourteen grade bins used. Sets of variogram models were created for the major Subzones and were applied to Subzones that did not have sufficient data to generate reliable models. Drill hole spacing varies from 50x50m or 70x70m in the better drilled deposits, out to 100x200m in the less well drilled deposits. Sample length varies by assay type and year. Earlier chemical assays (2009-2012) are typically 1.0m in length, apart from 0.5m intervals for the first metre in each holes. Later (2017-2022) chemical assays are consistently 0.5m in length. All raw radiometric data (one centimetre readings) has been composited to regular 0.5m intervals. All drill hole grade data were composited to nominal 0.5m intervals for analysis and estimation. The block dimensions were 50x50m in plan view and 1 m vertically. The plan dimensions were chosen as it is the nominal drill hole spacing (preferable for MIK estimation). The vertical dimension was chosen to reflect the anisotropy of the mineralisation and the downhole data spacing. The minimum selective mining unit size is assumed to be 10x10x0.5m. A three-pass search strategy was used to estimate the U3O8 grades at each of the deposits. Each pass required a minimum number of samples with data from a minimum number of octants of the search ellipse to be populated. Discretisation was set to 5x5x2 points in X, Y and Z, respectively. The search criteria are shown below. The last short axis of the search ellipse is vertical.
The maximum distance of extrapolation of the reported estimates from drill hole data points is limited to around 220m. The estimates were reviewed by HSC personnel, and it was concluded that the estimates reasonably represent the grades observed in the drill holes. HSC also validated the models statistically using histograms, boxplots, scatter plots and summary statistics. No independent check estimates were produced but the new models were compared to previous estimates and found to be consistent and compatible. The new MRE takes appropriate account of previous estimates. No mining has occurred on the Tiris deposits so mine production data were unavailable for comparison. |
|
Moisture |
|
Tonnages are estimated on a dry weight basis. The moisture constant was not determined. |
|
Cut-off parameters |
|
A cut-off grade of 100ppm U3O8 is used to report the resources as it is assumed that ore can be economically mined at this grade in an open pit scenario. This cut-off is considered to be relatively low compared to operating uranium mines, but metallurgical test work indicates that a significant upgrade in uranium and decrease in sulphates can be achieved by a simple screening process. |
|
Mining factors or assumptions |
|
All of the resources reported here have been estimated on the assumption that the deposits will be mined by open-pit and free digging, with no blasting or crushing. Recoverable MIK allows for block support correction to account for the change from sample size support to the size of a mining block. This process requires an assumed grade control drill spacing and the assumed size of the Selective Mining Unit (SMU). The variance adjustment factors were estimated from the U3O8 metal variogram models assuming a minimum SMU of 10x10x0.5m (east, north, vertical) with high quality grade control sampling on a 10x10x0.5m pattern (east, north, vertical). Internal dilution within the SMUs is accounted for by the estimation method; external mining dilution and other mining recovery factors are not included in the estimates. If a larger SMU size or a broader grade control drill pattern is implemented, then the selectivity assumed in the reported resources may not be realised. |
|
Metallurgical factors or assumptions |
|
The metallurgical test work information supplied to HSC indicates that the Tiris deposits are amenable to a process of crushing, screening and an alkaline carbonate leach in order to recover uranium. Bench scale test work indicates that a significant upgrade in uranium and decrease in sulphate concentrations can be achieved through screening. No penalty elements identified in work so far. No other assumptions have been made. |
|
Environmental factors or assumptions |
|
AEE has informed HSC that an Environmental and Social Impact Assessment has been completed, which concluded there are no known issues arising from native title, historical sites, environmental or third-party matters which are likely to materially affect exploitation. HSC therefore assumes that there are no known unusual aspects of the Tiris deposits that may lead to adverse environmental impacts beyond what is expected from a mining operation. Waste rock and process residue is expected to be disposed of in the areas surrounding the deposits and processing facility in a responsible manner and in accordance with all mining lease conditions. |
|
Bulk density |
|
Dry bulk density of diamond drill core samples was measured at the ALS facility in Nouakchott using an immersion method (Archimedes principle) on selected PQ diamond drill core intervals ranging in size from 10 to 30cm. Competent pieces of drill core were selected on a nominal interval of 50cm. The samples chosen are believed to be representative of the surrounding rock type. All density samples are wrapped in cling film to avoid water absorption. A total of 412 density measurements have been taken from drill core at the Tiris deposits with values ranging from 1.50 to 2.66t/m3 and averaging 2.13 t/m3. Measured density values show that there is a reasonable correlation between density and the depth of the sample. A regression was used to assign densities to each block in the block models based on depth below surface. |
|
Classification |
|
The classification is based on the search pass used to estimate the block. In some cases, the blocks at surface were populated in a later search pass than blocks immediately below, as these blocks did not meet the minimum search criteria due to the fact that there are no samples above the topography. In order to alleviate this, the minimum search pass from a column of blocks was propagated upwards. Pass one nominally equates to Measured Resources, pass two translates to Indicated Resources and Pass three equates to Inferred Resources. In deposits drilled entirely at 100x200m hole spacing, the entire resource was classified as Inferred, regardless of estimation pass, to maintain consistency with previous estimates. A small number of estimated model blocks occur outside the current AEE leases, and these were excluded from the reported MRE. This scheme is considered by HSC to take appropriate account of all relevant factors, including the relative confidence in tonnage and grade estimates, confidence in the continuity of geology and metal values, and the quality, quantity and distribution of the data. The classification appropriately reflects the Competent Person’s view of the deposit. |
|
Audits or reviews
|
|
This Mineral Resource estimate has been reviewed by Aura personnel. The estimation procedure has also been internally reviewed by HSC. No material issues were identified as a result of these reviews. No independent external audits have been completed on the Mineral Resource estimates. |
|
Discussion of relative accuracy/ confidence |
|
The relative accuracy and confidence level in the Mineral Resource estimates are considered to be in line with the generally accepted accuracy and confidence of the nominated JORC Mineral Resource categories. This has been determined on a qualitative, rather than quantitative, basis, and is based on the estimator’s experience with a number of deposits at NPM and similar deposits elsewhere. The main factors that affect the relative accuracy and confidence of the estimate are the drill hole spacing and the style of mineralisation. The estimates are local, in the sense that they are localised to model blocks of a size considered appropriate for local grade estimation. The tonnages relevant to technical and economic analysis are those classified as Measured and Indicated Mineral Resources. This deposit remains unmined so there are no production records for comparison.
|
Part B: Section 4 - Estimation and Reporting of Ore Reserves
Table 38: JORC Code 2012 Table 1, Section 4 – Estimation and Reporting of Ore Reserves
|
Criteria |
JORC Code explanation |
Commentary |
|
Mineral Resource estimate for conversion to Ore Reserves |
|
|
|
Site visits |
|
|
|
Study status |
|
|
|
Cut-off parameters |
|
|
|
Mining factors or assumptions |
|
|
|
Metallurgical factors or assumptions |
|
|
|
Environmental |
|
|
|
Infrastructure |
|
|
|
Costs |
|
|
|
Revenue factors |
|
|
|
Market assessment |
|
|
|
Economic |
|
|
|
Social |
|
|
|
Other |
|
|
|
Classification |
|
|
|
Audits or reviews |
|
|
|
Discussion of relative accuracy/ confidence |
|
|
Appendix 4: Material assumptions
The production target and the forecast financial information in this Announcement are based on the material assumptions set out below, which are disclosed as required by ASX Listing Rules 5.16.1 and 5.17.1. They should be read together with the proportions of Ore Reserves and Mineral Resources disclosed under ASX Listing Rule 5.16.3, the cautionary statement required by ASX Listing Rule 5.16.4, the Competent Person statements required by ASX Listing Rules 5.16.2, 5.17.2 and 5.22, and the Ore Reserve summary provided under ASX Listing Rules 5.8 and 5.9. All figures are on a 100% project basis in real terms as at October 2026. The assumptions are those adopted for the 2026 Bankable Feasibility Study. They are not predictions, and actual results may differ materially.
Table 39: Material assumptions
|
Area |
Assumption |
Basis |
|
Study basis |
2026 Bankable Feasibility Study. All figures in real US dollars on a 100% project basis. |
BFS Financial Model |
|
Production target |
111.1 Mt of ore at 225 ppm U3O8, mined over 26 years. |
BFS mine plan |
|
Resource classification |
67.1% Ore Reserves (28.3% Proved Ore Reserves and 38.8% Probable Ore Reserves) and 32.9% Inferred Mineral Resources and, by contained U3O8, 67.7% Ore Reserves and 32.3% Inferred Mineral Resources. Cumulative Inferred Mineral Resources comprise less than 12% of the ore mined in the first five years of the schedule, less than 25% of the ore mined in the first ten years, and about 43% of the ore mined from about year 16 to the end of the schedule. No exploration target or qualifying foreign estimate is included. |
Mineral Resource, ASX release 12 June 2024; Ore Reserve reported in this announcement; BFS mine plan |
|
Mining |
Owner-operated free-dig truck and shovel. No drilling or blasting. Strip ratio 1.00:1. Autonomous battery-electric haul trucks. |
BFS mine plan |
|
Beneficiation |
Scrub and screen at 75μm. About 88% of the mass is rejected and 91.9% of the uranium is kept. Leach feed averages 1,697ppm U3O8. |
BFS metallurgical test work |
|
Processing |
Alkaline sodium carbonate leach and moving-bed ion exchange. LOM Processing recovery 91.1% (steady state 91.5%). Overall LOM recovery 83.7%. |
BFS metallurgical test work |
|
Production |
46.1 Mlb of saleable U3O8, about 1.8 Mlb a year. |
BFS Financial Model |
|
Uranium price |
Base case US$90/lb U3O8, flat in real terms. Average realised price US$89.3/lb. Sensitivities run from US$70.0/lb to US$120.0/lb (Table 2). |
TradeTech Independent Marketing Assessment Report, August 2026. Spot US$89.7/lb and long-term contract US$97/lb at the date of the Study. |
|
Offtake |
Curzon, 300,000lb a year. Half at fixed prices of US$59.00 to US$66.50/lb, half at spot less 5%. All other sales at spot. |
Executed Curzon offtake agreement |
|
Development capital |
US$349.8 million. AACE Class 3 estimate, accuracy ±15%, base date October 2026. |
BFS capital cost estimate |
|
Sustaining and closure capital |
Sustaining capital US$203.4 million. Closure and rehabilitation US$20.0 million. |
BFS capital cost estimate |
|
Operating cost |
C1 cash cost US$32.53/lb. All-in sustaining cost US$41.25/lb. |
BFS operating cost estimate |
|
Power & Steam |
Solar and battery microgrid under a build-own-operate contract. Estimating basis US$0.15/kWh. Steam assumed $92/t steam, via diesel boiler. |
Request for Proposal tendering process adjudication, completed in September 2026 Previous steam / boiler studies |
|
Water |
Borefields supply 74 litres per second against a need of 56 litres per second. |
BFS water supply study |
|
Product transport |
Trucked 1,447 km to the Port of Nouakchott. Ocean freight to converter |
BFS logistics study |
|
Royalty and tax |
Royalty of 3.5% of FOB value. Corporate tax of 25% after a three-year holiday. Imported project inputs exempt from VAT. |
Mining Conventions, 27 January 2023 |
|
State interest |
15% held through ANARPAM, free-carried through construction. |
Mining Conventions, 27 January 2023, exploitation decrees |
|
Discount rate |
8% real, post-tax, ungeared. |
BFS Financial Model |
|
Funding |
US$400 million: US$220 million debt, assuming US$170 million senior and US$50 million subordinated debt, and US$180 million equity, royalties or quasi-equity. Funding is not secured and the final mix has not been determined. Any equity or quasi-equity funding is likely to dilute existing shareholders, potentially substantially. |
Advanced senior debt discussions with the U.S. International Development Finance Corporation (approximately US$150–US$170 million); non-binding MOU with a major international nuclear utility dated 2 June 2026; non-binding fully funded proposal from a major US investment fund |
|
Schedule |
Final investment decision December 2026. Construction from the first quarter of 2027 over about two years. First production by end of 2028. |
Company development schedule |
|
Tenure |
Exploitation permits granted 8 February 2019 for 30 years, expiring 8 February 2049. Renewable if all conditions are fulfilled. |
Permits; Government of Mauritania confirmation |
|
Exchange rates |
AUD:USD 0.70; MRU:USD 0.025. Held flat in real terms. |
BFS Financial Model |
|
Forecast financial information basis |
Post-tax, real, ungeared, 100% project basis, valuation date 1 January 2027. NPV at an 8% real discount rate. Attributable NPV is stated after the State's 15% free-carried interest. |
BFS Financial Model |
|
Inflation and escalation |
All costs and revenues in real terms as at October 2026. No escalation applied. |
BFS Financial Model |
|
Mining dilution and ore loss |
No separate dilution factor applied; tonnages are taken from regularised block models. Ore loss of about 1–3% applied by excluding blocks with less than 4% mineralisation. |
BFS mine plan |
|
Ramp-up |
Processing plant reaches nameplate capacity over about 18 months from first production. |
BFS process design and mine plan |
|
Approvals and permitting |
Exploitation permits, Mining Conventions, environmental approval and radiation authorisation in place. The 2025 ESIA update, outstanding management plans and closure cost and funding assurance remain to be finalised before construction. |
BFS approvals register |
|
Product specification and sales terms |
Saleable U3O8 meeting ASTM C967 specification, sold delivery by book transfer at the converter. |
BFS; executed Curzon offtake agreement |
|
Workforce |
Operating workforce peaking at about 438 personnel with 384 site-based roles, with >95% Mauritanian nationals. Labour rates based on in-country benchmarking. |
BFS operating cost estimate |
Appendix 5: Glossary
Table 40: Glossary of terms and abbreviations
|
Term |
Meaning |
|
AACE |
Association for the Advancement of Cost Engineering International |
|
AIM |
AIM market of the London Stock Exchange |
|
AISC |
All-in sustaining cost: C1 cash cost plus royalties, community contributions, sustaining capital and closure |
|
ANAC |
Agence Nationale de l’Aviation Civile – Mauritania’s civil aviation authority |
|
ANARPAM |
Agence Nationale de Recherches Géologiques et du Patrimoine Minier – the Mauritanian State agency holding the State's interest in the Project |
|
ANSTO |
Australian Nuclear Science and Technology Organisation |
|
ARSN |
Autorité de Radioprotection et de Sûreté Nucléaire – Mauritania's national radiation protection and nuclear safety authority |
|
ASTM |
ASTM International – the standards body whose specifications apply to uranium ore concentrate |
|
ASX |
Australian Securities Exchange |
|
ATA |
Activator-Tether-Anchor, a polymer conditioning technology from Clean TeQ Water used to improve dewatering of fine clays |
|
BFS |
Bankable Feasibility Study |
|
C1 cash cost |
Cash cost of mining, processing, site administration and product transport to market (Brook Hunt basis), excluding royalties |
|
Carnotite |
Potassium uranium vanadate mineral, K2(UO2)2(VO4)2·3H2O, the uranium mineral at Tiris |
|
DFC |
United States International Development Finance Corporation |
|
DFS |
Definitive Feasibility Study |
|
EBITDA |
Earnings before interest, tax, depreciation and amortisation |
|
EPCM |
Engineering, procurement and construction management |
|
ESIA |
Environmental and Social Impact Assessment |
|
FEED |
Front End Engineering Design |
|
FID |
Final investment decision |
|
FOB |
Free on board |
|
G&A |
General and administrative |
|
HAZOP |
Hazard and operability (study) |
|
HDPE |
High-density polyethylene |
|
HVBF |
Horizontal vacuum belt filter |
|
IAEA |
International Atomic Energy Agency |
|
ICRP |
International Commission on Radiological Protection |
|
IFC |
International Finance Corporation |
|
IMRFPC |
Institut Mauritanien de Recherche et de Formation en matière de Patrimoine et de Culture – Mauritanian institute responsible for archaeological heritage |
|
IRR |
Internal rate of return |
|
JORC Code |
Australasian Code for Reporting of Exploration Results, Mineral Resources and Ore Reserves (2012 edition) |
|
kWh / MW / MWh / MWp |
Kilowatt-hour / megawatt / megawatt-hour / megawatt peak (solar) |
|
Mlb |
Million pounds |
|
MBIX |
Moving-bed ion exchange |
|
MIK |
Multiple indicator kriging |
|
MOU |
Memorandum of understanding |
|
Mt / Mtpa |
Million tonnes / million tonnes per annum |
|
NORM |
Naturally occurring radioactive material |
|
NPV / NPV8 |
Net present value (NPV); NPV8 is net present value at an 8% real discount rate |
|
PLC |
Programmable logic controller |
|
PPA |
Power purchase agreement |
|
ppm |
Parts per million |
|
RO |
Reverse osmosis |
|
ROM |
Run-of-mine |
|
SDU |
Sodium diuranate, an intermediate uranium precipitate |
|
SNIM |
Société Nationale Industrielle et Minière – Mauritania’s state-owned iron ore company |
|
TOPP |
Tiris Optimised Pilot Plant |
|
U3O8 |
Triuranium octoxide, the standard measure of uranium content |
|
UOC |
Uranium oxide concentrate (yellowcake) |
|
VAT |
Value-added tax |
|
VSAT |
Very small aperture terminal (satellite communications) |
|
μm |
Micrometre (one-thousandth of a millimetre) |
[1] Aura holds its interest in Tiris via its wholly owned subsidiary, Aura Energy Mauritania Pty Ltd, which owns 85% of Tiris Ressources SA, the holder of 100% of the Project. The remaining 15% is held by the Mauritanian State agency ANARPAM on a free-carried, non-dilutable basis.
[2] ASX and AIM Release 16 December 2024: Substantial increase in Tiris Uranium Project Ore Reserves
[3] Totals may not add because of rounding.
[4] ASX Release 16 July 2014: Tiris Project Scoping Study
[5] Consensus nominal prices have been converted to real figures using a 2.5% inflation rate
[6] Source: TradeTech Independent Marketing Assessment and Update (November 2025 and August 2026). TradeTech’s model reflected Tiris FEED parameters (US$31.40/lb C1; US$230.1M CapEx). Aura Energy’s October 2026 BFS reports updated parameters of US$32.53/lb C1 (Oct-2026 base) and US$349.8M startup capital.
RNS may use your IP address to confirm compliance with the terms and conditions, to analyse how you engage with the information contained in this communication, and to share such analysis on an anonymised basis with others as part of our commercial services. For further information about how RNS and the London Stock Exchange use the personal data you provide us, please see our Privacy Policy.

Latest directors dealings
- 20 minutes ago Anglo American
- 23 minutes ago Xaar
- 57 minutes ago Jardine Matheson Holdings Ltd (Singapore Reg)
- 1 hour ago British Land Company
- 1 hour ago M&G