
Full Year Results
Summary by AI BETAClose X

IMMEDIATE RELEASE
Tuesday 15 September 2026
THE ALUMASC GROUP PLC
(“ALUMASC” or the “Group”)
FULL YEAR RESULTS ANNOUNCEMENT
Resilient performance and strategic progress in FY26, against a challenging macroeconomic environment
Positive start to FY27 with revenues up 5% year-on-year and latest order book up 56% on the prior year
Alumasc (ALU.L), the premium sustainable building products, systems and solutions Group, announces its results for the year ended 30 June 2026 (‘FY26’).
FY26 Highlights
- Group revenue was 6% lower at £107.1m (FY25: £113.4m), as commercial market demand remained subdued and project delays persisted across the UK construction sector
- Housebuilding Products was the standout performer, growing revenue by 16% in the weakest UK housebuilding market in almost 20 years, reflecting continued market share gains driven by product innovation, market leading product knowledge, technical support and strong customer service
- Building Envelope held revenue at the record level set in FY25 (which had grown by 11% over FY24), despite ongoing commercial project delays driven by economic and political uncertainty
- Water Management’s revenue – excluding deliveries to the CLK Airport project, which boosted FY25 – declined by 4%; including CLK, overall divisional revenue declined by 16%
- Group underlying* profit before tax (UPBT) was £10.0m (FY25: £14.2m) and the underlying* operating margin was 10.5% (FY25: 13.7%); lower profitability was predominantly driven by the performance in Water Management
- Statutory profit before tax was £9.7m (FY25: £12.3m)
- Conversion of underlying operating profit into cash at 103% (FY25: 106%); >100% despite incremental working capital investment to mitigate short term impacts of Middle East conflict
- Full year dividend maintained at the record FY25 level of 11.1p per share, reflecting the Board’s confidence in the Group’s balance sheet, strategy and prospects
- Defined benefit pension scheme surplus improved to £5.9m on an IAS 19 basis (June 2025: £4.8m)
-
Strong balance sheet maintained throughout the year:
- Net bank debt of £6.9m (FY25: £5.8m)
- Conservative leverage ratio of 0.5x (FY25: 0.35x)
- Allowed continued investment in capacity, overseas growth and supply chain resilience
- Bank facilities renewed on 1 September 2026, providing flexibility and capacity for continued organic and inorganic investment; borrowing margin reduced by 20bps
Outlook
- Alumasc has made a positive start to FY27, with Group revenue in the first two months up 5% year-on-year
- Order intake has remained positive, with the Group order book at 31 August 2026 up 56% on August 2025
- First call-offs received in FY27 from the significant Changi Airport project
- The Board remains confident of improved FY27 margins, supported by restructuring benefits and operational improvements
- The Board remains confident that the Group’s growth strategy, supported by a strengthened order book and market-leading sustainable products, will deliver profitable growth and shareholder value over the medium to longer term
Strategic and operational progress, despite challenging market conditions
Championing sustainable building products
- >80% of Group revenue is derived from products and systems that address environmental challenges in the built environment – decarbonisation, energy efficiency, water management and urban biodiversity
- Environmental product declaration (‘EPD’) certified products now account for approximately 34% of Group revenue, with further roll-out planned in FY27
Accelerating organic revenue growth
- Building Envelope and Housebuilding Products both grew market share in difficult conditions, underpinned by trusted brands, technical support and service levels that continue to differentiate Alumasc from competition
- Water Management’s performance reflected the non-recurrence of substantial CLK Airport (Hong Kong) project revenues in FY25; there has been encouraging early traction from actions to improve customer service and operational efficiency, supported by a growing order book and opportunity pipeline
-
Non-CLK overseas revenue grew 36% year-on-year:
- Further overseas technical sales resource added in late FY26 to support a growing international pipeline
- First call-offs received in FY27 from the significant Changi Airport project in Singapore
Driving margin improvement
- The management team’s restructuring actions within Water Management delivered £1.3m of annualised overhead savings in FY26, with a further £0.9m of benefits expected in FY27
- Additional margin enhancement opportunities remain through the integration of Rainwater Products operations and supply chain optimisation
- The Board remains confident of improved FY27 margins, supported by restructuring benefits and operational improvements, and reaffirms its medium-term operating margin target range of 15-20%
Value-enhancing investment
- Strong balance sheet position allowed for both short-term inventory investment (to mitigate Middle East conflict-related price and supply chain risk) and longer-term strategic investment
- Two further injection moulding machines added at Housebuilding Products, increasing capacity, productivity and manufacturing flexibility
- A number of acquisition opportunities were reviewed in the year; the disciplined approach to M&A requires targets to meet with strict criteria which ensures complementary services, identification of routes to adding value and synergistic benefits
Leadership
- After 25 years with Alumasc, Paul Hooper stepped down as Chief Executive on 31 March 2026
- Pamela Bingham was appointed Chief Executive from 1 April 2026; her employment was subsequently terminated on 28 August 2026, as separately announced
- The Group’s Executive Directors, with 35 years’ combined tenure at Alumasc, continue to provide leadership continuity, supported by the wider management team and Vijay Thakrar as Interim Executive Chair
Commenting on the results reported today, Vijay Thakrar, Interim Executive Chair, said:
“This has been a very challenging year for the UK construction sector, and I am pleased that within that context our results reflect the resilience and differentiation of the Group. Housebuilding Products delivered 16% revenue growth in the weakest UK housebuilding market in almost 20 years – a genuinely outstanding performance. Building Envelope held revenues at last year’s record level despite persistent project delays and, while Water Management results have been disappointing, we are taking action to improve efficiency, reduce costs and strengthen customer service, and are encouraged by the early progress being made within that division.
We do not anticipate any meaningful near-term increase in UK construction activity levels. Despite this, we have made a positive start to FY27, with revenues for the first two months of FY27 5% higher year-on-year, and the August 2026 order book up 56% on the prior year. This gives the Board real confidence that our strategy, built on sustainable products and disciplined self-help, will continue to drive value for shareholders.”
*A reconciliation of underlying to statutory profit is shown in note 5
Enquiries:
The Alumasc Group plc
Vijay Thakrar (Interim Executive Chair) +44 (0)1536 383844
Simon Dray (CFO/Company Secretary)
Cavendish (Nominated Adviser & Joint Broker)
Julian Blunt, Edward Whiley (Corporate Finance) +44 (0)207 220 0500
Will Smith (Corporate Broking)
Peel Hunt (Joint Broker)
Mike Bell +44 (0)207 418 8831
Ed Allsopp
Camarco (Financial PR)
Ginny Pulbrook +44 (0)203 757 4980
Tilly Butcher
Rebecca Waterworth
alumasc@camarco.co.uk
Notes to Editors:
Alumasc is a UK-based supplier of premium sustainable building products, systems and solutions. More than 80% of Group sales are driven by building regulations and specifications (architects and structural engineers) because of the performance characteristics offered.
The Group has three business segments with strong positions and brands in their individual markets. The three segments are: Water Management; Building Envelope; and Housebuilding Products.Interim Executive Chair’s Statement
Resilient performance in challenging conditions
Although Group revenues declined by 6% to £107.1m (FY25: £113.4m), the business demonstrated real resilience, led by Housebuilding Products (16% growth in the worst market for housebuilding since the 2008 financial crisis almost 20 years ago1) together with clear strategic progress. Building Envelope maintained its revenues at the record levels of FY25 (which had grown by 11% over FY24) in difficult commercial markets with ongoing project delays due to economic and political uncertainty. While the overall decline in Water Management of 16% was disappointing, the reduction was 4% excluding the CLK Airport project in Hong Kong, which contributed significantly to FY25 revenues.
The resulting Group underlying profit before tax (UPBT)2 for FY26 was £10.0m (FY25: £14.2m). Statutory profit before tax was £9.7m (FY25: £12.3m).
Board matters
After 25 years with Alumasc, Paul Hooper retired as Chief Executive on 31 March 2026, as announced in September 2025. We thank Paul for his service and wish him a long and happy retirement.
A thorough process was undertaken to recruit Paul’s replacement, using the services of a FTSE-250 listed recruiter. Pamela Bingham was duly appointed to become CEO from 1 April 2026, following a handover from Paul Hooper during March 2026. Regrettably, as announced on 28 August 2026, Pamela’s employment was terminated on that date.
The interim arrangements announced previously continue, with our Executive Directors (who have some 35 years’ combined tenure at Alumasc, and many more in manufacturing businesses generally) providing continuity in business leadership, supported by Alumasc’s wider management teams and me as Interim Executive Chair. This leadership and management structure provides stability to our people and business which, as outlined below, has contributed to a positive start to FY27 trading.
For governance reasons, I have suggested, and the Board has agreed, that it would be appropriate for me to step down from the Audit and Remuneration Committees with immediate effect for the period I am acting in an executive role.
Performance – divisional overview
Alumasc’s resilient performance was achieved by taking increased market share in a number of markets, by developing innovative, high-quality products and delivering exceptional customer service.
Housebuilding Products achieved underlying operating profit growth from £4.2m to £4.7m. This division has shown a consistent ability to understand and meet customers’ needs, with outstanding service and new product launches, enabling it to gain market share and grow into adjacent markets.
Building Envelope delivered a respectable performance, on the back of a record FY25, in a challenging commercial market, with revenues maintained. There was a slight softening in operating margins due to cost increases and some investments to enhance the division’s product certifications and technical service, leading to underlying profits reducing from £5.3m to £4.9m.
Water Management’s underlying profit reduction from £8.0m to £3.3m, was disappointing, notwithstanding that FY25 benefitted from the large CLK Airport project. The division was impacted by project delays in the UK and cost pressures from the lower volumes, resulting in reduced profitability. There are also significant business improvement opportunities in this division, which the management team and Executive Directors are focused on.
Strategy and ambitions
We remain committed to driving both organic and acquisitive growth in line with our four strategic value creation priorities:
Championing sustainable building products
Over 80% of the Group’s revenues derive from products and systems that address environmental challenges facing the built environment, around building decarbonisation/energy efficiency, water management and urban biodiversity. We also champion the use of recycled materials to make high-quality, durable and low-maintenance products that are themselves recyclable at the end of their life. We believe these long-term, structural growth drivers are stronger than ever and represent an area of real differentiation for the Group.
We have continued the roll-out of our EPD certification, which provides customers with product-level environmental impact data. Products with EPDs now account for approximately 34% of our revenue, and we aim to continue to further expand coverage in the coming year.
Our product development activities prioritise environmental solutions. Examples launched this year include Housebuilding Products’ new Loftite Loft Door, with its focus on durability, ease of installation and enhanced thermal performance through improved airtightness; and Building Envelope’s first 100% recycled bituminous roofing membrane.
Accelerating organic revenue growth
Alumasc has strong positions in sustainable building products, backed by trusted brands and market-leading customer service and technical support. Our Building Envelope and Housebuilding Products divisions have managed to increase market share in challenging market conditions. Water Management’s performance showed resilience, against a prior year that included significant revenues from its large project at CLK Airport. We are taking action to improve customer service and operational efficiency in the Water Management division. Our robust and growing order book and opportunity pipeline indicates some initial traction from these measures, and gives us confidence in the latent demand for our products. Further improvements, utilising the combined supply chain and manufacturing capabilities of the Rainwater Products businesses ARP and AWMS, should begin to benefit from the second half of FY27.
Driving margin improvement
The Group has been focused on self-help measures throughout FY26 to improve operational efficiency, particularly around its Water Management division, which has overlapping supply chains and duplicated processes across its constituent businesses. Initial efficiency measures have removed an annualised £1.3m of operating overheads, which will benefit FY27 with an incremental £0.9m of savings; further cost efficiencies will become possible when we harmonise supply chains within the Rainwater Products businesses, and use best practices from each company to create manufacturing centres of excellence.
Notwithstanding the temporary step-back in margin, the Board remains confident in an improved margin in FY27, and in the Group achieving its medium-term target operating margin of 15-20% once market volumes recover.
Value-enhancing investment
The Group’s strong balance sheet has allowed it to continue to invest in opportunities to maintain and grow shareholder value: both short-term, where buffer stocks were quickly secured to mitigate price rises and potential supply chain disruptions arising from the Middle East conflict; and longer term, with further investments to deliver progress against the other strategic value creation priorities.
Key expenditure in the year included two further injection moulding machines at Housebuilding Products, to increase capacity headroom and improve manufacturing flexibility. We are starting to see returns from our previous investment in overseas technical sales resource, with year-on-year non-CLK overseas revenues increasing by 36%, and early FY27 saw the first call-offs from the significant project at Changi Airport in Singapore. The overseas pipeline of opportunities continues to grow, and we have added further overseas resource in late FY26 to improve technical support in target territories.
We have examined a number of acquisition opportunities in the year and will continue doing so. We will maintain a very disciplined approach to considering acquisitions and will have regard to any business’ ability to add value to our shareholders as well as our ability to help the target business be more successful through synergies and complementarity with Alumasc’s existing offerings.
Defined benefit pension scheme in surplus
At the end of June 2026, the Scheme had a surplus on an IAS 19 basis of £5.9m (June 2025: £4.8m). We continue working collaboratively with the pension scheme trustees to help further secure member benefits while managing costs to the Scheme and Company, and will take further actions to derisk the Scheme when appropriate.
Dividend level maintained
Reflecting the Board’s confidence in the Group’s strategy and future prospects, the full year dividend will be maintained at the record FY25 levels. Hence, a final dividend of 7.6p will be recommended which, if approved by shareholders, will be payable on 4 November 2026 to members on the share register on 25 September 2026. With our interim dividend of 3.5p paid in April 2026, this would make a total dividend per share of 11.1p (FY25: 11.1p). We aim to increase future dividend levels once profitability rises, in line with our medium-term objective of 2.5–3.0 times earnings cover and progressive dividend policy.
Protecting and recognising our resilient people
Our main priority in the workplace is the safety of our people and this is the first item for discussion and review at each Board meeting. The number of days lost as a result of accidents in 2025/26 was ten (2024/25: three days lost). While this related to a single minor incident, we must not be complacent and Health & Safety remains a key priority for the Board and management teams.
Our people have shown remarkable resilience and commitment in challenging circumstances during the year. On behalf of the Board and our shareholders, I thank each member of the management team and staff for their contribution to Alumasc.
Looking ahead – strong order book, positive start to FY27 and renewed focus on profitable growth
While commercial and residential market conditions remain challenging, amidst ongoing macroeconomic and geopolitical uncertainty, Alumasc exited FY26 with a strong order book, up 49% on FY25. The Group has made a positive start in the first two months of FY27, with revenues 5% higher than the prior year. Order intake has also remained positive, with the order book at 31 August 2026 56% higher than at August 2025.
Our teams remain focused on developing quality products and providing superior service to the market and are driven to make further business improvements. We are therefore optimistic that our growth strategy, with an emphasis on environmentally sustainable products, will deliver substantial growth in profits and shareholder value in the medium to longer term.
Vijay Thakrar
Interim Executive Chair
15 September 2026
1 Source: Rightmove August 2026
2 A reconciliation of underlying to statutory profit is shown in note 5
Financial Review
Performance
£m |
FY26 |
FY25 |
Change |
Revenue |
£107.1m |
£113.4m |
(5.6)% |
Cost of sales |
£(68.1)m |
£(70.4)m |
(3.2)% |
Gross profit |
£39.0m |
£43.0m |
(9.3)% |
Gross margin |
36.4% |
37.9% |
(150)bps |
Net operating expenses |
£(27.8)m |
£(27.4)m |
1.1% |
Underlying operating profit1 |
£11.2m |
£15.6m |
(27.9)% |
Underlying operating margin |
10.5% |
13.7% |
(320)bps |
Net finance costs |
£(1.2)m |
£(1.4)m |
10.1% |
Underlying profit before tax1 |
£10.0m |
£14.2m |
(29.6)% |
Non-underlying items |
£(0.3)m |
£(1.9)m |
|
Statutory profit before tax |
£9.7m |
£12.3m |
(20.6)% |
1 Reconciliations of underlying to statutory operating profit and profit before tax are included in note 5
The Group’s performance was resilient, in challenging end markets and against a prior year which included significant revenues from the CLK airport project in Hong Kong.
Group revenue of £107.1m was £6.3m (6%) below the prior year (FY25: £113.4m). Excluding revenues from the CLK project, Group revenues increased by 0.4%; a 2% decline in UK revenues were partially offset by a 36% increase in non-CLK export revenues.
Gross profit was £39.0m (FY25: £43.0m), representing a gross margin of 36.4% (FY25: 37.9%). A portion of the Group’s cost of sales are fixed, so the lower volumes are the primary contributor to the 150 basis point margin reduction. Cost and fuel price volatility in the second half of the year was managed well and passed on through temporary surcharges.
Underlying1 operating profit was £11.2m (FY25: £15.6m); an underlying operating margin of 10.5% (FY25: 13.7%), which is a result of the lower volumes and the Group’s operational gearing.
Underlying1 profit before tax was £10.0m (FY25: £14.2m), and statutory profit before tax was £9.7m (FY25: £12.3m).
Divisional performance
Water Management |
FY26 |
FY25 |
Change |
Revenue |
£46.6m |
£55.5m |
(16.1)% |
Underlying operating profit1 |
£3.3m |
£8.0m |
(59.4)% |
Underlying operating margin1 |
7.0% |
14.5% |
(750)bps |
Operating profit |
£2.5m |
£6.1m |
(59.0)% |
1 Prior to restructuring costs of £0.4m (FY25: £1.5m) and intangible asset amortisation charge of £0.4m (FY25: £0.4m)
Water Management divisional revenue declined by £8.9m, of which the CLK project accounted for £6.8m.
The remainder of the shortfall arose from UK revenues, which were 6% below the prior year, on a constrained planning environment, affordability concerns and fragile confidence levels, particularly affecting its key mid-high rise construction and housebuilding markets. This was partially offset by growth in non-CLK divisional export revenues, following investments made in overseas technical support service.
As a manufacturer, Water Management has significant operational gearing, and divisional operating margin was significantly affected by the lower volumes, declining to 7.0% (FY25: 14.5%). Efficiency improvements at the division’s sites at Burton Latimer (rainwater products) and Halstead (covers and drainage) sites have removed an annualised £1.3m of overheads, of which £0.4m was realised in FY26, with the £0.4m cost presented as a non-underlying item.
The order intake in the second half of FY26 was strong, providing further evidence of improved commercial focus, and the division’s order book at June 2026, at £9.8m, was 81% higher than at June 2025, including £2m for the first phase of a project at Changi Airport in Singapore, with subsequent phases – yet to be tendered – potentially worth a further £10m-£15m over the medium term. The first deliveries for this project are expected to be made in early FY27.
While the growing order book points to some conversion of the latent demand into revenue, the division’s focus remains on self-help initiatives, to better support its market-leading brands with best-in-class customer service, and further efficiencies from its supply chain and manufacturing processes.
Building Envelope |
FY26 |
FY25 |
Change |
Revenue |
£41.8m |
£41.8m |
(0.1)% |
Underlying operating profit1 |
£4.9m |
£5.3m |
(8.5)% |
Underlying operating margin1 |
11.6% |
12.7% |
(110)bps |
Operating profit |
£4.9m |
£5.3m |
(8.5)% |
1 No adjustments in FY26 or FY25
The Building Envelope division produced a resilient performance, despite the adverse market conditions and the conflict in the Middle East causing volatility in its supply chain and customer demand levels. The division was able to successfully navigate these challenges, assisted by its strong customer relationships, coupled with its market-leading product knowledge and technical support.
Divisional revenue was in line with the prior year at £41.8m (FY25: £41.8m). Year-on-year volumes were around 1% lower, but this was offset by price increases required to pass through cost increases. The lower volume, and some investments to maintain the division’s leadership in technical, product and customer service, meant that the division’s underlying operating margin was slightly lower than the prior year, at 11.6% (FY25: 12.7%).
Sustainability credentials as well as performance are vitally important in this market, and the division has continued to develop systems which exceed all relevant criteria while leading the industry in recycled content and lower whole-life cost. The division continues to gain market share, and its order book at June 2026 was 14% higher than a year ago, with a robust pipeline of opportunities. The first two months of FY27 showed early signs of an improving rate of conversion into sales.
Housebuilding Products |
FY26 |
FY25 |
Change |
Revenue |
£18.7m |
£16.1m |
16.5% |
Underlying operating profit1 |
£4.7m |
£4.2m |
12.3% |
Underlying operating margin1 |
25.1% |
26.0% |
(90)bps |
Operating profit |
£4.7m |
£4.2m |
12.3% |
1 No adjustments in FY26 or FY25
Housebuilding Products division performed extremely well in the year, despite further declines in new housebuilding volumes in 2026. Divisional revenue grew by over 16%, of which price rises accounted for approximately 3%, with the remainder a result of higher volumes from market share gains. Underlying divisional operating profit rose by 12% to £4.7m (FY25: £4.2m).
The division has achieved 11% compound annual growth in revenue since Covid, despite a 2% annual decline in UK housebuilding starts over the same period. This success results from the successful implementation of – and relentless focus on – its strategy: next day delivery and low carriage-paid order values, along with excellent sustainability credentials, expert technical support, and a continuous new product development programme.
The divisional underlying operating margin fell slightly to 25.1% (FY25: 26.0%), due to product mix.
The division is well positioned for continued market outperformance, with investments in the year to improve capacity and manufacturing capability, and will benefit disproportionately from the eventual recovery in housebuilding volumes.
Non-underlying items
The Board reports underlying profit and underlying earnings as an alternative performance measure, for internal performance analysis, planning and employee compensation arrangements. This measure excludes certain items such as amortisation of acquired intangible assets, pension scheme finance costs, acquisition expenses and restructuring costs, which are non-trading and/or exceptional by their size and incidence.
The non-underlying items in the current and prior financial year were:
£m |
FY26 |
FY25 |
Acquired intangible asset amortisation |
0.4 |
0.4 |
Restructuring costs |
0.4 |
1.5 |
Profit on disposal of property |
(0.4) |
- |
Acquisition expenses |
0.1 |
0.1 |
Non-underlying operating expenses |
0.5 |
2.0 |
IAS 19 pension scheme finance income |
(0.2) |
(0.1) |
Non-underlying finance income |
(0.2) |
(0.1) |
Total non-underlying items |
0.3 |
1.9 |
Amortisation of acquired intangible assets of £0.4m (FY25: £0.4m) is a non-cash charge arising from the application of accounting standards, to write off the estimated value of brands and other intangibles associated with acquired businesses over their estimated useful life.
Current year restructuring costs of £0.4m were incurred in reorganising the Water Management commercial and manufacturing operations. The prior year charge of £1.5m was incurred in relocating the access cover manufacturing operations from Dover to Halstead and in commissioning the new equipment.
The profit on sale of property relates to the disposal of the Group’s Dover site, following relocation of its operations to Halstead, which realised proceeds of £0.5m and a profit of £0.4m.
Acquisition expenses of £0.1m (FY25: £0.1m) are third-party costs relating to the Group’s ongoing acquisition activities.
IAS 19 pension scheme finance income of £0.2m (FY25: £0.1m) is a non-cash item related to the Group’s legacy defined benefit scheme, and is calculated by actuaries to reflect the notional financing income from the Group’s pension surplus.
Taxation
The Group’s underlying effective tax rate was 26.2% (FY25: 24.2%), compared to the average UK corporation tax rate for the year of 25.0% (FY25: 25.0%). The Group’s effective tax rate varies in line with the UK tax rate and the balance of available reliefs, non-taxable income and expenses, and in FY26 was increased by a lower proportion of Group profit tax at lower rates overseas, and the reduction in payments into the Group’s defined benefit pension scheme.
The Group’s effective tax rate on statutory profit before tax was 24.9% (FY25: 23.9%). A reconciliation of this rate to the average UK corporation tax rate for the year is included in note 9 to the financial statements.
Earnings per share
Basic earnings per share was 20.3p (FY25: 25.9p), and underlying earnings per share was 20.5p (FY25: 29.9p).
Dividends
The Board has recommended to shareholders a final dividend of 7.6 pence per share (FY25: 7.6 pence), which will absorb an estimated £2.7m of shareholders’ funds. This has not been accrued in these accounts as it was proposed after the end of the financial year. Subject to shareholder approval at the Annual General Meeting on 27 October 2026, it will be paid on 4 November 2026 to members on the share register on 25 September 2026. The closing date for dividend reinvestment plan (DRIP) elections is 9 October 2026.
Together with the interim dividend of 3.5 pence per share (FY25: 3.5 pence) paid to shareholders on 8 April 2026, this will bring the total distribution for the year to 11.1 pence per share (FY25: 11.1 pence), which is covered 1.9 times (FY25: 2.7 times) by underlying earnings per share. We anticipate recovering profitability will allow future dividend increases while restoring cover to our medium-term objective of 2.5–3.0 times.
Cash flows and net debt
Underlying operating cash flow
£m |
FY26 |
FY25 |
Underlying operating profit |
11.2 |
15.6 |
Depreciation and underlying amortisation |
4.5 |
3.9 |
Share-based payments |
0.2 |
0.2 |
Working capital movements |
(3.6) |
(1.9) |
Underlying operating cash flow |
12.3 |
17.8 |
Pension deficit funding |
(0.8) |
(1.2) |
Cash generated by underlying operating activities |
11.5 |
16.6 |
Operating cash conversion |
103% |
106% |
Non-underlying cash flows |
(0.1) |
(1.6) |
Cash generated by operating activities |
11.4 |
15.0 |
Cash generated by underlying operating activities – before non-underlying cash flows – was £11.5m (FY25: £16.6m), reflecting the timing of shipments into the CLK project in Hong Kong, which will normalise over the first quarter of FY27, and buffer stocks taken on over the final quarter of FY26, to mitigate against input cost volatility and extended supply lead times arising from the Middle East conflict.
Annual pension payments were £0.8m (FY25: £1.2m), following the reduction in annual contributions from £1.2m to £0.7m from September 2025, agreed with the scheme trustees at the 2025 Triennial Valuation.
Despite the cash outflow into working capital, cash generated by underlying operating activities represented 103% (FY25: 106%) of underlying operating profit, ahead of the Group target of at least 100%.
Net cash outflows in respect of non-underlying items were £0.1m (FY25: £1.6m).
Movement in net bank debt
£m |
FY26 |
FY25 |
Cash generated by operating activities |
11.4 |
15.0 |
Capital expenditure |
(2.6) |
(2.6) |
Interest |
(1.2) |
(1.3) |
Tax |
(2.5) |
(2.6) |
Lease principal repaid |
(1.8) |
(1.6) |
Other cash flows |
- |
(0.3) |
Free cash flow |
3.3 |
6.6 |
Acquisition of businesses |
- |
(0.7) |
Purchase of own shares |
(0.4) |
(0.5) |
Dividend payments |
(4.0) |
(3.9) |
(Increase)/decrease in net bank debt |
(1.1) |
1.5 |
Capital expenditure was £2.6m (FY25: £2.6m), representing 61% (FY25: 66%) of depreciation/amortisation. This included additional manufacturing machinery and tooling at the Housebuilding Products site in Goole, to improve capacity and manufacturing capability and support new product development; and a further CNC machining centre at the Water Management site in Halstead to reduce manufacturing costs and increase capacity for the Wade drainage range.
Tax payments of £2.5m (FY25: £2.6m) were broadly in line with the prior year, due to the timing of payments on account.
After interest payments of £1.2m (FY25: £1.3m), repayment of £1.8m (FY25: £1.6m) of lease liabilities, and other payments of £nil (FY25: £0.3m), free cash flow was £3.3m (FY25: £6.6m).
Cash paid to acquire shares in the Group, to fulfil the vesting of employee share options, totalled £0.4m (FY25: £0.5m); and dividend payments in the year were £4.0m (FY25: £3.9m).
The increase in net bank debt in the year was £1.1m (FY25: £1.5m decrease).
Net debt
£m |
30 June 2026 |
30 June 2025 |
Net bank debt |
6.9 |
5.8 |
IFRS 16 lease liabilities |
7.5 |
6.9 |
Total (IFRS 16) debt |
14.4 |
12.7 |
Net bank debt at 30 June 2026, on which the Group’s banking covenants are based, was £6.9m (2025: £5.8m). Total debt, including lease liabilities, was £14.4m (2025: £12.7m), with leverage at 0.5x (2025: 0.35x).
Financial position
Group net assets at 30 June 2026 were £43.7m (2025: £41.0m).
Pensions
The Group accounts for its legacy defined benefit pension retirement obligations in accordance with IAS 19 Employee Benefits, based on the market value of scheme assets and a valuation of scheme liabilities using a discount rate based on AA-rated corporate bond yields at year end. Mortality and inflation rates assumptions have been aligned with updated actuarial information. The IAS 19 defined benefit scheme net surplus at 30 June 2026, before deferred taxes, was £5.9m (2025: £4.8m). The scheme surplus has been recognised on the Group balance sheet, as the Group has an unconditional right to recover any surplus on settlement of the scheme’s liabilities.
The scheme’s actuarial valuations, rather than the accounting basis, are used to evaluate the level of Group contributions into the scheme.
Following the triennial review in March 2025, the Group agreed to reduce its annual contributions to £0.7m from September 2025. This level of contributions is intended to allow the scheme to reach a position of low dependency (where the scheme is expected to be able to meet its future liabilities using prudent investment assumptions, with a low likelihood of requiring further contributions from the Group) prior to the scheme’s point of significant maturity in 2030. The Group continues to monitor the scheme’s funding level, and will take further derisking actions in consultation with the trustees when appropriate.
Banking facilities and covenants
The Group’s treasury function aims to ensure the availability of sufficient liquidity to meet the Group’s operational and strategic needs, at optimal cost. The Group projects facility utilisation and compliance with the associated covenants during its short-term forecasting, annual budgeting and strategic planning exercises, to ensure adequate headroom is maintained, taking account of the Group’s expected performance and investment plans.
The Group refinanced its revolving credit facility on 1 September 2026, on a club basis with its key relationship banks HSBC and Barclays. The new facility comprises a committed £30m revolving credit facility and an uncommitted £20m accordion facility. The initial term runs to 30 August 2029, with two further one-year extension options.
The Group’s current banking facilities comprise:
- A committed, unsecured £30m revolving credit facility, which expires in August 2029, extendable to August 2031 through two one-year extension options;
- An uncommitted £20m accordion facility, which would allow the Group to increase its revolving credit facility to £50m if exercised and approved; and
- Overdraft facilities, repayable on demand, of £4m.
The covenants associated with these facilities are set out below, together with the reported figures at 30 June 2026 and 2025:
|
Covenant |
30 June 2026 |
30 June 2025 |
Net debt: EBITDA |
<2.5 |
0.5 |
0.35 |
Interest cover |
>3.5 |
16.9 |
16.9 |
Return on investment
The Group defines its invested capital as shareholders’ funds, including historic goodwill but excluding net bank debt, pension surplus/deficit (net of tax) and lease liabilities. The Group’s post-tax return on invested capital (underlying operating profit after tax, divided by invested capital) was 16.0% (FY25: 24.9%), well in excess of the Group’s weighted average cost of capital, which the Group estimates to be circa 13%.
Capital structure and capital allocation
The Group aims to create value by delivering strong and sustainable financial returns well in excess of its cost of capital. It achieves this by investing the capital provided by its cash-generative operations and its strong balance sheet in a disciplined manner consistent with its long-term strategy. The Board’s capital allocation priorities are:
- Maintaining debt at a prudent level, with a gearing ratio (net debt to EBITDA) below 1.5x, while:
- Investing in organic growth, principally through capital expenditure and investment in organisational capabilities, particularly in research and development, manufacturing capacity and efficiency, and sales, customer support and marketing resources;
- Providing regular returns to shareholders through a progressive dividend policy, which aims to increase dividends broadly in line with earnings, while maintaining a prudent level of cover; and
- Investing in inorganic growth, identifying bolt-on acquisition targets in current or adjacent markets, which complement the Group’s existing businesses and deliver synergies.
Simon Dray
Chief Financial Officer
15 September 2026
PRINCIPAL RISKS AND UNCERTAINTIES
Mitigating actions taken | |
Climate change The potential for disruption from extreme weather events, along with the transitional risks from addressing the longer-term impacts of climate change. The increasing severity and frequency of extreme weather conditions could impact our operations, supply chains and logistics. Prolonged periods of severe weather could slow construction activity, impacting demand for the Group’s products. Regulations could lead to increased costs for our raw materials and supply chain. |
• Implementing dual sourcing arrangements to provide greater resilience and cost efficiency • Working with suppliers and logistics partners to ensure they have decarbonisation and continuity plans in place • Strategic buying of core products and localised and efficient stocking • Development of targets and actions for reducing our Scope 1, 2 and 3 greenhouse gas emissions • Publication of environmental metrics for our customers, employees, shareholders and other stakeholders • Promoting the circular economy by using recycled materials to make durable products which are themselves recyclable at the end of their useful life • Product range and new product development programme focused on providing environmental solutions which improve energy efficiency in buildings, help climate change resilience through improved water management, and provide urban green spaces
|
Geopolitical and macroeconomic uncertainty and conflict Demand for our products and the costs of our materials may be impacted by global conflicts and trade tensions and their effect on economic conditions, interest and inflation rates, political and economic uncertainty and consumer confidence..
|
• Strategic positioning and targeting of export markets/sectors anticipated to grow faster than the UK construction market • Constantly seeking new markets and receiving revenues from a diverse range of end-use construction markets • Monitor industry trends and market conditions and manage demand forecasts at management meetings • Development of added value systems and solutions that are underpinned by legislation, building regulation and/or specified by architects and engineers • Product range and new product development activities are focused on environmental solutions, where we believe demand is more resilient and growing faster than the general construction market • Increasing supply chain flexibility and resilience, by seeking dual sourcing for key products • Supply chain is managed through clear contracting processes, pricing and any cost increases that cannot be avoided or mitigated are passed on through sales pricing • Limited exposure to currency risk, mainly the euro and US dollar. These exposures are hedged where appropriate, in line with timing and likelihood of currency exposures |
Supply chain/inflation International supply chain risks increased due to international tension and conflicts, along with price inflation, skilled staff shortages, increased tariffs/duties.
|
• Annual strategic reviews, including supplier, quality, reliability, and sustainability • Brand and product strength has allowed cost increases to be largely recovered through higher prices • Regular key supplier visits, focus on relationships, quality control reviews and training. Further opportunities to consolidate spend with high quality suppliers • Supplier questionnaires and export checks are completed to ensure compliance with Group policies, including sanctions, denied parties, anti-bribery, anti-fraud, anti-modern slavery and ESG • Supply chain strategies are used to avoid dependence on single sources of supply • Flexible supply chains which allow for rapid deployment of contingency stocks should new supply or cost risks emerge |
Cyber security and business interruption Cyber security risks and business interruption risks are increasing globally. The risk of a business disruption from IT systems failure or cyber-crime could cause business interruption, loss of trade, loss of data and financial or reputational damage. |
• Cyber risk is owned by the Chief Financial Officer and IT Director with divisional management teams, and the Board receives regular updates. • IT disaster recovery plans are in place for all businesses and tested annually • Awareness training and management briefings held on cyber security risks and actions taken as preventative measures. Key staff receive additional training on cyber, phishing and online risks • Security protocols and software are installed to continually monitor and mitigate new and evolving cyber threats • Cyber security reviews and audits are conducted on a regular basis with our security partners • Critical plant and equipment are identified, with associated breakdown/recovery plans in place |
Credit risk The risk of financial loss should customers be unable to settle invoices when they fall due.
|
• Most credit risks are insured • Large export contracts are backed, where possible, by insurance, letters of credit, performance bonds, guarantees or similar • Any risks taken above insured limits are subject to strict delegated authority limits • Credit checks performed when accepting new customers/new work • The Group employs experienced credit controllers and aged debt is reviewed at monthly subsidiary board meetings |
Health & Safety risks Health & Safety incident/injury could occur despite a strong culture and previous performance. Consequential reputational risk and legal costs. |
• Health & Safety and staff wellbeing is a core value of management and the first Board agenda item • Health & Safety commitment communicated to all levels of the business with procedures in place to manage and report on compliance • Risk assessments are carried out and safe systems of work documented and communicated • Learning from incidents, and near-miss reporting and remediation is conducted at all sites • All safety incidents and significant near misses are reported at Board level monthly, with appropriate remedial action taken • Group Health & Safety best practice days are held twice a year, chaired by the Chief Executive Officer • Annual external audits of Health & Safety are conducted in all Group businesses by independent consultants and other specialist advisers • Health & Safety training is provided, and implementation is monitored. There has been continued focus on increasing the number of staff being trained in Health & Safety across the business as this ensures a strong Health & Safety culture is in place • Specific focus on improving safety of higher-risk operations, with external consultancy support as needed |
Staff recruitment and retention risks Risk of failure to attract, motivate and retain employees with sufficient skills and experience to implement our growth strategy. |
• Remuneration packages are appropriate to the position: staff are encouraged and supported to grow their careers through training and development • Remuneration Committee considers retention and motivation when considering the remuneration framework • Employee numbers and changes monitored in monthly subsidiary board meetings • Competitive salaries offered, along with training and development opportunities • Retention and resilience plans are in place for key, high-performing, and high-potential employees • The Group has Mental Health training and wellbeing and Employee Assistance programmes in place • Succession planning for key roles |
Product/service differentiation relative to competition not developed or maintained Failure to innovate. New products are required to grow and maintain competitive advantage. |
• A devolved operating model with both Group and local management responsible for developing deep knowledge of our specialist markets and identifying product development opportunities and emerging market trends • Innovation best practice is carried out regularly in each business. New product ideas are discussed as part of the businesses’ strategy • Annual Group strategy meetings encourage innovation and ‘blue sky’ thinking • New product introduction/development KPI used to monitor progress • Customer feedback considered in design and/or supply of additional products and services |
Loss of key customers Risk of loss of key customers to competitors, project delays and reduced spending impacting our revenue and our organic growth ambitions.
|
• We have strong established brands that are recognised and specified by our customers, supported by product, system and service differentiation and reliability • Outstanding customer service to aid customer retention • Cross-selling of products encouraged to grow revenues, and introduce customers to all our product ranges • Continued investment in customer relationship management (CRM) software and enquiry-to-order tracking • Devolved organisational structure allows rapid decision-making and customer-centricity • Developing new and innovative products for existing and new customers/markets |
Legacy defined benefit pension obligations The long-term funding of the pension scheme requires funds that would otherwise be re-invested to grow the business. The funding may be affected by poor investment performance of the pension scheme investments or changes in the discount rate applied
|
• Continue to grow the business so that relative affordability of pension contributions is improved over time • Continue to maintain constructive dialogue and relationship with Pension Trustees to enable active management of scheme liabilities and assets to reduce/eliminate the deficit • Affordable pension funding commitments agreed to eliminate the deficit over a reasonable timeframe • Regular review at Group Board level with input as required from specialist advisers • Investment performance and risk/return balance overseen by the Trustees and Company representatives with the advice of specialist investment advisers. • The Trustees are pursuing a lower risk investment strategy to match liability risks and reduce future volatility |
Product warranty/ recall risks Product failure or recall risks could give rise to remediation costs and reputational damage.
|
• Robust internal quality systems, compliance with relevant legislation, building regulations and industry standards (e.g., ISO, BBA etc.), and product testing, as appropriate, meeting global standards • Group insurance programme to cover larger potential risks • Back-to-back warranties obtained from suppliers where possible |
consolidated STATEMENT of comprehensive income
For the year ended 30 June 2026
|
|
Year ended 30 June 2026 |
Year ended 30 June 2025 | ||||
|
|
|
|
|
|
|
|
|
|
Underlying |
Non-underlying |
Total |
Underlying |
Non-underlying |
Total |
|
Notes |
£'000 |
£’000 |
£’000 |
£’000 |
£’000 |
£'000 |
|
|
|
|
|
|
|
|
Revenue |
4 |
107,117 |
- |
107,117 |
113,414 |
- |
113,414 |
Cost of sales |
|
(68,110) |
- |
(68,110) |
(70,374) |
- |
(70,374) |
Gross profit |
|
39,007 |
- |
39,007 |
43,040 |
- |
43,040 |
|
|
|
|
|
|
|
|
Net operating expenses |
|
|
|
|
|
|
|
Net operating expenses before non-underlying items |
|
(27,768) |
- |
(27,768) |
(27,456) |
- |
(27,456) |
Other non-underlying items |
5 |
- |
(526) |
(526) |
- |
(1,979) |
(1,979) |
Net operating expenses |
|
(27,768) |
(526) |
(28,294) |
(27,456) |
(1,979) |
(29,435) |
|
|
|
|
|
|
|
|
Operating profit/(loss) |
4, 5 |
11,239 |
(526) |
10,713 |
15,584 |
(1,979) |
13,605 |
|
|
|
|
|
|
|
|
Net finance (costs)/income |
|
(1,251) |
285 |
(966) |
(1,391) |
60 |
(1,331) |
Profit/(loss) before taxation |
5 |
9,988 |
(241) |
9,747 |
14,193 |
(1,919) |
12,274 |
|
|
|
|
|
|
|
|
Tax (expense)/credit |
7,9 |
(2,617) |
184 |
(2,433) |
(3,435) |
500 |
(2,935) |
|
|
|
|
|
|
|
|
Profit/(loss) for the year |
|
7,371 |
(57) |
7,314 |
10,758 |
(1,419) |
9,339 |
Other comprehensive income: |
|
|
|
|
|
|
|
|
|
|
|
|
|
|
|
Items that will not be reclassified to profit or loss: |
|
|
|
|
|
|
|
Actuarial (loss)/gain on defined benefit pensions, net of tax |
|
|
|
(27) |
|
|
2,077 |
|
|
|
|
|
|
|
|
Items that are or may be reclassified subsequently to profit or loss: |
|
|
|
|
|
|
|
Effective portion of changes in fair value of cash flow hedges, net of tax |
|
|
|
(20) |
|
|
25 |
Exchange differences on retranslation of foreign operations |
|
|
|
37 |
|
|
(181) |
|
|
|
|
17 |
|
|
(156) |
|
|
|
|
|
|
|
|
Other comprehensive (loss)/profit for the year, net of tax |
|
|
|
(10) |
|
|
1,921 |
|
|
|
|
|
|
|
|
Total comprehensive profit for the year, net of tax |
|
|
|
7,304 |
|
|
11,260 |
|
|
|
|
|
|
|
|
|
|
|
|
Pence |
|
|
Pence |
|
|
|
|
|
|
|
|
Earnings per share |
|
|
|
|
|
|
|
Basic earnings per share |
9 |
|
|
20.3 |
|
|
25.9 |
|
|
|
|
|
|
|
|
Diluted earnings per share |
9 |
|
|
20.1 |
|
|
25.3 |
|
|
|
|
|
|
|
|
|
|
|
|
|
|
|
|
Reconciliations of underlying to statutory profit and earnings per share are provided in notes 5 and 11 respectively.
consolidated statement of financial position
At 30 June 2026
|
|
|
|
|
|
Notes |
2026 |
2026 |
2025 |
2025 |
|
|
£'000 |
£'000 |
£'000 |
£'000 |
Assets |
|
|
|
|
|
Non-current assets |
|
|
|
|
|
Property, plant and equipment – owned assets |
|
16,182 |
|
15,983 |
|
Property, plant and equipment – right-of-use assets |
|
7,127 |
|
6,651 |
|
Goodwill |
6 |
12,678 |
|
12,678 |
|
Other intangible assets |
|
5,461 |
|
6,048 |
|
Employee benefit asset |
|
5,897 |
|
4,823 |
|
|
|
|
47,345 |
|
46,183 |
Current assets |
|
|
|
|
|
Inventories |
|
15,580 |
|
13,159 |
|
Trade and other receivables |
|
28,855 |
|
26,209 |
|
Cash at bank |
|
6,330 |
|
6,406 |
|
|
|
|
50,765 |
|
45,774 |
|
|
|
|
|
|
Total assets |
|
|
98,110 |
|
91,957 |
|
|
|
|
|
|
Liabilities |
|
|
|
|
|
Non-current liabilities |
|
|
|
|
|
Interest bearing loans and borrowings |
|
(13,200) |
|
(12,200) |
|
Lease liability |
|
(5,672) |
|
(5,549) |
|
Provisions |
|
(1,662) |
|
(1,797) |
|
Deferred tax liabilities |
7 |
(5,062) |
|
(4,450) |
|
|
|
|
(25,596) |
|
(23,996) |
Current liabilities |
|
|
|
|
|
Trade and other payables |
|
(25,450) |
|
(24,013) |
|
Lease liability |
|
(1,903) |
|
(1,396) |
|
Provisions |
|
(165) |
|
(321) |
|
Derivative financial liabilities |
|
(74) |
|
(47) |
|
Corporation tax payable |
|
(1,185) |
|
(1,198) |
|
|
|
|
(28,777) |
|
(26,975) |
|
|
|
|
|
|
Total liabilities |
|
|
(54,373) |
|
(50,971) |
|
|
|
|
|
|
Net assets |
|
|
43,737 |
|
40,986 |
|
|
|
|
|
|
Equity |
|
|
|
|
|
Share capital |
10 |
4,517 |
|
4,517 |
|
Share premium |
10 |
445 |
|
445 |
|
Capital reserve – own shares |
10 |
(185) |
|
(556) |
|
Hedging reserve |
10 |
(55) |
|
(35) |
|
Foreign currency reserve |
10 |
24 |
|
(13) |
|
Profit and loss account reserve |
|
38,991 |
|
36,628 |
|
|
|
|
|
|
|
Total equity |
|
|
43,737 |
|
40,986 |
The financial statements were approved by the Board of Directors and authorised for issue on 15 September 2026.
Vijay Thakrar Simon Dray
Director Director
Company number 1767387
consolidated STATEMENT of cash flows
For the year ended 30 June 2026
|
|
|
|
|
|
|
Year ended |
Year ended |
|
|
30 June |
30 June |
|
|
2026 |
2025 |
|
Notes |
£'000 |
£'000 |
Operating activities |
|
|
|
Operating profit |
|
10,713 |
13,605 |
Adjustments for: |
|
|
|
Depreciation |
|
4,197 |
3,662 |
Amortisation |
|
712 |
720 |
Profit on disposal of property, plant and equipment |
|
(368) |
(12) |
Share based payments |
|
187 |
161 |
Increase in inventories |
|
(2,421) |
(6) |
Increase in receivables |
|
(1,882) |
(4,497) |
Increase in trade and other payables |
|
1,067 |
2,625 |
Movement in provisions |
|
(291) |
(69) |
Cash contributions to retirement benefit schemes |
|
(825) |
(1,200) |
Cash generated by operating activities |
|
11,089 |
14,989 |
|
|
|
|
|
|
|
|
Tax paid |
|
(2,517) |
(2,596) |
Net cash inflow from operating activities |
|
8,572 |
12,393 |
|
|
|
|
Investing activities |
|
|
|
Purchase of property, plant and equipment |
|
(2,625) |
(2,484) |
Payments to acquire intangible fixed assets |
|
(125) |
(147) |
Proceeds from sales of property, plant and equipment |
|
521 |
32 |
Acquisition of subsidiary |
|
- |
(755) |
Net cash outflow from investing activities |
|
(2,229) |
(3,354) |
|
|
|
|
Financing activities |
|
|
|
Bank interest paid |
|
(898) |
(992) |
Equity dividends paid |
8 |
(3,991) |
(3,887) |
Draw down/(repayment) of amounts borrowed |
|
1,000 |
(1,500) |
Principal paid on lease liabilities |
|
(1,804) |
(1,611) |
Interest paid on lease liabilities |
|
(339) |
(297) |
Purchase of own shares |
|
(655) |
(741) |
Exercise of share options |
|
231 |
245 |
Refinancing costs |
|
- |
(79) |
Net cash outflow from financing activities |
|
(6,456) |
(8,862) |
|
|
|
|
Net (decrease)/increase in cash at bank |
|
(113) |
177 |
|
|
|
|
Net cash at bank brought forward |
|
6,406 |
6,410 |
Net (decrease)/increase in cash at bank |
|
(113) |
177 |
Effect of foreign exchange rate changes |
|
37 |
(181) |
Net cash at bank carried forward |
|
6,330 |
6,406 |
consolidated STATEMENT of changes in equity
For the year ended 30 June 2026
|
Notes |
Share capital |
Share premium |
Capital reserve - own shares |
Hedging reserve |
Foreign currency reserve |
Profit and loss account reserve |
Total equity |
|
|
|
|
|
|
|
|
|
|
|
£'000 |
£'000 |
£'000 |
£'000 |
£'000 |
£'000 |
£'000 |
|
|
|
|
|
|
|
|
|
At 1 July 2024 |
|
4,517 |
445 |
(321) |
(60) |
168 |
28,789 |
33,538 |
Profit for the year |
|
- |
- |
- |
- |
- |
9,339 |
9,339 |
Exchange differences on retranslation of foreign operations |
|
- |
- |
- |
- |
(181) |
- |
(181) |
Net gain on cash flow hedges |
|
- |
- |
- |
33 |
- |
- |
33 |
Tax on derivative financial liability |
|
- |
- |
- |
(8) |
- |
- |
(8) |
Actuarial gain on defined benefit pensions, net of tax |
|
- |
- |
- |
- |
- |
2,077 |
2,077 |
Deferred tax on share options |
|
- |
- |
- |
- |
- |
410 |
410 |
Acquisition of own shares |
|
- |
- |
(741) |
- |
- |
- |
(741) |
Own shares used to satisfy exercise of share awards |
|
- |
- |
506 |
- |
- |
- |
506 |
Share based payments |
|
- |
- |
- |
- |
- |
161 |
161 |
Dividends |
8 |
- |
- |
- |
- |
- |
(3,887) |
(3,887) |
Exercise of share-based incentives |
|
- |
- |
- |
- |
- |
(261) |
(261) |
At 1 July 2025 |
|
4,517 |
445 |
(556) |
(35) |
(13) |
36,628 |
40,986 |
|
|
|
|
|
|
|
|
|
Profit for the year |
|
- |
- |
- |
- |
- |
7,314 |
7,314 |
Exchange differences on retranslation of foreign operations |
|
- |
- |
- |
- |
37 |
- |
37 |
Net loss on cash flow hedges |
|
- |
- |
- |
(28) |
- |
- |
(28) |
Tax on derivative financial liability |
|
- |
- |
- |
8 |
- |
- |
8 |
Actuarial loss on defined benefit pensions, net of tax |
|
- |
- |
- |
- |
- |
(27) |
(27) |
Deferred tax on share options |
|
- |
- |
- |
- |
- |
(325) |
(325) |
Acquisition of own shares |
|
- |
- |
(655) |
- |
- |
- |
(655) |
Own shares used to satisfy exercise of share awards |
|
- |
- |
1,026 |
- |
- |
- |
1,026 |
Share based payments |
|
- |
- |
- |
- |
- |
187 |
187 |
Dividends |
8 |
- |
- |
- |
- |
- |
(3,991) |
(3,991) |
Exercise of share-based incentives |
|
- |
- |
- |
- |
- |
(795) |
(795) |
At 30 June 2026 |
|
4,517 |
445 |
(185) |
(55) |
24 |
38,991 |
43,737 |
1 basis of preparation
The Alumasc Group plc is incorporated and domiciled in England and Wales. The Company’s ordinary shares are traded on the Alternative Investment Market (“AIM”).
The Group’s financial statements consolidate those of the parent company and all of its subsidiaries as of 30 June 2026. All subsidiaries have a reporting date of 30 June.
All transactions and balances between Group companies are eliminated on consolidation, including unrealised gains and losses on transactions between Group companies. Amounts reported in the financial statements of subsidiaries have been adjusted where necessary to ensure consistency with the accounting policies adopted by the Group.
Profit or loss and other comprehensive income of subsidiaries acquired or disposed of during the year are recognised from the effective date of acquisition, or up to the effective date of disposal, as applicable.
The financial information included within this announcement does not constitute statutory accounts within the meaning of section 435 of the Companies Act 2006. The financial information for the year ended 30 June 2026 has been extracted from the statutory accounts on which an unqualified audit opinion has been issued. The statutory accounts for the year ended 30 June 2026 will be delivered to the Registrar of Companies following the Company's Annual General Meeting.
The Group financial statements have been prepared in accordance with International Financial Reporting Standards ("IFRS"), International Financial Reporting Standards Interpretations Committee ("IFRS IC") interpretations and those provisions of the Companies Act 2006 applicable to companies reporting under IFRS. The Group financial statements have been prepared on the going concern basis and adopting the historical cost convention. The Group's accounting policies remain consistent with the previous financial year.
Going concern
At 30 June 2026 the Group had cash and cash equivalents of £6.3 million and had utilised £13.2 million of the committed £25.0 million revolving credit facility. This provided total headroom of some £18.1 million against committed facilities and, together with £4.0 million overdraft facilities, there is headroom of some £22.1 million against total facilities at 30 June 2026. On 1 September 2026 the Group entered into a £30.0 million committed revolving credit facility which expires in August 2029, and two further single year extension periods to August 2030 and August 2031.
In assessing going concern to take account of the continued uncertainties caused by the current challenging macroeconomic environment, the Group has modelled a base case trading scenario on a “bottom up” basis. The Group has also modelled stress test scenarios which assume 10% and 20% reductions in revenue, with no cost reduction or cash conservation measures. Under the lowest point in these stress tested scenarios, the Group retains adequate headroom against its total banking facilities for at least the next 13 months to the end of September 2027, with no breach of banking covenants across this period.
For the same period the Group has modelled an additional scenario (a reverse stress test) that would lead to a breach of its banking covenants. It is considered that the risk of such a scenario arising is remote. Management have also identified a number of mitigating actions that the Group would take to remain within its banking facilities and comply with the associated covenants throughout the period.
Having taken into account all of the aforementioned comments, actions and factors in relation to going concern, and in light of the bank facility headroom under various scenarios, the Directors consider that the Group has adequate resources to continue trading for the foreseeable future. Accordingly, they continue to adopt the going concern basis in preparing the financial statements.
Alternative performance measures
The Group uses a range of non-IFRS performance measures to monitor the performance of the business. The Group believes these provide information on the ongoing trading of the business to help investors and other stakeholders evaluate the performance of the business and are measures commonly used by certain investors for evaluating the performance of the Group. In particular, the Group uses measures that reflect the underlying performance on the basis that this provides a more relevant focus on the core business performance of the Group.
The Group reports underlying profit and underlying earnings in addition to the financial information prepared under IFRS. The Board believes that underlying profit and underlying earnings provide additional and more consistent measures of underlying performance by removing items that are not closely related to the Group’s day-to-day trading activities and which would typically be excluded in assessing the value of the business.
Underlying profit and underlying earnings are used by the Board for internal performance analysis, planning and employee compensation arrangements. ‘Underlying profit’ and ‘underlying earnings’ are not defined terms under IFRS, and may therefore not be comparable with similarly titled measures reported by other companies. They are therefore not intended to be a substitute for, or superior to, IFRS measures of profit and earnings. A reconciliation of underlying to IFRS profit and earnings are included in notes 5 and 9 respectively.
The Group also uses the following non-IFRS measures on a consistent basis and they are defined as follows:
Underlying operating margin:
Underlying operating margin is defined as underlying operating profit as a percentage of revenue
Underlying EBITDA:
Underlying EBITDA is underlying operating profit before interest, taxation, depreciation and amortisation. See below for definition of underlying operating profit.
Underlying operating cash conversion:
Underlying operating cash conversion is pre-tax operating cash flow as a percentage of underlying operating profit.
Net bank debt:
Net debt as defined under the Group’s banking facility agreement before the impact of IFRS 16: Leases.
Leverage ratio:
The leverage ratio is the ratio of net bank debt to underlying EBITDA and is consistent with the calculation of the Group’s banking covenants.
2 judgEments and estimates
The main sources of estimation uncertainty that could have a significant risk of causing material adjustment to the carrying amounts of assets and liabilities at 30 June 2026 within the next financial year are the valuation of defined benefit pension obligations, the valuation of inventory, and the valuation of the Group’s acquired goodwill.
The assumptions applied in determining the defined benefit pension obligation are particularly sensitive. Advice is taken from a qualified actuary to determine appropriate assumptions at each reporting date. The actuarial valuation involves making assumptions about discount rate, mortality rates and future pension increases. Due to the complexity of the valuation, the underlying assumptions and the long-term nature of these plans, such estimates are subject to significant uncertainty.
Judgement is applied in assessing the value of manufacturing cost to be absorbed into inventory, and to the estimate of net realisable value of obsolete or slow-moving inventory.
Goodwill is tested at least annually for impairment, with appropriate assumptions and estimates built into the value in use calculations to determine if an impairment of the carrying value is required.
3 Summary of material accounting policies
The accounting policies adopted are consistent with those of the previous financial year. The following new standards, amendments and interpretations are effective for the period beginning on or after 1 July 2025 and have been adopted for the Group financial statements where appropriate with no material impact on the disclosures and results made by the Group:
- Amendments to IFRS 9 and IFRS 7 - Amendments to the Classification and Measurement of Financial Instruments; and
- Lack of Exchangeability (Amendments to IAS 21).
4 segmental analysis
In accordance with IFRS 8 “Operating Segments”, the segmental analysis below follows the Group’s internal management reporting structure.
The Chief Executive reviews internal management reports on a monthly basis, with performance being measured based on the segmental operating result as disclosed below. Performance is measured on this basis as management believe this information is the most relevant when evaluating the impact of strategic decisions because of similarities between the nature of products and services, routes to market and supply chains in each segment.
Inter-segment transactions are entered into applying normal commercial terms that would be available to third parties. Segment results, assets and liabilities include those items directly attributable to a segment. Unallocated assets comprise cash and cash equivalents, deferred tax assets, income tax recoverable and corporate assets that cannot be allocated on a reasonable basis to a reportable segment. Unallocated liabilities comprise borrowings, employee benefit obligations, deferred tax liabilities, income tax payable and corporate liabilities that cannot be allocated on a reasonable basis to a reportable segment.
|
2025/26 |
2024/25 | ||
|
Revenue |
Segmental operating result |
Revenue |
Segmental operating result |
|
£’000 |
£’000 |
£’000 |
£’000 |
|
|
|
|
|
|
|
|
|
|
Water Management |
46,588 |
3,255 |
55,523 |
8,025 |
Building Envelope |
41,791 |
4,850 |
41,812 |
5,300 |
Housebuilding Products |
18,738 |
4,696 |
16,079 |
4,182 |
Trading |
107,117 |
12,801 |
113,414 |
17,507 |
|
|
|
|
|
Unallocated costs |
|
(1,562) |
|
(1,923) |
|
|
|
|
|
Total |
107,117 |
11,239 |
113,414 |
15,584 |
|
|
£’000 |
|
£’000 |
|
|
|
|
|
Segmental operating result |
|
11,239 |
|
15,584 |
Acquired intangible asset amortisation (see note 5) |
|
(423) |
|
(423) |
Restructuring & legal costs (see note 5) |
|
(410) |
|
(1,535) |
Profit on disposal of property (see note 5) |
|
372 |
|
- |
Acquisition costs (see note 5) |
|
(65) |
|
(21) |
|
|
|
|
|
Total operating profit |
|
10,713 |
|
13,605 |
Year to 30 June 2026 |
|
|
Capital expenditure |
|
| |
|
Segment Assets |
Segment Liabilities |
Property, Plant & Equipment |
Other Intangible Assets |
Deprecia-tion |
Amortisa-tion |
|
£’000 |
£’000 |
£’000 |
£’000 |
£’000 |
£’000 |
|
|
|
|
|
|
|
Water Management |
44,721 |
(12,165) |
3,061 |
118 |
2,223 |
617 |
Building Envelope |
21,825 |
(13,095) |
789 |
7 |
559 |
59 |
Housebuilding Products |
17,454 |
(8,882) |
1,236 |
- |
1,363 |
36 |
|
|
|
|
|
|
|
Trading |
84,000 |
(34,142) |
5,086 |
125 |
4,145 |
712 |
|
|
|
|
|
|
|
Unallocated |
14,110 |
(20,231) |
44 |
- |
52 |
- |
|
|
|
|
|
|
|
Total |
98,110 |
(54,373) |
5,130 |
125 |
4,197 |
712 |
Year to 30 June 2025 |
|
|
Capital expenditure |
|
| |
|
Segment Assets |
Segment Liabilities |
Property, Plant & Equipment |
Other Intangible Assets |
Deprecia-tion |
Amortisa-tion |
|
£’000 |
£’000 |
£’000 |
£’000 |
£’000 |
£’000 |
|
|
|
|
|
|
|
Water Management |
45,401 |
(13,266) |
2,833 |
116 |
2,034 |
617 |
Building Envelope |
17,420 |
(11,764) |
345 |
31 |
287 |
59 |
Housebuilding Products |
16,205 |
(7,295) |
737 |
- |
1,294 |
44 |
|
|
|
|
|
|
|
Trading |
79,026 |
(32,325) |
3,915 |
147 |
3,615 |
720 |
|
|
|
|
|
|
|
Unallocated |
12,931 |
(18,646) |
57 |
- |
47 |
- |
|
|
|
|
|
|
|
Total |
91,957 |
(50,971) |
3,972 |
147 |
3,662 |
720 |
Sales to external customers by geographical segment
|
United |
|
North |
Middle |
Far |
Rest of |
|
|
Kingdom |
Europe |
America |
East |
East |
World |
Total |
|
£’000 |
£’000 |
£’000 |
£’000 |
£’000 |
£’000 |
£’000 |
|
|
|
|
|
|
|
|
Year to 30 June 2026 |
97,114 |
5,933 |
19 |
304 |
2,577 |
1,170 |
107,117 |
|
|
|
|
|
|
|
|
Year to 30 June 2025 |
98,750 |
3,924 |
9 |
585 |
9,429 |
717 |
113,414 |
Segment revenue by geographical segment represents revenue from external customers based upon the geographical location of the customer.
5 UNDERLYING to profit before tax reconciliation
|
2025/26 |
2024/25 | ||
|
Operating profit |
Profit before tax |
Operating profit |
Profit before tax |
|
£’000 |
£’000 |
£’000 |
£’000 |
|
|
|
|
|
Underlying operating profit & profit before tax |
11,239 |
9,988 |
15,584 |
14,193 |
Acquired intangible asset amortisation |
(423) |
(423) |
(423) |
(423) |
IAS 19 net pension scheme finance income |
- |
285 |
- |
60 |
Restructuring & legal costs |
(410) |
(410) |
(1,535) |
(1,535) |
Profit on disposal of property |
372 |
372 |
- |
- |
Acquisition costs |
(65) |
(65) |
(21) |
(21) |
Operating profit & profit before tax |
10,713 |
9,747 |
13,605 |
12,274 |
In the presentation of underlying profits, management disclose the amortisation of acquired intangible assets and IAS 19 pension costs consistently as non-underlying items because they are material non-cash and non-trading items that would typically be excluded in assessing the value of the business.
In addition, management has presented the following specific items that arose in 2025/26 and 2024/25 financial years as non-underlying, as they are non-recurring items that are judged to be significant enough to affect the understanding of the year-on-year evolution of the underlying trading performance of the business:
- One-off costs of a restructuring of the Water Management division, including a restructuring of the division’s sales and commercial teams;
- Profit on disposal of the Water Management division’s site in Dover, following the relocation of its activities to the division’s site in Halstead; and
- Acquisition expenses relating to professional fees incurred in the Group’s acquisition activities.
Impact on cashflow
Of the £241,000 (2024/25: £1,919,000) non-underlying expenses recognised, £103,000 (2024/25: £1,477,000) was settled in cash. The remaining £138,000 (2024/25: £442,000) relates to non-cash amortisation of acquired brands, IAS 19 pension income & costs and surplus provision releases.
6 GOODWILL
|
|
2026 |
2025 |
|
|
£'000 |
£'000 |
Cost: |
|
|
|
At 1 July & 30 June |
|
13,401 |
13,401 |
Impairment: |
|
|
|
At 1 July & 30 June |
|
723 |
723 |
|
|
|
|
Net book value at 30 June |
|
12,678 |
12,678 |
Goodwill acquired through acquisitions has been allocated to cash generating units for impairment testing as set out below:
|
|
2026 |
2025 |
|
|
£'000 |
£'000 |
|
|
|
|
Alumasc Roofing (Building Envelope) |
|
3,820 |
3,820 |
Timloc (Housebuilding Products) |
|
2,264 |
2,264 |
Rainclear (Water Management) |
|
225 |
225 |
Wade (Water Management) |
|
2,217 |
2,217 |
ARP (Water Management) |
|
4,152 |
4,152 |
At 30 June |
|
12,678 |
12,678 |
Impairment testing of acquired goodwill
The Group considers each of the operating businesses that have goodwill allocated to them, which are those units for which a separate cashflow is computed, to be a cash generating unit (CGU). Each CGU is reviewed annually for impairment. In assessing whether an asset has been impaired, the carrying amount of the CGU is compared to its recoverable amount. The recoverable amount is the higher of its fair value less costs to sell and its value in use. In the absence of any information about the fair value of a CGU, the recoverable amount is deemed to be its value in use. Each of the CGUs are either operating segments as shown in note 4, or sub-sets of those operating segments.
For the purpose of impairment testing, the recoverable amount of CGUs is based on value in use calculations. The value in use is derived from discounted management cash flow forecasts for the businesses, based on budgets and plans covering a five year period. The growth rate used to extrapolate the cash flows beyond this period was 2% (2025: 1%) for each CGU.
Key assumptions included in the recoverable amount calculation are the discount rate applied and the cash flows generated by:
- Revenues
- Gross margins
- Overhead costs
Each assumption has been considered in conjunction with the local management of the relevant operating businesses who have used their past experience and expectations of future market and business developments in arriving at the figures used.
The pre-tax rate used to discount the cash flows of these cash generating units with on-balance sheet goodwill was 16% (2025: 16%). This rate was based on the Group’s estimated weighted average cost of capital (WACC) of 12% (2025: 12%), which was risk-adjusted for each CGU taking into account both external and internal risks.
The Group faced significant demand headwinds over FY26. Despite this, there was significant headroom above the carrying value of goodwill at 30 June 2026 for all CGU’s, with the exception of Wade.
Wade was particularly impacted by project delays due to the implementation of the building safety act and the economic uncertainty caused by the conflict in the Middle East. Wade’s FY27 budget and five year plan assumes that near-term demand levels will continue to be subdued, while growth is expected to come through export opportunities and operational improvements.
ARP experienced similar demand headwinds, and its FY27 budget and five year plan assumes operational efficiencies and supply chain synergies resulting from closer integration with its fellow Water Management divisional companies, which resulted in increased headroom above the carrying value of its goodwill.
A summary of the Wade and ARP CGU’s sensitivities to changes in the key assumptions, setting out the required changes in cashflow, long term growth rates and discount rate beyond which an impairment would be triggered, is shown below. The rate to which an impairment would be triggered is shown.
|
Cashflow |
Long term growth rates |
Discount rate | ||
|
Sensitivity (decrease) |
Current assumption |
Sensitivity (rate) |
Current assumption |
Sensitivity (rate) |
Wade |
28% |
2% |
-12% |
16% |
21% |
ARP |
66% |
2% |
-100% |
16% |
37% |
7 tax expense
- Tax on profit
Tax charged in the consolidated statement of comprehensive income
|
2025/26 |
2024/25 |
|
£’000 |
£’000 |
Current tax: |
|
|
UK corporation tax |
2,061 |
2,239 |
Overseas tax |
28 |
334 |
Amounts under/(over) provided in previous years |
41 |
(26) |
Total current tax |
2,130 |
2,547 |
|
|
|
Deferred tax: |
|
|
Origination and reversal of temporary differences |
298 |
302 |
Amounts under provided in previous years |
5 |
86 |
Total deferred tax |
303 |
388 |
Total tax expense |
2,433 |
2,935 |
Tax recognised in other comprehensive income |
|
|
Deferred tax: |
|
|
Actuarial (losses)/gains on pension schemes |
(9) |
692 |
Cash flow hedge |
(8) |
8 |
Tax (credited)/charged to other comprehensive income |
(17) |
700 |
Total tax charge in the consolidated statement of comprehensive income |
2,416 |
3,635 |
- Reconciliation of the total tax charge
The total tax rate applicable to the tax expense shown in the statement of total comprehensive income of 25.0% (2024/25: 23.9%) is in line with (2024/25: lower than) the standard rate of corporation tax in the UK of 25.0% (2024/25: 25.0%).
The differences are reconciled below:
|
2025/26 |
2024/25 |
|
£’000 |
£’000 |
|
|
|
Profit before tax |
9,747 |
12,274 |
|
|
|
Current tax at the UK standard rate of 25.0% (2024/25: 25.0%) |
2,437 |
3,068 |
Expenses not deductible for tax purposes |
130 |
143 |
Income not taxable |
(51) |
(93) |
Use of capital losses |
(93) |
- |
Overseas tax rates |
(36) |
(243) |
Tax under/(over) provided in previous years – current tax |
41 |
(26) |
Tax under provided in previous years – deferred tax |
5 |
86 |
|
|
|
|
2,433 |
2,935 |
- Unrecognised tax losses
The Group has tax capital losses in the UK amounting to £16.0 million (2025: £16.3 million) that relate to prior years. Under current legislation these losses are available for offset against future chargeable gains. The capital losses are able to be carried forward indefinitely. Revaluation gains on land and buildings amount to £1 million (2025: £1 million). These have been offset in the prior year against the capital losses detailed above. A deferred tax asset has not been recognised in respect of the net capital losses carried forward of £15.0 million (2025: £15.3 million) as they do not meet the criteria for recognition.
- Deferred tax
A reconciliation of the movement in deferred tax during the year is as follows:
|
Accelerated capital allowances |
Short term temporary differences |
Acquired intangible assets |
Hedging |
Share options |
Pension deferred tax (asset)/ liability |
|
|
Total deferred tax liability |
|
£’000 |
£’000 |
£’000 |
£’000 |
£’000 |
£’000 |
|
|
£’000 |
|
|
|
|
|
|
|
|
|
|
At 1 July 2024 |
2,552 |
(103) |
1,358 |
(20) |
(214) |
199 |
|
|
3,772 |
Charged/(credited) to the statement of comprehensive income – current year |
80 |
(7) |
(106) |
- |
20 |
315 |
|
|
302 |
Charged to the statement of comprehensive income – prior year |
64 |
22 |
- |
- |
- |
- |
|
|
86 |
Charged/(credited) to equity |
- |
- |
- |
8 |
(410) |
692 |
|
|
290 |
At 30 June 2025 |
2,696 |
(88) |
1,252 |
(12) |
(604) |
1,206 |
|
|
4,450 |
|
|
|
|
|
|
|
|
|
|
Charged/(credited) to the statement of comprehensive income – current year |
92 |
(4) |
(106) |
- |
39 |
277 |
|
|
298 |
Charged/(credited) to the statement of comprehensive income – prior year |
4 |
2 |
- |
- |
(1) |
- |
|
|
5 |
(Credited)/charged to equity |
- |
- |
- |
(7) |
325 |
(9) |
|
|
309 |
At 30 June 2026 |
2,792 |
(90) |
1,146 |
(19) |
(241) |
1,474 |
|
|
5,062 |
Deferred tax assets and liabilities are presented as non-current in the consolidated statement of financial position.
Deferred tax assets have been recognised where it is probable that they will be recovered. Deferred tax assets of £3.8 million (2025: £3.8 million) in respect of net capital losses of £15.0 million (2025: £15.3 million) have not been recognised.
|
2025/26 |
2024/25 |
|
£'000 |
£'000 |
|
|
|
Interim dividend for 2026 of 3.50p paid on 8 April 2026 |
1,262 |
- |
Final dividend for 2025 of 7.60p paid on 4 November 2025 |
2,729 |
- |
Interim dividend for 2025 of 3.50p paid on 8 April 2025 |
- |
1,262 |
Final dividend for 2024 of 7.30p paid on 1 November 2024 |
- |
2,625 |
|
3,991 |
3,887 |
|
|
|
A final dividend of 7.6 pence per equity share, at a cash cost of £2,741,000, has been proposed for the year ended 30 June 2026, payable on 4 November 2026. This dividend has not been accrued in these consolidated financial statements as it was proposed after the year end.
9 earnings per share
Basic earnings per share is calculated by dividing the net profit for the period attributable to ordinary equity shareholders of the parent by the weighted average number of ordinary shares in issue during the period. Diluted earnings per share is calculated by dividing the net profit attributable to ordinary equity shareholders of the parent by the weighted average number of ordinary shares in issue during the period, after allowing for the exercise of outstanding share options. The following sets out the income and share data used in the basic and diluted earnings per share calculations:
|
2025/26 |
2024/25 |
|
£'000 |
£'000 |
|
|
|
Net profit attributable to equity holders of the parent |
7,314 |
9,339 |
|
|
|
|
000s |
000s |
|
|
|
Weighted average number of shares |
36,022 |
36,004 |
Dilutive potential ordinary shares – employee share options |
456 |
844 |
|
36,478 |
36,848 |
|
2025/26 |
2024/25 |
|
Pence |
Pence |
|
|
|
Basic earnings per share |
20.3 |
25.9 |
|
2025/26 |
2024/25 |
|
Pence |
Pence |
|
|
|
Diluted earnings per share |
20.1 |
25.3 |
Calculation of underlying earnings per share:
|
2025/26 |
2024/25 |
|
£'000 |
£'000 |
|
|
|
Reported profit before taxation |
9,747 |
12,274 |
Brand amortisation |
423 |
423 |
IAS 19 net pension scheme finance income |
(285) |
(60) |
Profit on disposal of property |
(372) |
- |
Restructuring & legal costs |
410 |
1,535 |
Acquisition costs |
65 |
21 |
Underlying profit before taxation |
9,988 |
14,193 |
|
|
|
Tax at underlying Group tax rate of 26.2% (2024/25: 24.2%) |
(2,617) |
(3,435) |
Underlying earnings |
7,371 |
10,758 |
|
|
|
Weighted average number of shares |
36,022 |
36,004 |
|
|
|
Basic underlying earnings per share |
20.5p |
29.9p |
|
|
|
Diluted underlying earnings per share |
20.2p |
29.2p |
10 movements in equity
Share capital and share premium
The balances classified as share capital and share premium are the proceeds of the nominal value and premium value respectively on issue of the Company’s equity share capital net of issue costs.
Capital reserve – own shares
The capital reserve – own shares relates to 69,801 (2025: 174,162) ordinary own shares held by the Company. The market value of shares at 30 June 2026 was £171,012 (2025: £648,753). These are held to help satisfy the exercise of awards under the Company’s Long-Term Incentive and Executive Share Option Plans. During the year 335,468 (2025: 237,564) shares with an original cost of £1,026,000 (2025: £506,000) were used to satisfy the exercise of awards. A Trust holds the shares in its name and shares are awarded to employees on request by the Group. The Group bears the expenses of the Trust.
Hedging reserve
This reserve records the post-tax portion of the gain or loss on a hedging instrument in a cash flow hedge that is determined to be an effective hedge.
Foreign currency reserve
This foreign currency reserve is used to record exchange differences arising from the translation of the financial statements of foreign subsidiaries.
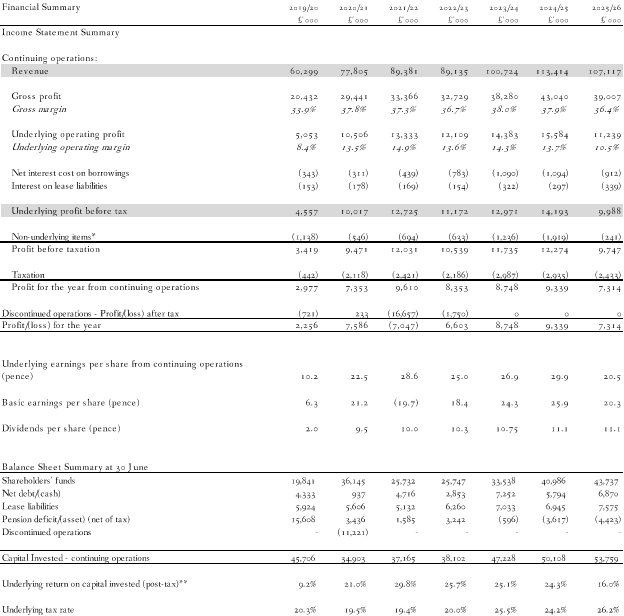
* Non-underlying items comprise intangible asset amortisation and IAS 19 pension costs in all years. Further details of the 2024/25 and 2025/26 non underlying items can be found in note 5 of the Report and Accounts 2026.
** Underlying operating profit after tax from continuing operations calculated using the underlying tax rate, as a percentage of average capital invested from continuing operations.
RNS may use your IP address to confirm compliance with the terms and conditions, to analyse how you engage with the information contained in this communication, and to share such analysis on an anonymised basis with others as part of our commercial services. For further information about how RNS and the London Stock Exchange use the personal data you provide us, please see our Privacy Policy.

Latest directors dealings
- 11 minutes ago SThree
- 47 minutes ago XP Factory
- 1 hour ago Montanaro European Smaller Companies Trust
- 1 hour ago Bankers Inv Trust
- 4 hours ago Trekor Metals Limited