
Half-year Report
Summary by AI BETAClose X

30 September 2026
Africa Opportunity Fund Limited
("AOF" or the "Company", or the "Fund")
Half Yearly Report for the Six Months ended 30 June 2026
The Board of Directors of Africa Opportunity Fund Limited is pleased to announce its unaudited results for the 6-month period to 30 June 2026. The full half yearly report for the period ended 30 June 2026 will be sent to shareholders and will be available on the Company's website: www.africaopportunityfund.com.
Highlights:
· AOF's Ordinary share net asset value per share of US$2.393 as at 30 June 2026, was up 58% when compared against the 31 December 2025 net asset value per share of US$1.510.
· As at 30 June 2026, AOF's investment allocation for its Ordinary Shares was all equities.
· AOF's Ordinary Shares net asset value per share on 31 August 2026 was US$2.079.
Manager's Commentary:
Market Conditions
AOF's NAV in H1 2026 was up 58% while its share price was, essentially, flat. As a reference, during this period in USD the S&P rose 10%, Brazil rose 13%, India fell 14%, and China rose 12%. In Africa, South Africa rose 2%, Egypt rose 17%, Kenya rose 20%, and Nigeria rose 58%. Three Africa-focused exchange traded funds ("etfs") - the Van Eck Africa Index (AFK US), Lyxor Pan Africa ETF (LGQM GY), and the DBX MSCI Africa Top 50 (XMAF LN), respectively, rose 29%, fell 5% and fell 3%. The Africa etfs concentrated their allocations on African commodity producers listed on non-African exchanges and large companies listed on the South African, Egyptian, and Moroccan stock markets. The market indices of Sub-Saharan African countries like Nigeria, Kenya, and Senegal are overwhelmingly weighted in favour of domestic consumer facing operators. The Fund's holdings have a similar focus on domestic consumer facing Sub-Saharan Africa companies.
Ordinary Shares Portfolio Highlights
AOF's portfolio benefited from stable to mildly depreciating African currencies in H1. The Kenyan shilling was flat while Ghana's Cedi depreciated by 11%. Ghana's gold and cocoa export receipts in H1, year-on-year, rose by, 49% and 6%, respectively, and as its trade balance rose to 7% of Ghana's gross domestic product. As Ghana's inflation rate declined slightly from 5.4% in December 2025 to 5.3% in June2026, its central bank's real monetary policy rate fell from 12.6% in December to 8.7% in June, still one of the world's highest rates. Ghana's current account surplus, as a % of its GDP at the end of June, rose to 3.8% versus 3.6% in June 2025.
The Ghana Stock Exchange Composite Index enjoyed, respectively, a H1 total return of 71% in Cedis and 58% in Dollars. Enterprise Group's share price, in H1, was up 189% in Cedis and 167% in Dollars. As of June 30, Enterprise commanded a market capitalisation of $152 million versus 2025 attributable shareholders' equity of $128 million and traded on a historical P/E ratio of 9.2x, with a return on equity of 18%. Its H1 2026 Cedi-denominated profits attributable to shareholders rose 39% as against H1 2025 profits. A decline in net insurance service results was less than the combined gains from H1 2026 investment income and pension administration and rental revenues supported by 5% nominal operating expenses growth. This year's headwinds include lower discount rates, correlated with falling Cedi-denominated fixed income yields, that increase the net present value of insurance contract liabilities and raise the net insurance finance expense of Enterprise Life. Furthermore, Enterprise's H1 2025 "float" (premiums received now to pay future claims) of 2 billion Cedis rose by 39% to H1 2026 float of 2.7 billion Cedis ($200 million vs. $245 million in H1 2026). Its market capitalization, though, lost 1/3rd of its value to sit at $102 million. It continues to trade at a low valuation for a debt-free leading insurance group in Ghana.
Enterprise continues to control the pension administrator, property and casualty and life assurance companies that have the largest market shares in Ghana. They are also well-capitalised: unencumbered equity capital in 2025 was equal to 24% of total assets for Enterprise Life, 39% for Enterprise Insurance, and 85% for Enterprise Trustees. If inflation and interest rates remain close to current levels in Ghana, Enterprise PLC should be able to improve its profitability, increase its dividend, and be rewarded with a materially higher valuation.
The Fund's precious ("Anglogold") and critical metals ("Valterra") investments delivered unrealized losses in H1 - respective declines of -2% and -18% that were related to the -7% fall of the gold price and the -18% fall of the PGM basket price in that period. Both of them remain net cash miners. Valterra had a strong H1 2026, as it was spared a repeat of the floods of H1 2025. The average 3E PGM price (year-on-year) rose 85% to $2801, the highest level since 2021, refined production expanded 25% to 1.7 million ounces, and the all-in sustaining cost per PGM ounce fell 18% to $996. The H1 outcomes were: revenues of 81.8 billion Rands ($4.98 billion), net profits attributable to shareholders of 21.6 billion Rands ($1.32 billion), net cash from operations of 32.7 billion Rands ($2 billion) and free cash flow of 25.8 billion Rands ($1.6 billion). Last 12 months' net profit attributable to shareholders was 36.4 billion Rands ($2.16 billion). Valterra's end of H1 2026 market capitalisation was 288.3 billion Rands ($17.58 billion), an implied trailing 12 month P/E ratio of 8.1x. Undergirding this undemanding valuation are three factors: (1) the operating low costs of Valterra's mines and processing facilities that assure profits through the cycle; (2) the concentrated character of the PGM extractive industry allowing relatively swift closure or suspension of surplus loss-making supply in downturns; and (3) proposed new uses for PGMs, over time, such as PGM loadings in large fuel cell electric vehicles like trucks and the spreading installation of data centres. Anglogold owns 9 mines on three continents - Africa, Australia, and South America - plus some exploration assets in North America. Its market capitalisation, at 2025 year-end, was $43 billion and its enterprise value was $44.2 billion. By the end of June, Anglogold's market capitalisation and enterprise value had fallen, respectively, to $41 billion and $41.7 billion. Anglogold's 36 million gold ounce mineral reserves have a 12-year life. Its trailing 12-month net profits for the period ended 30 June 2026 soared 111% from $1.8 billion in 2024-25 to net profits of $3.8 billion on a 50% rise in the average gold price per ounce to $4235 in 2025-26 and a 3% increase of sold gold to 3 million ounces between June 2025 and June 2026. Anglogold is a net cash company. One trend to monitor in a gold mining jurisdiction is its stance on increasing tax collections from gold producers or nationalisation in the case of foreign-owned mines. Anglogold faces rising effective tax rates in some countries.
The Fund's investment in Seplat Energy PLC, a Nigerian oil and gas exploration and production company, had a total return of 83%, benefiting from the higher oil price environment since the commencement of the Iranian war.
Zimbabwe's currency enjoyed a placid H1 with very little devaluation or depreciation in the official or unofficial forex markets. The share price of Mashonaland Holdings ("Mash") rose 7% in ZiG. The Fund disposed of its entire holding in First Mutual Properties through a negotiated block trade executed in US dollars, realising a 155% premium to the value reported in the January NAV. At the end of H1, Mash's carrying value by AOF implied a market capitalisation of $92 million versus $87 million of shareholders' equity at the end of 2025. Mash is modifying its property portfolio to meet the needs of the growing number of small and medium enterprises in Zimbabwe and the rising demand for houses affordable to Zimbabwe's workers. As one example, Mash's Chiyedza House, in Harare and built in the early 1990s for commercial offices, now offers fully furnished offices and flexible retail spaces to small and medium enterprises in various sectors. A second example is the Shurugwi residential stands sold by Mash to Unki miners employed by Valterra's Zimbabwean subsidiary to transfer those miners from rental accommodation to mortgage-financed residences. These trends assist Mash in growing its revenues while deepening its exposure to Zimbabwe's middle classes
The Nairobi Stock Exchange Allshare Index enjoyed a H1 total return, in both Kenyan shillings and Dollars, of 20%. Kenya Power's shares enjoyed a decent H1 performance, with a total return of 28%, as it paid its second interim dividend in ten years in March. Its market capitalization rose from $205 million in December 2025 to $258 million in June 2026 while enterprise value climbed to $863 million. One disturbing development was that Kenya Power withdrew its March application for electricity tariff increases. This withdrawal affected the investing capacity of the entire Kenyan electricity industry because it froze indefinitely the industry's capacity to receive larger revenues from Kenya Power. Kenya's journey to cost-reflective tariffs has suffered one more delay. Despite its many challenges, we remain cautiously optimistic that Kenya Power can continue on its current path of recovery.
Annual general meeting of the Fund's shareholders
The Fund held an annual general meeting in June 2026 at which all resolutions were passed.
Strategy
The investing objective of the Fund is to earn superior returns by investing in businesses that it believes can flourish in
Africa and, in doing so, aiding capital formation and the mobilisation of savings with the intention of growing wealth and
productivity in Africa's economies.
On Behalf of the Investment Manager, Africa Opportunity Partners LLC.
Responsibility Statements:
The Board of Directors confirm that, to the best of its knowledge:
a. The financial statements, prepared in accordance with International Financial Reporting Standards, give a true and fair view of the assets, liabilities, financial position and profit or loss of the Company.
b. The Interim Investment Manager Report, and Condensed Notes to the Financial Statements include:
i. a fair review of the information required by DTR 4.2.7R (indication of important events that have occurred during the first six months and their impact on the financial statements, and a description of principal risks and uncertainties for the remaining six months of the year); and
ii. a fair review of the information required by DTR 4.2.8R (confirmation that no related party transactions have taken place in the first six months of the year that have materially affected the financial position or performance of the Company during that period).
Per Order of the Board
29 September, 2026
AFRICA OPPORTUNITY FUND LIMITED
UNAUDITED STATEMENT OF PROFIT OR LOSS AND OTHER COMPREHENSIVE INCOME
FOR THE PERIOD FROM 1 JANUARY 2026 TO 30 JUNE 2026
|
|
|
|
|
|
For the period |
|
For the period |
|||||
|
|
|
|
|
|
ended 30 June |
|
ended 30 June |
|||||
|
|
|
|
Notes |
|
2026 |
|
2025 |
|||||
|
|
|
|
|
|
|
|
|
|||||
|
|
|
|
|
|
USD |
|
USD |
|||||
|
|
Income |
|
|
|
|
|
|
|||||
|
|
Net gains on investment in subsidiaries at fair value |
|
|
|
|
|
|
|||||
|
|
through profit or loss |
|
6(a) |
|
10,449,774 |
|
445,202 |
|||||
|
|
|
|
|
|
10,449,774 |
|
445,202 |
|||||
|
|
|
|
|
|
|
|
|
|||||
|
|
Expenses |
|
|
|
|
|
|
|||||
|
|
Management fees |
|
|
|
173,562 |
|
173,562 |
|||||
|
|
Other operating expenses |
|
|
|
44,375 |
|
24,930 |
|||||
|
|
Directors' fees |
|
|
|
35,000 |
|
35,000 |
|||||
|
|
Audit and professional fees |
|
|
|
70,725 |
|
54,900 |
|||||
|
|
|
|
|
|
323,662 |
|
288,392 |
|||||
|
|
|
|
|
|
|
|
|
|||||
|
|
Income for the period attributable to equity holders* |
|
|
|
10,126,112 |
|
156,810 |
|||||
|
|
|
|
|
|
|
|
|
|||||
* There is no other comprehensive income for the period.
AFRICA OPPORTUNITY FUND LIMITED
UNAUDITED STATEMENT OF FINANCIAL POSITION
AS AT 30 JUNE 2026
|
|
|
Notes |
|
30 June 2026 |
|
|
30 June 2025 |
|
|
|
|
|
USD |
|
|
USD |
|
ASSETS |
|
|
|
|
|
|
|
|
Cash and cash equivalents |
|
8 |
|
7,002 |
|
|
9,595 |
|
Prepayments |
|
7 |
|
21,048 |
|
|
9,986 |
|
Investment in subsidiaries at fair value through profit or loss* |
6(a) |
|
27,497,709 |
|
|
13,982,104 |
|
|
Amounts due from related party |
|
|
6,264 |
|
|
3,132 |
|
|
Total assets |
|
|
|
27,532,023 |
|
|
14,004,817 |
|
|
|
|
|
|
|
|
|
|
EQUITY AND LIABILITIES |
|
|
|
|
|
|
|
|
|
|
|
|
|
|
|
|
|
LIABILITIES |
|
|
|
|
|
|
|
|
Trade and other payables |
|
10 |
|
82,509 |
|
|
68,825 |
|
Total liabilities |
|
|
|
82,509 |
|
|
68,825 |
|
|
|
|
|
|
|
|
|
|
Net assets attributable to shareholders |
|
|
|
27,449,514 |
|
|
13,935,992 |
|
|
|
|
|
|
|
|
|
|
Ordinary share capital |
|
|
|
114,689 |
|
|
114,689 |
|
Share premium |
|
|
|
5,810,553 |
|
|
5,810,553 |
|
Retained earnings |
|
|
|
21,524,272 |
|
|
8,010,750 |
|
Total equity |
|
|
|
27,449,514 |
|
|
13,935,992 |
|
|
|
|
|
|
|
|
|
|
Net assets value per share: |
|
|
|
|
|
|
|
|
- Ordinary shares |
|
|
|
2.393 |
|
|
1.215 |
|
|
|
|
|
|
|
|
|
|
*The investment in subsidiaries at fair value through profit or loss include the investment in the Master Fund - |
|||||||
|
Africa Opportunity Fund L.P. |
|
|
|
|
|
|
|
|
|
|
|
|
|
|
|
|
AFRICA OPPORTUNITY FUND LIMITED
UNAUDITED STATEMENT OF CHANGES IN EQUITY
FOR THE PERIOD FROM 1 JANUARY 2026 TO 30 JUNE 2026
|
|
|
|
|
Share |
|
Share |
|
Retained |
|
|
|
|
|
|
|
Capital |
|
Premium |
|
Earnings |
|
Total |
|
|
|
|
|
|
|
|
|
|
|
|
|
|
|
|
|
USD |
|
USD |
|
USD |
|
USD |
|
|
|
|
|
|
|
|
|
|
|
|
|
At 1 January 2026 |
|
|
|
114,689 |
|
5,810,553 |
|
11,398,160 |
|
17,323,402 |
|
|
|
|
|
|
|
|
|
|
|
|
|
OPERATIONS: |
|
|
|
|
|
|
|
|
|
|
|
Total comprehensive income for the period |
|
|
|
- |
|
- |
|
10,126,112 |
|
10,126,112 |
|
|
|
|
|
|
|
|
|
|
|
|
|
At 30 June 2026 |
|
|
|
114,689 |
|
5,810,553 |
|
21,524,272 |
|
27,449,514 |
|
|
|
|
|
|
|
|
|
|
|
|
AFRICA OPPORTUNITY FUND LIMITED
UNAUDITED STATEMENT OF CASH FLOWS
FOR THE PERIOD FROM 1 JANUARY 2026 TO 30 JUNE 2026
|
|
|
|
|
For the period ended |
For the period ended |
|
|
|
|
|
|
30 June 2026 |
|
30 June 2025 |
|
|
|
|
|
|
|
|
|
|
|
|
|
USD |
|
USD |
|
Operating activities |
|
|
|
|
|
|
|
Income for the period |
|
|
|
10,126,112 |
|
156,810 |
|
|
|
|
|
|
|
|
|
Adjustment for non-cash items: |
|
|
|
|
|
|
|
|
|
|
|
|
|
|
|
Net gains on investment in subsidiaries at |
|
|
|
|
|
|
|
fair value through profit or loss |
|
|
|
(10,449,774) |
|
(445,202) |
|
|
|
|
|
|
|
|
|
Cash used in operating activities |
|
|
|
(323,662) |
|
(288,392) |
|
|
|
|
|
|
|
|
|
Net changes in operating assets and liabilities |
|
|
|
|
|
|
|
Reduction in investments in subsidiaries at fair value |
|
|
|
|
|
|
|
through profit or loss |
|
|
|
340,000 |
|
150,000 |
|
Increase in due from other related party |
|
|
|
(3,132) |
|
(3,132) |
|
Increase in other receivables and prepayments |
|
|
|
(3,228) |
|
(479) |
|
Decrease in trade and other payables |
|
|
|
(11,814) |
|
(53,758) |
|
|
|
|
|
|
|
|
|
Net cash generated from operating activities |
|
|
|
321,826 |
|
92,631 |
|
|
|
|
|
|
|
|
|
Net decrease in cash and cash equivalents |
|
|
|
(1,836) |
|
(195,761) |
|
|
|
|
|
|
|
|
|
Cash and cash equivalents at 1 January |
|
|
|
8,838 |
|
205,356 |
|
|
|
|
|
|
|
|
|
Cash and cash equivalents at 30 June |
|
|
|
7,002 |
|
9,595 |
AFRICA OPPORTUNITY FUND LIMITED
NOTES TO THE FINANCIAL STATEMENTS
FOR THE PERIOD FROM 1 JANUARY 2026 TO 30 JUNE 2026
1. GENERAL INFORMATION
Africa Opportunity Fund Limited (the "Company") was launched with an Alternative Market Listing "AIM" in July 2007 and moved to the Specialist Funds Segment "SFS" in April 2014.
Africa Opportunity Fund Limited is a closed-ended fund incorporated with limited liability and registered in Cayman Islands under the Companies Law on 21 June 2007, with registered number MC-188243. The Company is exempted from registering with CIMA under the Private Funds Act of the Cayman Islands given that it is listed on the Specialist Funds Segment of the London Stock Exchange which is approved by CIMA.
Shareholders ratified the adoption of the New Investment Policy at a 15 July 2024 EGM, as well as dictating that the Company is deemed to have an indefinite life and be considered a going concern. See Note 4 for additional details regarding the going concern status.
The Company's investment activities are managed by Africa Opportunity Partners LLC, a limited liability company incorporated in the Delaware, United States and acting as the investment manager pursuant to an Amended and Restated Investment Management Agreement dated 21 June 2024.
The Company aims to earn superior returns by investing in businesses that it believes can flourish in Africa and, in doing so, aiding capital formation and the mobilisation of savings with the intention of growing wealth and productivity in Africa's economies. The Company has the ability to invest in a wide range of asset classes including real estate interests, equity, quasi-equity or debt instruments and debt issued by African sovereign states and government entities.
To ensure that investments to be made by the Company and the returns generated on the realisation of investments are both effected in the most tax efficient manner, the Company has established Africa Opportunity Fund L.P. ("the Master Fund") as an exempted limited partnership in the Cayman Islands. All investments made by the Company are made through the limited partnership. The limited partners of the limited partnership are the Company and AOF CarryCo Limited. The general partner of the limited partnership is Africa Opportunity Fund (GP) Limited. Africa Opportunity Fund Limited includes 100% of Africa Opportunity Fund (GP) Limited.
The financial statements for the Company for the half year ended 30 June 2026 were authorised for issue in accordance with a resolution of the Board of Directors on 29 September 2026.
Presentation currency
The financial statements are presented in United States dollars ("USD"). All figures are presented to the nearest dollar.
2. SUMMARY OF MATERIAL ACCOUNTING POLICIES
The material accounting policies applied in the preparation of these financial statements are set out below. These policies have been consistently applied from the prior year to the current year for items which are considered material in relation to the financial statements.
Statement of compliance
The financial statements are prepared in accordance with IFRS Accounting Standards as issued by the International Accounting Standards Board (IASB).
Basis of preparation
The Company satisfied the criteria of an investment entity under IFRS 10: Consolidated Financial Statements. As such, its interest in the subsidiaries has been classified as financial assets at fair value through profit or loss, and measured at fair value. This consolidation exemption has been applied and more details of this assessment are provided in Note 4 "critical accounting judgements, estimates and assumptions." The financial statements have been prepared under the historical cost convention except for financial assets and financial liabilities measured at fair value through profit or loss.
Although these estimates are based on management's knowledge of current events and actions, actual results ultimately may differ from those estimates. The preparation of financial statements in conformity with IFRS requires the use of certain critical accounting estimates. It also requires the Board of Directors to exercise its judgment in the process of applying the Company's accounting policies. The areas involving a higher degree of judgement or complexity, or areas where assumptions and estimates are material to the financial statements are disclosed in Note 4.
The Company presents its statement of financial position in order of liquidity.
The Company's financial statements include disclosure notes on the Master Fund, Africa Opportunity Fund L.P. given that the net asset value of the Master Fund is a significant component of the Investment in Subsidiaries of the Company. These additional disclosures are made in order to provide the users of the financial statements with an overview of the Master Fund performance.
Please refer to Note 1 and Note 4 for additional details regarding the going concern status of the Company.
Foreign currency translation
(i) Functional and presentation currency
The Company's financial statements are presented in USD which is the functional currency, being the currency of the primary economic environment in which the Company operates. The Company determines its own functional currency and items included in the financial statements of each entity are measured using that functional currency. The functional currency of the Company is USD. The Company chooses USD as the presentation currency.
(ii) Transactions and balances
Transactions in foreign currencies are initially recorded at the functional currency rate prevailing at the date of transaction. Monetary assets and liabilities denominated in foreign currencies are retranslated at the functional currency spot rate of the exchange ruling at the reporting date. All differences are taken to profit or loss. Non-monetary items that are measured in terms of historical cost in a foreign currency are translated using the exchange rates as at the dates of the initial transactions. Non-monetary items measured at fair value in a foreign currency are translated using the exchange rates at the date when the fair value is determined.
Financial instruments
A financial instrument is any contract that gives rise to a financial asset of one entity and a financial liability or equity instrument of another entity.
Classification
(i) Financial assets at fair value through profit or loss
For the Company, financial assets classified at fair value through profit or loss upon initial recognition include investment in subsidiaries.
Investment in subsidiaries
In accordance with the exception under IFRS 10 Consolidated Financial Statements, the Company does not consolidate subsidiaries in the financial statements. Investments in subsidiaries are accounted for as financial instruments at fair value through profit or loss in accordance with IRFS 9 - Financial Instruments.
Management concluded that the Company meets the definition of an investment entity as it invests solely for returns from capital appreciations, investment income or both, and measures and evaluates the performance of its investments on a fair value basis. Accordingly, consolidated financial statements have not been prepared.
The Company measures the investment in subsidiaries at fair value through profit or loss at fair value. Subsequent changes in the fair value of these investments are recorded in 'Net gain or loss on investment in subsidiaries at fair value through profit or loss'.
(ii) Financial assets at amortised cost
The Company measures financial assets at amortised cost if both of the following conditions are met:
· The financial asset is held within a business model with the objective to hold financial assets in order to collect contractual cash flows.
· The contractual terms of the financial asset give rise on specified dates to cash flows that are solely payments of principal and interest on the principal amount outstanding.
(iii) Other financial liabilities
This category includes all financial liabilities, other than those classified as fair value through profit or loss. The Company includes in this category amounts relating to Trade and other payables.
(a) Initial Recognition
The Company recognises a financial asset or a financial liability when, and only when, it becomes a party to the contractual provisions of the instrument.
Purchases or sales of financial assets that require delivery of assets within the time frame generally established by regulation or convention in the marketplace are recognised directly on the trade date, i.e., the date that the Master Fund commits to purchase or sell the asset.
(b) Initial measurement
Financial assets and liabilities at fair value through profit or loss are recorded in the statement of financial position at fair value. All transaction costs for such instruments are recognised directly in profit or loss.
(c) Subsequent measurement
Financial assets at amortised costs are subsequently measured using the effective interest method and are subject to impairment. Gains and losses are recognised in profit or loss when the asset is derecognised, modified or impaired.
(d) Derecognition
A financial asset (or, where applicable, a part of a financial asset or part of a group of similar financial assets) is derecognised where:
· The rights to receive cash flows from the asset have expired; or
· The Company has transferred its rights to receive cash flows from the asset
The Company derecognises a financial liability when the obligation under the liability is discharged, cancelled or expires.
Impairment of financial assets
The Company recognises an allowance for expected credit losses (ECLs) for all financial assets measured at amortised cost. When measuring ECL, the Company uses reasonable and supportable forward-looking information, which is based on assumptions for the future movement of different economic drivers and how these drivers will affect each other. Loss given default is an estimate of the loss arising on default. It is based on the difference between the contractual cash flows due and those that the entity would expect to receive, taking into account cash flows from credit enhancements. The Company considers a financial asset in default when contractual payments are 90 days past due.
However, in certain cases, the Company may also consider a financial asset to be in default when internal or external information indicates that the Company is unlikely to receive the outstanding contractual amounts in full before taking into account any credit enhancements held by the Company. A financial asset is written off when there is no reasonable expectation of recovering the contractual cash flows.
At the reporting date, there was no receivable from related party. As a result, no ECL has been recognised.
Offsetting financial instruments
Financial assets and financial liabilities are offset and the net amount reported in the statement of financial position if, and only if, there is a currently legally enforceable right to offset the recognised amounts and there is an intention to settle on a net basis, or to realise the asset and settle the liability simultaneously.
Determination of fair value
The Company, at the feeder level, measures its investments in subsidiaries at net asset value (NAV) at each reporting date. Please refer to Note 6 for additional details.
For investments at master fund level, fair value is the price that would be received to sell an asset or paid to transfer a liability in an orderly transaction between market participants at the measurement date. The fair value measured is based on the presumption that the transaction to sell the asset or transfer the liability takes place either in the principal market for the asset or liability or, in the absence of a principal market, in the most advantageous market for the asset or liability. The principal or the most advantageous market must be accessible to the Company. The fair value for financial instruments traded in active markets at the reporting date is based on their quoted price without any deduction for transaction costs.
For all other financial instruments at the master level that are not traded in an active market, the fair value is determined by using appropriate valuation techniques. Valuation techniques include: using recent arm's length market transactions; reference to the current market value of another instrument that is substantially the same; discounted cash flow analysis and option pricing models making as much use of available and supportable market data as possible. An analysis of fair values of financial instruments and further details as to how they are measured is provided in Note 6.
The Company uses the following hierarchy for determining and disclosing the fair value of the financial instruments by valuation technique:
· Level 1: quoted (unadjusted) market prices in active markets for identical assets and liabilities.
· Level 2: valuation techniques for which the lowest level input that is significant to the fair value measurement is directly or indirectly observable.
· Level 3: valuation techniques for which the lowest level input that is significant to the fair value measurement is unobservable.
Net gain or loss on financial assets and liabilities at fair value through profit or loss
This item includes changes in the fair value of financial assets held for trading or 'at fair value through profit or loss' and excludes expenses.
Unrealised gains and losses comprise changes in the fair value of financial instruments for the year and from reversal of prior year's unrealised gains and losses for financial instruments which were realised in the reporting period.
Classification of financial instruments, liabilities and equity.
The shares are classified as equity if those shares have all the following features:
(a) It entitles the holder to a pro rata share of the Company's net assets in the event of the Company's liquidation.
The Company's net assets are those assets that remain after deducting all other claims on its assets. A pro rata share is determined by:
(i) dividing the net assets of the Company on liquidation into units of equal amount; and
(ii) multiplying that amount by the number of the shares held by the shareholder.
(b) The shares are in the class of instruments that is subordinate to all other classes of instruments. To be in such a class the instrument:
(i) has no priority over other claims to the assets of the Company on liquidation, and
(ii) does not need to be converted into another instrument before it is in the class of instruments that is subordinate to all other classes of instruments.
(c) All shares in the class of instruments that is subordinate to all other classes of instruments must have an identical contractual obligation for the issuing Company to deliver a pro rata share of its net assets on liquidation.
In addition to the above, the Company must have no other financial instrument or contract that has:
(a) total cash flows based substantially on the profit or loss, the change in the recognised net assets or the change in the fair value of the recognised and unrecognised net assets of the Company (excluding any effects of such instrument or contract) and
(b) the effect of substantially restricting or fixing the residual return to the shareholders.
The shares satisfy the above conditions and thus meet the requirements to be classified as equity. Movement in fair value is shown in the Statement of Profit or Loss and Other Comprehensive Income as an 'income/(loss) for the period attributable to equity holders'.
Dividend income
Dividend revenue is recognised when the Company's right to receive the payment is established.
Cash and cash equivalents
Cash and cash equivalents comprise cash at bank. Cash equivalents are short term, highly liquid investments that are readily convertible to known amounts of cash and which are subject to an insignificant risk of change in value.
3. CHANGES IN ACCOUNTING POLICIES AND DISCLOSURES
The Company have adopted all the new and revised standards that are relevant to its operations and effective for annual periods beginning on or after 1 January 2026. A number of new and amended standards became effective during the financial year. Management has concluded that none of these standards were relevant to the Company.
3.1. ACCOUNTING STANDARDS AND INTERPRETATIONS ISSUED BUT NOT YET EFFECTIVE
The following relevant standards, amendments to existing standards and interpretations were in issue but not yet effective. The Company will adopt these standards, if applicable, when they become effective. No early adoption of these standards and interpretations is intended by the Board of Directors.
Effective for
accounting period
Amendments to IFRS 9 and IFRS 7: Classification and Measurement of Financial Instruments 1 January 2026
Amendments to IFRS 18: Presentation and Disclosure in Financial Statements 1 January 2027
The Company is currently assessing and identifying the aspects of these amendments that will impact the financial statements and notes to the financial statements. The Directors are of opinion that the above standards are not expected to have an impact on the Company's financial statements.
4. CRITICAL ACCOUNTING JUDGEMENTS, ESTIMATES AND ASSUMPTIONS
The preparation of the Company's financial statements requires management to make judgements, estimates and assumptions that affect the reported amounts recognised in the financial statements and disclosure of contingent liabilities. However, uncertainty about these assumptions and estimates could result in outcomes that could require a material adjustment to the carrying amount of the asset or liability affected in future periods.
Judgements
In the process of applying the Company's accounting policies, management has made the following judgements, which have the most significant effect on the amounts recognised in the financial statements:
Going concern
At the Extraordinary General Meeting ("EGM") of the Company held on 15 July 2024, the shareholders voted in favor of a New Investment Policy which ended the liquidation strategy and the process of periodic shareholder continuation votes. The shareholders also ratified the removal of the continuation vote policy at the EGM. This ratification, and the transition from a liquidation strategy to a continuing investment policy, dictated that the Company be deemed to have an indefinite life and be considered a going concern.
Below is a brief synopsis of the investment strategy as approved with the adoption of the New Investment Policy and consistent with the Company's Circular dated 24 June 2024:
The Investment Manager, relying on the extensive experience of the management team, selects a limited number of investment opportunities. In selecting those investment opportunities, the Investment Manager will adhere to an analytical process, elements of which include: classifying cach investment opportunity in the appropriate categories of an asset-based equity opportunity, an earnings-based equity opportunity, distressed debt, corporate debt, African sovereign debt, arbitrage, or special situations.
The Company will screen potential investee companies according to its value investing principles. It will seek to invest in investee companies valued at substantial discounts to their intrinsic value. In terms of industries, the Company's search will include companies with a record of profitable exports from Africa, catalysts for productivity growth in Africa, companies participating in the growth of long-term real savings, companies managing the growth, and operations, of African infrastructure and networks, and companies able to lower profitably the real prices of goods and services consumed by African consumers.
The assessment of equity investment opportunities involves:
· in the case of an asset-based equity opportunity, determining whether the equity securities of the company or entity under consideration commands a valuation which is materially lower than the Investment Manager's estimate of that company's or entity's intrinsic value. The determination of a company's or entity's intrinsic value is based on a variety of standards such as comparing the book value of the assets of the company or entity against the price the Investment Manager believes would be paid for a similar asset in a private transaction, or the valuations of listed peers of that company or entity;
· in the case of an earnings-based equity opportunity, determining whether the equity securities of the company or entity under consideration possesses both a high real return on assets and an earnings yield higher than the local currency denominated government debt of the country in which the assets of that company are located;
· comparing the valuation of the company or entity in question against valuations of its listed and private peers (where possible) in different parts of Africa, non-African emerging markets and developed markets;
· understanding the industry in which the company or entity under consideration operates, the prospects of that industry and the prospects of competitors of the company or entity in question. This aspect will frequently require discussions with industry participants;
· comparing cach security issued by the relevant company or entity against its other classes of issued securities to determine which security offers the best risk-reward ratio to the Group; and
· estimating the product of the probability of loss and the quantum of loss of an investment opportunity to set off against the product of the probability of gain and the quantum of gain of that investment to determine the risk-adjusted potential return on that investment opportunity. As a general proposition, the higher the anticipated probability of loss of an investment, the smaller the likely investment.
Provided the investment opportunity falls within the investment policy of the Group, the Investment Manager will have, on behalf of the Group, the discretion to make and dispose of investments. However, in the event that an investment will constitute more than 20% of Net Asset Value at the time of investment the prior approval of the Board will be required. Before any investment is undertaken by the Group, all appropriate due diligence will be undertaken, and this will include checking the United States's sanctions list. Special consideration will also be given to money laundering and terrorist financing risks and any and all politically exposed persons who may be a part of, or have close links with, any target company.
Determination of functional currency
The determination of the functional currency of the Company is critical since recording of transactions and exchange differences arising thereon are dependent on the functional currency selected. As described in Note 2, the directors have considered those factors therein and have determined that the functional currency of the Company is the United States Dollar.
Assessment for an investment entity
An investment entity is an entity that:
(a) Obtains funds from one or more investors for the purpose of providing those investor(s) with investment management services;
(b) Commits to its investor(s) that its business purpose is to invest funds solely for returns from capital appreciation, investment income, or both; and
(c) Measures and evaluates the performance of substantially all of its investments on a fair value basis.
An investment entity must demonstrate that fair value is the primary measurement attribute used. The fair value information must be used internally by key management personnel and must be provided to the entity's investors. In order to meet this requirement, an investment entity would:
· Elect to account for investment property using the fair value model in IAS 40 Investment Property
· Elect the exemption from applying the equity method in IAS 28 for investments in associates and joint ventures, and
· Measure financial assets at fair value in accordance with IFRS 9.
In addition an investment entity should consider whether it has the following typical characteristics:
· It has more than one investment, to diversify the risk portfolio and maximise returns;
· It has multiple investors, who pool their funds to maximise investment opportunities;
· It has investors that are not related parties of the entity; and
· It has ownership interests in the form of equity or similar interests.
The Board considers that the Company continues to meet the definition of an investment entity as it invests solely for returns from capital appreciations, investment income or both, and measures and evaluates the performance of its investments in subsidiaries on a fair value basis. In addition, the Company has more than one investors and major investors are not related parties of the Company. Accordingly, consolidated financial statements have not been prepared. IFRS 10 Consolidated Financial Statements provides "investment entities' an exemption from the consolidation of particular subsidiaries and instead require that an investment entity measures the investment in each eligible subsidiary at fair value through profit or loss in accordance with IFRS 9 Financial Instruments.
Assumptions and Estimates
The key assumptions concerning the future and other key sources of estimation uncertainty at the reporting date, that have a significant risk of causing a material adjustment to the carrying amounts of assets and liabilities within the next financial year, are discussed below. The Company based its assumptions and estimates on parameters available when the financial statements were prepared. However, existing circumstances and assumptions about future developments may change due to market changes or circumstances arising beyond the control of the Company. Such changes are reflected in the assumptions when they occur. When the fair value of financial assets and financial liabilities recorded in the statement of financial position cannot be derived from active markets, their fair value is determined using a variety of valuation techniques that include the use of mathematical models.
Fair value of financial instruments
The Company's investment manager considers the valuation techniques and inputs used in valuing the subsidiaries as part of its due diligence, to ensure they are reasonable and appropriate and therefore the NAV of these funds may be used as an input into measuring their fair value.
IFRS 13 requires disclosures relating to fair value measurements using a three-level fair value hierarchy. The level within which the fair value measurement is categorised in its entirety is determined on the basis of the lowest level input that is significant to the fair value measurement in its entirety as provided in Note 6. Assessing the significance of a particular input requires judgement, considering factors specific to the asset or liability. To assess the significance of a particular input to the entire measurement, the Company performs sensitivity analysis or stress testing techniques.
5a. AGREEMENTS
Investment Management Agreement
The Company and the Investment Manager have, upon the approval of the Reorganisation Resolution at the EGM in July 2024, entered into the Amended and Restated Investment Management Agreement which amends the fees payable to the Investment Manager as follows:
Management fees
A fixed management fee equal to USD$350,000 per annum. Management fees for the financial period under review were USD 173,562 (2025: 173,562).
The Investment Manager's entitlement to future performance fees (through CarryCo) has been cancelled.
Realisation fees
With the adoption of the New Investment Policy at the July 2024 EGM, the realisation fee was terminated.
The revisions to the arrangements with the Investment Manager, constitute a related party transaction under the Company's related party policy, and in accordance with that policy, the Company was required to obtain: (i) the approval of a majority of the Directors who are independent of the Investment Manager; and (ii) a fairness opinion or third-party valuation in respect of such related party transaction from an appropriately qualified independent adviser.
Administrative Agreement
NAV Fund Services is the Administrator for the Company, effective as at 1 January 2025. Administrative fees are expensed at the Master Fund level and have been included in the NAV of the subsidiary.
Custodian Agreement
A Custodian Agreement has been entered into by the Master Fund and Standard Chartered Bank (Mauritius) Ltd ("SCB"), whereby SCB would provide custodian services to the Master Fund and would be entitled to a custody fee of between 18 and 25 basis points per annum of the value of the assets held by the custodian and a tariff of between 10 and 45 basis points per annum of the value of assets held by the custodian. The custodian fees are expensed at the Master Fund level and have been included in the NAV of the subsidiary.
Following the exit of SCB from the Zimbabwe market in 2024, Custodial Agreements were entered into by the Master Fund and FBC Bank Limited ("FBC"), whereby FBC would provide custodian services and hold direct custody of Zimbabwe securities and would be entitled to a custody fee of 10 basis points per annum on the market value of the assets held by the custodian. The custodian fees are expensed at the Master Fund level and have been included in the NAV of the subsidiary.
5b. SUMMARY OF MATERIAL ACCOUNTING POLICIES AT THE MASTER FUND LEVEL
Africa Opportunity Fund LP (the "Master Fund") is incorporated in the Cayman Islands and is not subject to regulatory review. Management has voluntarily disclosed all the policies and notes to the accounts of the Master Fund to provide shareholders of the Company with a better insight.
The primary accounting policies are similar as in Note 2. Those policies which only relate to the Master Fund's financial statements are set out below. These policies have been consistently applied from the prior year to the current year for items which are considered material in relation to the financial statements.
Financial instruments
A financial instrument is any contract that gives rise to a financial asset of one entity and a financial liability or equity instrument of another entity.
(a) Classification
The Master Fund classifies its financial assets and liabilities in accordance with IFRS 9 into the following categories:
(i) Financial assets at fair value through profit or loss
The category of the financial assets and liabilities at fair value through the profit or loss is subdivided into:
Financial assets at fair value through profit or loss
These include equity securities that are not held for trading. These financial assets are classified at FVTPL on the basis that they are part of a group of financial assets which are managed and have their performance evaluated on a fair value basis, in accordance with risk management and investment strategies of the Company, as set out in each of their offering documents. The financial information about the financial assets is provided internally on that basis to the Investment Manager and to the Board of Directors.
Derivatives - Options
Derivatives are classified as held for trading (and hence measured at fair value through profit or loss), unless they are designated as effective hedging instruments (however the Company does not apply any hedge accounting). The Master Fund's derivatives relate to option contracts.
Options are contractual agreements that convey the right, but not the obligation, for the purchaser either to buy or sell a specific amount of a financial instrument at a fixed price, either at a fixed future date or at any time within a specified period.
The Master Fund purchases and sells put and call options through regulated exchanges and OTC markets. Options purchased by the Master Fund provide the Master Fund with the opportunity to purchase (call options) or sell (put options) the underlying asset at an agreed-upon value either on or before the expiration of the option. The Master Fund is exposed to credit risk on purchased options only to the extent of their carrying amount, which is their fair value.
Options written by the Master Fund provide the purchaser the opportunity to purchase from or sell to the Master Fund the underlying asset at an agreed-upon value either on or before the expiration of the option.
Options are generally settled on a net basis.
Derivatives relating to options are recorded at the level of the Master Fund. The financial statements of the Company do not reflect the derivatives as they form part of the net asset value (NAV) of the Master Fund which is fair valued.
(ii) Financial assets at amortised cost
The Master Fund measures financial assets at amortised cost if both of the following conditions are met:
· The financial asset is held within a business model with the objective to hold financial assets in order to collect contractual cash flows.
· The contractual terms of the financial asset give rise on specified dates to cash flows that are solely payments of principal and interest on the principal amount outstanding.
Financial assets at amortised cost are subsequently measured using the effective interest (EIR) method and are subject to impairment. Gains and losses are recognised in profit or loss when the asset is derecognised, modified or impaired. The Master Fund's financial assets at amortised cost comprise 'trade and other receivables' and 'cash and cash equivalents' in the statement of financial position.
(iii) Other financial liabilities
This category includes all financial liabilities, other than those classified as fair value through profit or loss. The Master Fund includes in this category amounts relating to trade and other payables and dividend payable.
(a) Recognition
The Master Fund recognises a financial asset or a financial liability when, and only when, it becomes a party to the contractual provisions of the instrument.
Purchases or sales of financial assets that require delivery of assets within the time frame generally established by regulation or convention in the marketplace are recognised directly on the trade date, i.e., the date that the Master Fund commits to purchase or sell the asset.
(b) Initial measurement
Financial assets and liabilities at fair value through profit or loss are recorded in the statement of financial position at fair value. All transaction costs for such instruments are recognised directly in profit or loss.
Financial assets at amortised cost and financial liabilities (other than those classified as held for trading) are measured initially at their fair value plus any directly attributable incremental costs of acquisition or issue.
(c) Subsequent measurement
The Master Fund measures financial instruments which are classified at fair value through profit or loss at fair value. Subsequent changes in the fair value of those financial instruments are recorded in 'Net gain or loss on financial assets and liabilities at fair value through profit or loss. Interest earned elements of such instruments are recorded separately in 'Interest revenue'. Dividend expenses related to short positions are recognised in 'Dividends on securities sold not yet purchased'. Dividend income/distributions received on investments at FVTPL is recorded in 'Net gain or loss on financial assets at fair value through profit or loss'.
Financial assets at amortised costs are subsequently measured using the effective interest method and are subject to impairment. Gains and losses are recognised in profit or loss when the asset is derecognised, modified or impaired.
The effective interest method is a method of calculating the amortised cost of a financial asset or a financial liability and of allocating the interest income or interest expense over the relevant period. The effective interest rate is the rate that exactly discounts estimated future cash payments or receipts through the expected life of the financial instrument or, when appropriate, a shorter period to the net carrying amount of the financial asset or financial liability. When calculating the effective interest rate, the Master Fund estimates cash flows considering all contractual terms of the financial instruments but does not consider future credit losses. The calculation includes all fees paid or received between parties to the contract that are an integral part of the effective interest rate, transaction costs and all other premiums or discounts.
(d) Derecognition
A financial asset (or, where applicable, a part of a financial asset or part of a group of similar financial assets) is derecognised where:
· The rights to receive cash flows from the asset have expired; or
· The Company has transferred its rights to receive cash flows from the asset or has assumed an obligation to pay the received cash flows in full without material delay to a third party under a 'pass-through' arrangement; and
Either (a) the Master Fund has transferred substantially all the risks and rewards of the asset, or (b) the Master Fund has neither transferred nor retained substantially all the risks and rewards of the asset, but has transferred control of the asset. When the Master Fund has transferred its rights to receive cash flows from an asset (or has entered into a pass-through arrangement), and has neither transferred nor retained substantially all the risks and rewards of the asset nor transferred control of the asset, the asset is recognised to the extent of the Master Fund's continuing involvement in the asset.
The Master Fund derecognises a financial liability when the obligation under the liability is discharged, cancelled or expires.
Determination of fair value
The Master Fund measures its investments in financial instruments, such as equities, at fair value at each reporting date.
Fair value is the price that would be received to sell an asset or paid to transfer a liability in an orderly transaction between market participants at the measurement date. The fair value measured is based on the presumption that the transaction to sell the asset or transfer the liability takes place either in the principal market for the asset or liability or, in the absence of a principal market, in the most advantageous market for the asset or liability. The principal or the most advantageous market must be accessible to the Master Fund. The fair value for financial instruments traded in active markets at the reporting date is based on their quoted price without any deduction for transaction costs.
For all other financial instruments not traded in an active market, the fair value is determined by using appropriate valuation techniques. Valuation techniques include: using recent arm's length market transactions; reference to the current market value of another instrument that is substantially the same; discounted cash flow analysis and option pricing models making as much use of available and supportable market data as possible. An analysis of fair values of financial instruments and further details as to how they are measured is provided in Note 6.
The Master Fund uses the following hierarchy for determining and disclosing the fair value of the financial instruments by valuation technique:
· Level 1: quoted (unadjusted) market prices in active markets for identical assets and liabilities.
· Level 2: valuation techniques for which the lowest level input that is significant to the fair value measurement is directly or indirectly observable.
· Level 3: valuation techniques for which the lowest level input that is significant to the fair value measurement is unobservable.
Impairment of financial assets
The Master Fund recognises an allowance for expected credit losses (ECLs) for all financial assets measured at amortised cost. ECLs are based on the difference between the contractual cash flows due in accordance with the contract and all the cash flows that the Master Fund expects to receive, discounted at an approximation of the original effective interest rate. The expected cash flows will include cash flows from the sale of collateral held or other credit enhancements that are integral to the contractual terms.
ECLs are recognised either on a 12-month or lifetime basis. For credit exposures for which there has not been a significant increase in credit risk since initial recognition, ECLs are provided for credit losses that result from default events that are possible within the next 12-months (a 12-month ECL). For those credit exposures for which there has been a significant increase in credit risk since initial recognition, a loss allowance is required for credit losses expected over the remaining life of the exposure, irrespective of the timing of the default (a lifetime ECL).
The Master Fund considers a financial asset in default when contractual payments are 90 days past due. However, in certain cases, the Master fund may also consider a financial asset to be in default when internal or external information indicates that the Master fund is unlikely to receive the outstanding contractual amounts in full before taking into account any credit enhancements held by the Master fund. A financial asset is written off when there is no reasonable expectation of recovering the contractual cash flows.
For trade receivables, the Master Fund applies a simplified approach in calculating ECLs. Therefore, the Master Fund does not track changes in credit risk, but instead recognises a loss allowance based on lifetime ECLs at each reporting date. At the reporting date, the assessment of the Master Fund's debt instruments which include trade and other receivables and cash and cash equivalents were considered as de minimis. As a result, no ECL has been recognised as any amount would have been insignificant.
Offsetting financial instruments
Financial assets and financial liabilities are offset and the net amount reported in the statement of financial position if, and only if, there is a currently legally enforceable right to offset the recognised amounts and there is an intention to settle on a net basis, or to realise the asset and settle the liability simultaneously.
Net gain or loss on financial assets and liabilities at fair value through profit or loss
This item includes changes in the fair value of financial assets and liabilities held for trading or designated upon initial recognition as 'at fair value through profit or loss' and excludes interest and expenses. At the Master Fund Level, the fair value gains and losses exclude interest and dividend income.
Unrealised gains and losses comprise changes in the fair value of financial instruments for the year and from reversal of prior year's unrealised gains and losses for financial instruments which were realised in the reporting period.
Realised gains and losses on disposals of financial instruments classified as 'at fair value through profit or loss' are calculated using the Average Cost (AVCO) method. They represent the difference between an instrument's initial carrying amount and disposal amount, or cash payments or receipts made on derivative contracts (excluding payments or receipts on collateral margin accounts for such instruments).
Due to and due from brokers
Amounts due to brokers are payables for securities purchased (in a regular way transaction) that have been contracted for but not yet delivered on the reporting date at the Master Fund level. Refer to the accounting policy for financial liabilities, other than those classified at fair value through profit or loss for recognition and measurement.
Amounts due from brokers include margin accounts and receivables for securities sold (in a regular way transaction) that have been contracted for but not yet delivered on the reporting date. Refer to accounting policy for financial assets at amortised cost for recognition and measurement.
Interest revenue and expense
Interest revenue and expense are recognised in profit or loss for all interest-bearing financial instruments using the effective interest method.
Dividend revenue
Dividend revenue is recognised when the Master Fund's right to receive the payment is established. Dividend revenue is presented gross of any non-recoverable withholding taxes, which are disclosed separately in profit or loss of the Master Fund.
6. FINANCIAL ASSETS AND LIABILITIES AT FAIR VALUE THROUGH PROFIT OR LOSS
6(a). Investment in subsidiaries at fair value
The Company has established Africa Opportunity Fund L.P., an exempted limited partnership in the Cayman Islands to ensure that the investments made and returns generated on the realisation of the investments made and returns generated on the realisation of the investments are both effected in the most tax efficient manner. All investments made by the Company are made through the limited partner which acts as the master fund. The limited partners of the limited partnership are the Company (95.6%) and AOF CarryCo Limited (4.4%). The general partner of the limited partnership is Africa Opportunity Fund (GP) Limited. Africa Opportunity Fund Limited hold 100% of the Africa Opportunity Fund (GP) Limited.
|
|
|
2026 |
|
|
|
USD |
|
|
|
|
|
Investment in Africa Opportunity Fund L.P. |
|
27,487,757 |
|
Investment in Africa Opportunity Fund (GP) Limited |
|
9,952 |
|
|
|
|
|
Total investment in subsidiaries at fair value |
|
27,497,709 |
|
|
|
|
|
Fair value at 01 January |
|
17,387,935 |
|
Reduction in investment in subsidiaries* |
|
(340,000) |
|
Net gain on investment in subsidiaries at fair value |
|
10,449,774 |
|
|
|
|
|
Fair value at 30 June 2026 |
|
27,497,709 |
*The reduction in investment in subsidiaries relates to capital withdrawn from the Master Fund by the Company
6(b). Fair value hierarchy
The Company uses the following hierarchy for determining and disclosing the fair value of the financial instruments by valuation technique:
Level 1: quoted (unadjusted) market prices in active markets for identical assets and liabilities.
Level 2: valuation techniques for which the lowest level input that is significant to the fair value measurement is directly or indirectly observable.
Level 3: valuation techniques for which the lowest level input that is significant to the fair value measurement is unobservable.
Note: The assets and liabilities of the Master Fund have been presented but do not represent the assets and liabilities of the Company as the Master Fund has not been consolidated.
Fair value hierarchy of the Company
|
|
30 June |
|
|
|
|
|
|
|
|
2026 |
|
Level 1 |
|
Level 2 |
|
Level 3 |
|
COMPANY |
|
|
USD |
|
USD |
|
USD |
|
|
|
|
|
|
|
|
|
|
Investment in subsidiaries |
27,497,709 |
|
- |
|
27,497,709 |
|
- |
|
|
30 June |
|
|
|
|
|
|
|
|
2025 |
|
Level 1 |
|
Level 2 |
|
Level 3 |
|
COMPANY |
|
|
USD |
|
USD |
|
USD |
|
|
|
|
|
|
|
|
|
|
Investment in subsidiaries |
13,982,104 |
|
- |
|
13,982,104 |
|
- |
|
|
|
|
|
|
|
|
|
Fair value hierarchy of the Master Fund.
The Company has investment in Africa Opportunity Fund L.P., the Master Fund, amounting to USD 27,497,709. The underlying investments of the Master Fund amounts to USD 25,820,035. Details on the financial assets and liabilities of the Master Fund and fair value hierarchy are as follows:
|
|
|
30 June |
|
|
|
|
|
|
|
|
|
2026 |
|
Level 1 |
|
Level 2 |
|
Level 3 |
|
|
|
|
|
USD |
|
USD |
|
USD |
|
MASTER FUND |
|
|
|
|
|
|
|
|
|
|
|
|
|
|
|
|
|
|
|
Financial assets at fair value through profit or loss |
|
|
|
|
|
|
||
|
|
|
|
|
|
|
|
|
|
|
Equities |
|
25,820,035 |
|
19,640,102 |
|
5,684,549 |
|
495,384 |
|
|
|
|
|
|
|
|
|
|
|
|
|
25,820,035 |
|
19,640,102 |
|
5,684,549 |
|
495,384 |
|
|
|
|
|
|
|
|
|
|
|
|
|
30 June |
|
|
|
|
|
|
|
|
|
2025 |
|
Level 1 |
|
Level 2 |
|
Level 3 |
|
|
|
|
|
USD |
|
USD |
|
USD |
|
MASTER FUND |
|
|
|
|
|
|
|
|
|
|
|
|
|
|
|
|
|
|
|
Financial assets at fair value through profit or loss |
|
|
|
|
|
|
||
|
|
|
|
|
|
|
|
|
|
|
Equities |
|
14,555,227 |
|
12,429,427 |
|
2,125,800 |
|
- |
|
|
|
|
|
|
|
|
|
|
|
|
|
14,555,227 |
|
12,429,427 |
|
2,125,800 |
|
- |
6(c). The valuation technique of the investment in subsidiaries at Company level is as follow:
The Company's investment manager considers the valuation techniques and inputs used in valuing these funds as part of its due diligence, to ensure they are reasonable and appropriate. The NAV of these subsidiary is used to measure fair value. In measuring this fair value, the NAV of the subsidiary is adjusted, as necessary, to reflect restrictions on redemptions, future commitments, and other specific factors of the subsidiary and Investment Manager. In measuring fair value, consideration is also paid to any transactions in the shares of the fund. Given that the Company controls the Master Fund, no adjustment has been deemed necessary to the NAV of the Master Fund to reflect any restrictions that may have been applicable had the Company held a minority stake in the Master Fund. Moreover, given that the Master Fund invests more than 95% in quoted securities, the Company has classified its investments in subsidiary as level 2.
6(d). The valuation technique of the investments at Master Fund level are as follows:
Equity investments
These pertain to equity investments which are quoted for which there is a market price. As a result, they are classified within level 1 of the hierarchy except for the valuation of listed on the Zimbabwe Stock Exchange which have been classified as level 2 given that their quoted share price has been discounted as at 30 June 2026 as follows:
Valuation of investments listed on the Zimbabwe Stock Exchange
The total carrying value of the investments held by the Master Fund amounted to USD 25,820,035 as at 30 June 2026 (Note 6(b)), out of which USD 25,324,651 are listed. The listed investments include USD 5,684,528 for MASH ZH (2025: USD 1,576,669 MASH ZH / USD 4,060,321 aggregate) representing equity securities listed on the Zimbabwe Stock Exchange. FMP ZH was sold in 2026 prior to 30 June 2026. Based on quoted prices on the Zimbabwe Stock Exchange, the remaining investment would have been valued at USD 6,688,929 (2025: USD 6,164,116). However, owing to the ongoing market instability and difficulty repatriating ZiG currency to USD, a discount has been applied to the market price to arrive at the fair value of USD 5,684,528 (2025: USD 1,576,669 for MASH ZH / USD 4,060,321 in aggregate).
In April 2024, the Governor of the Reserve Bank of Zimbabwe introduced the Zimbabwe Gold Notes and Coins ("ZiG") as the new currency of Zimbabwe. The intent of the recalibrated monetary policy is to address the state of price and exchange rate instability in the economy. The structured currency introduced is anchored by a composite basket of foreign currency and precious metals (primarily gold) held as reserves by the Reserve Bank. The starting exchange rate was determined by the prevailing closing interbank exchange rate as at 5 April and the London PM Fix price of gold as at 4 April 2024. The intervening exchange rate is determined by the inflation differential between ZiG and the USD inflation rates and the movement in the price of the basket of precious minerals held as reserves. In prior years, the Company discounted the ZiG, as it had previously done with the ZWL, due to the perceived inability to repatriate funds at, or close to, the official rate. The Company adjusted the official exchange rate by utilising the inflation differential with the US Dollar. The Company adjusted its model to reflect a 20% surrender requirement on the basis that the reported CPI captured only 80% of actual inflation, as it had done with the previous ZWL discount. This discount factor changed every month.
As at year-end 2025 and continuing as at the reporting date, an alternate valuation procedure has been performed, and it was concluded that the utilisation of the parallel rate is more representative of market conditions. The Company weighed a potential inability to access investment proceeds in USD, to experience a foreign exchange loss while awaiting repatriation or of being tendered Zimbabwe T-Bills in lieu of USD as more significant a risk. Based on quoted price on the Zimbabwe stock exchange, the remaining investment would have been valued at USD 6,688,929. After much deliberation and consideration of the inherent subjectivity of these risks, management acquiesced to the utilisation of the parallel rate which was 31.5 at the reporting date (the official rate was 26.77), reducing the discount to 15.0% (31 Dec 2025: 21.3% 30 June 2025: 59.7%). The value of the Zimbabwe investments recorded in the books of the Company, after applying this revised discount factor, was USD 5,684,528.
Unquoted equity investments
Sand Tech Holdings Limited ("Sand Tech") (formerly known as African Leadership University) is a global solutions company with expertise in enterprise and industrial artificial intelligence. As at 30 June 2025, the Investment Manager valued Sand Tech on the basis of an observable arms-length transaction between existing shareholders selling a portion of their shares and an unaffiliated third party. The transactions were agreed via an omnibus share purchase agreement. . As at year-end 2025 and for the reporting period , the directors have re-assessed the valuation approach and determined that a Net Asset Value ("NAV") approach would be used to determine fair value. The NAV approach relies on company-specific financial information and the determination of fair value does not apply market multiples. The valuation of Sand Tech as of 30 June 2026 was $495,384 (2025: USD 2,125,800).
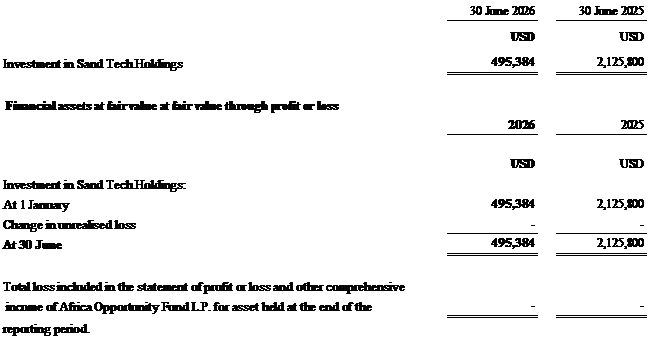
Valuation techniques
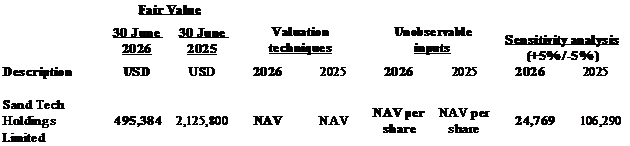
The Company invests in a private company which is not quoted in an active market. Transactions in such investments do not occur on a regular basis. The Company uses the net asset value technique for these positions.
Valuation process
Valuations are the responsibility of the Board of Directors of the Company. The valuation workings are based on the business plans received from the portfolio companies, with adjustments made if deemed necessary. The assumptions in the business plan are reviewed for reasonableness, to the extent possible with available market information. The appropriateness of the valuation methodology used is also considered.
Changes in valuation techniques
There was a change in valuation technique during the year and it was determined that NAV is the basis to be used to measure fair value.
Quantitative information of significant unobservable inputs - Level 3
6(e). Statement of profit or loss and other comprehensive Income of the Master Fund for the period from 1 January 2026 to 30 June 2026
The net gain on investments in subsidiaries at fair value through profit or loss for the period from 1 January 2026 to 30 June 2026 amounted to USD 10,449,774, while net losses on investments in subsidiaries at fair value through profit or loss for the period from 1 January 2025 to 30 June 2025 amounted to USD 445,202 arising at the Master Fund and can be analysed as follows:
|
|
|
For the period |
|
|
|
ended 30 June |
|
|
|
2026 |
|
|
|
|
|
|
|
USD |
|
Income |
|
|
|
Dividend revenue |
|
389,567 |
|
Interest revenue |
|
9 |
|
Net gains on financial assets and liabilities at fair value |
|
|
|
through profit or loss |
|
10,662,843 |
|
|
|
|
|
|
|
11,052,419 |
|
Expenses |
|
|
|
Net foreign exchange loss Custodian fees, brokerage fees, commission and administration |
|
7,949 63,788 |
|
Professional fees |
|
5,698 |
|
Other operating expenses |
|
5,234 |
|
|
|
|
|
|
|
82,669 |
|
|
|
|
|
Operating profit before tax |
|
10,969,750 |
|
|
|
|
|
Less withholding tax |
|
(39,843) |
|
|
|
|
|
Total Comprehensive income for the period |
|
10,929,907 |
|
|
|
|
|
Attributable to: |
|
|
|
AOF Limited (direct interests) |
|
10,446,012 |
|
AOF Limited (indirect interests through AOF (GP) Ltd) |
|
3,763 |
|
|
|
10,449,775 |
|
AOF CarryCo Limited (NCI) |
|
480,132 |
|
|
|
10,929,907 |
The financial assets and liabilities of the Master Fund are analysed as follows:
(i) Net gains/(losses) on financial assets at fair value through profit or loss held by Africa Opportunity Fund L.P.
|
|
|
|
|
|
|
For the period |
|
For the period |
|
|
|
|
|
|
|
ended 30 June |
|
ended 30 June |
|
|
|
|
|
|
|
2026 |
|
2025 |
|
|
|
|
|
|
|
USD |
|
USD |
|
Net gains/ (losses) on fair value of financial assets at fair value through profit or loss |
10,662,843 |
|
256,442 |
|||||
|
|
|
|
|
|
|
|
|
|
|
Net gains/ (losses) |
|
|
|
|
|
10,662,843 |
|
256,442 |
(ii) Financial assets at fair value through profit or loss held by Africa Opportunity Fund L.P.
|
|
|
|
|
|
|
For the period |
|
For the period |
|
|
|
|
|
|
|
ended 30 June |
|
ended 30 June |
|
|
|
|
|
|
|
2026 |
|
2025 |
|
|
|
|
|
|
|
|
|
|
|
|
|
|
|
|
|
USD |
|
USD |
|
Held for trading assets: |
|
|
|
|
|
|
|
|
|
At 1 January |
|
|
|
|
|
18,287,575 |
|
13,031,893 |
|
Additions Redemptions |
|
|
|
|
|
- (3,130,383) |
|
1,266,892 - |
|
Net gains/ (losses) on financial assets at fair value through profit or loss |
10,662,843 |
|
256,442 |
|||||
|
|
|
|
|
|
|
|
|
|
|
At 30 June (at fair value) |
|
|
|
|
|
25,820,035 |
|
14,555,227 |
|
|
|
|
|
|
|
|
|
|
|
Analysed as follows: |
|
|
|
|
|
|
|
|
|
|
|
|
|
|
|
|
|
|
|
Listed equity securities |
|
|
|
|
|
25,324,651 |
|
12,429,427 |
|
Unlisted equity securities |
|
|
|
|
|
495,384 |
|
2,125,800 |
|
|
|
|
|
|
|
|
|
|
|
|
|
|
|
|
|
25,820,035 |
|
14,555,227 |
|
|
|
|
|
|
|
|
|
|
(iii) Net changes on fair value of financial assets at fair value through profit or loss
|
|
|
|
|
|
|
For the period |
|
For the period |
|
|
|
|
|
|
|
ended 30 June |
|
ended 30 June |
|
|
|
|
|
|
|
2026 |
|
2025 |
|
|
|
|
|
|
|
|
|
|
|
|
|
|
|
|
|
USD |
|
USD |
|
|
|
|
|
|
|
|
|
|
|
Realised |
|
|
|
|
|
(325,676) |
|
- |
|
Unrealised |
|
|
|
|
|
10,988,519 |
|
256,442 |
|
|
|
|
|
|
|
|
|
|
|
Total gains/(losses) |
|
|
|
|
|
10,662,843 |
|
256,442 |
7. RECEIVABLES
|
|
|
|
30 June 2026 |
|
30 June 2025 |
|
|
|
|
USD |
|
USD |
|
Other receivables and prepayments |
|
|
21,048 |
|
9,986 |
|
|
|
|
21,048 |
|
9,986 |
8. CASH AND CASH EQUIVALENTS
|
|
|
|
30 June 2026 |
|
30 June 2025 |
|
|
|
|
USD |
|
USD |
|
Cash at bank |
|
|
7,002 |
|
9,595 |
|
|
|
|
|
|
|
9(a). ORDINARY SHARE CAPITAL
|
|
|
|
|
|
30 June 2026 |
|
30 June 2026 |
|
30 June 2025 |
|
30 June 2025 |
|
|
|
|
|
|
|
|
|
|
|
|
|
|
|
|
|
|
|
Number |
|
USD |
|
Number |
|
USD |
|
Authorised share capital |
|
|
|
|
|
|
|
|
|
||
|
Ordinary shares with a par value of |
|
|
|
|
|
|
|
|
|
||
|
USD 0.01 |
|
|
|
|
1,000,000,000 |
|
10,000,000 |
|
1,000,000,000 |
|
10,000,000 |
|
|
|
|
|
|
|
|
|
|
|
|
|
|
Issued share capital |
|
|
|
|
|
|
|
|
|
|
|
|
Ordinary shares with a par value of |
|
|
|
|
|
|
|
|
|
||
|
USD 0.01 |
|
|
|
|
11,468,907 |
|
114,689 |
|
11,468,907 |
|
114,689 |
|
|
|
|
|
|
|
|
|
|
|
|
|
The directors have the general authority to repurchase the ordinary shares in issue subject to the Company having funds lawfully available for the purpose. However, if the market price of the ordinary shares falls below the Net Asset Value, the directors will consult with the Investment Manager as to whether it is appropriate to instigate a repurchase of the ordinary shares.
The Company intends to pay or report dividends in order to remain an UK Reporting Fund, however, there is no assurance that the Company will be able to pay dividends. In compliance with the current investment strategy, Directors have the right to return cash through compulsory redemptions, by way of dividend or any other distribution as permitted by the Listing Rules.
9(b). SHARE CAPITAL AND SHARE PREMIUM
|
|
Share |
|
Share |
|
Ordinary |
|
|
Capital |
|
Premium |
|
Shares |
|
|
|
|
|
|
|
|
|
USD |
|
USD |
|
Number |
|
At 1 January 2025 |
114,689 |
|
5,810,553 |
|
11,468,907 |
|
|
|
|
|
|
|
|
Changes during the period: |
|
|
|
|
|
|
Redemption of ordinary shares |
- |
|
- |
|
- |
|
At 30 June 2025 |
114,689 |
|
5,810,553 |
|
11,468,907 |
|
|
|
|
|
|
|
|
|
|
|
|
|
|
|
At 1 January 2026 |
114,689 |
|
5,810,553 |
|
11,468,907
|
|
Changes during the period: |
|
|
|
|
|
|
Redemption of ordinary shares |
- |
|
- |
|
- |
|
|
|
|
|
|
|
|
At 30 June 2026 |
114,689 |
|
5,810,553 |
|
11,468,907 |
9(c). NET ASSETS ATTRIBUTABLE TO SHAREHOLDERS
|
|
|
|
Ordinary |
|
|
|
|
Shares |
|
|
|
|
USD |
|
At 1 January 2026 |
|
|
17,323,402 |
|
Changes during the period: |
|
|
|
|
Total comprehensive income for the period |
|
10,126,112 |
|
|
|
|
|
|
|
At 30 June 2026 |
|
|
27,449,514 |
|
Net asset value per share at 30 June 2026 |
|
2.393 |
|
|
|
|
|
|
Mandatory Redemption
The Directors, at their sole discretion, can effect a compulsory redemption of the Ordinary Shares on an ongoing basis and will therefore undertake a staged return of capital to shareholders. During the half-year ended 30 June 2026, the Directors did not initiate or approve a partial mandatory redemption of the Company's Ordinary Shares. The Company has 11,468,907 Ordinary Shares in issue. Robert Knapp and Myma Belo-Osagie, Directors of the Company held 6,238,860 and 15,234 Ordinary Shares, respectively.
Ordinary and C share Merger, Issuance of Contingent Value Rights
In 2014, AOF closed a Placing of 29.2 million C shares of US$0.10 each, at a placing price of US$1.00 per C share, raising a total of $29.2 million before the expenses of the Issue. The placing was closed on 11 April 2014 with the shares commencing trading on 17 April 2014. AOF's Ordinary Shares and the C Shares from the April placing were admitted to trading on the LSE's Specialist Fund Segment ("SFS") effective 17 April 2014.
The Company merged the C share class and the ordinary shares as contemplated in the April 2014 issuance of the C share class, and with the consent of the Board of Directors, on 23 August 2017. The C Class shares were converted into ordinary shares.
The Shoprite arbitral award issued in 2016. The arbitral award resulted in AOF not being considered legal owner of the specific Shoprite Holdings, therefore, the Shoprite investment was written off. To effectuate this merger, Contingent Value Rights certificates for any residual rights with respect to Shoprite shares listed on the Lusaka Stock Exchange were issued to the ordinary shareholders of record on 21 August 2017. Information regarding the merger was distributed and released to the market prior to, and upon execution of, the merger. This information and information relative to the CVRs can be found on the Company's website.
10. TRADE AND OTHER PAYABLES
|
|
|
|
30 June 2026 |
|
30 June 2025 |
|
|
|
|
|
|
|
|
|
|
|
USD |
|
USD |
|
|
|
|
|
|
|
|
Director fees payable |
|
|
35,000 |
|
17,500 |
|
Other payables |
|
|
47,509 |
|
51,325 |
|
|
|
|
|
|
|
|
|
|
|
82,509 |
|
68,825 |
|
|
|
|
|
|
|
Other payables are non-interest bearing and have an average term of six months. The carrying amount of trade and other payables approximates their fair value.
11. EARNING PER SHARE
The earnings per share (EPS) is calculated by dividing the change in net assets attributable to shareholders by the number of ordinary shares. The EPS for the period ended 30 June 2026 and 2025 represent both the basic and diluted EPS.
|
|
|
|
|
|
Period from 1 January 2026 to 30 June 2026 |
Period from 1 January 2025 to 30 June 2025 |
|
|
|
|
|
|
|
|
|
|
|
|
|
|
|
|
Ordinary shares |
|
Ordinary shares |
|
|
|
|
|
|
|
|
|
|
Change in net assets attributable to shareholders |
|
USD |
|
|
10,126,112 |
|
156,810 |
|
|
|
|
|
|
|
|
|
|
Number of shares in issue |
|
|
|
|
11,468,907 |
|
11,468,907 |
|
|
|
|
|
|
|
|
|
|
Change in net assets attributable to shareholders per share |
|
|
|
|
|
|
|
|
(based on number of shares outstanding at period end) |
|
USD |
|
|
0.883 |
|
0.014 |
|
|
|
|
|
|
|
|
|
|
Weighted Average number of shares in issue |
|
|
|
|
11,468,907 |
|
11,468,907 |
|
|
|
|
|
|
|
|
|
|
Change in net assets attributable to shareholders (based on
|
|
|
|
|
|
|
|
|
weighted average number shares outstanding at period end) |
|
USD |
|
|
0.883 |
|
0.014 |
|
|
|
|
|
|
|
|
|
12. ANALYSIS OF NAV OF MASTER FUND ATTRIBUTABLE TO ORDINARY SHARES
|
|
|
30 June 2026 |
|
|
30 June 2025 |
|
|
|
|
|
|
|
|
|
|
|
|
|
|
|
ASSETS |
|
|
|
|
|
|
Cash and cash equivalents |
|
3,099,120 |
|
|
241,083 |
|
Trade and other receivables |
|
277,141 |
|
|
235,360 |
|
Financial assets at fair value through profit or loss |
|
25,820,035 |
|
|
14,555,227 |
|
Total assets |
|
29,196,296 |
|
|
15,031,670 |
|
|
|
|
|
|
|
|
EQUITY AND LIABILITIES |
|
|
|
|
|
|
Liabilities |
|
|
|
|
|
|
Trade and other payables |
|
428,647 |
|
|
428,091 |
|
Total liabilities |
|
428,647 |
|
|
428,091 |
|
|
|
|
|
|
|
|
Net assets attributable to members' account |
|
28,767,649 |
|
|
14,603,579 |
|
|
|
|
|
|
|
13. TAXATION
Under the current laws of Cayman Islands, there is no income, estate, transfer sales or other Cayman Islands taxes payable by the Company. As a result, no provision for income taxes has been made in the financial statements.
Dividend revenue is presented gross of any non-recoverable withholding taxes, which are disclosed separately in the statement of comprehensive income. Withholding taxes are not separately disclosed in statement of cash flows as they are deducted at the source of the income.
14. SEGMENT INFORMATION
For management purposes, the Company is organised in one main operating segment, which invests in equity securities, principally via the Master Fund. All of the Company's activities are interrelated, and each activity is dependent on the others. Accordingly, all significant operating decisions are based upon analysis of the Company as one segment. The financial results from this segment are equivalent to the financial statements of the Company as a whole.
15. PERSONNEL
The Company did not employ any personnel during the period (2025: the same).
16. COMMITMENTS AND CONTINGENCIES
There are no commitments or contingencies at the reporting date.
17. SIGNIFICANT EVENTS
Effective 1 January 2025, NAV Fund Services Inc. was appointed to act as administrator to the Company, replacing SS&C Technologies Inc.
18. EVENTS AFTER REPORTING DATE
As at the date of the approval of these financial statements, the directors continue to be aware of the geopolitical tensions and armed conflicts in the Middle East and do not underestimate the seriousness of these events and the impact this will have on the global economy. The directors continue to assess the impact on the Company, as the impact on global energy markets, the increased burden on African consumers from an inflationary environment and the impact on countries with significant sovereign indebtedness, are all areas for analysis and concern. While the Company does not have any transactions with countries in the affected regions, the ongoing conflict has global implications. At this time, the directors have determined that the events do not have a material impact on the financial statements. Nevertheless, due to the uncertainty surrounding the duration and extent of the conflict and the continued potential for broader economic impacts, management will continue to monitor the situation closely.
There were no other material events after the reporting date up to the date that these financial statements were authorised for issue that warrant adjustments or disclosures in the financial statements for the period ended 30 June 2026.
RNS may use your IP address to confirm compliance with the terms and conditions, to analyse how you engage with the information contained in this communication, and to share such analysis on an anonymised basis with others as part of our commercial services. For further information about how RNS and the London Stock Exchange use the personal data you provide us, please see our Privacy Policy.

Latest directors dealings
- 1 minute ago Croda International
- 21 minutes ago Record
- 1 hour ago Regional REIT Limited
- 1 hour ago Venture Life Group
- 1 hour ago Jardine Matheson Holdings Ltd (Singapore Reg)