Final Audited Results
Summary by AI BETAClose X
THE INFORMATION CONTAINED WITHIN THIS ANNOUNCEMENT IS DEEMED BY THE COMPANY TO CONSTITUTE INSIDE INFORMATION AS STIPULATED UNDER ARTICLE 7 OF THE EU REGULATION 596/2014 AS IT FORMS PART OF THE UK LAW BY VIRTUE OF THE EUROPEAN UNION (WITHDRAWAL) ACT 2018 ("MAR"). UPON THE PUBLICATION OF THIS ANNOUNCEMENT VIA A REGULATORY INFORMATION SERVICE, THIS INFORMATION IS CONSIDERED TO BE IN THE PUBLIC DOMAIN.
25 February 2026
AFC Energy Plc
("AFC Energy" or the "Company")
Final Audited Results for the Financial Year Ended 31 October 2025
Delivering strategic and operational progress
AFC Energy Plc (AIM: AFC), a leading provider of ammonia-based low carbon hydrogen production and hydrogen-to-power solutions at a commercially viable price point, is pleased to announce its audited results for the financial year ended 31 October 2025 ("FY25").
John Wilson, Chief Executive of AFC Energy, said:
"12 months ago, we announced plans to accelerate our path to scalable commercial success, focus on areas of greatest opportunity and deliver a market push, rather than relying solely on market pull. We are successfully delivering on these plans, working to ensure AFC Energy creates significant shareholder value.
The successful execution of our oversubscribed £27.5 million (gross) fundraising in July 2025 was a further vote of confidence in the evolution of the business, enabling the business to invest with purpose to accelerate the commercial development and deployment of our fuel cell and ammonia cracking products. This has enabled the recent launch of our new LC30 fuel cell generator and continued progress to availability of our Hy-5 ammonia cracker, capable of producing 500kg/day of hydrogen which we aim to target selling at £10/kg.
We continue to execute successfully on our strategy as we look to deliver low-cost hydrogen power at scale without the need for government subsidies. AFC Energy remains well on track for 2026 to be a year of conversion of our growing pipeline of opportunities to contractual orders and the beginning of sustained revenue growth for our business. We look forward to the future with strong and increasing optimism."
FY25 Operational Highlights
|
• |
Strategic reset and focus on delivering the commercial deployment of our proprietary technology and products to create significant shareholder value |
|
• |
Multiple successful deployments of AR2 30kW fuel cell generators through our joint venture Speedy Hydrogen Solutions |
|
• |
Launch of our first hydrogen production product - the Hy-5 ammonia cracker - capable of producing 500 kg/hydrogen per day, for delivery in calendar year 2026 |
|
• |
Joint Development Agreement ("JDA") signed with S&P 500 partner to develop small to large scale decentralised ammonia to hydrogen crackers. Successful completion of first phase of JDA and discussions ongoing regarding commercial opportunities prior to commencing next phase |
|
• |
Strategic partnership with Volex Plc to manufacture at scale our fuel cell generators |
|
• |
Joint venture with Industrial Chemicals Group Limited to use AFC Energy's proprietary, leading ammonia cracking technology to produce the lowest cost bulk hydrogen available to industrial customers in the UK, by the end of calendar year 2026 (subject to permitting) |
|
• |
We announced targeting the provision of hydrogen-as-a-service, with an offer to customers of low-carbon hydrogen at £10/kg - making us one of the most cost-competitive, low-carbon hydrogen suppliers in the UK |
|
• |
Working in partnership with Tamgo, the successful deployment of H-Power 200kW liquid cooled fuel cell generator at the FIA Extreme H World Cup in Qiddiya City, Saudi Arabia |
|
• |
Significant focus on commercial viability, driving a streamlined business reorganisation with reduced headcount and footprint, and a clearer operational focus through the establishment of a Project Management Office and commercial function, with appointments of Programme Director, Chief Strategy Officer and Chief Commercial Officer to complement the leadership team |
FY25 Financial Highlights
|
• |
£27.5m successful oversubscribed placing to support the business' development ambitions |
|
• |
£25.3m cash, cash equivalents and short term investments at year end (FY24: £15.4m), with current cash of £20.4m as at 31 January 2026 (including short term investments). |
|
• |
Loss after tax of £22.2m (FY24: £17.4m) which includes an increase in non-cash expenditure of £8.4m (£5.5m due to stock and debtor write-offs, £1.9m increase in depreciation/amortisation, £0.5m in share-based payments and £0.5m of remuneration settled via equity) |
|
• |
R&D investment of £11.7m (FY24: £9.5m), with £1.6m R&D tax credits received (FY24: £2.7m) |
Post Period Developments
|
• |
Launch of the LC30, 30kW fuel cell generator, c. 85% lower cost, up to 20% more efficient, >95% fewer components and substantially smaller footprint than its predecessor, resulting in inbound commercial interest |
|
• |
Joint Development Agreement signed with Komatsu Ltd, c.$2 million contract value, to design and integrate AFC Energy's proprietary ammonia cracking technology with a Komatsu industrial internal combustion diesel engine to assess the feasibility of a new ammonia fuelled engine platform capable of scaled production |
|
• |
UK Environment Agency permit agreed to enable the sale of hydrogen produced from our pilot ammonia cracker in Dunsfold, ensuing AFC Energy will generate revenues from hydrogen production 3-4 months ahead of schedule |
Business Priorities - Commercialisation
|
• |
Commercial traction to deliver pre-orders of LC30 and Hy-5 units |
|
• |
Establish Fuel as a Service (FaaS) offering for UK customers |
|
• |
Progressing JDAs to deliver product and technology based commercial revenues |
|
• |
Continued expansion of our channel and refinement of go to market strategy |
|
|
o North American market focus |
|
|
o TAMGO market applications and optimal product set review |
|
|
o European market entry point and partnership review |
Business Priorities - Development and Technical
|
• |
Finalising development, build and roll out of Hy-5, the world's first containerised, portable, cracking system capable of producing up to 500kg/day, for delivery at the end of calendar year 2026 |
|
• |
Continuation of roadmap development for both fuel cell generator portfolio and cracker development, to further productise our technology |
|
• |
Continued successful patent applications filed based on core technology |
Outlook
|
• |
Through continued execution of our strategic plan, commercial momentum is building |
|
• |
Remain well on track for 2026 to be a year of conversion of our growing pipeline of opportunities to contractual orders and the beginning of sustained revenue growth for our business |
Investor Presentation
John Wilson, Chief Executive Officer, and Karl Bostock, Chief Financial Officer, will host a live presentation for retail investors via Investor Meet Company on Friday 27 February 2026, at 14:00 hrs GMT.
The presentation is open to all existing and potential shareholders. Questions can be submitted pre-event via your Investor Meet Company dashboard up until Wednesday 25 February 2026, 17:00 hrs, or at any time during the live presentation.
Investors can sign up to Investor Meet Company for free and add to meet AFC ENERGY PLC via: https://www.investormeetcompany.com/afc-energy-plc/register-investor
FOR FURTHER INFORMATION, PLEASE CONTACT:
|
AFC Energy Plc John Wilson (Chief Executive Officer) |
+44 (0) 14 8327 6726 |
|
Karl Bostock (Chief Financial Officer)
Peel Hunt LLP - Nominated Adviser and Joint Broker Richard Crichton / Georgia Langoulant / Emily Bhasin |
+44 (0) 207 418 8900
|
|
Zeus - Joint Broker David Foreman / James Hornigold (Investment Banking) Dominic King (Corporate Broking) / Rupert Woolfenden (Sales) |
+44 (0) 203 829 5000 |
|
DGA Group - Financial PR and Communications Advisors James Benjamin / James Styles
|
+44 (0) 7747 113 930 +44 (0) 7510 385 554 |
ABOUT AFC ENERGY
AFC Energy Plc is a leading provider of ammonia-based low carbon hydrogen production and hydrogen-to-power solutions. Our market-leading decentralised ammonia cracker and fuel cell generator products are engineered to unlock the low carbon hydrogen market by meeting customers' needs with scalable, reliable supplies of low carbon hydrogen and power. AFC Energy is enabling customers to decarbonise at a price that is commercially viable.
We are focused on the successful commercial rollout of our core product suite and on creating significant shareholder value by converting our growing opportunity pipeline into contracted orders and delivering sustained revenue growth.
Our core strategy is to develop and deploy products that enable the production of scalable, reliable supplies of clean hydrogen at commercially viable prices and without reliance on government subsidies or incentives. AFC Energy achieves this through our proprietary, decentralised and modular ammonia cracker technology, and providing low carbon, off‑grid power solutions with our fuel cell generators that are competitive with, and capable of displacing, diesel generators on a total cost of ownership basis.
The Company's modular, decentralised ammonia cracker systems have production capacities of approximately 0.5 and 4 tonnes of hydrogen per day respectively. These enable the generation of scaled volumes of low carbon hydrogen at the point of use within a highly compact footprint. Our systems have the potential to drive substantial revenue growth across a wide range of addressable markets, including hard‑to‑abate industrial facilities, transportation and power generation applications.
AFC Energy's fuel cell generator systems are currently offered with generation capacities of 30 kW and 200 kW. They are well-suited to off‑grid, decentralised and temporary power applications, including the displacement of diesel generators on construction and infrastructure sites. Further use cases include electric vehicle charging for cars, buses and trucks, as well as charging of battery‑powered non‑road machinery, with additional emerging opportunities in maritime, data centre and rail applications.
AFC Energy is listed on the London Stock Exchange's AIM Market and headquartered in Dunsfold, Surrey, UK.
Please read more on our website https://www.afcenergy.com/ and follow us on LinkedIn
Chairman's Statement
This year has been one of significant positive change for AFC Energy.
Building on the progress of previous years, the Company has taken decisive action to reposition itself for scalable commercial success to accelerate the creation of significant shareholder value.
As Chairman, I am proud to say that the Board is fully aligned with the executive leadership in both recognising the need for strategic change and supporting its rapid implementation.
In what has remained a challenging external environment, the Company has made great strides and is well positioned for the future.
We also welcomed a refreshed executive team early in the financial year. The appointments of John Wilson as Chief Executive Officer and Karl Bostock as Chief Financial Officer marked a critical turning point for the business. Under their stewardship, the Company has been restructured with a clear focus on execution, cost efficiency, and the creation of significant shareholder value. The progress made since their appointments reflects not only strong strategic and operational leadership, but a renewed cultural energy across the business, ensuring AFC Energy is well positioned to meet its ambitions. The strategic reset has addressed key realities in our sector, namely the high cost of capital, policy uncertainty, and a market that increasingly demands economically viable clean energy solutions. AFC Energy's sharpened focus on cost competitiveness, product simplification, and meaningful commercial partnerships is a necessary evolution and has already begun to deliver encouraging results.
The successful execution of our oversubscribed £27.5 (gross) million fundraising in July 2025 was a further vote of confidence in the evolution of the business, supported by both new and existing shareholders. On behalf of the Board, I would like to extend our sincere thanks to all shareholders who participated. This capital is enabling the business to invest with purpose in cost-down initiatives, strategic hires, and the infrastructure necessary to accelerate the commercial development of both our fuel-cell and ammonia cracking products.
Crucially, the business is not only developing advanced technology, but it is also now bringing that technology to market in defined commercial fuel cell and ammonia cracker products. The evolution of our go-to-market strategy, exemplified through the Speedy Hire joint venture, is allowing us to validate our proposition in live environments. The response from end-users to our diesel-equivalent pricing and low-emission profile has been encouraging and signals a maturing commercial platform.
Beyond the UK, our engagement with global supply chain partners such as Volex plc positions us to scale efficiently as demand increases. This aligns with a broader industry shift: hydrogen technologies at a commercially viable price point are now forming part of near-term procurement decisions across construction, infrastructure and logistics.
From a macro perspective, the global hydrogen economy is entering a new phase. Governments and industry stakeholders around the world are pushing forward with commercial-scale green hydrogen and ammonia projects. Ammonia is fast becoming the carrier of choice for transporting hydrogen due to its lower cost, scalability, and ability to utilise existing infrastructure. As an early advocate of this model, we are already seeing that belief rewarded through progress at our joint venture with ICL on Teesside.
Our early investment in ammonia-based systems not only differentiates our technology but also solves some of the hardest problems in the hydrogen value chain. It gives us the ability to decouple clean hydrogen supply from traditional infrastructure constraints, which is essential for us to enable widespread off-grid power applications.
Internally, the business has also matured. The restructuring carried out during the year has created a leaner, more agile and focused organisation. Strategic new hires have brought added capability in commercial and operational roles, and we have instilled a culture of delivery that will support the next stage of growth. Cost efficiency measures and operational discipline introduced this year are expected to deliver c.£1.5 million in annualised savings, extending our cash runway while improving focus.
While these strategic and operational developments are crucial, the resilience and determination of our team deserves recognition. The pace of change in the business over the past 12 months has been significant, and our team has met this challenge with professionalism and conviction. On behalf of the Board, I would like to extend heartfelt thanks to every member of the AFC Energy team. Their dedication continues to be the bedrock of our success.
I would also like to reiterate our gratitude to our shareholders for their continued support and belief in our vision. The success of this year's fundraising has allowed us to move forward with confidence and clarity. We remain committed to open and transparent engagement, and we understand the responsibility we carry to convert your investment into long-term, sustainable value.
Looking ahead to 2026, we do so with strong momentum and increasing confidence in our sector. AFC Energy is now well placed to play a central role in enabling the global transition to zero-emission power. With cost-competitive products, validated routes to market, and a strengthened leadership team, the Company has the right foundations for scalable growth and the creation of significant shareholder value.
The use of hydrogen as the green fuel of the future is a reality, and with ammonia an enabler, and innovation at our core, AFC Energy is ready to lead and successfully deliver on its ambitions.
Chief Executive Officer's Statement
Dear Shareholders,
In January 2025, I was appointed Chief Executive Officer of AFC Energy, with Karl Bostock joining as Chief Financial Officer. This report covers progress from that date.
Since appointment my focus has been on resetting the Company's strategy and delivering on it. We now live in a world where the cost of capital is high and both micro and macro uncertainty preclude willingness to invest. This, coupled with challenges in the global sector, necessitated a change of direction and pace.
Our business was on the cusp of commercialisation, but at a price point that the market was unwilling to bear, with product complexity that would not enable economies of scale to drive commercial viability. This needed to change.
While regulatory tailwinds support our sector in the medium term, a lack of long term government policy clarity, dilution of policy commitments and unwillingness to pay substantially more for "green," provided a clear steer of both the challenge and opportunity available to us. We need to build a business in which the "noise" of policy is secondary to our value proposition. Our business is blessed with an incredibly talented team that has developed, and continues to develop, world-class technology. The task at hand is to harness this creativity to create value, which is now our approach: Establish a product suite and offering that drives commercial viability without government subsidy.
With our go-to-market strategy for our fuel cell generators well defined in the UK through our JV with Speedy Hire, we undertook a comprehensive analysis to determine total cost of ownership of diesel generators, servicing and fuel cost over their economic life. In doing so, we confirmed very clear price points that we needed to attain to meet our goals. What followed was an 85% cost reduction from the 20-unit volume build the business undertook to satisfy the JV demand. In conjunction, we announced the launch of our first hydrogen production product - the Hy-5 ammonia cracker - under a fuel as a service model which will first be delivered at the back end of calendar year 2026, supported by Environment Agency approval for commercial use of hydrogen produced in Dunsfold to power our Speedy Hydrogen Solutions fuel cell generators. These products will enable us to be highly competitive with incumbent technology with respect to price.
1) Provide balance sheet strength to finance the Company's short-term goals
In July we announced an oversubscribed fundraise from both institutional and private investors. The c.£27.5m (gross) fundraise was a clear mandate to deliver the strategy. Through the process we have welcomed several new institutions to our business as shareholders.
2) Laser focus on costs and building Company infrastructure to deliver
Post fundraise, and following a strategic cost and business structure review, we have taken several steps to drive down costs:
a) Reduction of the Company's footprint, including the closure of our Germany facility in Stade, resulting in a £250,000 annual saving and the release of a significant bond guarantee to our balance sheet.
b) Realigning the headcount of the business to our new business strategy. This has resulted in a c.20% reduction in headcount as we seek to benefit from outsourcing manufacturing in the medium term.
c) Reduction of the number of advisors.
These actions are expected to deliver c.£1.5m of annualised savings. In addition, we have restructured the business: pooling the engineering talent as opposed to a divisional split, strengthened the Executive team through the addition of a Programme Director, Chief Strategy Officer (CSO) and Chief Commercial Officer (CCO) and introducing a more coherent, and cohesive organisational structure that focuses on delivery and execution.
3) Deliver proof points, technology validation and supply chains
Throughout the year, we delivered key proof points that served to provide peer validation of our technology and potential for market adoption, including validation of our cracker technology by a S&P500 partner and, post-FY25, Komatsu, in the form of our recently announced joint development agreement. Our partnership with Volex plc gives us potential access to manufacturing across multiple geographies served by 27 factories, and access to a substantial global supply chain that will support further reduction in generator costs with economies of scale.
Our joint venture with ICL continues at pace as we relocate our pilot cracker from Dunsfold, Surrey, to Port Clarence, Teesside, to generate the UK's first commercially available hydrogen from cracked ammonia. We have also worked to establish the supply chain for green ammonia to support this. Following line of sight on costings of our new LC30 generators, in conjunction with confidence of Hy-5 delivery, we offered "tomorrow's price today" to Speedy Hire's end customers: that of diesel equivalence. This action served to unlock the market with a pipeline quickly building from multiple end users. Deployments have begun in earnest across numerous use cases: from recharging of electrical excavators to powering welfare stations. The lessons learned from these deployments are essential to continue to build the business model for geographical expansion.
We successfully concluded our Red Diesel Replacement ("RDR") grant programme, showcasing our 200kW hydrogen fuel cell generator powering a 1.6 km conveyor, and 30kW system, as part of a Lower Thames Crossing project. This generated £2.2m of grant income (cash receipts) and demonstrated the resilience of our liquid-cooled platform to be utilised in our next generation of products. The same generator ran faultlessly in Saudi Arabia providing power for almost two weeks to the FIA Extreme H event.
4) Rebrand and building a commercial function to deliver
We have undertaken a rebranding exercise and website overhaul to better reflect the evolved business and strategy. This serves to provide greater clarity to both the investment community and to current and potential customers of our value proposition and product offerings.
At the start of my tenure, our commercial team consisted of one commercial director. We have begun to put in place the building blocks of a high quality commercial function capable of delivering our ambitions. The appointments of a Chief Strategy Officer, to focus on demand creation, in conjunction with a Chief Commercial Officer to close opportunities developed, are central to this.
2026 will be a year of go to market and channel development, with a focus on customer demand creation and geographic expansion from our newly created commercial function. 2026 will also see new product availability with our LC30 fuel cell generators and Hy-5 units, which will help to drive the conversion of our growing pipeline of opportunities to contractual orders and the beginning of sustained revenue growth for our business.
The resilience and expertise of our team members has been critical to the progress made this year to shift significantly the strategic and operational focus of the business. I extend my sincerest thanks for their support and dedication since I joined our business, and their belief in our strategy and ability to deliver.
In a sector mostly reliant on government subsidy for commercial viability, we stand out from the crowd. Our ability to produce hydrogen from ammonia, at a price point unmatched in the UK, is key to creating significant shareholder value. We look forward to the future with optimism.
Financial Review
As highlighted in the CEO Report, the business has undergone a commercial pivot in its drive to create value from the technology created by our talented employees. This report presents the impact of these changes on the FY25 financial information:
1. Establish a product suite and offering that drives commercial viability without government subsidy
The business is fulfilling this ambition by the launch of two products.
Proving the concept (Fuel Cells) - The work undertaken as part of the RDR grant paved the way for the concept of the new lower cost fuel cell generator (LC30). This project proved that we could take technology and harness its strengths to provide a like-for-like solution as the current generators (AR2) but at a highly reduced cost. In the year, total costs (including labour) of £2.3m were incurred on this project of which £2.1m was capitalised under IAS 38. Cash inflows relating to government grants totalled £2.2m during the year, all of which have been deferred (recognised as other creditors) which will be amortised over the life of the development asset (3 years).
In addition to the expenditure above, we incurred costs of £17k supporting the deployment of our 200kW hydrogen generator (which contains the same technology as the new lower cost 30kw hydrogen generator) supporting the Extreme H World Cup in Qiddiya. The fuel cell performed perfectly in the Saudi Arabian desert, operating in some of the harshest environmental conditions on planet. Sales revenues of £15k were recognised for this support.
Testing (Hy-5) - As part of the development of the Hy-5, the business is constantly seeking to improve the efficiency and durability of its cracker technology. During the year the total cash impact of these projects amounted to £967k.
Developing the product - The FY25 cost of the development for the 2 products are as follows:
|
Project |
Committed Spend (yet to be incurred / spent) £'000s |
Cost in FY25 £'000s |
Total £'000s |
|
30kW Fuel Cell |
586 |
559 |
1,145 |
|
Hy-5 |
627 |
712 |
1,339 |
|
|
1,213 |
1,271 |
2,484 |
Accounting for the current technology - As part of the strategic review, the business made the decision not to manufacture any further AR2 units (the model sold to the Speedy Hire JV) on the grounds that they were too expensive and the new model is set to be significantly cheaper. An outcome of this decision is that all inventory held of both finished goods and raw materials of the AR2 were written down to £nil at 31 October 2025. The total impact of this decision was £2.6m which is included within operating costs within the financial information.
In addition to inventory relating to the AR2 unit, the Directors also reviewed the recoverability of the debtor for the 15 remaining AR2 units which remain outstanding for payment from Speedy Hydrogen Services Limited (SHS). To accelerate the transition from diesel generators to hydrogen fuel cells we want to give the joint venture the lowest cost possible for the best available technology. For this reason, we have provided for the debt of £2.8m owed by Speedy Hydrogen Solutions to AFC Energy on the assumption that the joint venture will transition to the new technology.
2. Provide balance sheet strength to finance the Company's short-term goals
During July and August 2025, the business raised £27.5m (gross) via a fundraise, issuing new equity at 10p per share. This fundraise was oversubscribed and included new institutional investors capable of supporting future developments.
The cost of the fundraise was £1.7m (£1.4m in commissions and £0.3m in legal and corporate finance costs) resulting in net proceeds of £25.8m. The funds will be used to deliver the two product lines listed above.
3. Laser focus on costs and building Company infrastructure to deliver
The business has carried out a review of all costs which included the cost of employing our talented team. Due to the change in strategy the business needs different skills today and sadly the business had to part ways with 17 colleagues, and we redeployed a further four during October 2025 at a total cost of £276k. This cost is in addition to the rationalisation programme which concluded in November 2024 which cost a total of £262k. A summary of savings is as follows:
|
|
Total Cost in FY25 £'000s |
Cost to Execute in FY25 £'000s |
Annual Run Rate Cost Savings £'000s |
Total cost in FY26 £'000s |
|
Stade (Germany) Facility (excluding provision release) |
606 |
327 |
279 |
- |
|
Reduced footprint of UK facility (exited in January 26) |
225 |
- |
225 |
56 |
|
People cost (October 25 redundancy programme) |
1,206 |
276 |
930 |
- |
|
Broker rationalisation |
75 |
- |
75 |
- |
|
|
2,112 |
603 |
1,509 |
56 |
In the CEO Report, John Wilson reports on the pooling of the engineering and development teams, removing the segregation between fuel cells and fuel processing (Hyamtec) for the organisation. AFC Energy plc has two subsidiaries, Hyamtec Limited and H-Power Limited. Both of these entities are dormant and have no assets or liabilities. Any reference to Hyamtec within the annual report is making reference to the fuel processing (cracker) activities of the business and not the legal entity. In addition, the report makes reference to the ICL Joint Venture. The Joint Venture is in the progress of obtaining an Environmental Agency permit to enable the relocation of the AFC portable ammonia cracker from Dunsfold to its intended location in Middlesborough. After the permit is granted, it is our intention to incorporate a new limited company and commence trade.
4. Deliver proof points, technology validation and supply chains
Other than a small amount of Engineering Revenue and the expenditure on the development costs reported above, there is yet to be any impact on the financial information from these achievements.
Loss for the financial year of £22.2m
At first glance, this loss represents a significant increase from the prior year of £17.4m. However, the main elements of the increase are already explained above (with the stock and debtor write offs). Other items where there have been significant variances from the prior year include:
Revenue: In FY24 the business made revenue of £4m selling the current AR2 units. On joining the business, the decision was made not to manufacture or sell any additional AR2 units. Revenue for FY25 is only £0.1m and includes Rental of the unit to Acciona, Engineering Services and Extreme H support.
Other Income: Other income has dropped year in year due to the updated accounting treatment of Research and Development Tax Credits with the new combined scheme being recognised solely on the taxation line (FY24 £0.2m)..
Operating Costs: Operating costs in FY25 include a number of non-cash transactions. These are summarised as: (a) the stock write down of £2.6m (FY24 - £nil) as reported above; (b) the provision for expected credit losses of £2.9m (FY24 - £nil) as report above; (c) depreciation / amortisation of £4.4m (FY24 - £2.5m) the increase in this cost being accelerated depreciation on leasehold improvements on the property the business has decided to exit and the commencement of amortising the capitalised R&D spend; (d) share based payment of £2.0m (FY24 - £1.5m), the increase relating to a full year impact of the options issued in FY24 (£0.8m in FY25 vs £0.5m in FY24) as well as to the new leadership team (£0.8m in FY25 vs £nil in FY24), offset by a revaluation if £0.4m in FY24 which did not repeat in FY25. If we adjust for these non-cash items the underlying costs would be £13.4m (FY24 - £14.1m).
Taxation: In FY25 the business focus shifted back towards development from manufacturing which in turn has increased the amount of expenditure qualifying for tax credits. This coupled with a change in the qualification framework resulted in the Company qualifying for the enhanced R&D intensive support scheme in FY25 which was not achieved in FY24.
Cash Management and Closing Cash of £25.3m
Since joining the business, we have worked hard to preserve cash whilst the new strategy was set.
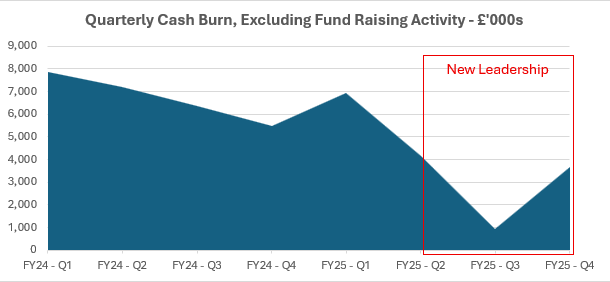
This resulted in a reduction of the quarterly cash burn from £6.7m per quarter in the 15 months before joining to £2.9m in the last three months of the financial year. The cash burn increased in Q4 due to the cost of restructuring the business, the exit of the German Stade facility and the reengagement of development activities around the two key products reported above. Q3 includes the benefit of R&D tax credit receipts in both financial years. At the year end, the Company had placed £11m in a 95 day notice account to maximise interest receivable. Due to the notice period, this £11m is classed as short term investment in the financial information. References to cash in this report includes these short term investments and this is different to how it is reported in the financial information.
A summary of the FY25 cash flows are as follows:
|
|
2025 £m |
2024 £m |
2023 £m |
|
Net Loss Before Tax |
(25.4) |
(19.3) |
(19.6) |
|
Non-cash items |
12.4 |
4.0 |
2.4 |
|
R&D Credits Received |
1.6 |
2.7 |
3.9 |
|
Changes in Working Capital |
(0.5) |
(6.3) |
0.2 |
|
Cash used in Operations |
(11.9) |
(18.9) |
(13.1) |
|
Investing Activities |
(3.5) |
(7.7) |
(1.2) |
|
Financing Activities (net of costs) |
25.3 |
14.6 |
1.5 |
|
Cash Movement in the Year |
9.9 |
(12.0) |
(12.8) |
|
Opening Cash |
15.4 |
27.4 |
40.2 |
|
Closing Cash |
25.3 |
15.4 |
27.4 |
A summary of non-cash items are as follows:
|
|
2025 £m |
2024 £m |
2023 £m |
|
Share Based Payment |
£2.0m |
£1.5m |
£0.8m |
|
Depreciation / Amortisation / Loss on Disposal |
£4.4m |
£2.5m |
£1.7m |
|
Stock Provision / Write Off |
£2.6m |
- |
- |
|
Provision for Expected Credit Losses |
£2.9m |
- |
- |
|
Staff costs paid in Equity |
£0.5m |
- |
- |
|
Consideration in kind |
- |
- |
(£0.1m) |
|
|
£12.4m |
£4.0m |
£2.4m |
Going Concern
The Directors have prepared and reviewed forecasts for the period ending February 2027 which they consider to be the appropriate period for assessing going concern. Whilst events and conditions beyond this period of assessment have been considered. In the judgement of the directors, such events and conditions do not require an extension to the period of assessment.
The base case forecast predominantly includes the continuation of the development of the Hy-5 ammonia cracker and the next generation of Fuel Cell products together with their associated costs and the fixed running costs of the business offset by a moderate volume of equipment and gas sales from the products developed. The sales commence in September 2026 and ramp steadily. In this base case scenario, the forecasts show that the business has sufficient resources throughout the assessment period.
As with prior years, the Directors have applied sensitivities to the above base case when considering their opinion on going concern. The sensitivities considered were:
· A 50% reduction in sales volumes
· A 6-month slippage in project delivery
· The timing and quantum of expected R&D tax credits
These sensitivities have been applied without any management action and the Directors have the ability to control the cost base as well as slow down the pace of development in order to preserve cash if one or more of the scenarios became a reality.
Given the outcome of the assessment above, the directors have a reasonable expectation that the Company has adequate resources to continue in operational existence for the foreseeable future, being the period to 28 February 2027. Accordingly, the directors continue to adopt the going concern basis of preparation in this financial information.
Longer Term Assessment
Considering the maturity of the organisation and the fact that the business is transitioning from a R&D led company to one which is commercially viable, the Directors have prepared forecasts which extend beyond the going concern assessment period. The longer term forecasts (beyond the assessment period) show that the business will require a sizable increase in revenue (delivering sustainable commercial revenues in excess of total costs) or additional funding through debt or a further fundraise in order to be able to continue to trade in the medium term (second half of calendar year 2027).
Whilst the Directors recognise the challenges of fundraising in the current economic climate, they are confident that when the Company chooses to seek additional funding that it will be available. This view is based on:
· A track record of being able to raise funds in the current economic climate (£27.5m raised in July 2025);
· The new product road map delivering an end to end solution at a comparable cost to the incumbent diesel technology in FY26;
· UK Government requirement for construction tenders to include a non-diesel solutions for onsite electricity generation on projects such as HS2 and the Lower Thames Crossing;
· Commercial and technical validation of our products through the JDA partnerships delivered in FY25; and
· Deployments of the current generator fleet through our Joint Venture partner Speedy Hire
The Directors acknowledge the requirement to create a commercially viable business as quickly as possible, with the recent strategy refresh having this objective at its core.
For the year ended 31 October 2025
|
|
|
|
|
Year Ended 31 October 2025 |
|
Year Ended 31 October 2024 |
||
|
|
|
Note |
|
£000 |
|
£000 |
||
|
|
|
|
|
|
|
|
|
|
|
Revenue from customer contracts |
|
5 |
|
125 |
|
4,002 |
|
|
|
Cost of sales |
|
|
|
(232) |
|
(5,868) |
|
|
|
Gross loss |
|
|
|
(107) |
|
(1,866) |
|
|
|
|
|
|
|
|
|
|
|
|
|
Other income |
|
6 |
|
294 |
|
429 |
|
|
|
Expected Credit Losses |
|
19 |
|
(2,937) |
|
- |
|
|
|
Operating costs |
|
7 |
|
(22,851) |
|
(18,133) |
|
|
|
Operating loss |
|
|
|
(25,601) |
|
(19,570) |
|
|
|
|
|
|
|
|
|
|
|
|
|
Finance income |
|
11 |
|
213 |
|
316 |
|
|
|
Finance costs |
|
11 |
|
(66) |
|
(55) |
|
|
|
Loss before tax |
|
|
|
(25,454) |
|
(19,309) |
|
|
|
Taxation |
|
12 |
|
3,259 |
|
1,890 |
|
|
|
Loss for the financial year and total comprehensive loss attributable to the owners of the company |
|
|
|
(22,195) |
|
(17,419) |
|
|
|
|
|
|
|
|
|
|
|
|
|
Basic loss per share (pence) |
|
13 |
|
(2.41) |
|
(2.22) |
|
|
|
Diluted loss per share (pence) |
|
13 |
|
(2.41) |
|
(2.22) |
|
|
All amounts relate to continuing operations. There was no other comprehensive income in the year (2024: £nil).
Statement of financial position
As at 31 October 2025
|
|
|
|
|
31 October 2025 |
|
31 October 2024 |
|||
|
|
|
Note |
|
£000 |
|
£000 |
|||
|
Assets |
|
|
|
|
|
|
|||
|
Non-current assets |
|
|
|
|
|
|
|||
|
Intangible assets |
|
14 |
|
8,738 |
|
4,626 |
|
||
|
Right-of-use assets |
|
15 |
|
175 |
|
646 |
|
||
|
Investment in joint venture |
|
16 |
|
625 |
|
625 |
|
||
|
Property, plant and equipment |
|
17 |
|
2,508 |
|
4,666 |
|
||
|
|
|
|
|
12,046 |
|
10,563 |
|
||
|
Current assets |
|
|
|
|
|
|
|
||
|
Inventory |
|
18 |
|
- |
|
1,948 |
|
||
|
Trade and other receivables |
|
19 |
|
1,923 |
|
6,737 |
|
||
|
Income tax receivable |
|
|
|
3,159 |
|
1,517 |
|
||
|
Restricted cash |
|
|
|
- |
|
433 |
|
||
|
Short term investments |
|
20 |
|
11,000 |
|
- |
|
||
|
Cash and cash equivalents |
|
20 |
|
14,317 |
|
15,374 |
|
||
|
|
|
|
|
30,399
|
|
26,009 |
|
||
|
Total assets |
|
|
|
42,445 |
|
36,572 |
|
||
|
Current liabilities |
|
|
|
|
|
|
|
||
|
Trade and other payables |
|
21 |
|
5,630 |
|
4,955 |
|
||
|
Asset finance |
|
|
|
63 |
|
- |
|
||
|
Lease liabilities |
|
22 |
|
141 |
|
505 |
|
||
|
Provisions |
|
23 |
|
96 |
|
217 |
|
||
|
|
|
|
|
5,930 |
|
5,677 |
|
||
|
Non-current liabilities |
|
|
|
|
|
|
|
||
|
Lease liabilities |
|
22 |
|
19 |
|
159 |
|
||
|
Asset finance |
|
|
|
62 |
|
|
|
||
|
Provisions |
|
23 |
|
39 |
|
468 |
|
||
|
|
|
|
|
120 |
|
627 |
|
||
|
Total liabilities |
|
|
|
6,050 |
|
6,304 |
|
||
|
Capital and reserves attributable to the owners of the company |
|
|
|
|
|
|
|
||
|
Share capital |
|
24 |
|
1,131 |
|
854 |
|
||
|
Share premium |
|
24 |
|
159,046 |
|
133,555 |
|
||
|
Other reserve |
|
|
|
7,054 |
|
4,629 |
|
||
|
Retained loss |
|
|
|
(130,836) |
|
(108,770) |
|
||
|
Total equity attributable to shareholders |
|
|
|
36,395 |
|
30,268 |
|
||
|
Total equity and liabilities |
|
|
|
42,445 |
|
36,572 |
|
||
 Statement of changes in equity
For the year ended 31 October 2025
|
|
|
Share capital |
|
Share premium |
|
Other reserve |
|
Retained loss |
|
Total |
|
||||||||||||||
|
|
|
£000 |
|
£000 |
|
£000 |
|
£000 |
|
£000 |
|
||||||||||||||
|
Balance at 1 November 2023 |
|
746 |
|
118,520 |
|
3,779 |
|
(91,960) |
|
31,085 |
|
||||||||||||||
|
|
|
|
|
|
|
|
|
|
|
|
|
||||||||||||||
|
Loss after tax for the year |
|
- |
|
- |
|
- |
|
(17,419) |
|
(17,419) |
|
||||||||||||||
|
Issue of equity shares |
|
105 |
|
14,810 |
|
- |
|
- |
|
14,915 |
|
||||||||||||||
|
Equity-settled share-based payments |
|
|
|
|
|
|
|
|
|
|
|
||||||||||||||
|
- Lapsed or exercised in the year |
|
3 |
|
225 |
|
(609) |
|
609 |
|
228 |
|
||||||||||||||
|
- Charged in the year |
|
- |
|
- |
|
1,459 |
|
- |
|
1,459 |
|
||||||||||||||
|
Balance at 31 October 2024 |
|
854 |
|
133,555 |
|
4,629 |
|
(108,770) |
|
30,268 |
|
||||||||||||||
|
|
|
|
|
|
|
|
|
|
|
|
|
||||||||||||||
|
Loss after tax for the year |
|
- |
|
- |
|
- |
|
(22,195) |
|
(22,195) |
|
||||||||||||||
|
Issue of equity shares |
|
275 |
|
25,491 |
|
- |
|
- |
|
25,766 |
|
||||||||||||||
|
Equity-settled share-based payments |
|
|
|
|
|
|
|
|
|
|
|
||||||||||||||
|
- Equity settled renumeration |
|
- |
|
- |
|
557 |
|
- |
|
557 |
|||||||||||||||
|
- Exercised in the year |
|
2 |
|
- |
|
- |
|
- |
|
2
|
|||||||||||||||
|
- Lapsed in the year |
|
- |
|
- |
|
(129) |
|
129 |
|
- |
|||||||||||||||
|
- Charged in the year |
|
- |
|
- |
|
1,997 |
|
- |
|
1,997 |
|||||||||||||||
|
Balance at 31 October 2025 |
|
1,131 |
|
159,046 |
|
7,054 |
|
(130,836) |
|
36,395 |
|
||||||||||||||
Share capital is the amount subscribed for shares at the nominal value.
Share premium represents the excess of the amount subscribed for share capital over the nominal value of these shares net of share issue expenses. The issue of shares above is presented net of issue cost (refer to Note 24 for further details on issue costs).
Other reserve represents the charge to equity in respect of unexercised equity-settled share-based payments and warrants granted.
Retained loss represents the cumulative loss of the Company attributable to equity shareholders of the parent company.
Cash flow statement for the year ended 31 October 2025
|
|
|
|
|
Year ended 31 October 2025 |
|
Year ended 31 October 2024 |
|
|
|
Note |
|
£000 |
|
£000 |
|
Cash flows from operating activities |
|
|
|
|
|
|
|
Loss before tax for the year |
|
|
|
(25,454) |
|
(19,309) |
|
Adjustments for: |
|
|
|
|
|
|
|
Amortisation of intangible assets |
|
14 |
|
1,049 |
|
81 |
|
Depreciation of right-of-use assets |
|
15 |
|
471 |
|
470 |
|
Depreciation of property, plant and equipment |
|
17 |
|
2,728 |
|
2,043 |
|
Loss on disposal of property, plant and equipment |
|
17 |
|
145 |
|
- |
|
Share-based payments |
|
25 |
|
1,997 |
|
1,459 |
|
Staff costs settled in equity |
|
|
|
558 |
|
- |
|
Finance income |
|
|
|
(213) |
|
(316) |
|
Lease finance charges |
|
|
|
29 |
|
41 |
|
Inventory write down |
|
|
|
2,573 |
|
- |
|
Movement in expected credit losses |
|
7 |
|
2,937 |
|
- |
|
Income recognised on government grants |
|
|
|
(45) |
|
- |
|
R&D tax credits receivable |
|
|
|
- |
|
(224) |
|
Working capital changes: |
|
|
|
|
|
|
|
Decrease in restricted cash |
|
|
|
434 |
|
(176) |
|
(Increase) in inventory |
|
|
|
(625) |
|
(1,770) |
|
Decrease in receivables |
|
|
|
1,860 |
|
(5,506) |
|
(Decrease) in payables |
|
|
|
(1,133) |
|
1,227 |
|
(Increase) in provisions |
|
|
|
(550) |
|
384 |
|
|
|
|
|
(13,239) |
|
(21,596) |
|
R&D tax credits received |
|
|
|
1,616 |
|
2,685 |
|
Net cash flows from operating activities |
|
|
|
(11,623) |
|
(18,911) |
|
Capital investment in joint venture |
|
16 |
|
- |
|
(625) |
|
Purchase of plant and equipment |
|
17 |
|
(724) |
|
(2,952) |
|
Government Grant received |
|
|
|
1,871 |
|
|
|
Additions to intangible assets |
|
14 |
|
(5,160) |
|
(4,443) |
|
Term Deposits |
|
26 |
|
(11,000) |
|
- |
|
Interest received |
|
11 |
|
213 |
|
316 |
|
Net cash flows used in investing activities |
|
|
|
(14,800) |
|
(7,704) |
|
Proceeds from the issue of share capital |
|
|
|
27,473 |
|
15,792 |
|
Proceeds from the exercise of options |
|
|
|
2 |
|
228 |
|
Asset finance |
|
|
|
125 |
|
- |
|
Cost of issue of share capital |
|
24 |
|
(1,707) |
|
(877) |
|
Lease finance Charge |
|
|
|
(29) |
|
(41) |
|
Lease payments |
|
22 |
|
(498) |
|
(520) |
|
Net cash flows from financing activities |
|
|
|
25,366 |
|
14,623 |
|
Net increase/(decrease) in cash and cash equivalents |
|
|
|
(1,057) |
|
(11,992) |
|
Cash and cash equivalents at the start of the year |
|
|
|
15,374 |
|
27,366 |
|
Cash and cash equivalents at the end of the year |
|
20 |
|
14,317 |
|
15,374 |
|
|
|
|
|
|
|
|
Notes forming part of the financial information
1. Corporate information
AFC Energy Plc (the Company) is a public limited company incorporated in England & Wales. The address of the registered office is Unit 68.3, Dunsfold Park, Cranleigh, Surrey, GU6 8TB. The Company is quoted on the AIM Market of the London Stock Exchange with the ticker symbol LSE: AFC.
The principal activity of the Company is the development and manufacturing of fuel cells and development of fuel processing technology and equipment.
2. Accounting policies
Accounting convention
The final results for the year ended 31 October 2025 were approved by the Board of Directors on 24 February 2026. The final results do not constitute full accounts within the meaning of section 434 of the Companies Act 2006 but are derived from audited financial information for the year ended 31 October 2025 and the year ended 31 October 2024. This announcement is prepared on the same basis as set out in the audited statutory accounts for the year ended 31 October 2025. The accounts for the years ended 31 October 2025 and 31 October 2024, upon which the auditors issued unqualified opinions, also had no statement under section 498(2) or (3) of the Companies Act 2006. While the financial information included in this results announcement has been prepared in accordance with the recognition and measurement criteria of UK adopted international accounting standards (IFRS), this announcement does not in itself contain sufficient information to comply with IFRS.
The Company has taken advantage of the exemption under Section 402 of the Companies Act 2006, which allows a parent company not to prepare consolidated financial information where its subsidiaries are immaterial both individually and in aggregate.
The Directors have assessed the size, nature, and financial impact of the company's subsidiaries and have concluded that they are immaterial for the purpose of presenting a true and fair view of the company's financial position. Accordingly, the company has not prepared consolidated financial information and instead has prepared individual financial information in accordance with applicable accounting standards.
The company accounts for its investment in joint ventures at cost in accordance with IAS 27 Separate Financial Statements. For further details refer to the accounting policy note below.
This financial information is prepared in pounds sterling and rounded to the nearest thousand.
Going concern
The Directors have prepared and reviewed forecasts for the period ending February 2027 which they consider to be the appropriate period for assessing going concern. Whilst events and conditions beyond this period of assessment have been considered. In the judgement of the directors, such events and conditions do not require an extension to the period of assessment. Longer-term factors are included in the Financial Review section within the Strategic report.
The base case forecast predominantly includes the continuation of the development of the HY-5 ammonia cracker and the next generation of Fuel Cell products together with their associated costs and the fixed running costs of the business offset by a moderate volume of equipment and gas sales from the products developed. The sales commence in September 2026 and ramp steadily. In this base case scenario, the forecasts show that the business has sufficient resources throughout the assessment period.
As with prior years, the Directors have applied sensitivities to the above base case when considering their opinion on going concern. The sensitivities considered were:
• A 50% reduction in sales volumes
• A 6-month slippage in project delivery
• The timing and quantum of expected R&D tax credits
These sensitivities have been applied without any management action and the Directors have the ability to control the cost base as well as slow down the pace of development in order to preserve cash if one or more of the scenarios became a reality.
Given the outcome of the assessment above, the directors have a reasonable expectation that the Company has adequate resources to continue in operational existence for the foreseeable future, being the period to 28 February 2027. Accordingly, the directors continue to adopt the going concern basis of preparation in this financial information.
Standards, amendments, and interpretations to published standards not yet effective.
The following amendments to International Financial Reporting Standards (IFRS), issued by the International Accounting Standards Board (IASB) and endorsed by the UK, are effective for annual periods beginning on or after 1 November 2024. The Company has adopted these amendments from 1 November 2024, where applicable, and their adoption has not had a material impact on the Company's results, financial position, or disclosures:
· IAS 1 (amended) - Classification of Liabilities as Current or Non-current; Non-current Liabilities with Covenants: Amends the requirements for classifying liabilities as current or non-current and introduces new disclosure requirements for covenants (IAS 1.69-76, 76ZA-76ZB).
· IFRS 16 (amended) - Lease Liability in a Sale and Leaseback: Amends the measurement requirements for lease liabilities arising in sale and leaseback transactions (IFRS 16.100A-100B).
· IAS 7 and IFRS 7 (amended) - Supplier Finance Arrangements: Introduces new disclosure requirements for supplier finance arrangements (IAS 7.44F-44I, IFRS 7.39A-39C).
The following standard and amendments issued by the IASB have been endorsed by the UK and have not been adopted by the Company. The Company intends to adopt these new and amended standards and interpretations, if applicable, when they become effective:
· IAS 21 (amended) - Lack of Exchangeability: Provides guidance on how to determine the spot exchange rate when exchangeability between two currencies is lacking (IAS 21.8A-8D), effective for annual periods beginning on or after 1 January 2025.
· IFRS 18 - Presentation and Disclosure in Financial Statements: A new standard replacing IAS 1, effective for annual periods beginning on or after 1 January 2027.
· IFRS 19 - Subsidiaries without Public Accountability: Disclosures: Provides reduced disclosure requirements for eligible subsidiaries, effective for annual periods beginning on or after 1 January 2027.
· Amendments to IFRS 9 and IFRS 7 - Classification and Measurement of Financial Instruments: Amendments relating to financial assets with ESG-linked features and settlement of financial liabilities by electronic payments, effective for annual periods beginning on or after 1 January 2026
Capital policy.
The Company manages its equity as capital. Equity comprises the items detailed within the principal accounting policy for equity and financial details can be found in the statement of financial position. The Company adheres to the capital maintenance requirements as set out in the Companies Act 2006.
Revenue recognition
Revenue is recognised in accordance with IFRS 15 using the following five-step model:
· Identify the contract with a customer
· Identify performance obligations
· Determine the transaction price
· Allocate the transaction price to performance obligations
· Recognise revenue as performance obligations are satisfied
Revenue arises from:
· Sale of goods and parts
· Sale of services and maintenance
· Short-term rental contracts
Contracts are assessed to determine whether performance obligations are satisfied at a point in time or over time:
· Point in time: Standard product sales are recognised when control transfers to the customer, typically at factory or site acceptance.
· Over time: Customised products, rentals, and long-term service agreements are recognised based on progress toward completion, using input or output methods as appropriate.
Consideration received in advance of performance is recorded as deferred revenue; conversely, performance ahead of consideration is recorded as a contract asset.
Government grants
Government grants are recognised where there is reasonable assurance that the grant will be received and all attached conditions will be complied with. When the grant relates to an expense item, it is recognised as income on a systematic basis over the periods that the related costs, for which it is intended to compensate, are expensed. The company presents grants related to an expense item as other operating income in the statement of comprehensive income.
When the grant relates to an asset, it is recognised as other operating income in equal amounts over the expected useful life of the related asset.
Foreign currency
The financial information of the Company is presented in the currency of the primary economic environment in which it operates (the functional currency) which is pounds sterling. In accordance with IAS 21, transactions entered by the Company in a currency other than the functional currency are recorded at the rates ruling when the transactions occur.
At each Statement of Financial Position date, monetary items denominated in foreign currencies are retranslated at the rates prevailing at the date of the Statement of Financial Position.
Inventory
Inventory is recorded at the lower of actual cost and net realisable value, applying the average cost methodology.
Work in progress comprises direct labour, direct materials, and direct overheads. Direct labour is allocated on an input basis that reflects the consumption of those resources in the production process.
Cash and cash equivalents
For the purpose of the statement of cash flows, cash and cash equivalents comprise cash balances and bank overdrafts that form an integral part of the Company's cash management process. They are recorded in the statement of financial position and valued at amortised cost.
Restricted cash represents bank deposit accounts where disbursement is dependent upon certain contractual performance conditions.
Term deposits
Term deposits with original maturities exceeding three months are not classified as cash and cash equivalents under IAS 7. These instruments are instead recognised as short‑term investments (or financial assets), with their carrying amount based on amortised cost. Any interest income is accrued and recognised in profit or loss over the deposit period, consistent with the effective interest method.
Other receivables
These assets are initially recognised at fair value and are subsequently measured at amortised cost less any provision for impairment.
Property, plant, and equipment
Property and equipment are stated at cost less any subsequent accumulated depreciation and impairment losses. Where parts of an item of property and equipment have different useful lives, they are accounted for as separate items of property and equipment.
Depreciation is charged to the statement of comprehensive income within cost of sales and/or operating expenses on a straight-line basis over the estimated useful lives of each part of an item of plant, machinery, and equipment. Depreciation of the assets commences when the assets are available for use. The estimated useful lives are as follows:
|
Decommissioning asset |
Life of the contract |
|
|
Leasehold improvements |
Life of the lease |
|
|
Plant, machinery and equipment |
3 to 10 years |
|
|
|
|
|
Expenses incurred in respect of the maintenance and repair of property and equipment are charged against income when incurred. Refurbishment and improvement expenditure, where the benefit is expected to be long lasting, is capitalised as part of the appropriate asset.
The useful economic lives of tangible fixed assets are reviewed annually, and any revision is accounted for as a change in accounting estimate and the net book value of the asset, at the time of the revision, is depreciated over the remaining revised economic life of the asset.
Right-of-use assets
At inception each contract is assessed as to whether it conveys the right to control the use of an identified asset and obtain substantially all the economic benefits from the use of that asset, for a period in exchange for consideration. If so, the contract should be accounted for as a lease and the Company should recognise a right-of-use asset, and related lease liability, at the lease commencement date.
The right-of-use assets comprise the corresponding lease liability, lease payments made before the commencement date, less any lease incentives received and any initial direct costs. They are subsequently measured at cost less accumulated depreciation and impairment losses. The lease liability is initially measured at the present value of the lease payments and discounted using the interest rate implicit in the lease or, if that rate cannot be determined, the incremental borrowing rate is used. The lease liability continues to be measured at amortised cost using the effective interest method. It is remeasured when there is a change in the future lease payments. When the lease liability is remeasured in this way, a corresponding adjustment is made to the carrying amount of the right-of-use asset.
At lease commencement date, a right-of-use and lease liability are recognised on the statement of financial position. The right-of-use asset is measured at cost, which comprises the initial measurement of the lease liability, any initial direct costs incurred, an estimate of costs to dismantle and remove the asset at the end of the lease term and any lease payments made in advance of the lease commencement date.
Lease payments included in the measurement of the lease liability are made up of fixed payments (including in-substance fixed), variable payments based on an index or rate, amounts expected to be payable under a residual value guarantee and payments arising from options reasonably certain to be exercised.
After initial measurement, the liability will be reduced for payments made and increased for interest. It is remeasured to reflect any reassessment or modification, or if there are changes to in-substance payments. Interest expense is recognised in finance costs in the statement of comprehensive income.
Right-of-use assets are depreciated on a straight-line basis over the shorter of the lease term and the estimated useful lives of the assets. The depreciation expense is recognised within operating costs or cost of sales depending on the nature of the underlying asset.
When the lease liability is remeasured, the corresponding adjustment is reflected in the right-of-use asset, or profit and loss if the right-of-use asset is already reduced to zero.
Short-term leases and low value assets are accounted for using the practical expedients set out in IFRS 16 and the payments are recognised as an expense in profit or loss on a straight-line basis over the lease term.
The Company has elected not to recognise right-of-use assets and lease liabilities for leases of less than 12-months and leases of low value assets. These largely relate to short-term rentals of equipment. The lease payments associated with these leases are expensed on a straight-line basis over the lease term.
Intangible assets
The useful economic lives of intangible fixed assets are reviewed annually, and any revision is accounted for as a change in accounting estimate and the net book value of the asset, at the time of the revision, is amortised over the remaining revised economic life of the asset. Amortisation only commences when the asset is available for use.
Development costs
Development expenditures on an individual project are recognised as an intangible asset when the Company can demonstrate:
· The technical feasibility of completing the intangible asset so that the asset will be available for use or sale
· Its intention to complete and its ability and intention to use or sell the asset
· How the asset will generate future economic benefits
· The availability of resources to complete the asset
· The ability to measure reliably the expenditure during development
Following initial recognition of the development expenditure as an asset, the asset is carried at cost less any accumulated amortisation and accumulated impairment losses. Amortisation of the asset begins when development is complete with key objectives achieved as intended by management, and the asset is available for use. It is amortised over the period of expected future benefit. The amortised period is agreed by management and the Technical Advisory board.
The following periods are used:
Capitalised Development Costs 3 to 5 years
Amortisation is recorded in operating costs. During the period of development, the asset is assessed for impairment annually.
Research costs are expensed as incurred.
Patent, commercial rights and trade marks
Intangible assets that are acquired by the Company are stated at cost less accumulated amortisation and impairment losses. Amortisation of intangible assets is charged using the straight-line method to operating expenses over the following periods:
|
Patents |
5 to 20 years |
|
Commercial rights |
5 years |
|
Trade marks |
5 years |
Investment in joint ventures
The Company holds 50% interest in a joint venture, Speedy Hydrogen Services Limited.
A joint venture is a type of joint arrangement whereby the parties that have joint control of the arrangement have rights to the net assets of the joint venture. Joint control is the contractually agreed sharing of control of an arrangement, which exists only when decisions about the relevant activities require the unanimous consent of the parties sharing control.
The Company's investment in its joint venture is initially recognised at cost, including directly attributable transaction costs. Subsequently, the carrying amount is adjusted for any impairment losses, if applicable. The Company assesses the investment for impairment whenever events or changes in circumstances indicate that the carrying amount may not be recoverable.
Impairment testing of intangible assets and property, plant, and equipment
At each statement of financial position date, the carrying amounts of the assets are reviewed to determine whether there is any indication that those assets have suffered an impairment loss. If any such indication exists, the recoverable amount of the asset is estimated to determine the extent of the impairment loss (if any). In assessing whether an impairment is required, the carrying value of the asset is compared with its recoverable amount. The recoverable amount is the higher of the fair value less costs of disposal (FVLCD) and value in use (VIU).
Financial instruments
Financial instruments are measured on initial recognition at fair value, plus, in the case of financial instruments other than those classified as fair value through profit or loss (FVTPL), directly attributable transaction costs. Receivables are initially recognised at transaction price. Financial instruments are recognised when the Company becomes a party to the contracts that give rise to them and are classified as amortised cost, fair value through profit or loss or fair value through other comprehensive income, as appropriate. The Company considers whether a contract contains an embedded derivative when the entity first becomes a party to it. The embedded derivatives are separated from the host contract if the host contract is not measured at fair value through profit or loss and when the economic characteristics and risks are not closely related to those of the host contract. Reassessment only occurs if there is a change in the terms of the contract that significantly modifies the cash flows that would otherwise be required.
In the periods presented the Company does not have any financial assets categorised as FVTPL or FVOCI.
Financial assets at amortised cost
A financial asset is measured at amortised cost if it is held within a business model whose objective is to hold assets to collect contractual cash flows and its contractual terms give rise on specified dates to cash flows that are solely payments of principal and interest on the principal amount outstanding and is not designated as FVTPL. Financial assets classified as amortised cost are measured after initial recognition at amortised cost using the effective interest method, less any provision for impairment Cash, restricted cash, trade receivables, and certain other assets are classified as, and measured at, amortised cost.
Financial liabilities
Financial liabilities are classified as measured at amortised cost or FVTPL. A financial liability is classified as at FVTPL if it is classified as held-for-trading, it is a derivative or it is designated as such on initial recognition. Financial liabilities at FVTPL are measured at fair value and net gains and losses, including any interest expense, are recognised in profit or loss.
Other financial liabilities are subsequently measured at amortised cost using the effective interest method. Gains and losses are recognised in net earnings when the liabilities are derecognised as well as through the amortisation process. Borrowing liabilities are classified as current liabilities unless the Company has an unconditional right to defer settlement of the liability for at least 12 months after the statement of financial position date. Accounts payable and accrued liabilities and lease liabilities are classified as, and measured at, amortised cost.
Impairment of financial assets
A loss allowance for expected credit losses is recognised in the Statement of Comprehensive Income for financial assets measured at amortised cost. At each year end date, on a forward-looking basis, the Company assesses the expected credit losses associated with its financial assets (such as trade receivables) carried at amortised cost.
The expected loss rates are based on the historical credit losses adjusted to reflect current and forward-looking information on economic factors affecting the ability of the customers to settle the receivables.
The impairment methodology applied depends on whether there has been a significant increase in credit risk. The expected credit losses are required to be measured through a loss allowance at an amount equal to the 12-month expected credit losses (expected credit losses that result from those default events on the financial instrument that are possible within 12 months after the reporting date), or full lifetime expected credit losses (expected credit losses that result from all possible default events over the life of the financial instrument). A loss allowance for full lifetime expected credit losses is required for a financial instrument if the credit risk of that financial instrument has increased significantly since initial recognition.
Derecognition of financial assets and liabilities
A financial asset is derecognised when either the rights to receive cash flows from the asset have expired or the Company has transferred its rights to receive cash flows from the asset or has assumed an obligation to pay the received cash flows in full without material delay to a third party. If neither the rights to receive cash flows from the asset have expired nor the Company has transferred its rights to receive cash flows from the asset, the Company will assess whether it has relinquished control of the asset or not. If the Company does not control the asset, then derecognition is appropriate. A financial liability is derecognised when the associated obligation is discharged, cancelled, or expires.
When an existing financial liability is replaced by another from the same lender on substantially different terms, or the terms of an existing liability are substantially modified, such an exchange or modification is treated as the derecognition of the original liability and the recognition of a new liability. The difference in the respective carrying amounts is recognised in the statement of Comprehensive Income.
Share-based payment transactions
The fair value of options granted under the Employee Share Option Plan, the Employee Performance Share Plan and the Save-As-You-Earn scheme are recognised as an employee benefits expense, with a corresponding increase in equity. The total amount to be expensed is determined by reference to the fair value of the options granted:
* Including any market performance conditions (e.g., the Company's share price)
* Excluding the impact of any service and non-market performance vesting conditions (e.g., profitability, sales growth targets and remaining an employee for a specified time)
* Including the impact of any non-vesting conditions (e.g., the requirement for employees to save or hold shares for a specific period)
The total expense is recognised over the vesting period, which is the period over which all the specified vesting conditions are to be satisfied. At the end of each period, the entity revises its estimates of the number of options that are expected to vest based on the non-market vesting and service conditions. It recognises the impact of the revision to original estimates, if any, in profit or loss, with a corresponding adjustment to equity.
Modifications after the vesting date to terms and conditions of equity-based payments which increase the fair value are recognised over the remaining vesting period. If the fair value of the revised equity-based payments is less than the original valuation, then the original valuation is expensed as if the modification never occurred.
The fair value of warrants issued is also recognised as a share-based payment expense with a corresponding increase in equity.
Provisions
General
Provisions are recognised when the Company has a present obligation because of a past event and it is probable that the Company will be required to settle the obligation. Provisions are measured at the present value of management's best estimate of the expenditure required to settle the present obligation at the statement of financial position date and are discounted to present value where the effect is material.
Warranty provisions
Warranty provisions are recognised for the estimated liability to repair or replace products under warranty at the time revenue is recognised. The provision is an estimate calculated based on most likely serviceable component to wear out at modular and generator level, level of volumes, product mix and repair and replacement cost.
Decommissioning liability
The Company records a provision for decommissioning costs to remediate the environmental damage of a manufacturing facility for supply of hydrogen fuel. Decommissioning costs are provided for at the present value of expected costs to settle the obligation using estimated cash flows and are recognised as part of the cost of the relevant asset. The cash flows are discounted at a current pre-tax rate that reflects the risks specific to the decommissioning liability. The unwinding of the discount, where material, is expensed as incurred and recognised in the statement of profit or loss as a finance cost. The estimated future costs of decommissioning are reviewed annually and adjusted as appropriate.
Taxation
Tax on the profit or loss for the year comprises current and deferred tax. Tax is recognised in the statement of comprehensive income except to the extent that it relates to items recognised directly in equity, in which case it is recognised in equity.
Tax due for the current and prior periods is recognised as a liability, to the extent that it has not yet been settled, and as an asset if the amounts already paid exceed the amount due. The benefit of a tax loss which can be carried back to recover current tax of a prior period is recognised as an asset.
Current tax assets and liabilities are measured at the amount expected to be paid to/ recovered from taxation authorities, using the rates/laws that have been enacted or substantively enacted by the balance sheet date.
A deferred tax asset is recognised for deductible temporary differences, unused tax losses and unused tax credits to the extent that it is probable that taxable profit will be available against which the deductible temporary differences can be utilised, unless the deferred tax asset arises from the initial recognition of an asset or liability other than in a business combination which, at the time of the transaction, does not affect accounting profit or taxable profit.
The carrying amount of deferred tax assets are reviewed at the end of each reporting period and reduced to the extent that it is no longer probable that sufficient taxable profit will be available to allow the benefit of part or all of that deferred tax asset to be utilised. Any such reduction is subsequently reversed to the extent that it becomes probable that sufficient taxable profit will be available.
A deferred tax asset is recognised for an unused tax loss carry forward or unused tax credit if, and only if, it is considered probable that there will be sufficient future taxable profit against which the loss or credit carry forward can be utilised.
R&D tax credits
For accounting periods beginning on or after 1 April 2024, the UK government has merged the previous SME R&D Tax Relief Scheme and the Research & Development Expenditure Credit (RDEC) Scheme into a single R&D Expenditure Credit (RDEC) regime, with the exception of loss-making, R&D intensive SMEs who may claim under the Enhanced R&D Intensive Support (ERIS) regime (Finance Act 2024).
If the Company qualifies for the Enhanced R&D Intensive Support (ERIS) scheme under the merged R&D regime. In accordance with IAS 12 Income Taxes, all R&D tax credits are treated as income tax items. The credits are recognised within the taxation line in the statement of comprehensive income, reflecting their nature as refundable tax credits.
The Company will continue to monitor developments in R&D tax relief legislation and guidance and will update its accounting policy as required to ensure compliance with the latest standards and HMRC requirements.
Pension contributions
The Company operates a defined contribution pension scheme which is open to all employees and makes monthly employer contributions to the scheme in respect of employees who join the scheme. These employer contributions are capped at 5% of the employee's salary and are reflected in the statement of comprehensive income in the period for which they are made.
The amount recognised in the period is the contribution payable in exchange for services rendered by employees during the period.
3. Critical accounting judgments and key sources of estimation uncertainty
In the preparation of the financial information, management makes certain judgments and estimates that impact the financial information. While these judgments are continually reviewed, the facts and circumstances underlying these judgments may change, resulting in a change to the estimates that could impact the results of the Company. In particular:
Critical accounting judgments
The following are the judgments made by management in applying the accounting policies of the Company that have the most significant effect on the financial information:
Capitalisation of development expenditure
The Company capitalises costs for product development projects. Such costs include non-recurring engineering, design costs, and prototype costs. Initial capitalisation of costs is based on management's judgement that technological and economic feasibility is confirmed, usually when a product development project has reached a defined milestone according to an established project management model. All development costs associated with the fuel cell cash generating (production) unit have been capitalised from the point of signing the Supply and Maintenance Agreement with Speedy Hydrogen Solutions (SHS) Limited on 14th November 2023. A key milestone for all liquid cooled fuel cell related projects was the signing of the exclusive distribution agreement with Tamgo group on 4th September 2023 and therefore all development costs, related to liquid-cooled projects incurred the year ended 31 October 2025 have been capitalised on projects related to this.
For the Fuel Processing Cash Generating Unit a key milestone event for establishing economic feasibility was the externally verified Hydrogen purity output, announced via RNS on 4th December 2023.
In determining the amounts to be capitalised, management makes assumptions regarding the expected future cash generation of the project and the expected period of benefits. At 31 October 2025, the carrying amount of capitalised development costs was £5,587,000 for fuel cell manufacturing technologies and £2,998,000 for fuel processing.
Identification of Cash Generating Units
The Company performs impairment assessments in accordance with IAS 36 Impairment of Assets. A critical area of judgement involves determining the appropriate Cash-Generating Units (CGUs) to which assets are allocated. CGUs represent the smallest identifiable group of assets that generates cash inflows largely independent of other assets or groups of assets. This assessment requires management to consider factors such as the interdependence of cash flows, the nature of products and services, and the level at which management monitors operations. The identification of CGUs can significantly affect the outcome of impairment testing, as recoverable amounts are determined at the CGU level. Changes in assumptions regarding CGU composition could lead to material differences in impairment results.
Key source of estimation uncertainty
Impairment review of capitalised development expenditure
Impairment exists when the carrying value of an asset or cash generating unit exceeds its recoverable amount, which is the higher of its fair value less costs of disposal and its value in use. The fair value less costs of disposal calculation is based on available data from brokers, assuming transactions conducted at arm's length, for similar assets or observable market prices less incremental costs of disposing of the asset.
Share-based payments
Certain employees (including Directors and senior Executives) of the Company receive remuneration in the form of share-based payment, whereby employees render services as consideration for equity instruments (equity-settled transactions).
The fair value is determined using either the Black-Scholes valuation model, Modified Binomial Tree model or a Monte Carlo model for market-based conditions. Both are appropriate for considering the effects of the vesting conditions, expected exercise period and the dividend policy of the Company.
The cost of equity-settled transactions is expensed, together with a corresponding increase in equity over the period the Directors expect the performance criteria will be fulfilled. For market performance criteria this estimate is made at the time of grant considering historic share price performance and volatility. For non-market-based performance criteria, an estimate is made at the time of grant and reviewed annually thereafter considering progress on the operational objectives set, plans and budgets.
The estimation uncertainty relating to share-based payments is not at risk of material change in future years other than in relation to management's estimate of the extent to which the non-market-based performance criteria will be met.
Expected credit losses on debtor balances
The company exercised significant judgement in assessing the recoverability of a material receivable due from a related party. In accordance with IFRS 9 Financial Instruments, management evaluates expected credit losses ("ECL") using forward‑looking information, including the counterparty's financial position, forecast cash flows and the probability of default. During the year, indicators of impairment arose relating to the related party's ability to settle the balance, resulting in the recognition of a full write‑off of the debtor. The determination of the ECL involved significant estimation uncertainty due to the inherent difficulty in assessing the counterparty's future financial capacity and the absence of observable market data. As required by IAS 1 Presentation of Financial Statements, this judgement is disclosed due to its material effect on the financial information. Further details of the transaction are included in the related party disclosures.
4. Segmental analysis
Operating segments are determined by the chief operating decision maker based on the information used to allocate the company's resources. The information as presented to the internal management is consistent with the Statement of Comprehensive Income.
In the prior year financial information, it indicated that going forward, the Company may identify two operating segments. However, during the current financial year, AFC Energy restructured its leadership, moving from two Chief Technology Officers (CTOs) to one, and consolidated its R&D activities into a single team focused on hydrogen fuel cells and fuel conversion technologies combined. This reflects the company's strategic shift to a single, market-led focus.
In accordance with IFRS 8, as AFC Energy continues to operate as one reportable segment - therefore no further segmental disclosures are required.
5. Revenue
|
|
|
|
|
Year ended 31 October 2025 |
|
Year ended 31 October 2024 |
|
Revenue from contracts with customers |
|
|
|
£000 |
|
£000 |
|
Sales of fuel cell generators |
|
|
|
75 |
|
3,976 |
|
Rental revenue |
|
|
|
50 |
|
26 |
|
|
|
|
|
125 |
|
4,002 |
|
Being: |
|
|
|
|
|
|
|
Cash consideration |
|
|
|
125 |
|
4,002 |
|
Consideration in kind |
|
|
|
- |
|
- |
|
|
|
|
|
125
|
|
4,002 |
Four Customers customer A - B (FY24: one customer A) accounted for more than 10% of revenue:
|
|
|
Year ended 31 October 2025 |
|
Year ended 31 October 2024 |
||||
|
|
|
£000 |
|
% |
|
£000 |
|
% |
|
Customer A |
|
18 |
|
14 |
|
3,829 |
|
96 |
|
Customer B |
|
57 |
|
46 |
|
- |
|
- |
|
Customer C |
|
35 |
|
28 |
|
- |
|
- |
|
Customer D |
|
15 |
|
12 |
|
- |
|
- |
|
|
|
|
|
|
|
|
|
|
|
|
|
|
|
|
|
|
|
|
Unsatisfied performance obligations were:
|
|
|
Total |
|
Within one year |
|
Within two to five years |
|
|
|
£000 |
|
£000 |
|
£000 |
|
31 October 2024 |
|
1,571 |
|
148 |
|
1,423 |
|
31 October 2025 |
|
1,423 |
|
- |
|
1,423 |
The aggregate amount of the transaction price allocated to one contract that is not fully satisfied as of 31 October 2025 was £1,423,000 (2024: £1,571,000). This £1.4m deferred revenue is to be recognised over a three-year period from the date a commercial and fully certified product is available. The £1.4m deferred revenue liability is to be offset against each unit sold to the customer at a rate of £150,000 per unit, up to a maximum value of £1.5m.
6. Other income
|
|
|
|
|
Year ended 31 October 2025 |
|
Year ended 31 October 2024 |
|
|
|
|
|
£000 |
|
£000 |
|
Government grants income |
|
|
|
161 |
|
130 |
|
R&D expenditure credits |
|
|
|
- |
|
224 |
|
Other |
|
|
|
133 |
|
75 |
|
|
|
|
|
294 |
|
429 |
Other income includes unutilised provision released under IAS 37 relating to the release of decommissioning costs, fully settled in the year.
7. Operating costs
|
|
|
|
|
Year ended 2025 Total |
|
|
Year ended 2024 Total |
||||||
|
|
|
|
|
£000 |
|
|
£000 |
||||||
|
|
|
|
|
|
|
|
|
||||||
|
Materials |
|
|
|
1,643 |
|
|
1,685 |
||||||
|
|
|
|
|
1,643 |
|
|
1,685 |
||||||
|
|
|
|
|
|
|
|
|
||||||
|
Payroll costs |
|
|
|
|
|
|
|
||||||
|
Payroll (excluding Directors) |
|
|
|
6,136 |
|
|
6,746 |
||||||
|
Directors' costs |
|
|
|
1,910 |
|
|
1,526 |
||||||
|
Other employment costs |
|
|
|
577 |
|
|
865 |
||||||
|
|
|
|
|
8,621 |
|
|
9,137 |
||||||
|
|
|
|
|
|
|
|
|
||||||
|
Other administrative expenses |
|
|
|
|
|
|
|
||||||
|
Occupancy costs |
|
|
|
556 |
|
|
461 |
||||||
|
Other administrative expenses |
|
|
|
3,085 |
|
|
2,825 |
||||||
|
|
|
|
|
3,641 |
|
|
3,286 |
||||||
|
|
|
|
|
|
|
|
|
||||||
|
Non-cash costs |
|
|
|
|
|
|
|
||||||
|
Amortisation of intangible assets |
|
|
|
1,049 |
|
|
81 |
||||||
|
Depreciation of right-of-use assets |
|
|
|
471 |
|
|
470 |
||||||
|
Depreciation of Property, plant and equipment |
|
|
|
2,728 |
|
|
2,043 |
||||||
|
Loss on Disposal of PPE |
|
|
|
145 |
|
|
- |
||||||
|
Less depreciation of rental asset charged to cost of sales |
|
|
|
(18) |
|
|
(28) |
||||||
|
Inventory Write-down |
|
|
|
2,573 |
|
|
4 |
||||||
|
Share-based payments charge |
|
|
|
1,997 |
|
|
1,459 |
||||||
|
|
|
|
|
8,946 |
|
|
4,025 |
||||||
|
|
|
|
|
|
|
|
|
||||||
|
|
|
|
|
22,851 |
|
|
18,133 |
||||||
Research and development costs
The Company's fuel cells manufacturing and fuel processing research and development activities concentrate on the development of improved design, engineering, and prototype build. In 2025 the Company spent in total £11,702,000 (2024: £9,512,000) on research and development.
Research and development costs of £6,582,000 (2024: £5,108,000) that are not eligible for capitalisation have been expensed in the period incurred and recognised in operating expenses.
In 2025 development costs meeting the recognition criteria for capitalisation under IAS 38 Intangible Assets were £ 5,120,000 (2024: £4,403,000), (refer to note 14). Out of the total capitalised development costs, £2,662,000 relate to labour on development projects.
8. Auditor's remuneration
Fees paid to the auditors included within the operating costs were:
|
|
|
|
|
Year ended 31 October 2025 |
|
Year ended 31 October 2024 |
|
|
|
|
|
£000 |
|
£000 |
|
Audit |
|
|
|
193 |
|
260 |
9. Employee numbers and costs, including Directors
The average number of employees in the year were:
|
|
|
|
|
Year ended 31 October 2025 |
|
Year ended 31 October 2024 |
|
|
|
|
|
£000 |
|
£000 |
|
Support, operations and technical |
|
|
|
115 |
|
130 |
|
Directors |
|
|
|
6 |
|
6 |
|
|
|
|
|
121 |
|
136 |
The aggregate payroll costs for Directors and employees were:
|
|
|
|
|
Year ended 31 October 2025 |
|
Year ended 31 October 2024 |
|
|
|
|
|
£000 |
|
£000 |
|
Wages and salaries |
|
|
|
9,259 |
|
8,803 |
|
Social security |
|
|
|
1,141 |
|
992 |
|
Employers' pension contributions |
|
|
|
311 |
|
335 |
|
Total employee costs |
|
|
|
10,711 |
|
10,130 |
|
Less: capitalised as development costs |
|
|
|
(2,662) |
|
(1,507) |
|
|
|
|
|
8,049 |
|
8,623 |
|
Equity-settled share-based payments expense |
|
|
|
1,997 |
|
1,459 |
|
|
|
|
|
10,046 |
|
10,082 |
Details of the employee costs associated with the company's key management personnel are included in note 27.
10. Directors' remuneration
|
|
|
|
|
Year ended 31 October 2025 |
|
Year ended 31 October 2024 |
|
|
|
|
|
£000 |
|
£000 |
|
|
|
|
|
|
|
|
|
Salary and benefits |
|
|
|
972 |
|
1,153 |
|
Pension |
|
|
|
32 |
|
28 |
|
Total Directors' remuneration |
|
|
|
1,004 |
|
1,181 |
In addition, Directors received total of £114,000 (2024: £235,000) termination benefits in the year. In 2025 the termination benefit did not impact the highest paid director.
|
|
|
|
|
Year ended 31 October 2025 |
|
Year ended 31 October 2024 |
|
Highest paid director |
|
|
|
£000 |
|
£000 |
|
Wages and salaries |
|
|
|
739 |
|
503 |
|
Termination benefit |
|
|
|
- |
|
235 |
|
Benefits in kind |
|
|
|
19 |
|
45 |
|
|
|
|
|
758 |
|
783 |
|
Employers' pension contributions |
|
|
|
17 |
|
17 |
|
|
|
|
|
775 |
|
800 |
11. Net finance income/(cost)
|
|
|
|
|
Year ended 31 October 2025 |
|
Year ended 31 October 2024 |
|
|
|
|
|
£000 |
|
£000 |
|
Lease / Loan interest |
|
|
|
(29) |
|
(41) |
|
Exchange rate differences |
|
|
|
(28) |
|
- |
|
Bank charges |
|
|
|
(9) |
|
(14) |
|
Total finance cost |
|
|
|
(66) |
|
(55) |
|
Finance income |
|
|
|
213 |
|
316 |
|
Net finance income |
|
|
|
147 |
|
261 |
12. Taxation
|
|
|
|
|
Year ended 31 October 2025 |
|
Year ended 31 October 2024 |
|
|
|
|
|
£000 |
|
£000 |
|
Recognised in the statement of comprehensive income |
|
|
|
|
|
|
|
R&D tax credit - current year |
|
|
|
3,159 |
|
1,293 |
|
R&D tax credit - prior year |
|
|
|
100 |
|
597 |
|
Total tax credit |
|
|
|
3,259 |
|
1,890 |
|
|
|
|
|
|
|
|
|
Reconciliation of effective tax rates |
|
|
|
|
|
|
|
Loss before tax |
|
|
|
(25,454) |
|
(19,309) |
|
Tax using the domestic rate of corporation tax at 25.00% (2024: 25%) |
|
|
|
6,364 |
|
4,827 |
|
|
|
|
|
|
|
|
|
Effect of: |
|
|
|
|
|
|
|
Change in unrecognised deferred tax resulting from tax losses |
|
|
|
(2,511) |
|
(2,430)
|
|
Non-deductible items |
|
|
|
(40) |
|
(245) |
|
Depreciation in excess of capital allowances |
|
|
|
(253) |
|
(19) |
|
Other differences |
|
|
|
(631) |
|
(320) |
|
R&D expenditure credits |
|
|
|
- |
|
(75) |
|
R&D enhanced deduction on qualifying R&D expenditure |
|
|
|
2,509 |
|
913 |
|
R&D rate adjustment on surrendered losses |
|
|
|
(2,279) |
|
(1,358) |
|
Adjustment to R&D tax credit - prior year |
|
|
|
100 |
|
597 |
|
Total tax credit |
|
|
|
3,259 |
|
1,890 |
|
|
|
|
|
|
|
|
Deferred tax assets that have not been recognised are set out below:
|
|
|
|
|
Year ended 31 October 2025 |
|
Year ended 31 October 2024 |
|
|
|
|
|
£000 |
|
£000 |
|
Intangible assets |
|
|
|
(838) |
|
(1,814) |
|
Property, plant, and equipment |
|
|
|
1,452 |
|
1,923 |
|
Share-based payments |
|
|
|
275 |
|
142 |
|
Losses carried forward |
|
|
|
18,973 |
|
16,825 |
|
Unrecognised deferred tax assets |
|
|
|
19,863 |
|
17,076 |
Deferred tax assets of £838,000 (2024: £1,814,000) have been recognised but offset against deferred tax liabilities of the same amount arising in the same jurisdiction.
The cumulative tax losses in the amount of £75.9 million (2024: £67.3 million) that are available indefinitely for offsetting against future taxable profits have not been recognised as the Directors consider that it is unlikely that they will be realised in the foreseeable future.
The prior year R&D tax credit of £100,000 is largely due differing treatment of RDEC and SME tax credit scheme in the financial information to the tax return.
13. Loss per share
The calculation of the basic loss per share is based upon the net loss after tax attributable to ordinary shareholders and a weighted average number of shares in issue for the year.
|
|
|
|
|
Year ended 31 October 2025 |
|
Year ended 31 October 2024 |
|
Basic loss per share (pence) |
|
|
|
(2.41) |
|
(2.22) |
|
Diluted loss per share (pence) |
|
|
|
(2.41) |
|
(2.22) |
|
Loss attributable to equity shareholders £000 |
|
|
|
(22,195) |
|
(17,419) |
|
Weighted average number of shares in issue |
|
|
|
921,398,330 |
|
784,681,892 |
Diluted earnings per share
As set out in note 25, there are share options and warrants (accounted for under IFRS 2: Share based payments) outstanding as at 31 October 2025 which, if exercised, would increase the number of shares in issue. Given the losses for the year, there is no dilution of losses per share in the year ended 31 October 2025 nor the previous year.
14. Intangible assets
|
|
|
|
|
Development costs |
|
Patents & commercial rights |
|
Total intangible assets |
|
|
|
|
|
£000 |
|
£000 |
|
£000 |
|
Cost |
|
|
|
|
|
|
|
|
|
At 1 November 2023 |
|
|
|
- |
|
1,404 |
|
1,404 |
|
Additions |
|
|
|
4,403 |
|
40 |
|
4,443 |
|
Disposals |
|
|
|
- |
|
- |
|
- |
|
At 31 October 2024 |
|
|
|
4,403 |
|
1,444 |
|
5,847 |
|
Additions |
|
|
|
5,119 |
|
41 |
|
5,160 |
|
Transfers |
|
|
|
1 |
|
- |
|
- |
|
At 31 October 2025 |
|
|
|
9,523 |
|
1,485 |
|
11,008 |
|
|
|
|
|
|
|
|
|
|
|
Amortisation |
|
|
|
|
|
|
|
|
|
At 1 November 2023 |
|
|
|
- |
|
1,140 |
|
1,140 |
|
Charge for the year |
|
|
|
- |
|
81 |
|
81 |
|
At 31 October 2024 |
|
|
|
- |
|
1,221 |
|
1,221 |
|
Charge for the year |
|
|
|
938 |
|
111 |
|
1,049 |
|
Disposals |
|
|
|
- |
|
- |
|
- |
|
At 31 October 2025 |
|
|
|
938 |
|
1,333 |
|
2,270 |
|
|
|
|
|
|
|
|
|
|
|
Net book value |
|
|
|
|
|
|
|
|
|
At 31 October 2024 |
|
|
|
4,403 |
|
223 |
|
4,626 |
|
At 31 October 2025 |
|
|
|
8,585* |
|
152 |
|
8,738 |
*The carrying amount of capitalised development cost is attributed development of Fuel processing activities (£2,998,000) and Fuel Cell activities (£5,587,000). With the remaining amortisation period being 30 months.
Impairment review of capitalised development costs
In accordance with IAS 36 Impairment of Assets, intangible assets not yet available for use are tested annually for impairment. At year-end, the Company held £2,661k of capitalised development costs that are not being amortised. These assets have been allocated to two Cash-Generating Units (CGUs): Fuel Cell and Fuel Processing.
The recoverable amount of each CGU was determined using Fair Value Less Costs of Disposal (FVLCD), based on an independent market valuation consistent with IFRS 13's exit price principles. Costs of disposal, including broker fees, legal costs, and applicable taxes, were deducted in accordance with IAS 36.
The estimated recoverable amount substantially exceeds the combined carrying amount of £11.4m, resulting in this assumption being deemed unsensitive in the calculation.
15. Right-of-use assets
|
|
|
|
|
|
|
|
|
Cars |
Buildings |
Total |
|
|
|
|
|
|
|
|
|
£000 |
£000 |
£000 |
|
Cost |
|
|
|
|
|
|
|
|
|
|
|
At 1 November 2023 |
|
|
|
|
|
|
|
- |
1,985 |
1,985 |
|
Additions |
|
|
|
|
|
|
|
19 |
- |
19 |
|
Disposals |
|
|
|
|
|
|
|
- |
- |
- |
|
At 31 October 2024 |
|
|
|
|
|
|
|
19 |
1,985 |
2,004 |
|
Additions |
|
|
|
|
|
|
|
0 |
- |
0 |
|
Disposals |
|
|
|
|
|
|
|
- |
- |
- |
|
At 31 October 2025 |
|
|
|
|
|
|
|
19 |
1,985 |
2,004 |
|
|
|
|
|
|
|
|
|
|
|
|
|
Depreciation |
|
|
|
|
|
|
|
|
|
|
|
At 1 November 2023 |
|
|
|
|
|
|
|
- |
888 |
888 |
|
Charge for the year |
|
|
|
|
|
|
|
1 |
469 |
470 |
|
Disposals |
|
|
|
|
|
|
|
- |
- |
- |
|
At 31 October 2024 |
|
|
|
|
|
|
|
1 |
1,357 |
1,358 |
|
Charge for the year |
|
|
|
|
|
|
|
6 |
465 |
471 |
|
At 31 October 2025 |
|
|
|
|
|
|
|
7 |
1,822 |
1,829 |
|
|
|
|
|
|
|
|
|
|
|
|
|
Net book value |
|
|
|
|
|
|
|
|
|
|
|
At 31 October 2024 |
|
|
|
|
|
|
|
18 |
628 |
646 |
|
At 31 October 2025 |
|
|
|
|
|
|
|
11 |
163 |
175 |
Refer to Note 22 for disclosure of the associated lease liabilities.
16. Investment in joint venture
The Company has a 50% interest in a joint venture, Speedy Hydrogen Solutions Limited. The joint venture was incorporated on 6th November 2023, and the two joint venture partners invested £625,000 capital each.
|
|
|
|
|
|
|
2025 |
|
|
|
|
|
|
|
£000 |
|
1 November 2024 |
|
|
|
|
|
625 |
|
Capital invested |
|
|
|
|
|
- |
|
Impairment |
|
|
|
|
|
- |
|
31 October 2025 |
|
|
|
|
|
625 |
As part of the JV agreement the Company along with its partner may subscribe to up to £3,750,000 Secured Loan Notes. The loan notes are repayable in three years' time and interest is payable at 2.00% above bank of England base rate. The milestone conditions required for the allotment of the loan notes had not occurred as of 31st October 2025.
17. Property, plant, and equipment
|
|
Rental Asset |
Leasehold improvements |
Decommissioning Asset |
Plant, machinery and equipment |
Assets under construction |
Total |
||
|
|
£000 |
£000 |
£000 |
£000 |
£000 |
£000 |
||
|
Cost |
|
|
|
|
|
|
||
|
At 1 November 2023 |
- |
3,546 |
300 |
3,871 |
694 |
8,411 |
||
|
Additions |
348 |
169 |
167 |
1,886 |
382 |
2,952 |
||
|
Transfers |
- |
303 |
- |
103 |
(406) |
- |
||
|
Disposals |
- |
- |
- |
(2,483) |
- |
(2,483) |
||
|
At 31 October 2024 |
348 |
4,018 |
467 |
3,377 |
670 |
8,880 |
||
|
Additions |
0 |
157 |
48 |
275 |
245 |
725 |
||
|
Transfers |
(100) |
20 |
- |
884 |
(804) |
- |
||
|
Disposals |
(248) |
- |
(417) |
(1) |
(9) |
(675) |
||
|
At 31 October 2025 |
0 |
4,195 |
98 |
4,535 |
102 |
8,930 |
||
|
|
|
|
|
|
|
|
||
|
Depreciation |
|
|
|
|
|
|
||
|
At November 2023 |
- |
1,394 |
300 |
2,961 |
- |
4,655 |
||
|
Charge for the year |
29 |
1,221 |
77 |
716 |
|
2,043 |
||
|
Disposals |
|
- |
- |
(2,483) |
- |
(2,483) |
||
|
At 31 October 2024 |
29 |
2,615 |
377 |
1,194 |
- |
4,215 |
||
|
Charge for the year |
116 |
1,179 |
128 |
1,305 |
|
2,728 |
||
|
Transfers |
(42) |
0 |
|
42 |
|
|
||
|
Disposals |
(103) |
- |
(416) |
(2) |
- |
(521) |
||
|
At 31 October 2025 |
0 |
3,794 |
89 |
2,539 |
- |
6,422 |
||
|
|
|
|
|
|
|
|
||
|
Net book value |
|
|
|
|
|
|
||
|
At 31 October 2024 |
319 |
1,403 |
90 |
2,184 |
670 |
4,666 |
||
|
At 31 October 2025 |
- |
401 |
9 |
1,996 |
102 |
2,508 |
||
18. Inventory
|
|
|
|
|
31 October 2025 |
|
31 October 2024 |
|
|
|
|
|
£000 |
|
£000 |
|
Raw materials |
|
|
|
1,819 |
|
1,782 |
|
Work-in-progress |
|
|
|
- |
|
615 |
|
Finished Goods |
|
|
|
754 |
|
- |
|
Provision |
|
|
|
(2,573) |
|
(449) |
|
Inventory |
|
|
|
- |
|
1,948 |
Inventory expensed as cost of sales during the year was £136,000 (2024: £5,348,000).
The provision represents a write down of inventory for the fuel cell generators that will superseded by the model being released in Q2 FY26.
19. Trade and other receivables
|
|
|
|
|
|
31 October 2024 |
|
31 October 2024 |
|
|
|
|
|
|
£000 |
|
£000 |
|
Trade receivables |
|
|
|
|
387 |
|
249 |
|
Receivable from Joint Venture |
|
|
|
|
3,416 |
|
4,114 |
|
Provision for expected Credit losses |
|
|
|
|
(2,937) |
|
- |
|
VAT receivables |
|
|
|
|
69 |
|
8 |
|
Other receivables |
|
|
|
|
49 |
|
313 |
|
Prepayments |
|
|
|
|
939 |
|
2,053 |
|
|
|
|
|
|
1,923 |
|
6,737 |
Included within trade and other receivables is a provision for expected credit losses of £2,937,000 (2024: NIL). This provision is required to support the market adoption Hydrogen which is being enabled through the delivery of the new lower cost generator being launched in FY26. The provision has been recognised in accordance with the requirements of IFRS 9 - Financial Instruments, which mandates the use of an expected credit loss model for impairment of financial assets.
Of the £2.9m ECL, £2.8m is associated with related parties (see note 27).
Included within prepayments is an amount of £332,000 (2024: £1,378,000) representing payments made to suppliers in advance for the procurement of research and development materials and stock items.
There is no significant difference between the fair value of the receivables and the values stated above.
20. Cash and cash equivalents and short term deposits
|
|
|
|
|
31 October 2025 |
|
31 October 2024 |
|
|
|
|
|
£000 |
|
£000 |
|
Cash at bank |
|
|
|
997 |
|
769 |
|
Bank deposits |
|
|
|
13,320 |
|
14,605 |
|
Short Term Deposits |
|
|
|
11,000 |
|
- |
|
|
|
|
|
25,317 |
|
15,374 |
There is no material foreign exchange movement in respect of cash and cash equivalents. See note 26 for term deposit.
21. Trade and other payables
|
|
|
|
|
31 October 2025 |
|
31 October 2024 |
|
|
|
|
|
£000 |
|
£000 |
|
Trade payables |
|
|
|
646 |
|
1,826 |
|
Deferred revenue |
|
|
|
3,598 |
|
1,804 |
|
Other payables |
|
|
|
426 |
|
468 |
|
Accruals |
|
|
|
960 |
|
857 |
|
|
|
|
|
5,630 |
|
4,955 |
Deferred revenue under the ABB contract of £2m is reduced by £577,000 fair value of the warrants granted on the same day, 15 November 2021, as the two contracts are linked.
Government grant monies are also included within deferred revenue, where the corresponding costs have been considered are included in Intangible assets under IAS38 Capitalised Development Costs. The deferred income is amortised over the expected life of the associated asset which is 48 months starting in October 2025.
22. Lease liabilities
Changes in liabilities arising from financing activities:
|
|
|
|
|
Year ended 31 October 2025 |
|
Year ended 31 October 2024 |
|
|
|
|
|
£000 |
|
£000 |
|
Opening position |
|
|
|
664 |
|
1,124 |
|
Cash flows |
|
|
|
|
|
|
|
Repayment |
|
|
|
(498) |
|
(520) |
|
Non-cash |
|
|
|
|
|
|
|
Additions / (adjustment) |
|
|
|
(24) |
|
19 |
|
Interest expense |
|
|
|
18 |
|
41 |
|
|
|
|
|
160 |
|
664 |
|
|
|
|
|
31 October 2025 |
|
31 October 2024 |
|
|
|
|
|
£000 |
|
£000 |
|
Lease liabilities less than 12 months |
|
|
|
141 |
|
505 |
|
Lease liabilities more than 12 months |
|
|
|
19 |
|
159 |
|
|
|
|
|
160 |
|
664 |
£147,000 of the Company's lease liability as at 31 October 2025 relates to buildings for the occupancy of the campus at Dunsfold Park. A number of buildings are occupied under licences, and these have not been recognised as right-of-use assets. Of the leases recognised as right-of-use assets, the Company has a commitment on one lease until February 2027. The Company has a commitment on one lease until November 2025 with no break clauses. Two leases were renewed in January 2023 until January 2026 with no break clauses.
The expense relating to short term leases and leases of low value assets incurred during the year is £102,350 (2024: £84,250).
23. Provisions
|
|
|
Product warranties |
|
Decommissioning |
|
Total |
|
|
|
|
£000 |
|
£000 |
|
£000 |
|
|
|
|
|
|
|
|
|
|
|
Balance at 31 October 2024 |
|
217 |
|
468 |
|
685 |
|
|
Additions |
|
- |
|
67 |
|
67 |
|
|
Utilisation |
|
(181) |
|
(314) |
|
(495) |
|
|
Release |
|
- |
|
(122) |
|
(122) |
|
|
Balance at 31 October 2025 |
|
36 |
|
99 |
|
135 |
|
|
Current |
|
36 |
|
60 |
|
96 |
|
|
Non-current |
|
- |
|
39 |
|
39 |
|
Decommissioning
A provision of £417,150 was recognised in FY2024 in accordance with IAS 37 - Provisions, Contingent Liabilities and Contingent Assets, relating to AFC Energy's contractual obligation to a site owned by another Hydrogen Provider.
Although the contract was extended to 31 December 2027, a six-month break clause was exercised and became effective in September 2025.
During the current period, the obligation was settled through payments totalling £314,889, which was lower than the originally estimated provision. Consequently, a release of £121,661 has been recognised in profit or loss.
During the year, AFC Energy reassessed its dilapidation provision in respect of leased sites. The reassessment was based on updated cost estimates to restore the properties to their original state, reflecting adaptations made during the lease term.
In accordance with IAS 37, the provision was increased to reflect the revised expected outflow, with a corresponding increase in the associated RoU asset.
The change has been accounted for as a change in accounting estimate under IAS 8 and recognised prospectively in the current period. A corresponding asset has been recognised for the increase in provision.
Product warranties
During the year, there was a stock provision under IAS2 - Inventories, writing down the value of the warranty pool of replacement key components. The remaining balance represents an estimate of additional costs equivalent to 10% of a key component, which may be incurred in fulfilling warranty obligations. As the warranty pool has been covered by another standard, the write down of warranty pool has been considered as "utilised" in the year.
24. Issued share capital
|
|
|
Ordinary shares |
|
Price |
|
Share capital |
|
Share premium before costs of issue |
|
Costs of issue |
|
Share premium net of costs of issue |
|
|||||||||||||||||||||
|
|
|
|
|
£ |
|
£000 |
|
£000 |
|
£000 |
|
£000 |
|
|||||||||||||||||||||
|
At 1 November 2023 |
|
7746,516,30 |
|
- |
|
746 |
|
121,789 |
|
(3,269) |
|
118,520 |
||||||||||||||||||||||
|
Exercise of options 13 March 2024 |
|
900,000 |
|
79,200 |
|
1 |
|
78 |
|
- |
|
78 |
||||||||||||||||||||||
|
Exercise of options 23 May 2024 |
|
25,000 |
|
2,000 |
|
- |
|
2 |
|
- |
|
2 |
||||||||||||||||||||||
|
Exercise of options 04 June 2024 |
|
37,500 |
|
5,775 |
|
- |
|
6 |
|
- |
|
6 |
||||||||||||||||||||||
|
Issue of shares 13 June 2024 |
|
74,741,630 |
|
11,211,244
|
|
75 |
|
11,137 |
|
(670) |
|
10,467 |
||||||||||||||||||||||
|
Issue of shares 1 July 2024 |
|
30,537,369 |
|
4,580,605 |
|
30 |
|
4,550 |
|
(207) |
|
4,343 |
||||||||||||||||||||||
|
Exercise of options 11 September 2024 |
|
1,600,000 |
|
140,800 |
|
2 |
|
139 |
|
- |
|
139 |
||||||||||||||||||||||
|
As at 31 October 2024 |
|
854,357,806 |
|
- |
|
854 |
|
137,701 |
|
(4,146) |
|
133,555 |
||||||||||||||||||||||
|
Issue of shares 05 February 2025 |
|
1,088,990 |
|
1,089 |
|
1 |
|
- |
|
- |
|
- |
|
|||||||||||||||||||||
|
Exercise of options 24 April 2025 |
|
30,000 |
|
30 |
|
- |
|
- |
|
- |
|
- |
|
|||||||||||||||||||||
|
Exercise of options 22 May 2025 |
|
1,226,350 |
|
1,226 |
|
1 |
|
- |
|
- |
|
- |
|
|||||||||||||||||||||
|
Exercise of options |
|
|
|
|
|
|
|
|
|
|
|
|
|
|||||||||||||||||||||
|
18 June 2025 |
|
70,000 |
|
70 |
|
- |
|
- |
|
- |
|
- |
|
|||||||||||||||||||||
|
Issue of shares |
|
|
|
|
|
|
|
|
|
|
|
|
|
|||||||||||||||||||||
|
22 July 2025 |
|
85,544,679 |
|
8,554,468 |
|
86 |
|
8,469 |
|
(809) |
|
7,660 |
|
|||||||||||||||||||||
|
Issue of shares |
|
|
|
|
|
|
|
|
|
|
|
|
|
|||||||||||||||||||||
|
11 August 2025 |
|
189,184,574 |
|
18,918,457 |
|
189 |
|
18,729 |
|
(898) |
|
17,831 |
|
|||||||||||||||||||||
|
|
|
|
|
|
|
|
|
|
|
|
|
|
|
|||||||||||||||||||||
|
Exercise of options 27 October 2025 |
|
40,000 |
|
40 |
|
- |
|
- |
|
- |
|
- |
|
|||||||||||||||||||||
|
|
|
1,131,542,399 |
|
- |
|
1,131 |
|
164,899 |
|
(5,853) |
|
159,046 |
|
|||||||||||||||||||||
The Company considers its capital and reserves attributable to equity shareholders to be the Company's capital. In managing its capital, the Company's primary long-term objective is to provide a return for its equity shareholders through capital growth. Going forward the Company will seek to maintain a gearing ratio that balances risks and returns at an acceptable level and to maintain a sufficient funding base to enable the Company to meet its working capital needs. The Company has no debt, other than property leases, and an immaterial amount on asset finance and therefore a target debt to equity ratio is not relevant at the time.
Share premium is shown before the permitted deduction of costs of issue. After such deduction, the value equals £159,046,000.
Details of the Company's capital are disclosed in the statement of changes in equity.
There have been no other significant changes to the Company's management objectives, policies, and processes in the year, nor has there been any change in what the Company considers to be capital.
25. Share-based payments
Share-based payment charge:
|
|
|
|
|
31 October 2025 |
|
31 October 2024 |
|
|
|
|
|
£000 |
|
£000 |
|
Employee Share Option Plan |
|
|
|
2,023 |
|
911 |
|
Employee Performance Share Plan |
|
|
|
(23) |
|
591 |
|
SAYE |
|
|
|
(3) |
|
(43) |
|
|
|
|
|
1,997 |
|
1,459 |
Employee Share Option Plan
The establishment of the Employee Share Option Plan was approved by the Board on 1 August 2018 and amended on 10 October 2018. The Plan is designed to attract, retain and motivate employees. Under the Plan, participants can be granted options which vest unconditionally or conditionally upon achieving certain performance targets. There is also a time-based condition on the options granted. Participation in the Plan is solely at the Board's discretion, and no employee has a contractual right to participate in the Plan or to receive any guaranteed benefits.
Options are granted under the Plan for no consideration and carry no dividend nor voting rights.
When exercisable, each option is convertible into one ordinary share.
Set out below are summaries of options granted under the Plan:
|
|
|
Average exercise price per share option 2025 |
|
Number of options 2025 |
|
Average exercise price per share option 2024 |
|
Number of options 2024 |
||||
|
|
|
£ |
|
|
|
£ |
|
|
||||
|
At 1 November |
|
0.07 |
|
20,261,013 |
|
0.32 |
|
12,970,500 |
|
|||
|
Granted during the year |
|
0.01 |
|
23,712,406 |
|
0.12 |
|
10,428,013 |
|
|||
|
Exercised during the year |
|
0.001 |
|
(1,366,350) |
|
0.09 |
|
(2,562,500) |
|
|||
|
Lapsed during the year |
|
0.18 |
|
(2,019,648) |
|
0.19 |
|
(285,000) |
|
|||
|
Forfeited during the year |
|
0.09 |
|
(2,314,000) |
|
0.19 |
|
(290,000) |
|
|||
|
At 31 October 2025 |
|
0.03 |
|
38,273,421 |
|
0.07 |
|
20,261,013 |
|
|||
|
Vested and exercisable at 31 October |
|
0.03 |
|
11,792,745 |
|
0.07 |
|
7,283,000 |
|
|||
|
|
|
|
|
|
|
|
|
|
|
|||
Share options outstanding at the end of the year have the following expiry dates and exercise prices:
|
Grant date |
Expiry date |
|
Exercise price |
|
Share options 2025 |
|
Share options 2024 |
|
|
|
|
|
£ |
|
|
|
|
|
|
17 July 2015** |
17 July 2028 |
|
0.2200 |
|
5,000,000 |
|
6,000,000 |
|
|
20 April 2020 |
20 April 2030 |
|
0.1540 |
|
443,000 |
|
783,000 |
|
|
09 June 2023* |
28 June 2031 |
|
0.1000 |
|
500,000 |
|
500,000 |
|
|
09 June 2023* |
28 June 2031 |
|
0.1250 |
|
500,000 |
|
500,000 |
|
|
09 June 2023 |
28 June 2031 |
|
0.1526 |
|
1,500,000 |
|
1,500,000 |
|
|
04 July 2022 |
04 July 2032 |
|
0.1900 |
|
90,000 |
|
215,000 |
|
|
27 April 2023 |
27 April 2033 |
|
0.0188 |
|
125,000 |
|
625,000 |
|
|
04 April 2024 |
04 April 2034 |
|
0.1300 |
|
99,365 |
|
238,013 |
|
|
18 April 2024 |
18 April 2034 |
|
0.1900 |
|
4,170,000 |
|
5,890,000 |
|
|
10 June 2024 |
10 June 2034 |
|
0.2000 |
|
70,000 |
|
70,000 |
|
|
10 June 2024 |
10 June 2034 |
|
0.2000 |
|
70,000 |
|
70,000 |
|
|
13 June 2024 |
13 June 2034 |
|
0.1600 |
|
- |
|
110,000 |
|
|
24 July 2024 |
24 July 2034 |
|
0.1600 |
|
110,000 |
|
110,000 |
|
|
05 September 2024 |
05 September 2034 |
|
0.0010 |
|
3,400,000 |
|
3,400,000 |
|
|
06 September 2024 |
06 September 2034 |
|
0.1300 |
|
250,000 |
|
250,000 |
|
|
07 October 2024 |
07 October 2034 |
|
0.1300 |
|
- |
|
70,000 |
|
|
12 November 2024 |
12 November 2034 |
|
0.1000 |
|
210,000 |
|
- |
|
|
21 December 2023*** |
21 December 2033 |
|
0.0010 |
|
350,000 |
|
- |
|
|
29 November 2024 |
29 November 2034 |
|
0.1100 |
|
480,000 |
|
- |
|
|
03 December 2024 |
03 December 2034 |
|
0.0900 |
|
570,000 |
|
- |
|
|
11 December 2024 |
11 December 2034 |
|
0.1000 |
|
280,000 |
|
- |
|
|
16 December 2024 |
16 December 2034 |
|
0.0010 |
|
1,400,980 |
|
- |
|
|
07 January 2025 |
07 January 2035 |
|
0.0010 |
|
9,389,671 |
|
- |
|
|
20 January 2025 |
20 January 2035 |
|
0.0010 |
|
5,515,405 |
|
- |
|
|
11 February 2025 |
11 February 2035 |
|
0.0800 |
|
250,000 |
|
- |
|
|
01 May 2025 |
01 May 2035 |
|
0.07 |
|
70,000 |
|
- |
|
|
02 May 2025 |
02 May 2035 |
|
0.07 |
|
110,000 |
|
- |
|
|
11 May 2025 |
11 May 2035 |
|
0.10 |
|
70,000 |
|
- |
|
|
04 June 2025 |
04 June 2035 |
|
0.13 |
|
2,000,000 |
|
- |
|
|
12 June 2025 |
12 June 2035 |
|
0.17 |
|
110,000 |
|
- |
|
|
11 August 2025 |
11 August 2035 |
|
0.08 |
|
70,000 |
|
- |
|
|
08 September 2025 |
08 September 2035 |
|
0.09 |
|
1,000,000 |
|
- |
|
|
16 September 2025 |
16 September 2035 |
|
0.08 |
|
70,000 |
|
- |
|
|
|
|
|
|
|
|
|
|
|
|
|
|
|
|
|
|
|
|
|
|
|
|
|
|
|
38,273,421 |
|
20,261,013 |
|
* Award amended by Deed of Variation in 2023.
** Award amended by Deed of Variation in 2024.
*** Award amended by deed of variation in 2025
The table below sets out the inputs used in determining the fair value of the grants of options per the previous table as well as the expense recognised in the accounts in the current year. The grants in the previous table are linked below based on the exercise price and grant date.
|
Grant date |
Exercise price |
Average grant date share price |
Average expected volatility per annum |
Average risk-free interest rate per annum |
Average dividend yield per annum |
Average implied option life in years |
Average fair value per option |
|
|
|
£ |
£ |
|
|
|
|
£ |
|
|
|
|
|
|
|
|
|
|
|
|
20 April 2020 |
0.1540 |
0.1500 |
83.60% |
0.46% |
0.00% |
3.0 |
0.1200 |
|
|
04 July 2022 |
0.1900 |
0.1900 |
95.00% |
1.83% |
0.00% |
3.0 |
0.1140 |
|
|
27 April 2023 |
0.1880 |
0.1882 |
78.00% |
3.82% |
0.00% |
3.0 |
0.0990 |
|
|
09 June 2023 |
0.1000 |
0.1682 |
72.00% |
4.51% |
0.00% |
0.7 |
0.0791 |
|
|
09 June 2023 |
0.1000 |
0.1682 |
72.00% |
4.51% |
0.00% |
0.9 |
0.0825 |
|
|
09 June 2023 |
0.1250 |
0.1682 |
72.00% |
4.51% |
0.00% |
1.7 |
0.0817 |
|
|
09 June 2023 |
0.1250 |
0.1682 |
72.00% |
4.51% |
0.00% |
1.9 |
0.0847 |
|
|
09 June 2023 |
0.1530 |
0.1682 |
72.00% |
4.51% |
0.00% |
2.7 |
0.0856 |
|
|
09 June 2023 |
0.1530 |
0.1682 |
72.00% |
4.51% |
0.00% |
2.9 |
0.0883 |
|
|
21 December 2023 |
0.0010 |
0.1900 |
84.77% |
3.34% |
0.00% |
- |
0.1900 |
|
|
04 April 2024 |
0.1300 |
0.1700 |
85.08% |
3.77% |
0.00% |
- |
0.1500 |
|
|
18 April 2024 |
0.1900 |
0.1900 |
85.06% |
4.01% |
0.00% |
- |
0.1600 |
|
|
10 June 2024 |
0.2000 |
0.1900 |
85.56% |
4.05% |
0.00% |
- |
0.1600 |
|
|
13 June 2024 |
0.1600 |
0.1600 |
85.40% |
3.86% |
0.00% |
- |
0.1400 |
|
|
24 July 2024 |
0.1600 |
0.1500 |
85.40% |
3.89% |
0.00% |
- |
0.1300 |
|
|
05 September 2024 |
0.0010 |
0.1300 |
85.36% |
3.63% |
0.00% |
- |
0.1300 |
|
|
06 September 2024 |
0.1300 |
0.1200 |
85.35% |
3.60% |
0.00% |
- |
0.1000 |
|
|
07 October 2024 |
0.1300 |
0.1000 |
85.33% |
3.88% |
0.00% |
- |
0.0800 |
|
|
13 May 2024* |
0.2200 |
0.2100 |
76.50% |
4.13% |
0.00% |
- |
0.0972 |
|
|
13 May 2024* |
0.2200 |
0.2100 |
76.50% |
4.13% |
0.00% |
- |
0.1213 |
|
|
29 November 2024 |
0.1100 |
0.1000 |
85.49% |
3.84% |
0.00% |
- |
0.1100 |
|
|
03 December 2024 |
0.1100 |
0.1000 |
85.45% |
2.85% |
0.00% |
- |
0.0900 |
|
|
11 December 2024 |
0.1000 |
0.0900 |
85.73% |
3.88% |
0.00% |
- |
0.0900 |
|
|
16 December 2024 |
0.0010 |
0.0900 |
85.44% |
3.99% |
0.00% |
- |
0.1000 |
|
|
07 January 2025 |
0.0010 |
0.0900 |
85.70% |
4.21% |
0.00% |
- |
0.1000 |
|
|
20 January 2025 |
0.0010 |
0.0800 |
84.81% |
4.19% |
0.00% |
- |
0.0900 |
|
|
11 February 2025 |
0.1000 |
0.0900 |
85.76% |
4.05% |
0.00% |
- |
0.0800 |
|
|
01 May 2025 |
0.0800 |
0.0700 |
83.35% |
4.06% |
0.00% |
- |
0.0700 |
|
|
02 May 2025 |
0.0800 |
0.0700 |
83.36% |
4.06% |
0.00% |
- |
0.0700 |
|
|
11 May 2025 |
0.1000 |
0.0900 |
70.88% |
3.82% |
0.00% |
- |
0.1000 |
|
|
04 June 2025 |
0.1300 |
0.1200 |
76.46% |
3.88% |
0.00% |
- |
0.1300 |
|
|
12 June 2025 |
0.1700 |
0.1600 |
74.47% |
3.88% |
0.00% |
- |
0.1700 |
|
|
11 August 2025 |
0.0900 |
0.0800 |
84.95% |
4.13% |
0.00% |
- |
0.0800 |
|
|
08 September 2025 |
0.0900 |
0.0800 |
74.59% |
3.75% |
0.00% |
- |
0.0900 |
|
|
16 September 2025 |
0.0900 |
0.8000 |
84.81% |
4.17% |
0.00% |
- |
0.0900 |
|
|
|
|
|
|
|
|
|
|
|
|
|
||||||||
* The grant date is the date of modification of the original share options granted on 17th July 2015.
Performance Share Plan
The establishment of the Performance Share Plan was approved by the Board on 1 September 2021. The Plan is designed to attract, retain and motivate employees. Under the Plan, participants can be granted options which vest unconditionally or conditionally upon achieving certain performance targets. Participation in the Plan is solely at the Board's discretion, and no employee has a contractual right to participate in the Plan or to receive any guaranteed benefits. Award holders are not required to make payment for the grant of an award unless the board determines otherwise.
Options are granted under the Plan for no consideration and carry no dividend nor voting rights.
When exercisable, each option is convertible into one ordinary share.
Set out below are summaries of options granted under the Plan:
|
|
|
Average exercise price per share option 2025 |
|
Number of options 2025 |
|
Average exercise price per share option 2024 |
|
Number of options 2024 |
|
|
|
£ |
|
|
|
|
|
|
|
At 1 November |
|
0.001 |
|
13,275,328 |
|
0.001 |
|
7,600,904 |
|
Granted during the year |
|
0.001 |
|
10,058,410 |
|
0.000 |
|
6,295,394 |
|
Exercised during the year |
|
0.001 |
|
- |
|
0.001 |
|
- |
|
Lapsed during the year |
|
0.001 |
|
- |
|
0.001 |
|
(620,970) |
|
Forfeited during the year |
|
0.001 |
|
(4,465,785) |
|
0.001 |
|
- |
|
At 31 October |
|
0.001 |
|
18,867,953 |
|
0.001 |
|
13,275,328 |
|
Vested and exercisable at 31 October |
|
0.001 |
|
1,972,527 |
|
- |
|
- |
Share options outstanding at the end of the year have the following expiry dates and exercise prices:
|
Grant date |
Expiry date |
|
Exercise price |
|
Share options 2025 |
|
Share options 2024 |
|
|
|
|
£ |
|
|
|
|
|
12 July 2022 |
12 July 2032 |
|
0.001 |
|
1,972,527 |
|
2,315,934 |
|
1 June 2023 |
1 June 2033 |
|
0.001 |
|
2,865,340 |
|
4,664,000 |
|
02 May 2024 |
02 May 2034 |
|
0.001 |
|
369,405 |
|
369,405 |
|
02 May 2024 |
02 May 2034 |
|
0.001 |
|
3,602,271 |
|
5,925,989 |
|
01 August 2025 |
01 August 2035 |
|
0.001 |
|
10,058,410 |
|
- |
|
|
|
|
|
|
|
|
|
|
|
|
|
|
|
|
|
|
|
|
|
|
|
|
18,867,953 |
|
13,275,328 |
The table below sets out the inputs used in determining the fair value of the grants of options per the previous table as well as the expense recognised in the accounts in the current year. The grants in the previous table are linked below based on the exercise price and grant date.
|
Grant date |
Exercise price |
Average grant date share price |
Average expected volatility per annum |
Average risk-free interest rate per annum |
Average dividend yield per annum |
Average implied option life in years |
Average fair value per option |
|
|
Pence |
Pence |
|
|
|
|
Pence |
|
19 November 2021 |
0.001 |
53.80 |
76.00% |
0.05% |
0.00% |
0.40 |
0.43 |
|
19 November 2021 |
0.001 |
53.80 |
76.00% |
0.35% |
0.00% |
1.40 |
0.42 |
|
19 November 2021 |
0.001 |
53.80 |
76.00% |
0.05% |
0.00% |
3.00 |
0.45 |
|
15 July 2022 |
0.001 |
20.70 |
95.00% |
1.76% |
0.00% |
3.00 |
12.70 |
|
15 July 2022 |
0.001 |
20.70 |
95.00% |
1.76% |
0.00% |
3.00 |
16.60 |
|
01 June 2023 |
0.001 |
17.91 |
74.00% |
4.29% |
0.00% |
3.00 |
8.79 |
|
01 June 2023 |
0.001 |
17.91 |
74.00% |
4.29% |
0.00% |
3.00 |
10.92 |
|
02 May 2024 |
0.001 |
18.00 |
88.11% |
4.03% |
0.00% |
3.00 |
15.00 |
|
02 May 2024 |
0.001 |
18.00 |
67.50% |
4.49% |
0.00% |
3.00 |
10.00 |
|
01 August 2025 |
0.001 |
9.00 |
75.07% |
3.66% |
0.00% |
3.00 |
7.00 |
|
|
|
|
|
|
|
|
|
|
|
|
|
|
|
|
|
|
|
|
|||||||
SAYE
Save-as-you-earn (SAYE) 'Sharesave' schemes are open to all eligible employees. The SAYE schemes allow eligible employees to commit to making a deduction from salary monthly over three years. At the end of the three-year period, employees can purchase the Company's ordinary shares of 0.1 pence each ("Ordinary Shares") using the funds saved.
The first AFC Energy SAYE scheme was launched in August 2022 at an exercise price of 20.48 pence per Ordinary Share, representing a 20% discount to the closing market price of the Ordinary Shares prior to the scheme being launched on 3 August 2022. These options matured during the year. At maturity, the exercise price of the options exceeded the market price of the Company's shares, resulting in the options being "underwater." Consequently, participants exercised no options, and no shares were issued under the scheme. There are no outstanding share options on this scheme.
The scheme remains accounted for in accordance with IFRS 2 - Share-Based Payment, and no additional expense or reversal has been recognised in respect of these options.
The second AFC Energy SAYE scheme was launched in September 2023 at an exercise price of 14.304 pence per Ordinary Share, representing a 20% discount to the closing market price of the Ordinary Shares prior to the scheme being launched on 6 September 2023.
The discounts to the closing market prices are in line with the limits of the SAYE scheme as defined by HMRC.
|
|
Average exercise price per option 2025 |
Number of options 2025 |
Average exercise price per option 2024 |
Number of options 2024 |
|
|
Pence |
|
£ |
|
|
01 November |
15.58 |
2,028,798 |
17.44 |
3,944,601 |
|
Granted during the year |
- |
- |
- |
- |
|
Forfeited during the year |
15.64 |
(783,649) |
19.42 |
(1,915,803) |
|
31 October |
15.55 |
1,245,149 |
15.58 |
2,028,798 |
|
Vested and exercisable at 31 October |
- |
- |
- |
- |
|
|
|
|
|
|
|
|
|
|
|
|
|
Grant date |
Expiry date |
Exercise price Pence |
Share options 2025 |
Share options 2024 |
|
|
|
|
|
|
|
03 August 2022 |
31 March 2026 |
20.480 |
250,483 |
420,989 |
|
19 October 2023 |
30 April 2027 |
14.304 |
994,666 |
1,607,809 |
|
Grant date |
Exercise price |
Average grant date share price |
Average expected volatility per annum |
Average risk-free interest rate per annum |
Average dividend yield per annum |
Average implied option life in years |
Average fair value per option |
|
|
Pence |
Pence |
|
|
|
|
Pence |
|
03 August 2022 |
20.480 |
25.60 |
95.00% |
2.93% |
0.00% |
3.08 |
17.700 |
|
19 October 2023 |
14.304 |
13.97 |
73.00% |
4.72% |
0.00% |
3.03 |
7.060 |
|
|
|
|
|
|
|
|
|
Warrants
While the Board issues share options to employees, the Board has the discretion to award warrants from time to time to non-employees, such as non-executive Directors and third parties. Typically, warrants are granted and vest upon certain performance targets. Grant of warrants is solely at the Board's discretion.
Warrants are granted for no consideration and carry no dividend nor voting rights. When exercisable, each warrant is convertible into one ordinary share.
Set out below are summaries of warrants granted under the Plan:
|
|
Average exercise price per warrant 2025 |
Number of warrants 2025 |
Average exercise price per warrant 2024 |
Number of warrants 2024 |
|
|
£ |
|
£ |
|
|
01 November |
0.770 |
5,000,000 |
0.670 |
11,802,720 |
|
Lapsed during the year |
0.770 |
(5,000,000) |
0.585 |
(6,802,720) |
|
31 October |
- |
- |
0.770 |
5,000,000 |
|
Vested and exercisable at 31 October |
|
- |
|
- |
In the case of the ABB warrants in the table above, the warrant life is two years from the date of vesting. The final tranche was fully vested and expired on 13 March 2025, without exercise. All warrants are now expired.
26. Financial instruments
In common with other businesses, the Company is exposed to risks that arise from its use of financial instruments. This note describes the Company's objectives, policies and processes for managing those risks and the methods used to measure them. Further quantitative information in respect of these risks is presented throughout this financial information.
Principal financial instruments
The principal financial instruments used by the Company, from which financial instrument risk arises, are as follows:
|
|
|
|
|
Year ended 31 October 2025 |
|
Year ended 31 October 2024 |
|
|
|
Note |
|
£000 |
|
£000 |
|
Financial instruments held at amortised cost: |
|
|
|
|
|
|
|
Cash and cash equivalents |
|
20 |
|
14,317 |
|
15,374 |
|
Restricted cash |
|
|
|
- |
|
433 |
|
Short Term Deposits |
|
|
|
11,000 |
|
- |
|
Trade and other receivables |
|
19 |
|
915 |
|
4,676 |
|
Total financial assets held at amortised cost |
|
|
|
26,232 |
|
20,483 |
|
Trade & other payables |
|
21 |
|
2,031 |
|
3,151 |
|
Leases |
|
22 |
|
160 |
|
664 |
|
Finance Loans |
|
|
|
125 |
|
- |
|
Total financial liabilities held at amortised cost |
|
|
|
2,316 |
|
3,815 |
There is no significant difference between the fair value and book value of financial instruments.
The Company does not enter forward exchange contracts or otherwise hedge its potential foreign exchange exposure. The Board monitors and reviews its policies in respect of currency risk on a regular basis.
At the reporting date, the Company held term deposits with maturities greater than 90 days amounting to £11m (FY24 NIL) These are presented within short-term investments and excluded from cash and cash equivalents in the statement of cash flows.
General objectives, policies, and processes
The Board has overall responsibility for the determination of the Company's risk management objectives and policies and, while retaining ultimate responsibility for them, it has delegated part of the authority for designing and operating processes that ensure the effective implementation of the objectives and policies to the Company's finance team. The Board receives reports from the financial team through which it reviews the effectiveness of the processes put in place and the appropriateness of the objectives and policies it sets.
The overall objective of the Board is to set policies that seek to reduce ongoing risk as far as possible without unduly affecting the Company's competitiveness and flexibility. Further details regarding these policies are set out below.
Credit risk
Credit risk arises principally from the Company's trade and other receivables and cash and cash equivalents and short term deposits. It is the risk that the counterparty fails to discharge its obligation in respect of the instrument. The maximum exposure to credit risk equals the carrying value of these items in the financial information as shown below:
|
|
|
|
|
Year ended 31 October 2025 |
|
Year ended 31 October 2024 |
|
|
|
|
|
£000 |
|
£000 |
|
Cash and cash equivalents |
|
|
|
14,317 |
|
15,374 |
|
Short term Deposits |
|
|
|
11,000 |
|
- |
|
Restricted cash |
|
|
|
- |
|
433 |
|
Trade and other receivables |
|
|
|
915 |
|
4,676 |
Credit risk with cash and cash equivalents and short term deposits is reduced by placing funds with banks with acceptable credit ratings and government support where applicable and on term deposits with a range of maturity dates. At the year end, most cash balances were temporarily held on short-term deposit. The credit risk provision is estimated on a case-by-case basis considering public information of the counterparty and payment history and no loss is expected.
In accordance with IFRS 9 - Financial Instruments, the Company recognises expected credit losses (ECL) on financial assets measured at amortised cost.
During the year, a significant increase in the loss allowance was recorded in respect of receivables due from the joint venture. Following a detailed assessment of the counterparty's financial position and a change in its business plan, these receivables have been considered as likely irrecoverable.
Consequently, the related charge has been recognised in profit or loss within administrative expenses (see Note 19).
The Company continues to apply the simplified approach for trade receivables, recognising lifetime ECL at initial recognition. The loss allowance reflects historical default experience, current economic conditions, and forward-looking information in accordance with IFRS 9 requirements.
Liquidity risk
Liquidity risk arises from the Company's management of working capital and the amount of funding required for the development programme. It is the risk that the Company will encounter difficulty in meeting its financial obligations as they fall due. The Company's policy is to ensure that it will always have sufficient cash to allow it to meet its liabilities when they become due.
The principal liabilities of the Company are trade and other payables in respect of the ongoing product development programme. Trade payables are all payable within two months. The Board receives cash flow projections on a regular basis as well as information on cash balances.
The following table shows the Company's financial liabilities by relevant maturity grouping based on contractual maturities. The amounts included in the analysis are contractual, undiscounted cashflows.
|
|
Less than one year |
One to two years |
Two to five years |
Carrying amount |
Total contracted cash flows |
|
31 October 2025 |
£000 |
£000 |
£000 |
£000 |
£000 |
|
Trade & other payables |
2,031 |
- |
- |
2,031 |
2,031 |
|
Lease liabilities |
141 |
19 |
- |
160 |
163 |
|
Asset Finance |
63 |
57 |
5 |
125 |
139 |
|
Total financial liabilities |
2,235 |
76 |
5 |
2,316 |
2,333 |
|
|
Less than one year |
One to two years |
Two to five years |
Carrying amount |
Total contracted cash flows
|
|
31 October 2024 |
£000 |
£000 |
£000 |
£000 |
£000 |
|
Trade & other payables |
3,151 |
- |
- |
3,151 |
3,151 |
|
Lease liabilities |
525 |
144 |
19 |
664 |
688 |
|
Total financial liabilities |
3,676 |
144 |
19 |
3,815 |
3,839 |
See also note 22, which sets out the lease liabilities for less than 12 months and more than 12 months.
Interest rate risk
The Company is exposed to interest rate risk in respect of surplus funds held on deposit and, where appropriate, uses fixed interest term deposits to mitigate this risk.
27. Related party transactions
Details of Directors' remuneration are given in note 10. On the 17th July 2025 directors subscribed to 5,000,000 shares for a total consideration of £500,000.
A full list of subsidiaries and joint ventures is given in note 28.
Joint venture
During the year, the company made sales of £56,000 to Speedy Hydrogen Solutions Limited. At year end there was a debtor balance of £3,400,000. In accordance with IFRS 9 - Financial Instruments, the Company assessed the recoverability of the receivable due from the JV. Following a detailed review of the JV's financial position and a change in its business plan, the receivable has been considered irrecoverable. An expected credit loss allowance for £2.8m has therefore been recognised in profit or loss within administrative expenses, with the remaining debtor balance being associated with reclaimable VAT.
(see Note 19).
Remuneration of key management personnel
Key management personnel are those individuals who have authority and responsibility for planning, directing, and controlling the activities of the Company. For AFC Energy Plc these are all executive and non-executive Directors in office during each financial year.
|
|
|
|
|
Year ended 31 October 2025 |
|
Year ended 31 October 2024 |
|
|
|
|
|
£000 |
|
£000 |
|
Short-term employee benefits: |
|
|
|
|
|
|
|
Salaries and bonuses |
|
|
|
1,416 |
|
1,300 |
|
Termination benefits |
|
|
|
114 |
|
234 |
|
Benefits in kind |
|
|
|
34 |
|
52 |
|
|
|
|
|
1,564 |
|
1,586 |
|
Post-employment benefits: |
|
|
|
|
|
|
|
Defined contribution pension plans |
|
|
|
31 |
|
28 |
|
|
|
|
|
1,595 |
|
1,614 |
|
Share-based payments |
|
|
|
1,102 |
|
756 |
|
Total |
|
|
|
2,697 |
|
2,370 |
Aggregate gains made by Directors on the exercise of share options and warrants was £nil (2024: £nil).
28. Joint venture, subsidiary, and ultimate controlling party
The company controls 50% of the voting rights of joint venture, Speedy Hydrogen Solutions Limited, which is accounted for and disclosed in accordance with IFRS 11 Joint Arrangements. The joint venture is registered in the United Kingdom with a company number 15264396. The address of the registered office is Chase House 16 The Parks, Newton-Le-Willows, Merseyside, United Kingdom WA12 0JQ. The principal activity of the joint venture is the leasing of hydrogen fuel cells.
On 29 August 2024, the company incorporated Hyamtec Limited, the first subsidiary of the company. The subsidiary is registered in the United Kingdom with a registration number 15924441. The address of the registered office is Unit 68.3 Dunsfold Park, Cranleigh, Surrey, United Kingdom, GU6 8TB. The subsidiary is 100% owned by the company and it has not traded since incorporation. Total unpaid share capital of £100 is included within other payables on the company statement of financial position.
On 22 August 2025, the company incorporated H-Power Limited, the second subsidiary of the company. The subsidiary is registered in the United Kingdom with a registration number 16667976. The address of the registered office is Unit 68.3 Dunsfold Park, Cranleigh, Surrey, United Kingdom, GU6 8TB. The subsidiary is 100% owned by the company and it has not traded since incorporation. Total unpaid share capital of £1 is included within other payables on the company statement of financial position.
There is no ultimate controlling party.
29. Events occurring after the end of the reporting period
On 13 November 2025, the Company entered into a new lease agreement for its head office premises located at Dunsfold. The lease has a term of five years, commencing on 1 January 2026, with an annual lease charge of approximately £325,000.
This event relates to conditions that arose after the reporting date and does not provide evidence of conditions existing at 31 October 2025 . Accordingly, no adjustment has been made to the financial information for the year ended 31 October 2025.
The new lease represents a significant commitment that will impact future cash flows and operations.
|
Executive Directors |
Appointed |
Resigned |
|
BOSTOCK, Karl Robert |
20-Jan-25 |
|
|
WILSON, John Frederick |
06-Jan-25 |
|
|
BULLARD, Gary Bruce |
23-Jul-24 |
31-Jan-25 |
|
DIXON-CLARKE, Peter |
01-Dec-22 |
16-Dec-24 |
|
|
|
|
|
Non-executive Directors |
Appointed |
|
|
AGNEW, Gerald Daniel, Dr |
09-Sep-19 |
|
|
BIDDULPH, Monika, Dr |
03-Dec-21 |
|
|
BULLARD, Gary Bruce |
15-Apr-21 |
|
|
NEALE, Duncan John |
01-Aug-23 |
|
|
Company Secretary |
Appointed |
|
|
KEANE, Brendan James |
09-Oct-23 |
|
|
|
|
|
Registered Office
Unit 68.3 Dunsfold Park, CRANLEIGH, GU6 8TB
Bankers
Barclays Bank Plc, 40/41 High Street, CHELMSFORD, CM1 1BE
Lloyds Bank Plc, 77-81 High Street, CHELMSFORD, Essex, CM1 1DU
Joint Broker
Zeus Capital Limited, 82 King Street, MANCHESTER, M2 4QW
AIM Nominated Adviser and Joint Broker
Peel Hunt LLP, 100 Liverpool Street, LONDON, EC2M 2AT
Auditors and reporting accountants
Grant Thornton UK LLP, 8 Finsbury Circus, LONDON, EC2M 7EA
Financial PR Advisers
DGA Group, One Fleet Place, EC4M 7RA, London, United Kingdom
Registrars
Computershare Limited, The Pavilions, Bridgwater Road, Bristol, BS13 8AE
RNS may use your IP address to confirm compliance with the terms and conditions, to analyse how you engage with the information contained in this communication, and to share such analysis on an anonymised basis with others as part of our commercial services. For further information about how RNS and the London Stock Exchange use the personal data you provide us, please see our Privacy Policy.


Latest directors dealings
- 21 minutes ago Baronsmead Venture Trust
- 23 minutes ago Tesco
- 24 minutes ago M&G
- 33 minutes ago Heavitree Brewery
- 34 minutes ago Heavitree Brewery