Audited Results for year ended 31 December 2025
Summary by AI BETAClose X

3 March 2026
ROSEBANK INDUSTRIES PLC
("ROSEBANK" OR THE "COMPANY" OR THE "GROUP")
AUDITED RESULTS
FOR THE YEAR ENDED 31 DECEMBER 2025
ROSEBANK 2025 ADJUSTED RESULTS AHEAD OF EXPECTATIONS,
ECI MAKING STRONG OPERATIONAL PROGRESS,
CONFIDENCE IN MEDIUM-TERM TARGETS & EVALUATING FURTHER M&A
Rosebank Industries plc today announces its audited results for the year ended 31 December 2025 ("the Year"). This includes approximately four months of contribution from ECI and restates the prior period results, which were limited to the Rosebank Head office costs, to show a US Dollar presentation currency. An additional measure to guide ongoing performance, the 2025 annualised adjusted1 numbers for ECI, is also discussed below:
|
|
Adjusted1 results |
Statutory results |
||
|
|
2025 |
Seven-month period ended 31 December 2024 |
2025 |
Seven-month period ended 31 December 2024 |
|
|
$m |
$m |
$m |
$m |
|
Revenue |
445 |
- |
445 |
- |
|
Operating profit/(loss) |
57 |
(2) |
(46) |
(12) |
|
Profit/(loss) after tax |
38 |
(1) |
(48) |
(11) |
|
Diluted earnings/(loss) per share |
17.8c |
(5.7)c |
(22.6)c |
(69.1)c |
|
Net debt/(cash) |
494 |
(60) |
n/a |
n/a |
|
Bank covenant leverage |
2.4x |
n/a |
n/a |
n/a |
|
Group Highlights: |
|
|
● |
Adjusted1 operating profit was $57 million, after Rosebank central costs of $13 million. Adjusted1 diluted EPS was 17.8 cents
|
|
● |
The statutory results show revenue of $445 million and an operating loss of $46 million; adjusting1 items of $103 million related to the Group's acquisition and disposal activities, restructuring spend and other non-cash items
|
|
● |
Net debt1 was significantly lower than market expectations at $494 million. This was achieved despite unwinding costly working capital customer factoring and supplier finance arrangements, inherited with ECI, totalling over $100 million, in line with our pre-acquisition assumptions
|
|
● |
Bank covenant leverage1 at 31 December 2025 was 2.4x
|
|
● |
The intended step-up to main market remains on track for Q2 2026
|
|
● |
Rosebank is in advanced discussions regarding a possible transaction to acquire two private-equity owned US-based businesses for a headline enterprise value of approximately $3.05 billion |
|
ECI Highlights: |
|
|
● |
In the period of Rosebank ownership ECI trading was ahead of market expectations, with revenue of $445 million and adjusted1 operating profit of $70 million and an adjusted1 operating margin of 15.6%
|
|
● |
Electrification and Industrial revenue was $195 million in the period of Rosebank ownership and adjusted1 operating margin was 22.0%, up 1.0 percentage points compared to 2024
|
|
● |
Appliance and HVAC revenue was $250 million in the period of Rosebank ownership, and adjusted1 operating margin was 16.4%, up 3.7 percentage points compared to 2024
|
|
● |
Annualised unaudited adjusted1 results for ECI in 2025 includes revenue of $1,219 million (down 4% year on year), adjusted1 operating profit of $188 million (up 16% year on year), and an adjusted operating margin of 15.4% (up 2.6 percentage points)
|
|
● |
Good progress has been made since announcing an initial 24 month restructuring programme which includes reducing the number of sites by over a quarter. This will cost approximately $80 million and uplift adjusted1 operating profit by approximately $30 million, spread over the next two years
|
|
● |
ECI has actively re-engaged in the search for potential North American bolt-on acquisition opportunities for ECI, including engaging with several specific targets
|
2026 Full Year outlook:
Based on trading since the year end, current visibility and with good progress on our action plans we remain on track to meet our full year expectations in 2026.
Simon Peckham, Chief Executive of Rosebank Industries plc, today said:
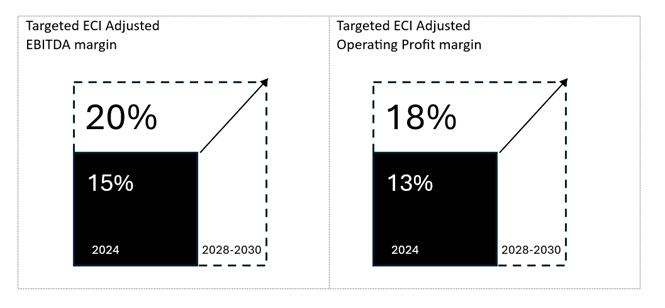
"This has been a transformational year for Rosebank with the acquisition of ECI. The early actions that we and management have taken give us further confidence that we will deliver the improvements we outlined for ECI and achieve our adjusted operating margin targets of at least 18%. For 2026, driven by actions within our control, we remain confident in the year ahead."
Notes:
1. Described in the glossary to the Preliminary Announcement and considered by the Board to be a key measure of performance.
|
Enquiries: |
|
|
Rosebank Industries plc: |
|
|
Simon Peckham |
Chief Executive |
|
Matthew Richards |
Group Finance Director |
|
|
|
|
Investor Relations: |
|
|
Chris Dyett |
+44 (0) 7974 974 690, ir@rosebankindustries.com |
|
|
|
|
Montfort Communications: |
|
|
Nick Miles |
+44 (0) 7739 701 634, miles@montfort.london |
|
Charlotte McMullen |
+44 (0) 7921 881 800, mcmullen@montfort.london |
|
|
|
|
Investec Bank plc |
+44 (0)20 7597 5970 |
|
(Nominated Advisor, Joint Broker & Financial Advisor) |
|
|
Carlton Nelson |
|
|
Christopher Baird |
|
Chairman's statement
I am pleased to present Rosebank's second set of results for the year ended 31 December 2025, covering our first full financial year since admission to trading on AIM in July 2024.
Calendar year 2025
2025 is a year in which the Group achieved a significant milestone with the acquisition of Electrical Components International, Inc ("ECI"). With results including 19 weeks of ECI ownership, we achieved statutory revenue for the Rosebank Group of $445 million, a statutory loss before tax of $51 million, and adjusted profit before tax of $52 million. Net debt was also lower than expectations at $494 million.
As planned, leverage has been materially reduced to 2.4x EBITDA, a level that has been well received by customers and suppliers and is expected to support improved trading terms. The business has also exited costly working capital customer factoring and supplier finance arrangements totalling more than $100 million, in line with Rosebank's pre-acquisition assumptions.
Further details of these results are contained in the Finance Director's review and I would like to thank all employees for their efforts in helping to produce this performance.
Possible Transaction
As announced on 16 February 2026, the Company is in advanced discussions regarding a possible transaction to acquire two private-equity owned US-based businesses (the "Potential Transaction") for a headline enterprise value of approximately $3.05 billion.
The full terms of the Potential Transaction remain confidential at this stage, however the Company notes that the Potential Transaction is fully in line with its acquisition criteria and, if it proceeds, would be funded through a combination of a fully underwritten equity issue of approximately £1.9 billion and new debt facilities. A further announcement will be made, as and when required.
Purpose, business model and strategy
Rosebank is executing its "Buy, Improve, Sell" strategy, whereby it seeks to acquire good engineering businesses with strong market positions that would benefit from an improvement in their performance, with a view to investing in those businesses and empowering their management teams to make improvements and drive value and performance to generate an above average return for shareholders and ongoing benefits for wider stakeholders. We are actively pursuing the next step in our "Buy, Improve, Sell" strategy, whether through completion of the Potential Transaction already announced or by identifying alternative acquisition opportunities that meet our criteria.
Dividend
In light of the acquisition of ECI completing late in the financial year, the Board has confirmed that there will be no final dividend for the period. The Board has since adopted a progressive dividend policy, targeting earnings cover of approximately three times adjusted diluted earnings per share, and expects to pay its first interim dividend following the announcement of our interim results in September 2026.
Governance
The Board has continued to phase implementation of the UK Corporate Governance Code following the acquisition of ECI, further details of which are set out in the Corporate Governance report.
During the year, we were pleased to welcome Fiona MacAulay as a Non-executive Director to the Board. On Fiona's appointment, Christopher Miller stepped down as Chair of the Remuneration Committee, with Fiona assuming that role. Fiona also serves as a member of the Nomination and Audit Committees.
As announced on 20 January 2026, we are looking forward to welcoming Liam Butterworth as Chief Operating Officer and Executive Director of the Board. Liam brings extensive operational and leadership experience, which will further strengthen the executive team as the Group continues to deliver on its strategic priorities. A further announcement will be made once Liam's start date has been confirmed.
The search for a suitable candidate to fill a fourth independent Non-executive Director position is underway.
Justin Dowley
Non-executive Chairman
2 March 2026
Chief Executive's review
This year has been one of disciplined execution against the strategic framework we established at admission to trading on AIM in July 2024: to replicate the highly successful "Buy, Improve, Sell" model pioneered by the Rosebank Founders and deliver long-term value for shareholders and wider stakeholders.
Electrical Components International
In August 2025, we completed the acquisition of Electrical Components International ("ECI"). Founded in 1953, ECI is a predominantly US-based, market leading manufacturing business providing critical electrical distribution systems to a range of diversified industrial end-markets. This acquisition represents Rosebank's first step in executing its strategy of acquiring quality industrial businesses with performance improvement potential and demonstrates the Company's ability to deploy capital with discipline and conviction when the right opportunity emerges.
The early phase of our ownership has been encouraging. Since our acquisition of ECI, we have moved quickly to agree a strategic plan with ECI management. The plan provides a strong framework for operational and financial improvement and is aligned with Rosebank's stated shareholder returns. Central to this plan is an initial 24-month restructuring programme, which is now well underway. The programme includes reducing the number of sites by over a quarter, migrating production to lower cost facilities, reducing central costs, and closure of the duplicate St Louis head office, which was completed in December 2025. These actions are expected to deliver a significant uplift in adjusted operating profit in the next two years.
Rosebank has also worked closely with ECI's management and their customers to ensure the full recovery of all tariffs incurred, with these amounts now being invoiced and paid, further protecting margins and earnings quality.
Further details of the trading performance of ECI are contained in the Divisional review.
Outlook
Since the acquisition of ECI, we have taken fast and effective actions to strengthen the business. Whilst end-markets for ECI are likely to remain uneven in the near term, there are early signs of recovery in the US economy more broadly and we are confident that ECI is well positioned to benefit from any improvement in market conditions through 2026 and beyond.
Rosebank remains disciplined in its capital allocation and focused on actively pursuing the next step in our "Buy, Improve, Sell" strategy. Your Board is confident in our ability to deliver a transaction that will create significant value for shareholders.

Simon Peckham
Chief Executive
2 March 2026
Electrical Components International
|
Acquired |
19 August 2025 |
|
Enterprise Value |
Approximately $1.9 billion |
|
Locations |
37 worldwide |
|
Customers |
450+ |
Rosebank completed its first acquisition, that of Electrical Components International ("ECI") on 19 August 2025, valuing ECI at an enterprise value of approximately 9x 2025 Adjusted EBITDA. The acquisition was financed through debt facilities and a fully underwritten institutional capital raise of approximately £1.14 billion.
Founded in 1953, ECI is one of the world's leading suppliers of electrical distribution systems, control box assemblies, and other critical engineered components for a range of diversified end markets ranging from HVAC, smart appliances to specialty transportation and advanced industrial tech equipment. ECI powers smart, connected, and electrified solutions that enable the most advanced technologies to solve the most complex challenges.
ECI operates through two Divisions: (1) Electrification and Industrial ("E&I") and (2) Appliance and HVAC ("A&H"), with the centrally delivered Shared Service Centre monitored as a distinct unit due to the scale and nature of its activities ("ECI Central"). E&I is focused on products for high- and low-voltage electrical distribution systems, control box assemblies, bus bars, advanced safety/high speed data assemblies, and engineered components. A&H supplies low-voltage electrical distribution systems, control box assemblies, and engineered components. Further information on each of the divisions and their performance is set out in the Divisional review.
During the period from 19 August 2025, the date on which ECI was acquired by Rosebank, to 31 December 2025 (the "Period"), restructuring activities to reduce the number of sites by over a quarter were initiated across ECI to enhance cost competitiveness and operational resilience. Looking ahead to 2026, Rosebank will work closely with ECI to continue the execution of the restructuring programme, with a focus on further optimising the businesses manufacturing footprint, simplifying its operating model and strengthening cost competitiveness.
Across ECI, the impact of newly implemented U.S. tariffs has been successfully navigated; ECI has agreed with its customers the full recovery of all tariffs, which are being invoiced and paid.
Divisional review
Electrification & Industrial ("E&I")
E&I is focused on products for high and low-voltage electrical distribution systems, control box assemblies, bus bars, advanced safety/high speed data assemblies, and engineered components in advanced industrial end markets. E&I's operations take place at 23 locations around the world, with facilities in the United States, Canada, Mexico, China, Poland, and the Philippines.
Financial information
|
Financial results 2025 |
|
|
|
$m |
|
Statutory revenue |
195 |
|
Annualised revenue |
514 |
|
Statutory operating profit |
16 |
|
Adjusted operating profit(1) |
43 |
|
Annualised adjusted operating profit(1) |
113 |
(1) Described in the glossary to the Preliminary Announcement and considered by the Board to be a key measure of performance.
|
Key strengths |
|
|
● |
Technical problem-solving capability, providing fast and practical engineering support for complex customer challenges |
|
● |
Speed to execution, enabling rapid progression from design through industrialisation and full production |
|
● |
Operational excellence, delivering superior quality and reliable on-time delivery, with products built right the first time and production schedules customers can plan around |
|
● |
Agile and flexible supply chain, allowing rapid scaling and adaptation to changing customer and market requirements |
|
● |
Global manufacturing footprint, enabling regional optimisation and support of complex, multi-geography customer programmes |
Performance
Despite broader market challenges, during the period from 19 August 2025, the date on which ECI was acquired by Rosebank, to 31 December 2025 (the "Period"), E&I delivered strong performance, with an adjusted operating profit of $43 million on sales of $195 million, resulting in an adjusted operating margin of 22% for the Period, up 1.0% compared to 2024.
Market environment and business response
During the Period, E&I continued to face soft end-market demand, with lower OEM production volumes and normalising inventory levels, resulting from stubborn top-down macro pressures including elevated inflation. The agricultural end-market also faced subdued demand, but end-markets including automation and construction are beginning to show signs of improvement, while data centre related demand remained resilient.
E&I implemented a range of commercial and operational actions to mitigate market headwinds. E&I initiated substantial cost-reduction initiatives to flex its cost structure and protect profitability. These actions have included productivity improvements, footprint optimisation, and disciplined fixed-cost management, supported by the restructuring actions taken during the Period.
Appliance & HVAC ("A&H")
The A&H Division supplies low-voltage electrical distribution systems, control box assemblies, and engineered components. Key end markets supplied within Appliance include domestic white goods as well as commercial appliances, while the HVAC segment is focused on commercial and residential applications, including cooling systems for data centers. A&H's operations take place at 14 locations around the world, with facilities in the United States, Mexico, China, Thailand, Morocco and Spain.
|
Financial results 2025 |
|
|
|
$m |
|
Statutory revenue |
250 |
|
Annualised revenue |
705 |
|
Statutory operating profit |
8 |
|
Adjusted operating profit(1) |
41 |
|
Annualised adjusted operating profit(1) |
115 |
(1) Described in the glossary to the Preliminary Announcement and considered by the Board to be a key measure of performance.
|
Key strengths |
|
|
● |
Proven track record of managing complexity at scale across both high-volume, low-mix and low-volume, high-mix production environments |
|
● |
Deep customer intimacy supported by long-standing relationships with highly reputable global OEMs |
|
● |
High service levels, consistently delivering top-quartile quality performance and on-time delivery |
|
● |
Established global manufacturing footprint enabling worldwide support and competitive solutions |
|
● |
Global purchasing scale providing cost leverage and supply continuity |
|
● |
Flexible and resilient supply chain capable of adapting to changing market and customer requirements |
Performance
During the Period, A&H delivered robust financial results despite a challenging macroeconomic environment; adjusted operating profit was $41m on sales of $250m, resulting in an adjusted operating margin of 16.4%, up 3.7% compared to 2024. With improvement plans already underway, we expect further operating margin progress through 2026.
Market environment and business response
During the Period, A&H continued to face headwinds in residential and light commercial end-markets. Lower levels of activity in the housing sector, coupled with elevated interest rates and inflationary pressures, negatively impacted demand for residential appliances and HVAC products.
In contrast, heavy commercial HVAC demand remained resilient, supported by sustained investment in data centres and commercial infrastructure, which continued to drive demand for cooling systems and related electrical assemblies. With this said, inflationary pressures across raw materials, labour, and logistics persisted throughout the Period, impacting cost structures across the value chain.
During the Period, A&H worked to pass through the inflation in its supply chain as well as driving cost reductions through engineering changes and global footprint optimisation. Operational improvements have continued to be made, with the expectation that A&H will be well placed to take advantage of any uplift in market conditions.
ECI Central
ECI also has a centrally delivered shared service centre, which operates as a distinct unit to support the A&H and E&I divisions. The adjusted operating loss for ECI Central was $14 million and the annualised adjusted operating loss was $40 million.
Finance Director's review
Rosebank's first acquisition, Electrical Components International, Inc. ("ECI"), completed on 19 August 2025. As a result, the statutory and adjusted results for the year ended 31 December 2025 include approximately four months of ECI trading. The comparative for the seven-month period ended 31 December 2024 does not include any contribution from ECI and reflects only the central costs associated with Rosebank during its pre‑acquisition phase. These differences make meaningful year‑on‑year comparisons of statutory or adjusted results difficult this year and as such, for ongoing comparisons, the annualised ECI adjusted operating results are shown below.
ROSEBANK GROUP RESULTS
Following the acquisition of ECI, the presentation currency of the Rosebank Group was changed to US Dollars, reflecting that ECI is a predominantly US based business with the majority of the Group's trading now conducted in this currency. The prior year numbers have been restated into US Dollars.
Statutory results:
The statutory results, which include approximately four months of trading for ECI, are shown on the face of the Income Statement and are audited. The statutory results show revenue of $445 million (2024: $nil), an operating loss of $46 million (2024: $12 million) and a loss before tax of $51 million (2024: $11 million). The diluted earnings per share ("EPS"), calculated using the weighted average number of shares in issue during the year of 213.1 million, was a loss of 22.6 cents (2024: loss of 69.1 cents).
Adjusted results:
The adjusted results are shown on the face of the Income Statement and are audited. They are adjusted to exclude certain items which are significant in size or volatility or by nature are non-trading or non-recurring. It is Rosebank's accounting policy to exclude these items from the adjusted results, which are used as an Alternative Performance Measure ("APM") as described by the European Securities and Markets Authority ("ESMA").
The Board considers the adjusted results to be an important measure used to monitor how the businesses are performing as they achieve consistency and comparability between reporting periods when all businesses are held for the complete reporting period.
The adjusted results in the year ended 31 December 2025 show revenue of $445 million (2024: $nil), an operating profit of $57 million (2024: loss of $2 million) and a profit before tax of $52 million (2024: loss of $1 million). Adjusted diluted EPS, calculated using the weighted average number of shares in issue during the year was 17.8 cents (2024: loss of 5.7 cents).
The description of adjusting items and a reconciliation of the statutory results to the adjusted results is discussed later in this review.
Annualised adjusted results for ECI:
Annualised adjusted results reflect a full year ownership of ECI along with the impact of the fair value process and IFRS conversion from 1 January 2025. The Board believes that the annualised adjusted results for ECI give a meaningful measure of annualised performance to guide ongoing results of the Group.
Annualised adjusted results for ECI in the year ended 31 December 2025 are unaudited and show revenue of $1,219 million and operating profit of $188 million.
STATUTORY, ADJUSTED AND ANNUALISED ADJUSTED RESULTS BY REPORTING SEGMENT
The following table shows revenue split by reporting segment for statutory and annualised revenue:
|
|
Electrification & Industrial $m |
Appliance & HVAC $m |
Total $m |
|
Statutory revenue |
195 |
250 |
445 |
|
ECI revenue (1 January to 18 August) |
319 |
455 |
774 |
|
Annualised revenue |
514 |
705 |
1,219 |
The following table shows operating profit/(loss) split by reporting segment. Adjusting items are described later in this review.
|
|
Electrification & Industrial $m |
Appliance & HVAC $m |
ECI Central $m |
ECI Total $m |
Corporate $m |
Rosebank $m |
|
Statutory operating profit/(loss) |
16 |
8 |
10 |
34 |
(80) |
(46) |
|
Reconciling item: |
|
|
|
|
|
|
|
Adjusting items |
27 |
33 |
(24) |
36 |
67 |
103 |
|
Adjusted operating profit/(loss) |
43 |
41 |
(14) |
70 |
(13) |
57 |
|
ECI operating profit/(loss) (1 January to 18 August) |
70 |
74 |
(26) |
118 |
- |
118 |
|
Annualised adjusted operating profit/(loss) |
113 |
115 |
(40) |
188 |
(13) |
175 |
The performance of ECI and its segments is discussed in the Chief Executive's review.
RECONCILIATION OF STATUTORY RESULTS TO ADJUSTED RESULTS
The following table reconciles the statutory operating loss to adjusted operating profit:
|
|
2025 $m |
2024 $m |
|
Statutory operating loss |
(46) |
(12) |
|
|
|
|
|
Adjusting items: |
|
|
|
Acquisition and disposal costs, including associated transaction taxes |
55 |
5 |
|
Amortisation of intangible assets acquired in business combinations |
29 |
- |
|
Currency movements in derivatives and associated financial assets and liabilities |
(25) |
- |
|
Reversal of IFRS 3 uplift in the fair value of inventory |
23 |
- |
|
Equity-settled compensation scheme charges |
12 |
5 |
|
Restructuring costs |
9 |
- |
|
|
|
|
|
Adjustments to statutory operating loss |
103 |
10 |
|
|
|
|
|
Adjusted operating profit/(loss) |
57 |
(2) |
Adjusting items to statutory operating loss in the year include:
Acquisition and disposal costs of $55 million (2024: $5 million) which include general transaction fees and associated transaction taxes along with a loss of $11 million on a contingent hedge, taken out on the announcement of the ECI transaction to mitigate the foreign exchange risk on equity proceeds in advance of the acquisition. These items are excluded from adjusted results due to their non-trading nature.
The amortisation charge in the year of $29 million (2024: $nil) which included approximately four months of amortisation of intangible assets acquired with ECI. This is excluded from adjusted results due to its non-trading nature and to enable comparison with companies that grow organically. Where intangible assets are trading in nature, such as computer software and development costs, the amortisation is not adjusted.
Movements in the fair value of derivative financial instruments primarily related to forward foreign currency exchange contracts, where hedge accounting is not applied, along with foreign exchange movements on the associated financial assets and liabilities. These instruments are entered into to mitigate the potential volatility of future cash flows and totalled a credit of $25 million (2024: $nil). These are shown as an adjusting item due to their volatility and size.
The uplift in finished goods and work in progress inventory which are present in an acquired business, to a value closer to their selling price, in accordance with IFRS 3. As a result, in the early months of an acquisition, reduced profits are generated as this inventory is sold. The one-off effect in the year, relating to ECI acquired inventory, was a charge of $23 million (2024: $nil) and is excluded from adjusted results due to its size and non-recurring nature.
The charge for the Rosebank equity-settled Incentive Scheme of $12 million (2024: $5 million), including its associated employer's tax charge, which is excluded from adjusted results due to its size and volatility. The shares that would be issued, based on the Scheme's current value at the end of the reporting period, are included in the calculation of the adjusted diluted earnings per share, which the Board considers to be a key measure of performance.
Restructuring and other associated costs totalling $9 million (2024: $nil), which are shown as adjusting items due to their size and non-trading nature. The charge related to the ECI multi-year restructuring programme, which will reduce the number of sites by over a quarter, impacts both the Appliance & HVAC and Electrification & Industrial divisions. This is expected to cost c.$80 million in total, primarily relating to actions over the next two years.
FINANCE COSTS AND INCOME
The net finance costs in the year ended 31 December 2025 were $5 million (2024: finance income of $1 million).
The Group was in a net cash position in the first half of the year and held equity proceeds of approximately $1.6 billion for two months prior to the acquisition of ECI on 19 August 2025, before drawing down on the Group's bank facility to fund the ECI deal.
Net interest on external bank loans, overdrafts and cash balances was $2 million (2024: income of $1 million). In addition, finance charges included a $1 million (2024: $nil) amortisation charge relating to the arrangement costs of raising the bank facility, and $2 million (2024: $nil) in respect of an interest charge on lease liabilities.
TAX
The statutory results show a tax credit of $3 million (2024: $nil) which arises on a statutory loss before tax of $51 million (2024: $11 million), resulting in a statutory tax rate of 6% (2024: nil%). This rate is lower than the adjusted effective tax rate because many of the adjusting items, discussed earlier in this review, do not give rise to tax deductions.
The effective tax rate on the adjusted profit before tax for the year ended 31 December 2025 was 27% (2024: nil%).
At 31 December 2025 the Group has gross deferred tax liabilities of $311 million (31 December 2024: $nil) of which $292 million is in respect of intangible assets and $19 million in respect of other liabilities. In accordance with IAS 12, these are offset on the Balance Sheet against gross deferred tax assets of $136 million (2024: $nil) which includes $63 million arising from disallowed interest expenses which may be deductible in subsequent periods, $33 million in respect of tax losses and $40 million in respect of other deductible temporary differences that may generate future cash tax savings. The unwind of the deferred tax liabilities on intangible assets is not expected to give rise to cash tax payments.
Cash tax paid in the year ended 31 December 2025 was $2 million (2024: $nil).
NUMBER OF SHARES IN ISSUE
On 3 July 2025, 386.6 million shares were issued at a share price of £3.00, raising equity proceeds of approximately £1.16 billion, increasing the number of shares in issue from 20 million to 406.6 million.
The weighted average number of shares used for basic earnings per share calculations in the year ended 31 December 2025 was 212.8 million (2024: 16.2 million), and when including the number of shares expected to be issued from the Rosebank equity‑settled share plan, the weighted average number of shares used for diluted earnings per share, was 213.1 million (2024: 16.2 million).
CASH GENERATION AND MANAGEMENT
At the start of the year the Rosebank Group held cash and cash equivalents of $60 million. The movement during the year to a net debt position of $494 million at 31 December 2025 is summarised as follows:
|
Movement in Group net cash/(debt) |
|
$m |
|
Net cash at 1 January 2025 |
|
60 |
|
Acquired net debt with ECI(1) |
|
(960) |
|
Net repayment, on acquisition, of the ECI net debt |
|
475 |
|
Foreign exchange and other non-cash movements |
|
8 |
|
Free cash flow (after all costs including tax) |
|
(77) |
|
Net debt at 31 December at closing exchange rates |
|
(494) |
|
(1) Bank debt less cash. |
|
|
When ECI was acquired it had $960 million of net debt. This included loans and borrowings of $996 million, which was repaid and replaced by the new Rosebank bank facility, described in the liquidity risk management sub-section of this review, and cash in the business of $36 million. In total, on acquisition, ECI net debt was reduced by $475 million using part of the issue proceeds received on 3 July 2025, as follows:
|
Net repayment, on acquisition, of the ECI net debt |
|
$m |
|
Net proceeds from issue of shares (received at hedged rate of $1.352/£1) |
|
1,568 |
|
Cash payment to acquire ECI |
|
(1,009) |
|
Acquisition related payments |
|
(84) |
|
Movement in net debt in funding the acquisition |
|
475 |
Included in the acquisition related payments, is $11 million relating to debt facility financing fees incurred and capitalised in accordance with IFRS 9 and shown in other non-cash movements in net cash/(debt) in the year, net of a $1 million amortisation charge.
An analysis of the free cash flow (after all costs) is shown in the table below:
|
Free cash flow (after all costs) |
2025 $m |
2024 $m |
|
Adjusted operating profit/(loss) |
57 |
(2) |
|
Depreciation and amortisation |
11 |
- |
|
Working capital movement - normal trading |
- |
- |
|
Working capital movement - one-off unwind of working capital programmes |
(122) |
- |
|
Net capital expenditure |
(7) |
- |
|
Net interest and net tax paid |
(3) |
1 |
|
Restructuring |
(10) |
- |
|
Principal lease payments |
(4) |
- |
|
Net other |
1 |
- |
|
Free cash flow (after all costs) |
(77) |
(1) |
|
Adjusted free cash flow(1) |
55 |
(1) |
(1) Adjusting for restructuring spend and the unwind of working capital programmes inherited with ECI.
The free cash outflow in the year (after all costs) of $77 million is shown after the planned unwind of costly working capital programmes inherited with ECI, totalling $122 million, and after cash spent on restructuring projects of $10 million (2024: $nil).
At the acquisition date ECI had drawings of $115 million on customer related financing programmes and offered supply chain finance programmes to certain suppliers totalling $38 million, of which ECI bore the interest cost on $14 million of the balance.
The Group's intention was to exit customer related finance programmes where appropriate, and to only allow suppliers to utilise the Group's supply chain finance programmes where the cost is borne by the supplier. At 31 December 2025, the drawings on customer related finance programmes had been reduced to $7 million and $16 million of the supply chain finance programmes were utilised, all funded by suppliers.
The restructuring activities are described earlier in this review, in the reconciliation of statutory results to adjusted results section.
Adjusted free cash flow was $55 million and excludes the exit of costly working capital programmes, discussed above, in addition to the cash spent on restructuring.
Net capital expenditure spent in the period of ownership was $7 million (2024: $nil), net interest paid in the year was $1 million (2024: received of $1 million), tax paid was $2 million (2024: $nil) and lease payments of principal were $4 million (2024: $nil).
FAIR VALUE EXERCISE - ASSETS AND LIABILITIES
Following the acquisition of ECI, in accordance with IFRS 3, Rosebank has undertaken an extensive review of ECI's assets, liabilities and accounting policies. This, along with the change from reporting under US GAAP to IFRS, has resulted in certain adjustments to the ECI Balance Sheet.
Acquisition related intangible assets have been identified in respect of Customer Relationships and Brands and have been independently valued on acquisition at $1,229 million. A deferred tax liability of $300 million was also recognised in respect of the ECI intangible assets, which is not expected to give rise to a cash liability.
In addition to the independent valuations, external advisers carried out a comprehensive series of visits to all ECI sites to perform Balance Sheet reviews line by line. These reviews identified a number of required adjustments, in particular in respect of net working capital and provisions.
Further to a fair value review of all ECI assets and liabilities at the acquisition date and a review of the accounting policies, Rosebank has undertaken significant actions to improve the operational and financial nature of ECI, discussed further in the Chief Executive's review.
The summarised Rosebank Group assets and liabilities at 31 December are shown below:
|
|
2025 $m |
2024 $m |
|
Goodwill and intangible assets acquired with business combinations |
1,995 |
- |
|
Tangible fixed assets |
117 |
1 |
|
Net working capital |
223 |
(5) |
|
Provisions, pensions and post-employment obligations |
(49) |
- |
|
Deferred tax and current tax |
(207) |
- |
|
Net other |
(15) |
(1) |
|
Total |
2,064 |
(5) |
These assets and liabilities are funded by:
|
|
2025 $m |
2024 $m |
|
Net debt |
(494) |
60 |
|
Equity |
(1,570) |
(55) |
|
Total |
(2,064) |
5 |
GOODWILL, INTANGIBLE ASSETS AND IMPAIRMENT REVIEW
The total value of goodwill as at 31 December 2025 was $794 million (31 December 2024: $nil) and intangible assets acquired with business combinations was $1,201 million (31 December 2024: $nil). These items both relate to the ECI acquisition and are split by division as follows:
|
31 December 2025 |
Electrification & Industrial $m |
Appliance & HVAC $m |
Total $m |
|
Goodwill |
562 |
232 |
794 |
|
Intangible assets acquired with business combinations |
597 |
604 |
1,201 |
|
Total goodwill and intangible assets |
1,159 |
836 |
1,995 |
The goodwill and intangible assets have been tested for impairment as at 31 October 2025. In accordance with IAS 36 "Impairment of assets" the recoverable amount is assessed as being the higher of the fair value less costs to sell and the value in use.
The Board is comfortable that no impairment is required in respect of the goodwill and intangible assets of the recently acquired ECI businesses.
PROVISIONS, PENSIONS AND POST-EMPLOYMENT OBLIGATIONS
At 31 December 2025 provisions of $39 million primarily related to those recognised with the acquisition of ECI. Litigation provisions of $22 million include $15 million relating to a historical claim for which a contingent liability has been booked, required under IFRS 3. Property related provisions totalled $12 million and warranty and other smaller provisions totalled $5 million.
Pension and post-employment obligations at 31 December 2025 were $10 million (31 December 2024: $nil) primarily relating to the post-employment obligations in Mexico, accounted for using IAS 19 Revised: "Employee Benefits".
FINANCIAL RISK MANAGEMENT
The financial risks the Group faces were considered and re-evaluated following the acquisition of ECI and policies have been implemented to appropriately deal with each risk. The most significant financial risks are considered to be liquidity risk, finance cost risk, exchange rate risk, contract and warranty risk and commodity cost risk.
These are discussed in turn below.
Liquidity risk management
The Group's net debt position at 31 December 2025 was $494 million (31 December 2024: cash balance of $60 million).
A multi-currency committed, $900 million bank facility was entered into on 1 July 2025 to assist with the acquisition of ECI, comprising a $400 million term loan and a $500 million revolving credit facility, both with a duration of three years, but with two optional one year extensions, at the Company's discretion, in respect of the revolving credit facility.
At 31 December 2025 the term loan was fully drawn and $127 million was drawn on the revolving credit facility, leaving headroom of $373 million on the facility. There are also a number of uncommitted overdraft, guarantee and borrowing facilities made available to the Group.
Cash, deposits and marketable securities, net of overdraft facilities, amounted to $23 million at 31 December 2025 (31 December 2024: $60 million) and are offset to arrive at the Group net debt position of $494 million (31 December 2024: cash of $60 million). The combination of this cash and the headroom on the bank facility allows the Directors to consider that the Group has sufficient access to liquidity for its current needs. The Board takes careful consideration of counterparty risk with banks when deciding where to place cash on deposit.
The bank facility has two financial covenants being a net debt to adjusted EBITDA covenant and an interest cover covenant, both of which are tested half yearly in June and December, with the exception that the first testing date for both covenants is 30 June 2026.
The first net debt to adjusted EBITDA covenant test is set at 4.0x at 30 June 2026, reducing by 0.25x each half year down to 3.50x at 30 June 2027 and for the remainder of the term. If calculated at 31 December 2025, leverage for bank purposes would have been 2.4x.
The first interest cover covenant is set at 3.0x at 30 June 2026. It increases to and remains at 3.50x from 31 December 2026 and if tested at 31 December 2025 would have been 17.5x, impacted by the interest received on the equity proceeds during the year.
The Group inherited certain uncommitted working capital programmes with the acquisition of ECI. These included customer finance programmes, totalling $115 million, that provide favourable financing terms on eligible customer receipts, with the ability to choose whether to receive payment earlier than the normal due date on a non-recourse basis. The Group's intention at acquisition was to unwind these programmes to the extent possible and consequently drawings on these facilities at 31 December 2025 were $7 million.
In addition, some suppliers have access to utilise the Group's supplier finance programmes, which are provided by a number of the Group's banks. At acquisition there were drawings on these facilities of $38 million, which was intentionally reduced to $16 million as at 31 December 2025.
Finance cost risk management
The bank margin on the bank facility depends on the Group leverage, and ranges from 0.90% to 2.50% on the term loan, and 1.30% to 2.90% on the revolving credit facility. As at 31 December 2025 the margin was 1.70% on the term loan and 2.10% on the revolving credit facility.
The policy of the Board is to hedge approximately 70% of the interest rate exposure of the Group. On 15 January 2026 the Group entered into interest rate swaps to be in line with Group policy. Under the terms of these swap arrangements and excluding the bank margin, the Group will pay a weighted average fixed cost of approximately 3.41% until the swaps terminate on 18 August 2028.
The average cost of the debt for the Group is expected to be approximately 6.0% (excluding the amortisation of debt arrangement fees) over the next 12 months.
Exchange rate risk management
The Group trades in various countries around the world and is exposed to movements in a number of foreign currencies. The Group therefore carries exchange rate risk that can be categorised into three types: transaction, translation and acquisition and disposal related risk, as described in the paragraphs below. The Rosebank policy is designed to protect against the majority of the cash risks but not the non-cash risks.
The most common exchange rate risk is the transaction risk the Group takes when it invoices a customer or purchases from suppliers in a different currency to the underlying functional currency of the business. The Rosebank policy is to review transactional foreign exchange exposures and place contracts quarterly on a rolling basis. To the extent the cash flows associated with a transactional foreign exchange risk are committed Rosebank will hedge 100%. For forecast cash flows, Rosebank hedges a proportion of the expected cash flows, with the percentage being hedged lowering as the time horizon lengthens. Typically, the Group hedges around 90% of foreign exchange exposures expected over the next twelve months and approximately 60% to 70% of exposures expected between twelve and twenty-four months and 35% to 45% between twenty-five and thirty-six months. This policy does not eliminate the cash risk but does bring some certainty to it.
The translation rate risk is the effect on the Group results in the period due to the movement of exchange rates used to translate foreign results into US Dollars from one period to the next. No specific exchange instruments are used to protect against the translation risk because it is a non-cash risk to the Group.
Lastly, and potentially most significantly for Rosebank, exchange rate risk arises when a business that is predominantly based in a currency other than Sterling, is either acquired or disposed. The equity proceeds raised from and capital returned to shareholders carries an exchange rate risk on conversion to or from a foreign currency to Sterling. Protection against this risk is considered on a case-by-case basis.
Both the transactional and translational foreign exchange exposures are immaterial in the short term. Transactional foreign exchange exposure is largely mitigated through the Groups hedging strategy with short term coverage of 90% and, whilst the Group trades in various countries around the world, the majority of its results are denominated in US Dollar limiting the translational foreign exchange impact.
In addition, the Group's net debt at 31 December 2025 is predominantly US Dollars and therefore the impact from foreign exchange currency movements is minimal.
Contract and warranty risk management
Under Rosebank management a robust bid and contract management process exists in the businesses, which includes thorough reviews of contract terms and conditions, contract-specific risk assessments and clear delegation of authority for approvals. These processes aim to ensure effective management of risks associated with complex contracts. The financial risks connected with contracts and warranties include the consideration of commercial, legal and warranty terms and their duration, which are all considered carefully by the businesses and Rosebank centrally before being entered into.
Commodity risk management
The cumulative expenditure on commodities is important to the Group and under Rosebank management the risk of base commodity costs increasing is mitigated, wherever possible, by passing on the cost increases to customers or by having suitable purchase agreements with suppliers which fix the price over a future period. These risks are also managed through sourcing policies, including the use of multiple suppliers, where possible, and procurement contracts where prices are agreed in advance to limit exposure to price volatility. On occasion, Rosebank does enter into financial instruments on commodities when this is considered to be the most efficient way of protecting against price movements.
GOING CONCERN
The Rosebank Group's business activities, together with the factors likely to affect its future development, performance and position are set out in the Chief Executive's review. In addition, the Consolidated Financial Statements include details of the Rosebank Group's borrowing facilities and hedging activities along with the processes for managing its exposures to liquidity risk, finance cost risk, exchange rate risk, contract and warranty risk and commodity cost risk.
The Rosebank Group has a strong cash management focus, and, as a consequence, the Directors believe that the Rosebank Group is well placed to manage its business risks successfully despite the more uncertain economic environment.
After making enquiries, the Directors have a reasonable expectation that the Rosebank Group has adequate resources to continue in operational existence for the foreseeable future. For this reason, they continue to adopt the going concern basis in preparing the Financial Statements.

Matthew Richards
Group Finance Director
2 March 2026
Cautionary statement
This announcement contains statements that are, or may be deemed to be "forward-looking statements". These forward-looking statements may be identified by the use of forward-looking terminology, including the terms "believes", "estimates", "plans", "projects", "anticipates", "potential", "predicts", "expects", "intends", "may", "will", "can", "likely" or "should" or, in each case, their negative or other variations or comparable terminology, or by discussions of strategy, plans, objectives, goals, future events or intentions. Forward-looking statements may and often do differ materially from actual results. Any forward-looking statements reflect the Company's current view with respect to future events and are subject to risks relating to future events and other risks, uncertainties and assumptions relating to the business, results of operations, financial position, liquidity, prospects, growth and strategies of the Group. Forward-looking statements speak only as of the date they are made.
In light of these risks, uncertainties and assumptions, the events in the forward-looking statements may not occur or the Company's or the Group's actual results, performance or achievements of the Company might be materially different from the expected results, performance or achievements expressed or implied by such forward-looking statements. Forward-looking statements contained in this announcement speak only as at the date of this announcement. The Company expressly disclaims any obligation or undertaking to update these forward-looking statements contained in this announcement to reflect any change in their expectations or any change in events, conditions, or circumstances on which such statements are based unless required to do so by applicable law, the Listing Rules and the Disclosure Guidance and Transparency Rules of the FCA or Regulation (EU) 596/2014 as it forms part of the domestic law of the United Kingdom by virtue of the European Union (Withdrawal) Act 2018. Some financial and other numerical data in this announcement has been rounded and, as a result, the numerical figures shown as totals may vary slightly from the exact arithmetic aggregation of the figures that precede them.
CONSOLIDATED INCOME STATEMENT
|
Notes |
Year ended |
Restated(1) seven month period ended |
|
|
Revenue Cost of sales |
3
|
445 (340) |
- - |
|
Gross profit Net operating expenses |
|
105 (151) |
- (12) |
|
Operating loss |
3,4 |
(46) |
(12) |
|
Finance costs Finance income |
|
(15) 10 |
- 1 |
|
Loss before tax Tax |
5 |
(51) 3 |
(11) - |
|
Loss after tax for the period |
|
(48) |
(11) |
|
Attributable to: Owners of the parent |
|
(48) |
(11) |
|
|
|
(48) |
(11) |
|
Earnings per share - Basic - Diluted |
6 6 |
(22.6)c (22.6)c |
(69.1)c (69.1)c |
|
Adjusted(2) results |
|
|
|
|
Adjusted operating profit/(loss) Adjusted profit/(loss) before tax Adjusted profit/(loss) after tax Adjusted basic earnings per share Adjusted diluted earnings per share |
3,4 4 4 6 6 |
57 52 38 17.9c 17.8c |
(2) (1) (1) (5.7)c (5.7)c |
(1) Restated for the change in presentation currency (see note 1).
(2) Defined in note 2.
CONSOLIDATED STATEMENT OF COMPREHENSIVE INCOME
|
|
Notes |
Year ended |
Restated(1) seven month period ended |
|
Loss after tax for the year |
|
(48) |
(11) |
|
Items that will not be reclassified subsequently to the Income Statement: Net remeasurement loss on retirement benefit obligations |
|
(1) |
- |
|
Items that may be reclassified subsequently to the Income Statement: Exchange differences on translation of foreign operations Income tax charge relating to items that may be reclassified |
5 |
(1)
4 (1) |
-
(2) - |
|
|
|
3 |
(2) |
|
Other comprehensive income/(expense) for the period |
|
2 |
(2) |
|
Total comprehensive expense for the period |
|
(46) |
(13) |
|
Attributable to: Owners of the parent |
|
(46) |
(13) |
|
|
|
(46) |
(13) |
(1) Restated for the change in presentation currency (see note 1).
CONSOLIDATED STATEMENT OF CASH FLOWS
|
|
Notes |
Year ended |
Restated(1) seven month period ended |
|
Operating activities Net cash used in operating activities(2) |
9 |
(106) |
(2) |
|
Net cash used in operating activities |
|
(106) |
(2) |
|
Investing activities Purchase of property, plant and equipment Proceeds from disposal of property, plant and equipment Acquisition of subsidiaries, net of cash acquired(3) Interest received |
|
(8) 1 (973) 10 |
- - - 1 |
|
Net cash (used in)/from investing activities |
|
(970) |
1 |
|
Financing activities Cash proceeds from issuing shares Associated costs from issuing shares Repayment of borrowings Drawings on borrowing facilities Costs of raising debt finance Repayment of principal under lease obligations Interest paid on loans and borrowings Interest paid on lease obligations |
|
1,579 (29) (1,020) 537 (11) (4) (9) (2) |
65 (2) - - - - - - |
|
Net cash from financing activities |
|
1,041 |
63 |
|
Net (decrease)/increase in cash and cash equivalents, net of bank overdrafts Cash and cash equivalents, net of bank overdrafts at the beginning of the year Effect of foreign exchange rate changes |
9 9 |
(35) 60 (2) |
62 - (2) |
|
Cash and cash equivalents, net of bank overdrafts at the end of the year |
9 |
23 |
60 |
(1) Restated for the change in presentation currency (see note 1).
(2) Includes the impact from the unwind of acquired customer factoring arrangements of $108 million.
(3) Comprises consideration of $1,009 million, net of cash and cash equivalents acquired of $36 million (see note 7).
As at 31 December 2025, the Group had net debt of $494 million (31 December 2024: net cash of $60 million). A definition and reconciliation of the movement in net debt is shown in note 9.
CONSOLIDATED BALANCE SHEET
|
|
Notes |
31 December |
Restated(1) 31 December |
|
Non-current assets Goodwill and other intangible assets Property, plant and equipment Derivative financial assets |
|
1,995 117 34 |
- 1 - |
|
|
|
2,146 |
1 |
|
Current assets Inventories Trade and other receivables Derivative financial assets Current tax assets Cash and cash equivalents |
|
163 283 28 4 35 |
- - - - 60 |
|
|
|
513 |
60 |
|
Total assets |
3 |
2,659 |
61 |
|
Current liabilities Trade and other payables Interest-bearing loans and borrowings Lease obligations Derivative financial liabilities Current tax liabilities Provisions |
8 |
223 12 12 4 36 5 |
5 - - - - - |
|
|
|
292 |
5 |
|
Net current assets |
|
221 |
55 |
|
Non-current liabilities Interest-bearing loans and borrowings Lease obligations Derivative financial liabilities Deferred tax liabilities Retirement benefit obligations Provisions |
8 |
517 60 1 175 10 34 |
- 1 - - - - |
|
|
|
797 |
1 |
|
Total liabilities |
3 |
1,089 |
6 |
|
Net assets |
|
1,570 |
55 |
|
Equity Issued share capital Translation reserve Retained earnings |
|
1,613 1 (44) |
63 (2) (6) |
|
Equity attributable to owners of the parent |
|
1,570 |
55 |
|
Total equity |
|
1,570 |
55 |
(1) Restated for the change in presentation currency (see note 1).
The Financial Statements were approved and authorised for issue by the Board of Directors on 2 March 2026 and were signed on its behalf by:
|
Simon Peckham |
Matthew Richards |
|
|
|
|
Chief Executive |
Group Finance Director |
|
2 March 2026 |
2 March 2026 |


CONSOLIDATED STATEMENT OF CHANGES IN EQUITY
|
|
Issued share capital $m |
Translation reserve $m |
Retained earnings $m |
Equity attributable to owners $m |
|
Restated at 31 May 2024(1) |
- |
- |
- |
- |
|
Loss for the year Other comprehensive expense |
- - |
- (2) |
(11) - |
(11) (2) |
|
Total comprehensive expense Issue of new shares net of costs paid Equity-settled share-based payments |
- 63 - |
(2) - - |
(11) - 5 |
(13) 63 5 |
|
Restated at 31 December 2024(1) |
63 |
(2) |
(6) |
55 |
|
Loss for the year Other comprehensive income/(expense) |
- - |
- 3 |
(48) (1) |
(48) 2 |
|
Total comprehensive income/(expense) Issue of new shares net of costs paid Equity-settled share-based payments |
- 1,550 - |
3 - - |
(49) - 11 |
(46) 1,550 11 |
|
At 31 December 2025 |
1,613 |
1 |
(44) |
1,570 |
(1) Restated for the change in presentation currency (see note 1).
Further information on issued share capital and reserves is set out in note 1.
NOTES TO THE FINANCIAL STATEMENTS
1. Corporate information
The financial information included within this Preliminary Announcement does not constitute the statutory accounts of Rosebank Industries plc ("the Company") for the year ended 31 December 2025 but is derived from those accounts. Statutory accounts for the year ended 31 December 2025 will be delivered in due course to the registrar of companies with the Jersey Financial Statements Commission ("JSFC"). The auditor has reported on those Financial Statements; their reports were unqualified, did not draw attention to any matters by way of emphasis and did not contain a statement under section 113B (3) or (6) of the Companies (Jersey) Law 1991.
Whilst the financial information included in this Preliminary Announcement has been prepared on the basis of the requirements of International Financial Reporting Standards as issued by the IASB ("IFRS"), this announcement does not itself contain sufficient information to comply with IFRS. The Company expects to publish full Financial Statements that comply with IFRS during April 2026.
Rosebank Industries plc is a public listed group incorporated in Jersey. The Group's shares are traded on AIM. The Group is required under AIM rule 19 to provide shareholders with audited consolidated financial statements. The Group is not required to present parent company information.
The registered office address of Rosebank Industries plc is 26 New Street, St Helier, Jersey JE2 3RA.
Acquisition of ECI
On 19 August 2025 the Group acquired 100% of the issued share capital and obtained control of ECI Equity Holding Company, Inc. ("ECI") for consideration of $1,009 million (see note 7). ECI is one of the world's leading suppliers of electrical distribution systems, control box assemblies, and other critical engineered components for a range of diversified end markets ranging from consumer appliances to smart industrial equipment.
Capital structure
On 11 July 2024 the shares of the Company were admitted to trading on AIM, a market operated by the London Stock Exchange plc. In addition to the 2 shares issued at incorporation on 31 May 2024, the Company allotted a further 19,999,998 ordinary shares of nil par value at 250 pence each, which resulted in a placed share capital balance of $63 million, being proceeds received of $65 million, net of associated costs of $2 million.
On 3 July 2025, 386,607,653 shares were issued of nil par value for 300 pence each to finance the acquisition of ECI, which resulted in a placed share capital balance of $1,550 million, being proceeds received of $1,579 million, net of associated costs of $29 million.
Change in reporting currency
During the year, the presentation currency of the Group was changed from pounds Sterling (£) to US Dollar ($). This decision was made to better align the Group's financial reporting with its principal business activities following the acquisition of ECI. As a result of this acquisition, a significant majority of the Group's revenues, expenses, and assets are denominated in, or linked to, the US Dollar. The Board believes this change will provide investors and other stakeholders with greater transparency and a more relevant view of the Group's future focus, performance and financial position, while also reducing the impact of foreign exchange volatility on reported results.
Going concern
The Consolidated Financial Statements have been prepared on a going concern basis as the Directors consider that adequate resources exist for the Company to continue in operational existence for the foreseeable future.
The Group's liquidity and funding arrangements are described in the Finance Director's review. There is significant liquidity headroom of $373 million at 31 December 2025 and sufficient headroom throughout the going concern forecast period. Forecast covenant compliance is considered further below.
Covenants
The committed bank funding has two financial covenants, being a net debt to Adjusted EBITDA covenant and an interest cover covenant, both of which are normally tested half yearly in June and December. Testing was not required for either financial covenant at 31 December 2025.
From 30 June 2026, the date of its first test, the interest cover covenant is set at 3.0x and the net debt to adjusted EBITDA is 4.0x at the same test date. Covenant calculations are detailed in the glossary to this Preliminary Announcement. The financial covenants during the period of assessment for going concern are as follows:
|
|
31 December 2025 |
30 June 2026 |
31 December 2026 |
|
Net debt to adjusted EBITDA |
n/a |
4.0x |
3.75x |
|
Interest cover |
n/a |
3.0x |
3.5x |
Testing
The Group has modelled two scenarios in its assessment of going concern; a base case and a reasonably possible sensitised case.
The base case takes into account end markets and operational factors, throughout the going concern period and has been monitored against the actual results and cash generation in the year. Climate scenario analysis was used to model the impact of climate change on the Group's cash flow position. Climate is deemed to not have a material impact over the period of 12 months for the assessment of going concern or 36 months for assessment of viability of the Group.
The reasonably possible sensitised case models more conservative sales assumptions for 2026 and the first half of 2027. The sensitised assumptions are specific to each segment taking into account their markets, but on average represents a c.10% reduction to the Group's forecast revenue in each of 2026 and the first half of 2027 respectively. The sensitised revenues have had a consequential impact on profit and cash flow, along with a further downside sensitivity applied to increase working capital by approximately 2% of revenue. Given that there is liquidity headroom of $373 million and the Group's leverage for bank covenant purposes was 2.4x, comfortably below the first covenant test at 30 June 2026, no further sensitivity detail is provided.
Under the reasonably possible sensitised case, even with significant reductions, no covenant is breached at the forecast testing dates being 30 June 2026 and 31 December 2026, and the Group will not require any additional sources of finance. Testing at 30 June 2027 is also favourable.
The Group has sufficient headroom to continue its acquisition-led strategy even under the reasonably possible scenario.
2. Alternative performance measures
The Group presents Alternative Performance Measures ("APMs") in addition to the statutory results of the Group. These are presented in accordance with the Guidelines on APMs issued by the European Securities and Markets Authority ("ESMA").
APMs used by the Group are set out in the glossary to this Preliminary Announcement and the reconciling items between statutory and adjusted results are listed below and described in more detail in note 4.
Adjusted profit measures exclude items which are significant in size or volatility or by nature are non-trading or non-recurring.
On this basis, the following are the principal items included within adjusting items impacting operating profit and profit before tax:
|
● |
Amortisation of intangible assets that are acquired in a business combination, excluding computer software and development costs; |
|
● |
Significant restructuring project costs and other associated costs, including losses incurred following the announcement of closure for identified businesses, arising from significant strategy changes that are not considered by the Group to be part of the normal operating costs of the business; |
|
● |
Movement in derivative financial instruments not designated in hedging relationships, including revaluation of associated financial assets and liabilities; |
|
● |
Reversal of IFRS 3 uplift in fair value of inventory recorded on acquisition; |
|
● |
The net release of fair value items booked on acquisition; |
|
● |
Acquisition and disposal related gains and losses including such costs incurred during acquisition and disposal processes that do not materialise; and |
|
● |
The charge for the Rosebank equity-settled compensation scheme, including its associated employer's tax charge. |
In addition to the items above, adjusting items impacting profit after tax include:
|
● |
The tax effects of adjustments to profit before tax. |
|
● |
The net effect on tax of significant restructuring from strategy changes that are not considered by the Group to be part of the normal operating costs of the business. |
The Board considers the adjusted results to be an important measure used to monitor how the businesses are performing as this provides a meaningful reflection of how the businesses are managed and measured on a day-to-day basis and achieves consistency and comparability between future reporting periods, when all businesses are held for a complete reporting period.
The adjusted measures are used partly to determine the variable element of remuneration of senior management throughout the Group and also in alignment with performance measures used by certain external stakeholders.
Adjusted profit is not a defined term under IFRS and may not be comparable with similarly titled profit measures reported by other companies. It is not intended to be a substitute for, or superior to, GAAP measures. All APMs relate to the current year results and comparative periods where provided.
3. Segment information
Segment information is presented in accordance with IFRS 8: Operating Segments, which requires operating segments to be identified on the basis of internal reports about components of the Group that are regularly reported to the Group's Chief Operating Decision Maker ("CODM"), which has been deemed to be the Group's Chief Executive, in order to allocate resources to the segments and assess their performance.
The Group's reportable operating segments were considered following the acquisition of ECI on 19 August 2025. The Group now reports under a new segment structure.
The operating segments are as follows:
Electrification & Industrial - comprises ECI's operations supporting industrial automation, electrified mobility, and energy transition technologies. Electrification & Industrial includes high-voltage and low-voltage wire harnesses, complex control box assemblies, and engineered components for electric vehicles, robotics, data centres, AI and other high tech industrial applications.
Appliance & HVAC - comprises ECI's appliance sector operations, supplying electrical distribution systems and smart control components for major home and commercial appliances. It includes ECI's HVAC-focused operations, delivering wire harnesses, control box assemblies, and engineered components for heating, ventilation, and air conditioning units.
ECI Central - comprises the ECI shared service costs.
In addition, there is a corporate cost centre which is also reported to the CODM. The corporate cost centre contains the Rosebank Head Office costs.
Reportable segment results include items directly attributable to a segment as well as those which can be allocated on a reasonable basis.
Inter-segment pricing is determined on an arm's length basis in a manner similar to transactions with third parties.
The Group's geographical segments are determined by the location of the Group's non-current assets and, for revenue, the location of external customers. Inter-segment sales are not material and have not been disclosed.
The following tables present the results and certain asset and liability information regarding the Group's operating segments and corporate cost centre for the year ended 31 December 2025.
a) Segment revenues
The following is an analysis of the Group's revenues and results by reportable segment.
|
Year ended 31 December 2025 |
Electrification & Industrial $m |
Appliance & HVAC $m |
Total $m |
|
Revenue at a point in time |
195 |
250 |
445 |
|
Seven month period ended 31 December 2024 - restated(1) |
Electrification & Industrial $m |
Appliance & HVAC $m |
Total $m |
|
Revenue at a point in time |
- |
- |
- |
(1) Restated for the change in presentation currency (see note 1).
The Group has one customer which contributes more than 10% of Group revenue, with revenue of $55 million in the Appliance & HVAC segment.
b) Segment operating profit
|
Year ended 31 December 2025 |
Electrification & Industrial $m |
Appliance & HVAC $m |
ECI Central $m |
ECI $m |
Corporate $m |
Total $m |
|
Adjusted operating profit/(loss) |
43 |
41 |
(14) |
70 |
(13) |
57 |
|
Items not included in adjusted operating profit(1) Acquisition and disposal related gains and losses Amortisation of intangible assets acquired in business combinations Reversal of IFRS 3 uplift in fair value of inventory Rosebank equity-settled compensation scheme charges Restructuring costs Movement in derivatives and associated financial assets and liabilities |
- (15) (10) - (2) - |
- (14) (13) - (6) - |
- - - - (1) 25 |
- (29) (23) - (9) 25 |
(55) - - (12) - - |
(55) (29) (23) (12) (9) 25 |
|
Operating profit/(loss) |
16 |
8 |
10 |
34 |
(80) |
(46) |
|
Finance costs Finance income |
|
|
|
|
|
(15) 10 |
|
Loss before tax Tax |
|
|
|
|
|
(51) 3 |
|
Loss after tax for the year |
|
|
|
|
|
(48) |
|
Seven month period ended 31 December 2024 - restated(2) |
Electrification & Industrial $m |
Appliance & HVAC $m |
ECI Central $m |
ECI $m |
Corporate(2) $m |
Total $m |
|
Adjusted operating loss |
- |
- |
- |
- |
(2) |
(2) |
|
Items not included in adjusted operating profit(1): Rosebank equity-settled compensation scheme charges Acquisition and disposal related gains and losses |
- - |
- - |
- - |
- - |
(5) (5) |
(5) (5) |
|
Operating loss |
- |
- |
- |
- |
(12) |
(12) |
|
Finance costs Finance income |
|
|
|
|
|
- 1 |
|
Loss before tax Tax |
|
|
|
|
|
(11) - |
|
Loss after tax for the period |
|
|
|
|
|
(11) |
(1) Further details on adjusting items are discussed in note 4.
(2) Restated for the change in presentation currency (see note 1).
c) Segment total assets and liabilities
|
|
Total assets |
|
Total liabilities |
||
|
|
31 December 2025 $m |
Restated(1) 31 December 2024 $m |
|
31 December 2025 $m |
Restated(1) 31 December 2024 $m |
|
Electrification & Industrial Appliance & HVAC ECI Central |
1,380 1,159 80 |
- - - |
|
(247) (255) (38) |
- - - |
|
ECI |
2,619 |
- |
|
(540) |
- |
|
Corporate |
40 |
61 |
|
(549) |
(6) |
|
Total |
2,659 |
61 |
|
(1,089) |
(6) |
(1) Restated for the change in presentation currency (see note 1).
d) Segment capital expenditure and depreciation
|
|
Capital expenditure(1) |
|
Depreciation of |
|
Depreciation of |
|||
|
|
Year ended 31 December 2025 $m |
Restated(2) seven month period ended 31 December 2024 $m |
|
Year ended 31 December 2025 $m |
Restated(2) seven month period ended 31 December 2024 $m |
|
Year ended 31 December 2025 $m |
Restated(2) seven month period ended 31 December 2024 $m |
|
Electrification & Industrial Appliance & HVAC ECI Central |
2 6 - |
- - - |
|
3 3 - |
- - - |
|
2 2 1 |
- - - |
|
ECI |
8 |
- |
|
6 |
- |
|
5 |
- |
|
Corporate |
- |
- |
|
- |
- |
|
- |
- |
|
Total |
8 |
- |
|
6 |
- |
|
5 |
- |
(1) Capital expenditure excludes lease additions.
(2) Restated for the change in presentation currency (see note 1).
e) Geographical information
The Group operates in various geographical areas around the world. The parent company's country of domicile is Jersey and the Group's revenues and non-current assets in the rest of North America, Asia and EMEA are also considered to be material.
The Group's revenue from external customers and information about its segment assets (non-current assets excluding deferred tax assets and non-current derivative financial assets) by geographical location are detailed below:
|
|
Revenue(1) from external customers |
|
Segment assets |
||
|
|
Year ended 31 December 2025 $m |
Restated(2) seven month period ended 31 December 2024 $m |
|
31 December 2025 $m |
Restated(2) 31 December 2024 $m |
|
North America Europe and the Middle East Asia and Pacific Other |
377 39 26 3 |
- - - - |
|
1,784 205 111 12 |
1 - - - |
|
Total |
445 |
- |
|
2,112 |
1 |
(1) Revenue is presented by destination.
(2) Restated for the change in presentation currency (see note 1).
4. Reconciliation of adjusted profit measures
As described in note 2, adjusted profit measures are an alternative performance measure used by the CODM to monitor the operating performance of the Group.
a) Operating profit
|
|
Notes |
Year ended |
Restated(1) seven month period ended 31 December 2024 $m |
|
Operating loss |
|
(46) |
(12) |
|
Acquisition and disposal related gains and losses Amortisation of intangible assets acquired in business combinations Reversal of IFRS 3 uplift in fair value of inventory Rosebank equity-settled compensation scheme changes Restructuring costs Movement in derivatives and associated financial assets and liabilities |
a b c d e f |
55 29 23 12 9 (25) |
5 - - 5 - - |
|
Total adjustments to operating profit/(loss) |
|
103 |
10 |
|
Adjusted operating profit/(loss) |
|
57 |
(2) |
(1) Restated for the change in presentation currency (see note 1).
a. Acquisition and disposal costs of $55 million (2024: $5 million) recognised in the year included general transaction fees and associated transaction taxes along with a loss of $11 million on a contingent hedge, which was taken out on the announcement of the acquisition of ECI to mitigate the foreign exchange risk on equity proceeds in advance of the ECI acquisition. These items are excluded from adjusted results due to their non-trading nature.
b. The amortisation charge on intangible assets acquired in business combinations of $29 million (2024: $nil) includes four months of amortisation of intangible assets acquired with ECI. This is excluded from adjusted results due to its non-trading nature and to enable comparison with companies that grow organically. Where intangible assets are trading in nature, such as material computer software and development costs, the amortisation is not adjusted.
c. Finished goods and work in progress inventory which are present in an acquired business are required to be uplifted to a value closer to their selling price, in accordance with IFRS 3. As a result, in the early months of an acquisition, reduced profits are generated as this inventory is sold. The one-off effect in the year, relating to ECI acquired inventory, was a charge of $23 million (2024: $nil) and is excluded from adjusted results due to its size and non-recurring nature.
d. The charge for the Rosebank equity-settled Incentive Scheme of $12 million (2024: $5 million), including its associated employer's tax charge of $1 million (2024: $nil), was excluded from adjusted results due to its size and volatility. The shares that would be issued, based on the Scheme's current value at the end of the reporting period, are included in the calculation of the adjusted diluted earnings per share, which the Board considers to be a key measure of performance.
e. Restructuring and other associated costs totalling $9 million (2024: $nil), which are shown as adjusting items due to their size and non-trading nature. The charge related to the ECI multi-year restructuring programme, which will reduce the number of sites by over a quarter, impacts both the Appliance & HVAC and Electrification & Industrial divisions. This is expected to cost c.$80 million in total, primarily relating to actions over the next two years.
f. Movements in the fair value of derivative financial instruments are primarily related to forward foreign currency exchange contracts, where hedge accounting is not applied, along with foreign exchange movements on the associated financial assets and liabilities. These instruments are entered into within the businesses to mitigate the potential volatility of future cash flows and totalled a credit of $25 million (2024: $nil). These are shown as an adjusting item due to their volatility and size.
b) Profit/(loss) before tax
|
|
Notes |
Year ended |
Restated(1) seven month period ended 31 December 2024 $m |
|
Loss before tax |
|
(51) |
(11) |
|
Adjustments to operating loss as above |
|
103 |
10 |
|
Adjusted profit/(loss) before tax |
|
52 |
(1) |
(1) Restated for the change in presentation currency (see note 1).
c) Profit/(loss) after tax
|
|
Notes |
Year ended |
Restated(1) seven month period ended 31 December 2024 $m |
|
Loss after tax |
|
(48) |
(11) |
|
Adjustments to loss before tax as above Tax effect of adjustments to loss before tax |
5 |
103 (17) |
10 - |
|
Total adjustments to loss after tax |
|
86 |
10 |
|
Adjusted profit/(loss) after tax |
|
38 |
(1) |
(1) Restated for the change in presentation currency (see note 1).
5. Income tax expense
|
|
Year ended |
Restated(1) seven month period ended |
|
Analysis of tax charge/(credit) in the year/period |
|
|
|
Current tax |
|
|
|
Current year tax charge Adjustments in respect of prior years |
6 - |
- - |
|
Total current tax charge |
6 |
- |
|
Deferred tax Origination and reversal of temporary differences Tax on the change in value of derivative financial instruments |
(15) 6 |
- - |
|
Total deferred tax credit |
(9) |
- |
|
Total tax credit for the year/period |
(3) |
- |
|
Analysis of tax charge/(credit) in the year/period: |
|
|
|
Tax charge in respect of adjusted profit/(loss) before tax Tax credit recognised as an adjusting item |
14 (17) |
- - |
|
Tax credit |
(3) |
- |
(1) Restated for the change in presentation currency (see note 1).
The tax charge of $14 million (2024: $nil) arising on adjusted profit before tax of $52 million (2024: $nil), results in an effective tax rate of 27% (2024: nil%).
The tax credit for the year can be reconciled to the loss before tax per the Income Statement as follows:
|
|
Year ended |
Restated(1) seven month period ended |
|
Loss before tax |
(51) |
(11) |
|
Tax credit on loss before tax at 25% (2024: 19%(2)) Tax effect of: Disallowable expenses and other permanent differences within adjusted profit Temporary differences not recognised in deferred tax Other net adjustments in current period Effect of rate differences between UK and overseas rates |
(13)
8 2 2 (2) |
(2)
- 2 - - |
|
Total tax credit for the year |
(3) |
- |
(1) Restated for the change in presentation currency (see note 1).
(2) UK small profits tax rate.
The reconciliation has been performed at the UK corporation tax rate of 25% (2024: 19%).
Tax charges included in Other Comprehensive Income are as follows:
|
|
Year ended |
Restated(1) seven month period ended |
|
Deferred tax movements on translation of foreign operations |
1 |
- |
|
Total credit for the year |
1 |
- |
(1) Restated for the change in presentation currency (see note 1).
Global Minimum Tax rules
The Group is within the scope of the OECD Global Minimum Tax ("Pillar 2") rules which came into effect from 1 January 2024. The current year tax charge includes an immaterial (less than $1 million) amount of Pillar 2 top-up tax in respect of several jurisdictions. The Group continues to monitor legislative Pillar 2 developments in jurisdictions in which it operates.
In accordance with the amendments to IAS 12 Income Taxes, the Group has applied the mandatory exception from recognising and disclosing information about deferred tax assets and liabilities related to Pillar 2 top-up taxes.
6. Earnings per share
|
Earnings attributable to owners of the parent |
Year ended |
Restated(1) seven month period ended |
|
Earnings for basis of earnings per share |
(48) |
(11) |
(1) Restated for the change in presentation currency (see note 1).
|
Weighted average number of shares |
Year ended |
Seven month period ended |
|
Weighted average number of ordinary shares for the purposes of basic earnings per share (million) Further shares for the purposes of diluted earnings per share (million) |
212.8 0.3 |
16.2 - |
|
Weighted average number of ordinary shares for the purposes of diluted earnings per share (million) |
213.1 |
16.2 |
On 11 July 2024, the Company was admitted to trading on AIM. The Company allotted a further 19,999,998 Ordinary shares, in addition to the 2 shares issued at incorporation.
On 3 July 2025, 386,607,653 shares were issued of nil par value for 300 pence each, to finance the acquisition of ECI, which resulted in a placed share capital balance of $1,550 million, being proceeds received of $1,579 million, net of associated costs of $29 million.
|
Earnings per share |
Year ended |
Restated(1) seven month period ended |
|
Basic earnings per share |
(22.6) |
(69.1) |
|
Diluted earnings per share |
(22.6) |
(69.1) |
(1) Restated for the change in presentation currency (see note 1).
|
Adjusted earnings |
Year ended |
Restated(1) seven month period ended |
|
Adjusted earnings for the basis of adjusted earnings per share |
38 |
(1) |
(1) Restated for the change in presentation currency (see note 1).
Adjusted earnings per share:
|
|
Year ended |
Restated(1) seven month period ended |
|
Adjusted basic earnings per share Adjusted diluted earnings per share |
17.9 17.8 |
(5.7) (5.7) |
(1) Restated for the change in presentation currency (see note 1).
7. Acquisitions
ECI
On 19 August 2025 the Group acquired 100% of the issued share capital and obtained control of ECI for total consideration of $1,969 million (including debt payments net of cash acquired of $960 million and cash consideration of $1,009 million).
ECI is a world leading supplier of electrical distribution systems, control box assemblies, and other critical engineered components for diversified markets.
The Group has reviewed the assets and liabilities acquired. Due to the size of the acquired business, the assessment of the fair value of the assets and liabilities acquired has not yet been finalised. In accordance with IFRS 3: "Business combinations", the acquisition Balance Sheet of ECI at 19 August 2025 remains provisional as of 31 December 2025 as there could be further adjustment to the fair values recognised in the table below, if additional information comes to light.
|
Provisional fair value |
$m |
|
|
|
|
Property, plant and equipment |
116 |
|
Intangible assets |
1,229 |
|
Derivative financial instruments |
32 |
|
Inventories |
187 |
|
Trade and other receivables(1) |
191 |
|
Cash and cash equivalents |
36 |
|
Trade and other payables |
(234) |
|
Lease liabilities |
(72) |
|
Provisions and contingent liabilities |
(37) |
|
Deferred tax |
(183) |
|
Retirement benefit obligations |
(10) |
|
Current tax liabilities |
(29) |
|
Interest-bearing loans and borrowings(2) |
(1,010) |
|
|
|
|
Net assets attributable to the parent |
216 |
|
|
|
|
|
|
|
Total consideration |
1,009 |
|
|
|
|
Provisional goodwill |
793 |
|
|
|
|
|
|
|
Total consideration satisfied by: |
|
|
Cash consideration |
1,009 |
(1) The fair value of financial assets includes gross trade receivables of $176 million. The best estimate at the acquisition date of the contractual cash flows not to be collected is $10 million.
(2) Includes $14 million of supplier finance facilities categorised as short-term interest-bearing loans and borrowings.
ECI contributed $445 million to revenue and $70 million to adjusted operating profit for the period between the date of acquisition and the balance sheet date. The amounts recognised in relation to ECI for the period from 19 August to 31 December 2025 include revenue and profit and the associated impact on working capital, based on an estimate of activity from 19 August to 31 August 2025. If the acquisition of ECI had been completed on the first day of the financial year, Group revenues would have been approximately $1,219 million and Group adjusted operating profit would have been approximately $175 million.
The goodwill arising on acquisition of ECI is attributable to the anticipated profitability and cash flows arising from the businesses acquired, the assembled workforce, technical expertise, knowhow, market share and geographical advantages afforded to the Group, which the Group expects to realise through a combination of revised strategic direction, operational improvements and investment. None of the goodwill is expected to be deductible for income tax purposes.
Acquisition related costs charged through the Income Statement amounted to $53 million (see note 4).
Contingent liabilities acquired in respect of legal claims of $15 million have been recognised within provisions, none of which were utilised in the period. The majority of expenditure is expected to be incurred over the next five years.
In determining the fair value of assets acquired in the ECI business combination, a number of estimates and judgements have been made. The fair value exercise was carried out in conjunction with independent experts and considered the existence and valuation of the acquired assets and liabilities, and the goodwill which has arisen.
Intangible assets
Intangible assets inherent in ECI's customer relationships and contracts were valued using a multi-period excess earnings method. This methodology places a value on the asset as a function of (a) management's estimate of the expected cash flows arising from the customer contracts; (b) discount rates reflective of the risks inherent in the cash flows; and (c) a contributory charge attributable to assets needed to generate the operating cash flows. After tax discount rates of 11.2% to 12.0% were applied to the forecast cash flows. A total fair value of $1,137 million has been recognised for customer relationships and contracts.
The brands and intellectual property within the ECI business were deemed to have measurable value as they are well recognised in their industries. They have been valued using a relief from royalty methodology based on projected cash flows attributable to the tradename and an assumed royalty rate that would be charged if the name were subject to licence within a comparable trade situation and an appropriate discount rate reflecting inherent risk in the projected cash flows. A total fair value of $92 million has been recognised for brands and intellectual property.
The valuation of all intangible assets reflects the tax benefit of amortisation, which has been assessed with reference to country tax laws.
8. Provisions
|
|
Property related costs $m |
Litigation $m |
Warranty related costs $m |
Restructuring $m |
Other $m |
Total $m |
|
At 1 January 2025 Charge to operating profit(1) Utilised Acquisition of businesses |
- - - 12 |
- 1 - 21 |
- - - 1 |
- 9 (9) - |
- 1 - 3 |
- 11 (9) 37 |
|
At 31 December 2025 |
12 |
22 |
1 |
- |
4 |
39 |
|
Current Non-current |
1 11 |
1 21 |
1 - |
- - |
2 2 |
5 34 |
|
|
12 |
22 |
1 |
- |
4 |
39 |
(1) Includes $10 million of adjusting items and $1 million recognised in adjusted operating profit.
Property related costs
The provision for property related costs represents the estimated net payments for surplus property or off-market lease contracts on acquisition, due over the term of the leases and any dilapidation costs for ongoing leases. This is expected to result in cash expenditure over the next 14 years. Calculations of surplus leasehold property costs and dilapidations are based on lease agreements with landlords and external quotes, or in the absence of specific documentation, management's best estimate of the costs required to fulfil obligations.
Litigation
The Group has on occasion been required to take legal or other actions to defend itself against proceedings brought by other parties. Provisions are made for the expected costs associated with such matters, based on past experience of similar items and other known factors, considering professional advice received. This represents management's best estimate of the likely outcome. The timing of utilisation of these provisions is frequently uncertain, reflecting the complexity of issues and the outcome of various court proceedings and negotiations. Contractual and other provisions represent management's best estimate of the cost of settling future obligations and reflect management's assessment of the likely settlement method, which may change over time. However, no provision is made for proceedings which have been, or might be, brought by other parties against Group companies unless management, considering professional advice received, assess that it is more likely than not that such proceedings may be successful.
Warranty related costs
Provisions are recorded for product and general liability claims which are probable and for which the cost can be reliably estimated. These liabilities include an estimate of claims incurred but not yet reported and are based on actuarial valuations using claim data. Due to their nature, it is not possible to predict precisely when these provisions will be utilised.
Restructuring
Restructuring provisions relate to committed costs in respect of restructuring programmes, usually resulting in cash spend within one year. A restructuring provision is recognised when the Group has developed a detailed formal plan for the restructuring and has raised a valid expectation in those affected that it will carry out the restructuring by either starting to implement the plan or by announcing its main features to those affected by it. The measurement of a restructuring provision includes only the direct expenditures arising from the restructuring, which are those amounts that are necessarily entailed by the restructuring programmes.
Other
Other provisions include the employer tax on equity-settled incentive schemes, as well as other supplier claims, which are expected to result in cash expenditure over the next two to five years.
Where appropriate, provisions have been discounted using discount rates between 0% and 8% (31 December 2024: not applicable) depending on the territory in which the provision resides and the length of its expected utilisation. The impact of the unwind of discounting was immaterial for the Group.
9. Cash flow statement
|
|
Notes |
Year ended |
Restated(1) seven month period ended |
|
Reconciliation of operating loss to net cash used in operating activities |
|
|
|
|
Operating loss Adjusting items |
4 |
(46) 103 |
(12) 10 |
|
Adjusted operating profit Adjustments for: Depreciation of property, plant and equipment Restructuring costs paid and movements in provisions Defined benefit pension contributions paid Change in inventories Change in receivables(2) Change in payables Tax paid Acquisition and disposal costs |
4
|
57
11 (8) (1) 2 (90) (20) (2) (55) |
(2)
- - - - - - - - |
|
Net cash used in operating activities |
|
(106) |
(2) |
(1) Restated for the change in presentation currency (see note 1).
(2) Includes the impact from the unwind of acquired customer factoring arrangements of $108 million.
|
Reconciliation of cash and cash equivalents, net of bank overdrafts |
Year ended |
Restated(1) |
|
Cash and cash equivalents per Balance Sheet Bank overdrafts included within current interest-bearing loans and borrowings |
35 (12) |
60 - |
|
Cash and cash equivalents, net of bank overdrafts per Statement of Cash Flows |
23 |
60 |
(1) Restated for the change in presentation currency (see note 1).
Net debt reconciliation
Net debt consists of interest-bearing loans and borrowings and cash and cash equivalents.
Net debt is considered to be an alternative performance measure as it is not defined in IFRS. The most directly comparable IFRS measure is the aggregate of interest-bearing loans and borrowings (current and non-current) and cash and cash equivalents. A reconciliation from the most directly comparable IFRS measure to net debt, used as a basis for banking covenant calculations, is given below:
|
|
31 December |
Restated(1) 31 December 2024 $m |
|
Interest-bearing loans and borrowings - due within one year Interest-bearing loans and borrowings - due after one year |
(12) (517) |
- - |
|
External debt Less: Cash and cash equivalents |
(529)
35 |
-
60 |
|
|
35 |
60 |
|
Net (debt)/cash |
(494) |
60 |
(1) Restated for the change in presentation currency (see note 1).
The table below shows the key components of the movement in net debt:
|
|
Restated(1) At 31 December |
Cash flow |
Acquisitions |
Other non-cash movements |
Effect of foreign exchange |
At |
|
External debt (excluding bank overdrafts) |
- |
483 |
(1,010) |
10 |
- |
(517) |
|
Cash and cash equivalents, net of bank overdrafts |
60 |
(557) |
522 |
- |
(2) |
23 |
|
Net debt |
60 |
(74) |
(488) |
10 |
(2) |
(494) |
(1) Restated for the change in presentation currency (see note 1).
10. Post balance sheet events
As announced on 16 February 2026, the Company is in advanced discussions regarding a possible transaction to acquire two private-equity owned US-based businesses (the "Potential Transaction") for a headline enterprise value of approximately $3.05 billion.
The full terms of the Potential Transaction remain confidential at this stage, however the Company notes that the Potential Transaction is fully in line with its acquisition criteria and, if it proceeds, would be funded through a combination of a fully underwritten equity issue of approximately £1.9 billion and new debt facilities.
GLOSSARY
Alternative Performance Measures ("APMs")
In accordance with the Guidelines on APMs issued by the European Securities and Markets Authority ("ESMA"), additional information is provided on the APMs used by the Group below.
In the reporting of financial information, the Group uses certain measures that are not required under IFRS. These additional measures (commonly referred to as APMs) provide additional information on the performance of the business and trends to stakeholders. The Board considers the adjusted results to be an important measure used to monitor how the businesses are performing as this provides a meaningful reflection of how the businesses are managed and measured on a day-to-day basis and achieve consistency and comparability between future reporting periods, when all businesses are held for a complete reporting period.
These APMs may not be directly comparable with similarly titled measures reported by other companies and they are not intended to be a substitute for, or superior to, IFRS measures.
Income Statement Measures
|
APM Annualised revenue |
|
|
Closest equivalent statutory measure Revenue |
|
|
Reconciling items to statutory measure Full period impact of acquisitions. |
|
|
Definition and purpose Annualised revenue reflects the Group's revenue as if all acquisitions in the period had occurred on the first day of the financial year. |
|
|
Annualised revenue |
Year ended |
|
Revenue |
445 |
|
Full year impact of acquisitions |
774 |
|
Annualised revenue |
1,219 |
|
APM Adjusting items |
|
Closest equivalent statutory measure None |
|
Reconciling items to statutory measure Adjusting items (note 4) |
|
Definition and purpose Those items which the Group excludes from its adjusted profit metrics in order to present a further measure of the Group's performance. These include items which are significant in size or volatility or by nature are non-trading or non-recurring. This provides a meaningful comparison of how the business is managed and measured on a day-to-day basis and provides consistency and comparability between reporting periods. |
|
APM Adjusted operating profit/(loss) and Annualised adjusted operating profit/(loss) |
||
|
Closest equivalent statutory measure Operating profit/(loss)(2) |
||
|
Reconciling items to statutory measure Adjusting items (note 4) and full period impact of acquisition |
||
|
Definition and purpose The Group uses adjusted profit measures to provide a useful and more comparable measure of the ongoing performance of the Group. Adjusted measures are reconciled to statutory measures by removing adjusting items, the nature of which are disclosed above and further detailed in note 4.
Annualised adjusted operating profit reflects the Group adjusted operating profit as if all acquisitions in the period had occurred on the first day of the financial year. |
||
|
|
||
|
Adjusted operating profit/(loss) and Annualised adjusted operating profit/(loss) |
Year ended |
Restated(1) seven month period ended |
|
Operating loss Adjusting items to operating loss (note 4) |
(46) 103 |
(12) 10 |
|
Adjusted operating profit/(loss) |
57 |
(2) |
|
Full year impact of acquisitions |
118 |
- |
|
Annualised adjusted operating profit/(loss) |
175 |
(2) |
|
APM Adjusted operating margin and Annualised adjusted operating margin |
||
|
Closest equivalent statutory measure Operating margin(3) |
||
|
Reconciling items to statutory measure Adjusting items (note 4) and full period impact of acquisitions. |
||
|
Definition and purpose Adjusted operating margin represents Adjusted operating profit as a percentage of revenue. Annualised adjusted operating margin represents Annualised adjusted operating profit as a percentage of Annualised revenue.
The Group uses adjusted profit measures to provide a useful and more comparable measure of the ongoing performance of the Group. |
||
|
|
||
|
APM Adjusted profit/(loss) before tax |
||
|
Closest equivalent statutory measure Loss before tax |
||
|
Reconciling items to statutory measure Adjusting items (note 4) |
||
|
Definition and purpose Profit before the impact of adjusting items and tax. As discussed above, adjusted profit measures are used to provide a useful and more comparable measure of the ongoing performance of the Group.
Adjusted measures are reconciled to statutory measures by removing adjusting items, the nature of which are disclosed above and further detailed in note 4. |
||
|
|
||
|
Adjusted profit/(loss) before tax |
Year ended 2025 |
Restated(1) seven month period ended 2024 |
|
Loss before tax Adjusting items to loss before tax (note 4) |
(51) 103 |
(11) 10 |
|
Adjusted profit/(loss) before tax |
52 |
(1) |
|
APM Adjusted profit/(loss) after tax |
||
|
Closest equivalent statutory measure Profit/(loss) after tax |
||
|
Reconciling items to statutory measure Adjusting items (note 4) |
||
|
Definition and purpose Profit/(loss) after tax but before the impact of the adjusting items. As discussed above, adjusted profit measures are used to provide a useful and more comparable measure of the ongoing performance of the Group.
Adjusted measures are reconciled to statutory measures by removing adjusting items, the nature of which are disclosed above and further detailed in note 4. |
||
|
|
||
|
Adjusted profit/(loss) after tax |
Year ended |
Restated(1) seven month period ended |
|
Loss after tax Adjusting items to loss after tax (note 4) |
(48) 86 |
(11) 10 |
|
Adjusted profit/(loss) after tax |
38 |
(1) |
|
APM Constant currency |
|
Closest equivalent statutory measure Income Statement, which is reported using actual average foreign exchange rates |
|
Reconciling items to statutory measure Constant currency foreign exchange rates |
|
Definition and purpose The Group uses US Dollar based constant currency models to measure performance. These are calculated by applying 2025 average exchange rates to local currency reported results for the current and prior year.
This gives a US Dollar denominated Income Statement which excludes any variances attributable to foreign exchange rate movements. |
|
APM Adjusted EBITDA, Adjusted EBITDA for interest cover covenant purposes and Annualised adjusted EBITDA for leverage covenant purposes |
|
Closest equivalent statutory measure Operating profit/loss(2) |
|
Reconciling items to statutory measure Adjusting items (note 4), depreciation of property, plant and equipment as well as the full period impact of acquisitions and adjustments for covenant purposes. |
|
Definition and purpose Adjusted operating profit before depreciation and impairment of property, plant and equipment.
Adjusted EBITDA and Annualised adjusted EBITDA are measures used to value individual businesses as part of the "Buy, Improve, Sell" Rosebank strategy model and by certain external stakeholders to measure performance. |
|
Adjusted EBITDA, Adjusted EBITDA for interest cover covenant purposes and Annualised adjusted EBITDA for bank covenant leverage purposes |
Year ended 2025 |
Restated(1) seven month period ended 31 December 2024 $m |
|
Adjusted operating profit Depreciation of property, plant and equipment |
57 11 |
(2) - |
|
Adjusted EBITDA |
68 |
(2) |
|
Other adjustments required for covenant purposes(4) |
2 |
- |
|
Adjusted EBITDA for interest cover covenant purposes |
70 |
(2) |
|
Full year impact of acquisitions |
140 |
- |
|
Adjusted EBITDA for bank covenant leverage purposes |
210 |
(2) |
|
APM Adjusted tax rate |
||
|
Closest equivalent statutory measure Effective tax rate |
||
|
Reconciling items to statutory measure Adjusting items, adjusting tax items and the tax impact of adjusting items (note 4 and note 5) |
||
|
Definition and purpose The income tax charge for the Group excluding adjusting tax items, and the tax impact of adjusting items, divided by adjusted profit before tax. This measure is a useful indicator of the ongoing tax rate for the Group. |
||
|
|
||
|
Adjusted tax rate |
Year ended 2025 |
Restated(1) seven month period ended 2024 |
|
Tax credit per Income Statement Adjusted for: Tax impact of adjusting items |
3
(17) |
-
- |
|
Adjusted tax charge |
(14) |
- |
|
Adjusted profit before tax |
52 |
- |
|
Adjusted tax rate |
27% |
- |
|
APM Adjusted basic earnings per share |
|
Closest equivalent statutory measure Basic earnings per share |
|
Reconciling items to statutory measure Adjusting items (note 4 and note 6) |
|
Definition and purpose Profit after tax attributable to owners of the parent and before the impact of adjusting items, divided by the weighted average number of ordinary shares in issue during the financial period. |
|
APM Adjusted diluted earnings per share |
|
Closest equivalent statutory measure Diluted earnings per share |
|
Reconciling items to statutory measure Adjusting items (note 4 and note 6) |
|
Definition and purpose Profit after tax attributable to owners of the parent and before the impact of adjusting items, divided by the weighted average number of ordinary shares in issue during the financial period adjusted for the effects of any potentially dilutive options. |
|
APM Interest cover |
|
Closest equivalent statutory measure None |
|
Reconciling items to statutory measure Not applicable |
|
Definition and purpose Adjusted EBITDA calculated for interest cover covenant purposes as a multiple of net interest payable on bank loans and overdrafts. This measure is used for bank covenant testing. |
|
Interest cover |
Year ended 2025 |
|
Net interest payable on bank loans and overdrafts Interest payable on lease liabilities |
(2) (2) |
|
Net interest payable |
(4) |
|
Adjusted EBITDA for interest cover covenant purposes |
70 |
|
Interest cover |
17.5x |
Balance Sheet Measures
|
APM Working capital |
|
Closest equivalent statutory measure Inventories, trade and other receivables less trade and other payables |
|
Reconciling items to statutory measure Not applicable |
|
Definition and purpose Working capital comprises inventories, current trade and other receivables, and current trade and other payables. This measure provides additional information in respect of working capital management. |
|
APM Net debt |
|
Closest equivalent statutory measure Cash and cash equivalents less interest-bearing loans and borrowings |
|
Reconciling items to statutory measure Reconciliation of net debt (note 9) |
|
Definition and purpose Net debt comprises cash and cash equivalents and interest-bearing loans and borrowings. Net debt is one measure that could be used to indicate the strength of the Group's Balance Sheet position and is a useful measure of the indebtedness of the Group. |
|
APM Bank covenant leverage of net debt to Annualised adjusted EBITDA |
|
Closest equivalent statutory measure None |
|
Reconciling items to statutory measure Not applicable |
|
Definition and purpose Bank covenant definition of net debt at average rates divided by Annualised adjusted EBITDA for bank covenant leverage purposes.
This measure is used for bank covenant testing. |
|
APM Bank covenant definition of net debt at average rates |
|
Closest equivalent statutory measure Cash and cash equivalents less interest-bearing loans and borrowings and finance related derivative instruments. |
|
Reconciling items to statutory measure Impact of foreign exchange and adjustments for bank covenant testing purposes. |
|
Definition and purpose Net debt (as above) is presented in the Balance Sheet translated at year end exchange rates.
For bank covenant testing purposes net debt is converted using average exchange rates for the year. |
|
Bank covenant definition of net debt at average rates and bank covenant leverage |
31 December 2025 |
|
Net debt at closing rates (note 9) Impact of foreign exchange |
494 - |
|
Bank covenant definition of net debt at average rates |
494 |
|
Adjusted EBITDA for bank covenant leverage purposes |
210 |
|
Bank covenant leverage |
2.4x |
|
APM Free cash flow |
||
|
Closest equivalent statutory measure Net increase/decrease in cash and cash equivalents (net of bank overdrafts) |
||
|
Reconciling items to statutory measure Acquisition and disposal related cash flows, cash proceeds from issuing shares net of associated costs and movements on borrowing facilities. |
||
|
Definition and purpose Free cash flow represents cash generated after all trading costs including restructuring, pension contributions, tax and interest payments. |
||
|
|
||
|
Free cash flow |
Year ended |
Restated(1) seven month period ended |
|
Net (decrease)/increase in cash and cash equivalents (net of bank overdrafts)
Debt related: Repayment of borrowings Unwind of acquired supplier finance arrangements classified within financing cashflows Drawings on borrowing facilities Costs of raising debt finance
Equity related: Cash proceeds from issuing shares Associated costs from issuing shares
Acquisition and disposal related: Acquisition of subsidiaries, net of cash acquired Acquisition related costs |
(35)
1,020 (14) (537) 11
(1,579) 29
973 55 |
62
- - - -
(65) 2
- - |
|
Free cash flow |
(77) |
(1) |
|
APM Adjusted free cash flow |
||
|
Closest equivalent statutory measure Net increase/decrease in cash and cash equivalents (net of bank overdrafts) |
||
|
Reconciling items to statutory measure Free cash flow, as defined above, adjusted for restructuring cash flows and the unwind of acquired factoring arrangements. |
||
|
Definition and purpose Adjusted free cash flow represents free cash flow adjusted for restructuring cash flows. |
||
|
|
||
|
APM Adjusted free cash flow |
Year ended 2025 |
Restated(1) seven month period ended 2024 |
|
Free cash flow Unwind of acquired factoring arrangements (note 9) Unwind of acquired supplier finance arrangements classified within financing cashflows Restructuring costs paid |
(77) 108 14 10 |
(1) - - - |
|
Adjusted free cash flow |
55 |
(1) |
|
APM Capital expenditure (capex) |
|
Closest equivalent statutory measure None |
|
Reconciling items to statutory measure Not applicable |
|
Definition and purpose Calculated as the purchase of owned property, plant and equipment, excluding any assets acquired as part of a business combination. Net capital expenditure is capital expenditure net of proceeds from disposal of property, plant and equipment. |
|
|
|
APM Dividend per share |
|
Closest equivalent statutory measure Dividend per share |
|
Reconciling items to statutory measure Not applicable |
|
Definition and purpose Amounts payable by way of dividends in terms of pence per share. |
(1) Restated for the change in presentation currency (see note 1).
(2) Operating profit/(loss) is not defined within IFRS but is a widely accepted profit measure being profit/(loss) before finance costs, finance income and tax.
(3) Operating margin is not defined within IFRS but is a widely accepted profit measure being derived from operating profit/(loss)(2) divided by revenue.
(4) Included within other adjustments required for leverage covenant purposes in the year ended 31 December 2025 are unrealised annual savings from spend incurred in the year on restructuring projects.
RNS may use your IP address to confirm compliance with the terms and conditions, to analyse how you engage with the information contained in this communication, and to share such analysis on an anonymised basis with others as part of our commercial services. For further information about how RNS and the London Stock Exchange use the personal data you provide us, please see our Privacy Policy.

Latest directors dealings
- 1 day ago TotalEnergies SE
- 1 day ago Bango
- 1 day ago Zigup
- 1 day ago PureTech Health
- 1 day ago Peel Hunt Limited NPV