Half year results to 31 December 2025
Summary by AI BETAClose X
 02 March 2026
Gelion plc
("Gelion", "Company" or the "Group")
Half year results to 31 December 2025
Gelion (AIM: GELN), the sulfur battery company, announces its unaudited half year results for the six months ended 31 December 2025 a period in which the Company made significant technical and commercial progress.
Gelion is seeking to replace the strategic minerals used in current Lithium-ion battery cathodes with Gelion's Nano-Encapsulated Sulfur (NES™) targeting high performance, low cost, and with the capability of "drop-in" into existing global manufacturing lines. Gelion's NES™ is made from sulfur which is abundantly available, free from toxic minerals and supply chain constraints.
 |
Operational highlights
|
· |
Signed a full collaboration agreement with TDK Corporation ("TDK"), the Japan headquartered global electronics and battery manufacturer with over 100,000 employees worldwide, to facilitate the development of large format commercial pouch cell prototypes. |
|
· |
Awarded c.£0.5 million grant funding from the UK Government's DRIVE35 programme, facilitated by the Advanced Propulsion Centre UK (APC). The project will be delivered in collaboration with QinetiQ to scale-up and independently validate Gelion's next-generation lithium-sulfur (Li-S) technology in high-energy multi-layer pouch cells. |
|
· |
Successfully transferred the proprietary Sulfur CAM technology from Max Planck Institute of Colloids and Interfaces (MPI) in Gelion's Sydney based ACPC facility, enabling the acceleration of its Sulfur CAM and collaborative development programmes of its Li-S and Room Temperature Sodium Battery (Na-S) technologies. |
|
· |
Completion of an oversubscribed capital raise round in November 2025 of £9.9 million (net proceeds) from existing and new institutional investors. |
|
· |
Achieved a major technical milestone in the development of its next-generation sulfur battery technology, confirming its proprietary cathode active material (CAM) has reached its 4Q areal capacity target in coin-cell testing. 4Q is widely recognised as a critical milestone for practical high-energy-density sulfur cathodes. |
Financial highlights
|
· |
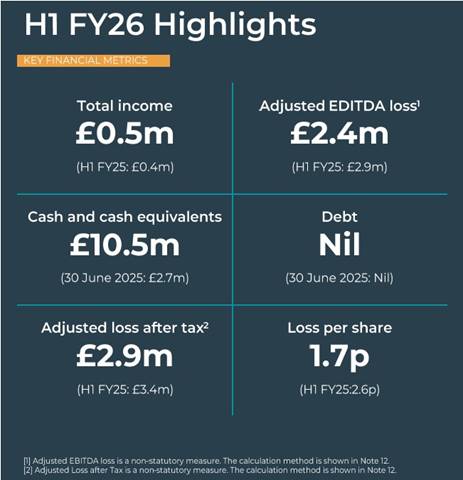
Total income of £0.5m (H1 FY25: £0.4m), primarily reflecting the grant income from ARENA and APC. |
|
· |
Adjusted EBITDA loss[1] of £2.4m (H1 FY25: £2.9m), driven by an increase in total income and lower operating expenditure driven by focused development programs and financial discipline. |
|
· |
Cash at period end of £10.5m (30 June 25: £2.7m) with nil debt. |
|
· |
Completion of an oversubscribed capital raise round in November 2025 of £9.9 million (net proceeds) from existing and new institutional investors |
Post-period end
|
· |
Appointed Professor Rachid Yazami as a Technology Advisor to the Group, a world leading battery technologist, who will provide strategic guidance on battery technology development. |
|
· |
NES™ Cathode Active Material (CAM) samples supplied to TDK with initial pouch cells incorporating NES™ CAM successfully manufactured by TDK with early test results meeting the Company's expectations. |
|
· |
GEN3 CAM supplied to QinetiQ in the UK which has produced initial pouch cells. Gelion is now equipping Gelion Europe to provide NES™ CAM to QinetiQ so that QinetiQ can produce NES™ CAM Pouch cells. |
|
· |
Complete fit-out of Analytical Suite, part of Advanced Commercial Prototyping Centre (ACPC), co-funded by ARENA enabling Gelion to finalise specification sheets for Gelion's NES™ CAM in the near-term. |
|
· |
Active discussions are progressing with multiple global partners across a range of applications and geographies. |
|
· |
Additional grant funding £0.25 million (£0.5 million project budget extension) secured from Australia's ARENA to accelerate CAM scale-up and commercialisation. |
John Wood, CEO of Gelion, commented:
"Gelion's ambition is clear and focussed - leadership in Sulfur battery technology through alignment with target market and specialist applications and global sales. We are pursuing this through a capital-light model, leveraging our internal expertise in innovation and materials science while building collaborations across the battery supply chain to accelerate progress.
"Gelion is now recognised as an emerging global innovator in Sulfur battery technology, with the potential to achieve Tier‑1 status and corresponding value recognition through FY26-27."
For more information, please visit Next-Generation Sulfur Battery Technologies | Gelion or contact:
|
Gelion plc
|
via Tavistock |
|
Strand Hanson Limited (Nominated and Financial Adviser)
|
+44 (0) 20 7409 3494 |
|
Oberon Capital (Joint Broker)
|
+44 (0) 20 3179 5300 |
|
Allenby Capital Limited (Joint Broker) Jos Pinnington / Lauren Wright (Sales and Corporate Broking) Alex Brearley / Ashur Joseph (Corporate Finance)
|
+44 (0) 20 3328 5656 |
|
Tavistock (Financial & Corporate PR) |
+44 20 7920 3150 |
Market Abuse Regulation
This announcement contains inside information for the purposes of Article 7 of EU Regulation No. 596/2014, which forms part of United Kingdom domestic law by virtue of the European Union (Withdrawal) Act 2018, as amended.
About Gelion
Gelion plc, the sulfur battery company is developing next‑generation battery technologies that aim to accelerate the clean energy transition by delivering sustainable, high‑performance, cost‑effective energy storage solutions. Central to its strategy is proprietary sulfur‑based cathode active material (CAM) technology, which uses nanoconfinement to control sulfur behaviour in lithium‑sulfur and room‑temperature sodium‑sulfur battery architectures Nano-Encapsulated Sulfur (NES™), addressing historical performance limitations and enabling compatibility with standard lithium‑ion and sodium‑ion manufacturing infrastructure. The NES™ material is being developed with the goal of having "drop in" capability in place of alternate cathode materials to support scalable production in existing gigafactories and targets critical benchmarks for energy density and power performance, with applications across electric mobility, e‑aviation, grid and stationary storage. Gelion works with Tier One industrial partners to commercialise its technology and deliver integrated energy storage systems that support global decarbonisation goals.
Glossary
|
Ah |
Ampere hours. A measure of capacity stored in the cell. The larger the number the higher the capacity. |
|
Areal capacity |
The amount of charge stored per unit area of electrode surface (mAh/cm²). |
|
mAh/g(S) |
The unit mAh/g(S) stands for milliampere-hours per gram of Sulfur (with S indicating "Sulfur"). It is a measure quantifying how many electrons (in mAh) can be stored per gram of Sulfur. |
|
CAM |
Cathode active material |
|
Energy density (Wh/kg) |
The ratio of energy stored per unit weight i.e. Watt-hours per kilogram. The higher the number the lighter the battery. |
|
Pouch cell |
An industry standard format of a battery which comprises a flat pouch-shaped design with a multi-layered laminate structure. |
|
Cycle life |
The number of full charge and discharge cycles a battery can complete before its capacity falls below a specified level, typically 80% of the original capacity. Higher cycle life indicates longer-lasting performance. |
Recycling
Gelion is pioneering an innovative battery recycling technology, focusing on lithium extraction and designed to enhance and supplement current recycling methods. Our technology aims to significantly reduce the initial costs of recycling plants, minimize waste, and lower carbon emissions, while improving the purity of metal products and enabling efficient lithium extraction. This advancement will allow for a broader range of scrap materials to be recycled. Currently in the feasibility stage, Gelion is committed to advancing our technology to a pilot-scale demonstration, paving the way for commercialisation through material production and IP licensing.
Integration Solutions
Gelion leverages its significant integration and BMS capability to deliver bespoke BESS for Australian customers. These BESS are currently based on lithium-ion technology and will also include Gelion's next-generation batteries as these become available. Gelion will deploy BESS with our proprietary cloud-based battery monitoring system, which will provide real-time diagnostics and alerts to maximise performance and return on investment for our customers.
Chief Executive Officer's statement
The six months to 31 December 2025 saw Gelion make further significant progress on its mission to establish itself as the global leader in Sulfur-based battery materials, initially as a specialist technology and ultimately establishing Sulfur as a mainstream cathode material alongside Lithium Ferrous Phosphate (LFP) and Nickel Manganese Cobalt (NMC). Achieving this mission will position Gelion at the forefront of the global battery and energy storage industries with potential for significant commercial returns.
Today, the global cathode materials market is valued at around US$44 billion and is projected to reach US$132 billion by 2032[2]. This market is currently dominated by LFP and NMC chemistries, with others such as Lithium Nickel Cobalt Aluminium (NCA), Lithium Cobalt Oxide (LCO), and Lithium Manganese Oxide (LMO) occupying smaller specialist market percentages.
We believe we have now achieved a unique position. Our Sulfur cathode material can be paired:
· directly with Lithium metal anodes to produce high-performance cells,
· when pre-lithiated, can be paired with standard Graphitic anodes and electrolytes used in Lithium-Ion cells and
· when pre-sodiated, can also be paired with standard Sodium Ion anodes and electrolytes to achieve low-cost Room Temperature Sodium Sulfur.
All three cell types have been successfully prototyped.
The next phase focuses on evolving the process technologies to scale our fabrication to expand our supply of materials for testing and qualification by our market collaboration partners (TDK, QinetiQ and others), as we continue to move forward towards commercialisation. The Company will continue to further refine our technology.
Gelion's ambition is clear and focussed - leadership in Sulfur battery technology through alignment with target market and specialist applications and global sales. We are pursuing this through a capital-light model, leveraging our internal expertise in innovation and materials science while building collaborations across the battery supply chain to accelerate progress.
As noted, 2025 has seen us significantly strengthen the foundations to deliver our ambitions. In this period, we deepened collaborations with cell manufacturing partners (TDK and QinetiQ) and technology partners (Max Planck Institute of Colloids and Interfaces). We secured government funding in both the UK and Australia and completed an oversubscribed £10.5 million capital raise to strengthen our balance sheet.
Everything we are doing now is additive, delivering on our technology plan and delivering on our commitments to our key partners (our internal capabilities, skills, and effectiveness have also been enhanced systematically by our leadership team as we progress). In parallel, we are now engaging very actively across multiple applications and geographies as well as upstream battery manufacturers and global engineering partners to support our process development and materials fabrication programs.
In summary, 2025 set the base for 2026 to be a breakthrough year for our Sulfur battery activities based on technical milestones and deeper market engagement with both end-users and Tier 1 suppliers.
While our focus remains on our core Sulfur battery effort "Gelion the Sulfur Battery Company", we also have two other areas of activity: our Integration Solutions and our Battery Minerals recycling businesses.
The Integration Solutions business is developing a growing pipeline of opportunities and establishing market presence through discussions with multiple parties across a number of industries. However, given the long approval cycles characteristic of such projects (customer, network enquiries and regulatory approvals), we are not expecting to recognise any Integration Solutions revenue in FY26 but anticipate that we will enter FY27 with a diversified pipeline.
Battery Minerals (our recycling subsidiary) has made strong progress in refining its commercial business model (attached tightly to its protected IP), generating lab proof of efficacy and preparing to advance to the pilot stage. Its process addresses the key industry challenge of safely managing black mass, a potentially hazardous material when shipped due to its fluorine content and fine particles. By removing fluorine and extracting lithium before shipment, Battery Minerals enables shredders to reduce risk, improve value capture and ship safe metallic residuals to standard smelters. As with our core Sulfur efforts, Battery Minerals is actively pursuing strategic collaborations to accelerate scale-up.
Finally, and most importantly, I want to note the exceptional efforts and capabilities of our team - not just our leadership team, but also the full team across Australia and the UK. They are all an inspiration every day in terms of achievements and their commitment and attitude. I would also note that our Board continues to be very hands on in helping us breakthrough and create long-term shareholder value.
Outlook
Gelion is now recognised as an emerging global innovator in Sulfur battery technology, with the potential to achieve Tier‑1 status and corresponding value recognition through the remainder of FY26 and into FY27. Innovation inherently carries both risk and opportunity, but through focus, collaboration, disciplined execution, and the foundations that we have built, Gelion is steadily mitigating risks and creating lasting opportunities for value creation for all our stakeholders.
John Wood
CEO
2 March 2026
Chief Financial Officer's review
Overview
The first half of FY26 continued the strategic momentum established in FY25, delivering improved financial metrics as we accelerate our transition from technology development to commercial prototyping. Our strengthened balance sheet provides the capacity to advance our sulfur-based battery technologies and Integration Solutions business, strictly adhering to our disciplined, capital-light deployment model.
Statutory losses are generally higher in the first half of the financial year as R&D tax incentive and RDEC are only recognised at year-end. In first half of FY26, the Group has achieved continued improvement in underlying financial performance and meaningful strategic and operational progress.
Financial performance
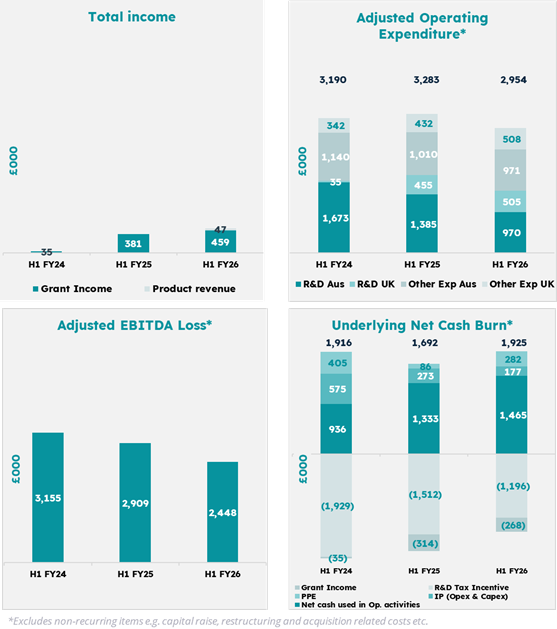
Total income for the six months ended 31 December 2025 was £0.5 million (H1 FY25: £0.4 million), primarily reflecting an increase in grant income (Australia and the UK) and the recognition of the remaining revenue from the first Integration Solutions project.
Adjusted EBITDA loss[3] reduced to £2.4 million (H1 FY25: £2.9 million), representing a 15.8% improvement and demonstrating the benefits of focused investment and cost discipline.
· Administrative expenses of £1.5 million (H1 FY25: £1.4 million) were broadly flat, reflecting the Group's continued careful management of overheads while supporting a growing footprint.
· Research and development expenditure of £1.5 million (H1 FY25: £1.8 million). The decrease reflecting the resource allocation on the highest-priority programs with clear commercial pathways and a strategy of working with partners, particularly within sulfur battery development.
Non‑recurring items of £0.5 million (H1 FY25: £0.2 million), primarily related to:
· the final deferred consideration payment in relation to OXLiD acquisition (now Gelion Europe);
· the November 2025 equity raise and associated advisory and regulatory costs; and
· the non-cash write off of certain patents as part of the Group's ongoing IP portfolio review.
Balance sheet
As at 31 December 2025, total assets were £18.3 million (30 June 2025: £11.4 million), reflecting the impact of the equity raise and continued investment in our technology platform and facilities.
· Non‑current assets of £6.9 million (30 June 2025: £7.0 million) comprised goodwill of £2.8 million, intangible assets of £3.1 million and property, plant and equipment of £1.0 million. These balances represent the value of acquired capabilities and ongoing investment in our R&D infrastructure in both the UK and Australia.
· Current assets increased significantly to £11.4 million (30 June 2025: £4.4 million), driven primarily by cash and cash equivalents of £10.5 million (30 June 2025: £2.7 million). Other receivables were £0.9 million (30 June 2025: £1.7 million)
· Total liabilities remained comparatively flat at £1.3 million (30 June 2025: £1.4 million), with current trade and other payables of £0.9 million (30 June 2025: £1.0 million) and non‑current liabilities of £0.4 million.
Net assets increased to £16.9 million at 31 December 2025 (30 June 2025: £10.0 million), underscoring the strengthened financial position of the Group.
The successful capital raise completed in November 2025, which delivered net proceeds of approximately £9.9 million, has transformed our liquidity profile and provides funding to progress our key programs through their next value inflection points.
Outlook
Gelion enters the second half of FY26 with a strong platform built on the strategic and operational progress achieved in 2025 and early 2026. Our focus remains on disciplined execution by advancing our core sulfur battery technology, expanding commercial partnerships, and underpinning growth with a robust financial foundation.
We will continue to exercise fiscal discipline in managing our resources, maintaining a prudent balance between cost control and targeted investment. At the same time, we recognise the need to invest selectively to capture growth opportunities and support our expanding commercial pipeline. These investments include scaling up cathode active material (CAM) production capabilities to meet partner and customer demand, acquiring advanced analytical and testing equipment to accelerate product qualification, and strengthening internal competencies through technology and process development.
Together, these initiatives position Gelion to deliver sustainable long‑term value while maintaining the financial flexibility required to support our strategic objectives.
Amit Gupta
CFO
2 March 2026
Consolidated Statement of Comprehensive Income
|
|
Notes |
Six months ended 31 Dec 2025 £'000 Unaudited |
Six months ended 31 Dec 2024 £'000 Unaudited |
|
|
Revenue from contracts with customers |
|
47 |
- |
|
|
Other income |
3 |
459 |
381 |
|
|
Total income |
|
506 |
381 |
|
|
Administrative expenses |
4 |
(1,478) |
(1,442) |
|
|
Research and development expenditure |
5 |
(1,476) |
(1,848) |
|
|
Share-based payments expense |
6 |
(182) |
(260) |
|
|
Depreciation and amortisation |
|
(287) |
(303) |
|
|
Operating loss before non-recurring items |
|
(2,917) |
(3,472) |
|
|
Non-recurring items: |
7 |
|
|
|
|
Loss on write-off of IP intangibles and disposal of property, plant and equipment |
|
(266) |
(31) |
|
|
Acquisition related costs |
|
(111) |
(78) |
|
|
Capital raising costs |
|
(86) |
(33) |
|
|
Other non-recurring costs |
|
- |
(27) |
|
|
Total non-recurring items: |
7 |
(463) |
(169) |
|
|
Operating loss |
|
(3,380) |
(3,641) |
|
|
Finance costs |
|
(3) |
- |
|
|
Finance income |
|
60 |
18 |
|
|
Loss on ordinary activities before taxation |
|
(3,323) |
(3,623) |
|
|
Tax income |
|
10 |
10 |
|
|
Loss on ordinary activities after taxation |
|
(3,313) |
(3,613) |
|
|
Total loss for the period attributable to equity holders of the parent |
|
|
|
|
|
Other comprehensive income: |
|
|
|
|
|
Items that may be reclassified to profit or loss |
|
|
|
|
|
- Exchange gains/(losses) arising on translation of foreign operations |
|
163 |
(303) |
|
|
Total comprehensive loss for the period attributable to equity holders of the parent |
|
(3,150) |
(3,916) |
|
|
Loss per share (basic and diluted) attributable to the equity holders (pence) |
8 |
(1.70) |
(2.60) |
|
The above results relate entirely to continuing activities.
The accompanying notes form part of this financial information.
Consolidated Balance Sheet
|
|
Notes |
31 Dec 2025 £'000 Unaudited |
30 June 2025 £'000 Audited |
|
Assets |
|
|
|
|
Non-current assets |
|
|
|
|
Intangible assets |
|
5,909 |
6,104 |
|
Property, plant and equipment |
|
958 |
874 |
|
Current assets |
|
|
|
|
Cash and cash equivalents |
|
10,516 |
2,661 |
|
Other receivables |
9 |
871 |
1,719 |
|
Total Assets |
|
18,254 |
11,358 |
|
|
|
|
|
|
Liabilities |
|
|
|
|
Current liabilities |
|
|
|
|
Trade and other payables |
|
943 |
1,014 |
|
Non-current liabilities |
|
|
|
|
Trade and other payables |
|
74 |
72 |
|
Deferred tax liabilities |
|
291 |
301 |
|
Total liabilities |
|
1,308 |
1,387 |
|
|
|
|
|
|
Net assets |
|
16,946 |
9,971 |
|
|
|
|
|
|
Equity |
|
|
|
|
Issued capital |
10 |
229 |
177 |
|
Share premium account |
10 |
38,306 |
28,415 |
|
Other non-distributable reserves |
10 |
9,240 |
8,895 |
|
Capital reduction reserve |
10 |
11,194 |
11,194 |
|
Accumulated losses |
|
(42,023) |
(38,710) |
|
Total equity |
|
16,946 |
9,971 |
The accompanying notes form part of this financial information.
Consolidated Statement of Cash Flows
|
|
|
Six months ended 31 Dec 2025 £'000 Unaudited |
Six months ended 31 Dec 2024 £'000 Unaudited |
|
Cash flow from operating activities |
|
|
(Restated)* |
|
Loss for the period before tax and exchange losses |
|
(3,323) |
(3,623) |
|
Adjustments for: |
|
|
|
|
- depreciation & amortisation |
|
287 |
303 |
|
- net finance loss / (income) |
|
(57) |
(18) |
|
- impairment of intangible assets |
|
265 |
1 |
|
- loss on disposal of fixed assets |
|
1 |
31 |
|
- share-based payments expense |
|
182 |
260 |
|
- changes in working capital |
|
934 |
1,423 |
|
Net cash used in operating activities |
|
(1,711) |
(1,623) |
|
Cash flows from investing activities |
|
|
|
|
Purchase of intangible assets |
|
(131) |
(158) |
|
Purchase of tangible property, plant and equipment |
|
(281) |
(63) |
|
Sale of property, plant and equipment |
|
1 |
- |
|
Interest received |
|
16 |
17 |
|
Net cash used in investing activities |
|
(395) |
(204) |
|
Cash flows from financing activities |
|
|
|
|
Proceeds from issue of shares |
|
10,500 |
1,710 |
|
Transaction costs in relation to issue of shares |
|
(557) |
(245) |
|
Prepaid equity |
|
- |
155 |
|
Repayment of leasing liabilities |
|
(15) |
(8) |
|
Net cash generated from / (used in) financing activities |
|
9,928 |
1,612 |
|
Net increase / (decrease) in cash held |
|
7,822 |
(215) |
|
Cash and cash equivalents at beginning of reporting period |
|
2,661 |
3,792 |
|
Effect of exchange rate changes |
|
33 |
(120) |
|
Cash and cash equivalents at end of reporting period |
|
10,516 |
3,457 |
The accompanying notes form part of this financial information.
(*) The company has reclassified Other investments - escrow account from Cash flows from investing activities to Cash flow from operating activities for the period of six-months ended 31 December 2024, in line with changes made to the audited financial statements for the year ended 30 June 2025.
Consolidated Statement of Changes in Equity
|
|
Share capital |
Share premium |
Accumulated losses |
Capital reduction reserve |
Other non-distributable reserves |
Total |
|
|
£'000 |
£'000 |
£'000 |
£'000 |
£'000 |
£'000 |
|
Balance at 1 July 2024 (Audited) |
136 |
24,487 |
(32,726) |
11,194 |
8,877 |
11,968 |
|
Total comprehensive loss for the period |
- |
- |
(3,613) |
- |
(303) |
(3,916) |
|
Contributions by and distributions to owners: |
|
|
|
|
|
|
|
Prepaid equity (equity paid in advance) |
- |
- |
- |
- |
155 |
155 |
|
Share-based payment charge |
- |
- |
- |
- |
260 |
260 |
|
Shares issued during the period |
11 |
1,699 |
- |
- |
- |
1,710 |
|
Cost of shares issued |
- |
(245) |
- |
- |
- |
(245) |
|
Balance at 31 Dec 2024 (Unaudited) |
147 |
25,941 |
(36,339) |
11,194 |
8,989 |
9,932 |
|
Balance at 1 Jan 2025 (Unaudited) |
147 |
25,941 |
(36,339) |
11,194 |
8,989 |
9,932 |
|
Total comprehensive loss for the period |
- |
- |
(2,371) |
- |
(253) |
(2,624) |
|
Contributions by and distributions to owners: |
|
|
|
|
|
|
|
Prepaid equity (equity paid in advance) |
- |
- |
- |
- |
(155) |
(155) |
|
Share-based payment charge |
- |
- |
- |
- |
314 |
314 |
|
Shares issued during the period |
30 |
2,680 |
- |
- |
- |
2,710 |
|
Cost of shares issued |
- |
(206) |
- |
- |
- |
(206) |
|
Balance at 30 June 2025 (Audited) |
177 |
28,415 |
(38,710) |
11,194 |
8,895 |
9,971 |
|
Balance at 1 Jul 2025 (Audited) |
177 |
28,415 |
(38,710) |
11,194 |
8,895 |
9,971 |
|
Total comprehensive loss for the period |
- |
- |
(3,313) |
- |
163 |
(3,150) |
|
Contributions by and distributions to owners: |
|
|
|
|
|
|
|
Share-based payment charge |
- |
- |
- |
- |
182 |
182 |
|
Shares issued during the period |
52 |
10,448 |
- |
- |
- |
10,500 |
|
Cost of shares issued |
- |
(557) |
- |
- |
- |
(557) |
|
Balance at 31 Dec 2025 (Unaudited) |
229 |
38,306 |
(42,023) |
11,194 |
9,240 |
16,946 |
Notes to The Consolidated Financial Statements
1. General Information
Gelion Plc ('Gelion' or the 'Company') is a 100% owner of:
· Gelion Technologies Pty Ltd, an Australian subsidiary which is involved in the research and development of sulfur based battery technologies and integration solutions;
· Gelion Europe Ltd (formerly OXLiD Ltd), a UK subsidiary which is involved in the research and development of sulfur based battery technologies;
· Battery Minerals Ltd, a UK subsidiary which is involved in the development of the recycling technology of lithium-ion battery; and
· OXLiD Ltd, a UK non-trading subsidiary.
Gelion is a public limited company, limited by shares, incorporated and domiciled in England and Wales. The Company was incorporated on 26 September 2015. The registered office of the Company is at c/o External Services Limited, 20 Central Avenue, St Andrews Business Park, Norwich, NR7 0HR.
The registered office has changed from Noble Street on 4 February 2026. The registered company number is 09796512.
Gelion Plc was originally incorporated as Gelion UK Ltd. On 12 November 2021, Gelion UK Ltd was re-registered as a public limited company under the Companies Act and its name was changed to Gelion plc.
The Board, Directors and management referred to in this document refers to the Board, Directors and management of Gelion.
2. Accounting Policies
2.1 Basis of preparation
The interim consolidated financial statements for the period 1 July 2025 to 31 December 2025 are unaudited. The financial statements also incorporate the unaudited figures for the interim period 1 July 2024 to 31 December 2024 and the audited figures for the year ended 30 June 2025 (where applicable). These interim consolidated financial statements have been prepared in accordance with IAS 34 Interim Financial Reporting. They do not include all disclosures that would otherwise be required in a complete set of financial statements and should be read in conjunction with the 2025 annual report.
These interim financial statements are presented in Great British Pounds (GBP) unless otherwise stated, which is the Company's presentational currency and the parent company's functional currency. Amounts are rounded to the nearest thousand, unless otherwise stated. The functional currency of the subsidiaries are both Great British Pounds (GBP) and Australian Dollars (AUD). Some numerical figures included in this Interim Report have been subject to rounding adjustments.
2.2 Going Concern
The interim financial statements have been prepared on a going concern basis which assumes that the Group and Company will have sufficient funds available to enable it to continue to trade for the foreseeable future being a period of at least 12 months from the date of approval of these financial statements. In making their assessment that this assumption is correct, the Directors have undertaken an in-depth review of the business, its current prospects, and cash resources as set out below.
The Company is a holding entity and therefore the going concern assessment for the Company was performed as part of the Group's assessment.
As at 31 December 2025, the Group had cash in bank of £10.5 million.
In determining the going concern status of the business, the Directors have reviewed the Group's cash flow
forecast for the period to 28 February 2027 ("the going concern period"), including a reasonable possible
downside sensitivity of a 10% increase in non-controllable operating costs (excluding payroll).
At the end of the going concern period, the Group is forecast to retain a reasonable proportion of the funds raised in the recent capital raise. As a worst-case scenario, if no further cash receipts were received through R&D tax incentives, RDEC refunds, and grant income between the date of approval of these financial statements and 28 February 2027 with no mitigating actions being taken, the Group would still retain a positive cash balance at the end of the going concern period.
After due consideration of the forecast and current cash resources including the capital raise approved on 5 November 2025, the Directors confirm that they are satisfied that the Group and Company will be able to continue to operate and meet its liabilities as they fall due over the going concern period to 28 February 2027. Accordingly, the Board has concluded that the going concern basis of preparation of the Group and Company Financial Statements is appropriate and that there are no material uncertainties that would cast doubt on that basis of preparation.
2.3 Earnings per share
Basic earnings/loss per share
Basic earnings/loss per share is calculated by dividing:
• the profit or loss attributable to owners of Gelion Plc, excluding any costs of servicing equity other than Ordinary Shares; by
• the weighted average number of Ordinary Shares outstanding during the period, adjusted for bonus elements in Ordinary Shares issued during the period.
Diluted earnings/loss per share
Diluted earnings/loss per share adjusts the figures used in the determination of basic earnings/loss per share to take into account:
• the after-income tax effect of interest and other financing costs associated with dilutive potential Ordinary Shares; and
• the weighted average number of shares assumed to have been issued for no consideration in relation to dilutive potential Ordinary Shares.
2.4 Share-based payments
The Group provides benefits to its employees in the form of share-based payments, whereby employees render services in exchange for shares or rights over shares (equity-settled transactions) in the parent entity.
The cost of these equity-settled transactions with employees is measured by reference to the fair value of the equity instruments at the date at which they are granted. The fair value is determined using a Black- Scholes model. This calculation is completed by the parent entity.
The cost of these equity-settled transactions is recognised as an expense, with a corresponding increase in equity, over the period in which the service conditions are fulfilled (the vesting period), ending on the date on which the relevant employees become fully entitled to the award (the vesting date).
At each subsequent reporting date until vesting, the cumulative charge to P&L is the product of:
• the grant date fair value of the award;
• the current best estimate of the number of awards that will vest;
• the expired portion of the vesting period; and
• the removal of any fair value attributable to share options that have contractually lapsed or expired.
The charge to profit and loss for the period is the cumulative amount as calculated above less the amounts already charged in previous periods. There is a corresponding entry to the share-based payment reserve in equity.
If a share-based payment arrangement is modified, the minimum expense recognised over the vesting period is the original fair value. If the modification increases fair value, the additional fair value is recognised over the remaining vesting period.
2.5 Non-Recurring Items
The Group considers certain unusual or infrequent items that either because of their size or their nature, or relevance to the business as are non-recurring and disclose separately to report the underlying performance of the business. For an item to be considered as a separate item, it must initially meet at least one of the following criteria:
• It is a significant item, which may cross more than one accounting period.
• It has been directly incurred as a result of either an acquisition / divestment or funding related or arises from a major business change.
• It is unusual in nature, e.g. outside the normal course of business.
If an item meets at least one of the criteria, the Board, through the Audit and Risk Committee, then exercises judgement as to whether the item should be classified as an allowable adjustment to IFRS performance measures and disclosed separately.
2.6 Foreign currency translation
The functional currency of each company in the Group is that of the primary economic environment in which the entity operates. Monetary assets and liabilities denominated in foreign currencies are translated into GBP at the rates of exchange ruling at the period end. Transactions in foreign currencies are recorded at the rate ruling at the date of the transaction.
All differences are taken to the Statement of Comprehensive Income. On consolidation, the assets and liabilities of the Group entities that have a functional currency different to the presentational currency are translated into GBP at the closing rate at the date of the Statement of Financial Position. Income and expenses for each statement of profit or loss are translated at average exchange rates for the period. Exchange differences are recognised in other comprehensive income and accumulated in a foreign exchange translation reserve.
2.7 Critical accounting judgements and key sources of estimation uncertainty
The key sources of estimation uncertainty and critical judgements disclosed in the annual financial statements for the year ended 30 June 2025 remain unchanged at the interim reporting date, with the exception of the estimate relating to the R&D tax credit.
2.7.1 R&D tax incentives
From 1 July 2011, the Australian Taxation Office has provided a tax incentive, in the form of a refundable tax
offset of 43.5%, for eligible research and development expenditure.
Both Gelion Europe Ltd and Battery Minerals are eligible to claim Research and Development Expenditure Credit (RDEC) under the SMEs program.
The Group does not recognise a receivable for R&D tax incentive or the RDEC at half-year and recognises this at the year-end only based on total eligible expenditure incurred during the year. As such, no R&D tax incentive receivable or RDEC has been recognised for the period ended 31 December 2025.
3. Other income
|
|
Six months ended 31 Dec 2025 Unaudited |
Six months ended 31 Dec 2024 Unaudited |
|
Grant income |
459 |
381 |
|
Total other income |
459 |
381 |
Grant income relates to approved grant funding for Gelion Technologies Pty Limited, Gelion Europe Ltd and Battery Minerals through the Australian Renewable Energy Agency (ARENA), the Advanced Propulsion Centre (APC) and Faraday Battery Challenge (FBC) programs. The grant funding is recognised on an accrual basis and are claimed either on a monthly, quarterly or annual basis with the funds received in the month after the claim submission.
4. Administrative Expenditure
Administrative expenditure includes non R&D personnel and related costs (including salaries, benefits and payroll tax), regulatory and compliance, legal and costs associated with consultancy services.
5. R&D Expenditure
R&D expenditure includes R&D & technical personnel and related costs (including salaries, benefits and payroll tax) and costs associated with product research, design and development.
6. Share-Based Payments
The Directors recognise the role of the Group's staff in contributing to its overall success and the importance of the Group's ability to incentivise and motivate its employees. Therefore, the Directors believe that certain employees should be given the opportunity to participate and take a financial interest in the success of the Company, aligning employee interests with shareholders and Company goals.
A new Share Option Plan was introduced in FY23 to motivate and incentivise key talent to assist the Group in achieving its strategic aims whilst remaining consistent with its tolerance for risk, all set within delegated limits set out at the time of the IPO.
These options are structured as nominal cost options. The options will normally vest in three equal tranches over three years, subject to continued employment.
Share-based payment expenses are calculated using the graded vesting method, whereby a larger portion of the total expense is recognised in earlier vesting periods and decreases in the subsequent years. This expense pattern aligns with the economics of these awards, as employees render a greater proportion of the services required to earn the awards during the initial vesting periods.
Issued during the six months period to 31 December 2025
• On 31 August 2025, 727,265 options were granted that will vest in three equal tranches, the first anniversary is 31 August 2026, followed by annual vesting on 31 August 2027 and 31 August 2028. The options were granted with the exercise price of 0.1 pence and will be exercisable up to the tenth anniversary of the grant.
• On 1 December 2025, 1,494,887 options were granted that will vest in three equal tranches, the first anniversary is 31 August 2026, followed by annual vesting on 31 August 2027 and 31 August 2028. The options were granted with the exercise price of 0.1 pence and will be exercisable up to the tenth anniversary of the grant.
Issued during the six months period to 30 June 2025
• On the 6 January 2025, 300,000 options were granted under an Unapproved share option scheme to Director Dr Graham Cooley that will vest in three equal tranches, the first anniversary being 6 January 2026, followed by annual vesting on 6 January 2027 and 6 January 2028, subject to continuing to be a Director of the Group. The options were granted with the exercise price of 0.1 pence and will be exercisable up to the tenth anniversary of the grant.
• On the 15 March 2025, 1,500,000 options were granted under an Unapproved share option scheme to advisor Prof. Markus Antonietti that will vest in three equal tranches, the first anniversary being 15 March 2026, followed by annual vesting on 15 March 2027 and 15 March 2028, subject to continuing as an advisor to Gelion PLC. The options were granted with the exercise price of 0.1 pence and will be exercisable up to the fifth anniversary of the grant.
• On 25 March 2025, 706,899 options were granted that will vest in three equal tranches, the first anniversary being 31 August 2025, followed by annual vesting on 31 August 2026 and 31 August 2027. The options were granted with the exercise price of 0.1 pence and will be exercisable up to the tenth anniversary of the grant.
• On 30 April 2025, 1,113,737 options were granted that will vest in three equal tranches, the first anniversary being 31 August 2025, followed by annual vesting on 31 August 2026 and 31 August 2027. The options were granted with the exercise price of 0.1 pence and will be exercisable up to the tenth anniversary of the grant.
Issued during the six months period to 31 December 2024
• No options were issued during this period.
|
|
Six months ended 31 Dec 2025 Unaudited |
Six months ended 31 Dec 2024 Unaudited |
|
|
Share-based payment expense recognised |
182 |
260 |
|
|
Total share-based payment expense |
182 |
260 |
|
Summary of movements in awards:
|
|
New Share Option Plan '000s |
2021 and prior Original Share Option Plan Number '000s |
Unapproved Share Option Plan Number '000s |
Weighted average exercise price £ |
|
Outstanding at 1 July 2024 (Audited) |
5,556 |
5,583 |
- |
0.16 |
|
Granted |
- |
- |
- |
- |
|
Forfeited |
- |
- |
- |
- |
|
Exercised |
- |
- |
- |
- |
|
Outstanding at 31 December 2024 (Unaudited) |
5,556 |
5,583 |
- |
0.16 |
|
Exercisable at 31 December 2024 (Unaudited) |
2,788 |
5,583 |
- |
0.21 |
|
Granted |
1,821 |
- |
1,800 |
0.00 |
|
Forfeited |
(263) |
- |
- |
0.00 |
|
Exercised |
(29) |
- |
- |
0.00 |
|
Outstanding at 30 June 2025 (Audited) |
7,085 |
5,583 |
1,800 |
0.12 |
|
Exercisable at 30 June 2025 (Audited) |
3,909 |
5,583 |
- |
0.19 |
|
Granted |
2,222 |
- |
- |
0.00 |
|
Forfeited |
- |
- |
- |
- |
|
Exercised |
(70) |
- |
- |
0.00 |
|
Outstanding at 31 December 2025 (Unaudited) |
9,237 |
5,583 |
1,800 |
0.11 |
|
Exercisable at 31 December 2025 (Unaudited) |
5,452 |
5,583 |
- |
0.16 |
The range of exercise prices for options outstanding at 31 December 2025 was £0.001 to £1.45 (2024: £0.001 to £1.45).
The weighted average remaining contractual life for the share options outstanding as at 31 December 2025 was 5.41 years (2024: 5.05 years).
Of the total number of options outstanding at 31 December 2025, 11,035,318 (31 December 2024: 8,371,128) had vested and were exercisable.
7. Non-Recurring Items
|
|
Six months ended 31 Dec 2025 Unaudited |
Six months ended 31 Dec 2024 Unaudited |
|
Loss on write-off of IP intangibles |
265 |
- |
|
Loss on disposal of property, plant and equipment |
1 |
31 |
|
Acquisition related costs |
111 |
78 |
|
Capital raising costs |
86 |
33 |
|
ARENA grant application costs |
- |
20 |
|
Agent fees relating to new premises |
- |
7 |
|
Total non-recurring items |
463 |
169 |
Non-recurring costs in the 6 month period to 31 December 25 include one-off capital raise related expenses as well as deferred consideration relating to the acquisition of Gelion Europe Ltd (formerly OXLiD Ltd). These have been separately disclosed to assist the user of the financial information to understand and compare the underlying results of the Company.
8. Loss Per Share
|
|
Six months ended 31 Dec 2025 Unaudited |
Six months ended 31 Dec 2024 Unaudited |
|
Loss after tax |
£3,313,507 |
£3,612,868 |
|
Weighted average number of shares (number) |
192,922,306 |
136,446,587 |
|
Loss per share (pence) |
1.7p |
2.6p |
The calculation of the loss per share is based on the loss for the financial period after taxation of £3,313,000 (2024: £3,613,000) and on the weighted average of 192,922,306 (2024: 136,446,587) Ordinary Shares in issue during the period.
During the 6 month period to 31 December 2025, the parent company issued 52,500,000 shares as part of the capital raise in November 2025. On 18 December 2025, 69,673 shares were issued as a result of options exercised.
There were 16,620,562 share options outstanding as of 31 December 2025 (30 June 2025: 14,468,083). The impact of these options would be to reduce the diluted loss per share and therefore they are antidilutive. Hence, the diluted loss per share reported for the periods under review is the same as the earnings per share.
9. Other receivables
|
|
As at 31 Dec 2025 Unaudited |
As at 30 June 2025 Audited |
|
R&D tax incentive / RDEC |
97 |
1,256 |
|
Grant income |
382 |
57 |
|
Prepayments |
236 |
119 |
|
VAT / GST receivable |
59 |
145 |
|
Other debtors |
97 |
142 |
|
Total other receivables |
871 |
1,719 |
R&D tax incentives are granted by the Australian Taxation Office and the HMRC in the form of tax offsets. The key judgements applied in the recognition of this receivable are detailed in note 2.7. The RDEC receivable at 31 December 25 relates to HMRC R&D tax offset for eligible expenditure for the period ending 30 June 25. Grant income relates to receivables in Gelion Technologies Pty Limited for grant funding from ARENA and Gelion Europe Ltd for grant funding in the UK, obtained through the Faraday Battery Challenge (FBC) and the Advanced Propulsion Centre (APC).
The Directors consider that the carrying value of other receivables approximates to their fair value.
10. Issued Capital and Reserves
Share capital and premium
|
|
|
Number of shares |
Share capital |
Share premium |
|
|
Ref. |
|
£'000 |
£'000 |
|
Balance as at 1 July 2024 (Audited) |
|
136,010,603 |
136 |
24,487 |
|
Shares issued during the period |
a |
11,397,837 |
11 |
1,699 |
|
Cost of shares issued |
b |
- |
- |
(245) |
|
Balance as at 31 Dec 2024 (Unaudited) |
|
147,408,440 |
147 |
25,941 |
|
Shares issued during the period |
c |
29,414,427 |
30 |
2,680 |
|
Cost of shares issued |
d |
- |
- |
(206) |
|
Exercise of share options |
|
28,916 |
- |
- |
|
Balance as at 30 June 2025 (Audited) |
|
176,851,783 |
177 |
28,415 |
|
Shares issued during the period |
e |
52,500,000 |
52 |
10,448 |
|
Cost of shares issued |
f |
- |
- |
(557) |
|
Exercise of share options |
|
69,673 |
|
|
|
Balance as at 31 Dec 2025 (Unaudited) |
|
229,421,456 |
229 |
38,306 |
a) On 24 December 2024, 11,397,837 new ordinary shares of £0.001 have been issued at a price of 15 pence per share.
Transaction costs incurred in the issuing of shares in the period ended 31 December 2024 of £278,000 of which £245,000 was offset against share premium and £33,000 was expensed.
b) On 3 January 2025, 1,033,334 new ordinary shares of £0.001 have been issued at a price of 15 pence per share.
c) On 6 May 2025, 28,381,093 new ordinary shares of £0.001 have been issued at a price of 9 pence per share.
Transaction costs incurred in the issuing of shares in the period ended 30 June 2025 of £263,000
of which £206,000 was offset against share premium and £57,000 was expensed.
d) On 5 November 2025, 52,500,000 new ordinary shares of £0.001 have been issued at a price of 20 pence per share.
Transaction costs incurred in the issuing of shares in the period ended 31 December 2025 of
£643,000 of which £557,000 was offset against share premium and £86,000 was expensed.
Nature and purpose of other reserves
Other reserves
- Share-based payments reserve
The share-based payments reserve is used to recognise the value of equity-settled share-based payments provided to employees, including key management personnel, as part of their remuneration. Refer to note 6 for further details of these plans.
- Foreign currency translation reserve
The subsidiary's functional currency is AUD and therefore on consolidation a foreign exchange gain or loss on translation of net assets is recognised through other comprehensive income at each reporting date. These gains or losses are accumulated in a foreign currency translation reserve.
- Capital reduction reserve
Immediately following the Second Bonus Issue in 2021, the balance standing to the credit of the share premium account was cancelled and the amount so cancelled was credited to a distributable reserve called the 'capital reduction reserve'.
- Merger relief reserve
On 29th November 2023, The Company completed the acquisition of 100% of ordinary shares of Gelion Europe Ltd. The transaction consideration involved a combination of cash and issuance of 10,508,582 ordinary shares in Gelion. The investment was recognised at fair value, and the excess of the fair value over the nominal value of the issued share capital is recorded within equity as a merger relief reserve.
- Prepaid equity reserve
The prepaid equity reserve is used to recognise capital paid in advance of shares issued. The Directors participated in the December 2024 capital raise and £155,000 was received by the parent as capital paid in advance of shares issued prior to 31 December 2024. The shares were issued on 8 January 2025 and this contribution has therefore been recognised as prepaid equity reserve.
Other non-distributable reserves:
|
|
Share-based payment reserve |
Foreign currency translation reserve |
Merger relief reserve |
Prepaid Equity |
Total other reserves |
|
|
|
£'000 |
£'000 |
£'000 |
£'000 |
£'000 |
|
|
|
|
|
|
|
|
|
|
Balance at 1 July 2024 (Audited) |
6,497 |
(210) |
2,590 |
- |
8,877 |
|
|
Foreign currency translation reserve movement |
- |
(303) |
- |
- |
(303) |
|
|
Share-based payment charge |
260 |
- |
- |
- |
260 |
|
|
Equity paid in advance of share issue |
- |
- |
- |
155 |
155 |
|
|
Balance at 31 December 2024 (Unaudited) |
6,757 |
(513) |
2,590 |
155 |
8,989 |
|
|
Foreign currency translation reserve movement |
- |
(253) |
- |
- |
(253) |
|
|
Share-based payment charge |
314 |
- |
- |
- |
314 |
|
|
Equity paid in advance of share issue |
- |
- |
- |
(155) |
(155) |
|
|
Balance at 30 June 2025 (Audited) |
7,071 |
(766) |
2,590 |
- |
8,895 |
|
|
|
|
|
|
|
|
|
|
Foreign currency translation reserve movement |
- |
163 |
- |
- |
163 |
|
|
Share-based payment charge |
182 |
- |
- |
- |
182 |
|
|
Balance at 31 December 2025 (Unaudited) |
7,253 |
(603) |
2,590 |
- |
9,240 |
|
11. Events subsequent to period end
The directors are not aware of any events subsequent to the reporting period that require adjustment or disclosure in the financial statements.
12. Alternative Performance Measure (APM)
The Group uses the following non-IFRS performance measure to provide additional insight into financial performance. This measure supplements, but does not replace, IFRS reporting and may not be directly comparable to similar measures used by other companies.
Alternative Performance Measures (APMs) should be viewed as supplementary information only and not in isolation.
When determining whether an item qualifies as an allowable adjustment to IFRS measures, the Group considers items that are significant either due to their size or nature, and that are non-recurring. To qualify as an allowable adjustment, an item must meet at least one of the following criteria:
· It is a significant item, which may span more than one accounting period.
· It is directly incurred as a result of an acquisition, divestment, or arises from a major business change.
· It is unusual in nature, occurring outside the normal course of business.
If an item meets any of these criteria, the Board, through the Audit and Risk Committee, exercises judgment on whether it should be classified as an allowable adjustment to IFRS performance measures.
Allowable Adjustments
The following have been defined as allowable adjustments:
a) Acquisition-related costs - Costs directly incurred in relation to acquisitions.
b) Capital raise and ARENA grant application costs - Costs associated with capital raising and ARENA grant applications.
c) Other non-recurring costs - Includes losses on disposal of fixed assets, write-offs of IP intangibles, and agent fees related to new premises.
d) Share-based payments expense - non-cash expenses relating to employee incentive schemes.
Purpose and Use
This measure provides a consistent view of underlying results derived from core business activities. It is widely used by securities analysts, investors, and other stakeholders to evaluate financial performance and compare performance across periods.
Management closely monitors this measure to assess the Group's operating performance, support financial and strategic decision-making, and better understand underlying trends on a comparable, period-on-period basis.
Measure
1. Adjusted EBITDA loss is calculated by excluding certain costs (as detailed in the table) from Operating loss:
Reconciliation:
Operating loss to Adjusted EBITDA loss
|
|
Six months ended 31 Dec 2025 £'000 Unaudited |
Six months ended 31 Dec 2024 £'000 Unaudited |
|
Operating loss (as reported) |
(3,380) |
(3,641) |
|
Adjustments |
|
|
|
Loss on disposal of fixed assets and write-off of IP intangibles |
266 |
31 |
|
Depreciation and amortisation |
287 |
303 |
|
Share-based payments expense |
182 |
260 |
|
Acquisition related costs |
111 |
78 |
|
Capital raising costs |
86 |
33 |
|
Other non-recurring costs |
- |
27 |
|
Adjusted EBITDA loss |
(2,448) |
(2,909) |
2. Adjusted loss after taxation is calculated by excluding non-recurring expenses from reported loss from ordinary activities after taxation.
Reconciliation:
|
|
Six months ended 31 Dec 2025 £'000 Unaudited |
Six months ended 31 Dec 2024 £'000 Unaudited |
|
Loss on ordinary activities after taxation |
(3,313) |
(3,613) |
|
Adjustments |
|
|
|
Loss on disposal of fixed assets and write-off of IP intangibles |
266 |
31 |
|
Acquisition related costs |
111 |
78 |
|
Capital raising costs |
86 |
33 |
|
Other non-recurring costs |
- |
27 |
|
Adjusted loss after taxation |
(2,850) |
(3,444) |
[1] Adjusted EBITDA loss is a non-statutory measure and a reconciliation to Operating loss has been disclosed in note 12.
[2] https://www.fortunebusinessinsights.com/industry-reports/cathode-materials-market-101078
[3] Adjusted EBITDA loss is a non-statutory measure and a reconciliation to Operating loss has been disclosed in note 12.
RNS may use your IP address to confirm compliance with the terms and conditions, to analyse how you engage with the information contained in this communication, and to share such analysis on an anonymised basis with others as part of our commercial services. For further information about how RNS and the London Stock Exchange use the personal data you provide us, please see our Privacy Policy.

Latest directors dealings
- 7 minutes ago Zigup
- 2 hours ago Vanquis Banking Group 20
- 2 hours ago Worldwide Healthcare Trust
- 2 hours ago Scottish Mortgage Inv Trust
- 2 hours ago Scottish Mortgage Inv Trust